item no. 5: annual presentation by mfs institutional ...retirement.ladwp.com/agendaitems/20151014...
TRANSCRIPT

Item No. 5: Annual Presentation by MFS Institutional Advisors - International Developed Value Equity Manager (October 14, 2015, Regular Retirement Board Meeting)
INVESTMENT MANAGER SUMMARY
Firm Name Manager Tenure with Fund
Investment Strategy/Vehicle Contract ration
As of 08/31/2015
MFS Institutional Advisors 3 Years
International Developed Value Equity
06/30/2018
RP- $515.1 Million HP- $86.1 Million
Schedule 45 basis points on the first $100 million 40 basis points on the next $100 million 30 basis points on the balance
Current Blended Fee 0.3416%
~ ~i~~~t<A'~:~',> 1- : .. iMr, ,;~::;:!·, ', ,~~,6 ~ •' '' R • '~ ~ -~~'~~---~-
5

31540.2.exp15Sep16FOR INSTITUTIONAL USE ONLYMFS Institutional Advisors, Inc.
MFS® INTERNATIONAL VALUE EQUITY
Presented to
Los Angeles Department of Water and Power 14 October 2015

299-I-CT-IV-14Oct15.02MFS® International Value Equity
Presenters
Camille Humphries Lee, CFA - Investment Officer- Institutional Equity Portfolio Manager- As an Institutional Portfolio Manager, participates in the research process and strategy discussions.
Assesses portfolio risk, customizes portfolios to client objectives and guidelines, and manages daily cashflows. Communicates investment policy, strategy, and positioning.
- Joined MFS in 2000.- Previous experience includes 3 years as Research Analyst at SG Cowen Securities Corporation; 8 years as
Research Analyst and Associate Analyst at Alex Brown.- Affiliations include Boston Security Analysts Society, Inc., CFA Institute- University of Virginia, MBA- University of Virginia, BA
Carolyn Lucey, CIMA - Director, Relationship Management- As a Relationship Manager, responsible for the overall client experience including communicating
portfolio positioning, strategy, and performance attribution and ensuring that our clients' ongoing serviceneeds are met.
- Joined MFS in 1998; previous positions include Investment Director for Private Portfolio Services; VicePresident, Director of Product Management; Assistant Vice President, Domestic Equity Product Manager.
- Previous experience includes 1 year as Product Manager at Van Kampen American Capital; 6 years asProduct Manager at John Hancock Funds; 2 years as Associate at Putnam Investments.
- Affiliations include Investment Management Consultants Association (IMCA)- Manhattanville College, BA

299-I-CT-IV-14Oct15.03MFS® International Value Equity
Table of contents
Contents Tab
Section A: Company overview 1
Section B: Investment process and discipline 2
Section C: Market overview 3
Section D: Performance review 4
Section E: Portfolio review and characteristics 5
Section F: Fee schedule 6
Section G: Glossary of investment terms 7

COMPANY OVERVIEW

299-I-CT-IV-14Oct15.1MFS® International Value Equity
MFS corporate update
Effective 31 December 2014, Barnaby Wiener relinquished his manager responsibilities on the MFS International Value Equity strategy. Barnaby will continue as a valued member of MFS' equity management committee and will continue to serve as a resource to all MFS investment teams. The strategy continues to be managed by Pablo de la Mata, who joined the Portfolio Management team on 30 September 2014 after serving as research analyst with nine years of industry experience, and Benjamin Stone. Ben has been a manager on the strategy since 2009.
1
Personnel updates:On April 9, 2015, MFS announced that Tim Fagan, Chief Compliance Officer at MFS, had chosen to resign effective May 31, 2015. Tim made the decision to leave MFS to pursue a career in writing. On July 13, 2015, Martin Wolin joined MFS as Chief Compliance Officer. Martin joins MFS from Mercer where he served as Chief Risk and Compliance Officer, Americas from 2006 to 2015.

2299-I-CT-IV-14Oct15.2MFS® International Value Equity
MFS® overview
We apply a uniquely collaborative approach to build better insights for our clients
Integrated ResearchWe look at investment opportunities across the globe byintegrating fundamental equity, quantitative and creditdisciplines in our analysis.
Global CollaborationOur team philosophy and incentive structure ensure strong collaboration across the firm.
Active Risk ManagementWe take a holistic approach to actively managing risk withreviews in place at security, portfolio and firm levels and aclear focus on generating alpha for our clients.
3299-I-CT-IV-14Oct15.3MFS® International Value Equity
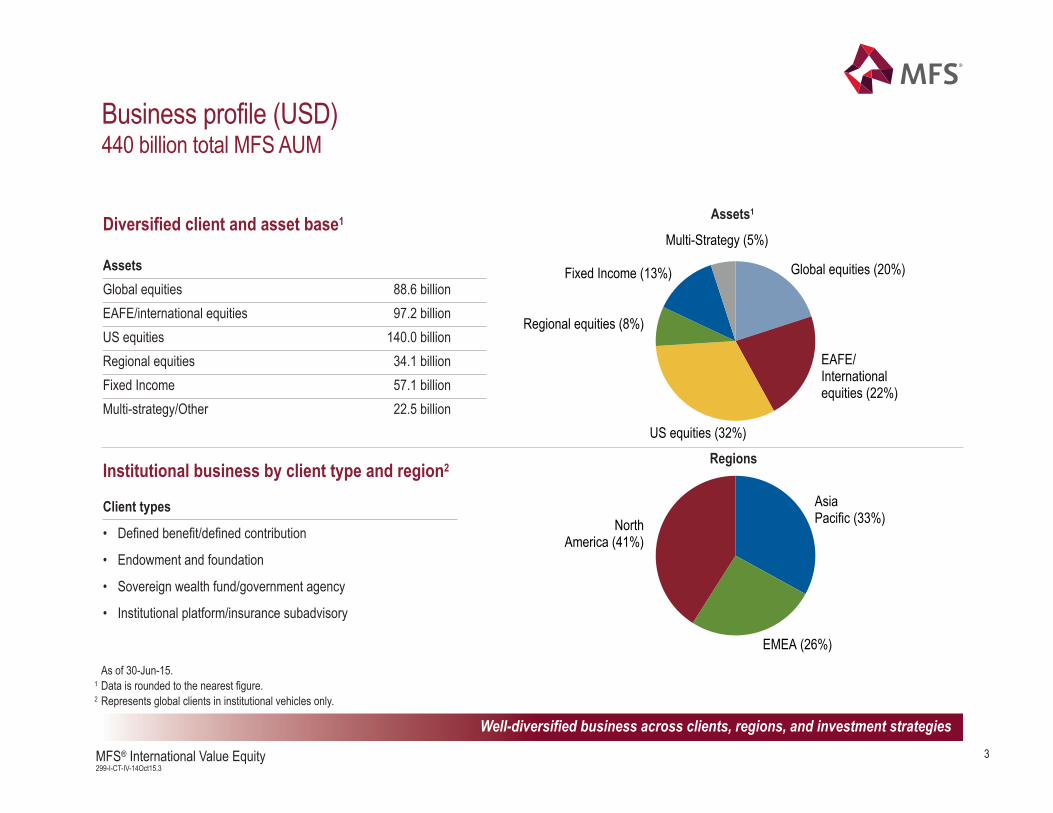
Business profile (USD)440 billion total MFS AUM
Global equities (20%)
EAFE/International equities (22%)
US equities (32%)
Regional equities (8%)
Fixed Income (13%)
Multi-Strategy (5%)
Asia Pacific (33%)
EMEA (26%)
North America (41%)
RegionsInstitutional business by client type and region2
Client types
• Defined benefit/defined contribution
• Endowment and foundation
• Sovereign wealth fund/government agency
• Institutional platform/insurance subadvisory
Well-diversified business across clients, regions, and investment strategies
Diversified client and asset base1
AssetsGlobal equities 88.6 billionEAFE/international equities 97.2 billionUS equities 140.0 billionRegional equities 34.1 billionFixed Income 57.1 billionMulti-strategy/Other 22.5 billion
Assets1
As of 30-Jun-15.1 Data is rounded to the nearest figure. 2 Represents global clients in institutional vehicles only.

MFS investment professionals
Our experienced investment team and collaborative culture distinguish our approach to investing
As of 30-Jun-15.Years = average years industry experience.
1 Member of Investment Management Committee.
44 equity portfolio managers
21 years
President, Co-Chief Executive Officer and Chief Investment Officer – Michael Roberge1
Vice Chairman – David Antonelli1
27 fixed income analysts 17 years
61 equity analysts 12 years
11 quantitative analysts 13 years
21 fixed income portfolio managers
25 years
8 quantitative portfolio managers
21 years
Portfolio management(73)
Research team(99)
Trading(30)
Gregory Heller1, Director of Global Fixed Income Trading Jeff Estella1, Brenda Farley, Directors of Global Equity Trading14 equity traders – 18 years
16 fixed income traders – 18 years
Chairman and Co-Chief Executive OfficerRobert Manning1
6 fixed income associates 3 years
16 equity associates 4 years
14 quantitative associates 10 years
Research/investmentassociates
(36)
TOTAL238
4299-I-CT-IV-14Oct15.4MFS® International Value Equity
5299-I-CT-IV-14Oct15.5MFS® International Value Equity
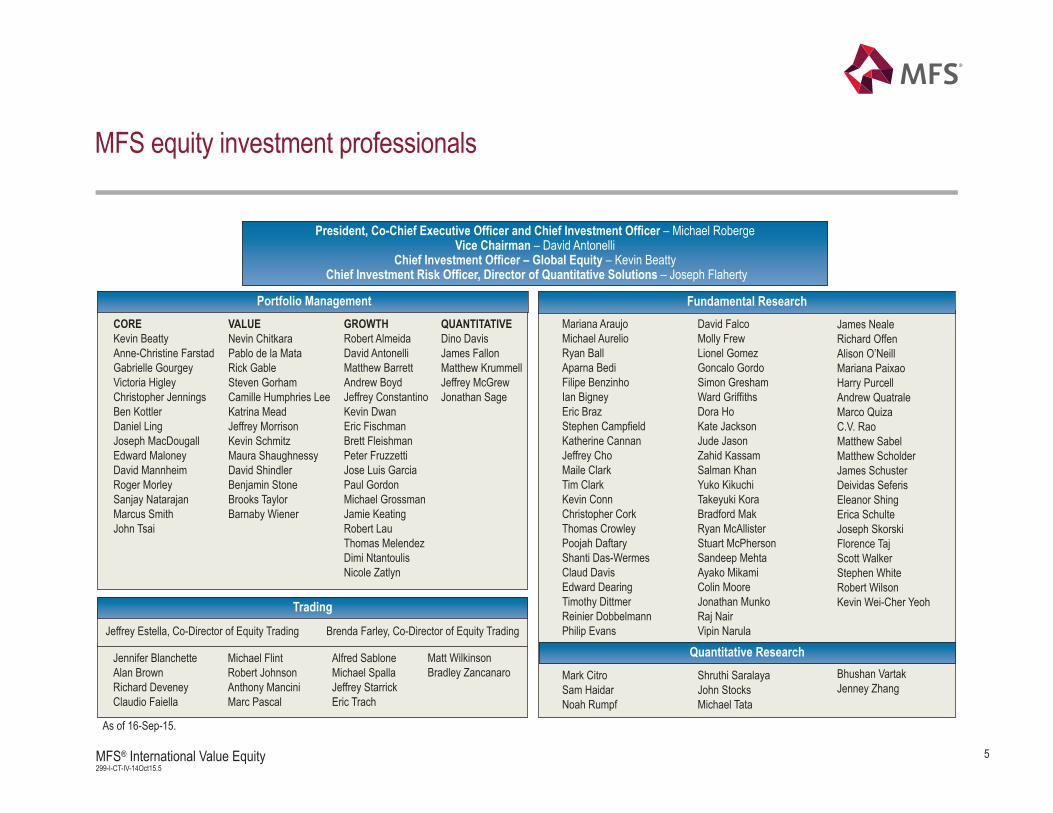
MFS equity investment professionals
As of 16-Sep-15.
Michael FlintRobert JohnsonAnthony ManciniMarc Pascal
Alfred SabloneMichael SpallaJeffrey StarrickEric Trach
Jennifer BlanchetteAlan BrownRichard DeveneyClaudio Faiella
President, Co-Chief Executive Officer and Chief Investment Officer – Michael RobergeVice Chairman – David Antonelli
Chief Investment Officer – Global Equity – Kevin BeattyChief Investment Risk Officer, Director of Quantitative Solutions – Joseph Flaherty
Jeffrey Estella, Co-Director of Equity Trading Brenda Farley, Co-Director of Equity Trading
Fundamental ResearchDavid FalcoMolly FrewLionel GomezGoncalo Gordo Simon GreshamWard Griffiths Dora HoKate JacksonJude JasonZahid KassamSalman KhanYuko KikuchiTakeyuki KoraBradford Mak Ryan McAllister Stuart McPherson Sandeep MehtaAyako Mikami Colin MooreJonathan MunkoRaj NairVipin Narula
Mariana AraujoMichael AurelioRyan BallAparna BediFilipe BenzinhoIan BigneyEric Braz Stephen CampfieldKatherine CannanJeffrey ChoMaile ClarkTim ClarkKevin ConnChristopher CorkThomas Crowley Poojah DaftaryShanti Das-WermesClaud DavisEdward DearingTimothy Dittmer Reinier DobbelmannPhilip Evans
James NealeRichard OffenAlison O’NeillMariana PaixaoHarry PurcellAndrew QuatraleMarco QuizaC.V. RaoMatthew SabelMatthew ScholderJames SchusterDeividas SeferisEleanor ShingErica SchulteJoseph Skorski Florence TajScott WalkerStephen WhiteRobert WilsonKevin Wei-Cher Yeoh
Quantitative ResearchShruthi SaralayaJohn StocksMichael Tata
Mark CitroSam HaidarNoah Rumpf
QUANTITATIVE Dino DavisJames FallonMatthew KrummellJeffrey McGrewJonathan Sage
Portfolio Management
Trading
VALUENevin ChitkaraPablo de la MataRick GableSteven Gorham Camille Humphries LeeKatrina MeadJeffrey MorrisonKevin SchmitzMaura ShaughnessyDavid ShindlerBenjamin StoneBrooks TaylorBarnaby Wiener
COREKevin BeattyAnne-Christine FarstadGabrielle GourgeyVictoria HigleyChristopher JenningsBen KottlerDaniel LingJoseph MacDougallEdward MaloneyDavid MannheimRoger MorleySanjay NatarajanMarcus Smith John Tsai
GROWTHRobert AlmeidaDavid AntonelliMatthew BarrettAndrew BoydJeffrey ConstantinoKevin DwanEric FischmanBrett FleishmanPeter FruzzettiJose Luis GarciaPaul GordonMichael GrossmanJamie KeatingRobert LauThomas MelendezDimi NtantoulisNicole Zatlyn
Bhushan VartakJenney Zhang
Matt WilkinsonBradley Zancanaro

Benjamin Stone, IIMRPortfolio Manager
19 years industry experience
Camille Lee, CFAInstitutional Portfolio Manager
25 years industry experience
Pablo de la Mata, CFA1
Portfolio Manager11 years industry experience
Experienced MFS International Value Equity team
Experienced management, tested by markets, backed by depth
Ann Marie CostelloInvestment Product Specialist
27 years industry experience
Nevin ChitkaraPortfolio Manager
22 years industry experience
Steven Gorham, CFAPortfolio Manager
25 years industry experience
Katrina Mead, CFAInstitutional Portfolio Manager
20 years industry experience
Additional resources
1 Effective 30-Sep-14, Pablo de la Mata joined the portfolio management team of the MFS International Value Equity strategy.2 Effective 31-Dec-14, Barnaby Wiener relinquished his manager responsibilities on the MFS International Value Equity strategy.
Barnaby Wiener2
Portfolio Manager21 years industry experience
Nicholas J. Paul, CFAInvestment Product Specialist
16 years industry experience
6299-I-CT-IV-14Oct15.6MFS® International Value Equity

MFS International Value Equity team
6JUL15
Benjamin Stone, IIMR - Investment Officer- Equity Portfolio Manager- As an Equity Portfolio Manager, responsible for buy and sell decisions, portfolio construction, risk control
and cash management. Participates in the research process and strategy discussions.- Joined MFS in 2005; previous positions include Equity Research Analyst.- Previous experience includes 9 years as Research Analyst at Schroders Investment Management.- Affiliations include Institute of Investment Management and Research- Durham University, BA, 2:1
Pablo de la Mata, CFA - Investment Officer- Equity Portfolio Manager, Equity Research Analyst- As a Non-U.S. Equity Portfolio Manager, responsible for final buy and sell decisions, portfolio construction,
risk and cash management. Participates in the research process and strategy discussions.- Joined MFS in 2008.- Previous experience includes 1 year as Equity Research Analyst at Magnetar Capital; 3 years as Equity
Research Analyst at Blackrock/Merrill Lynch Investment Managers; 1 year as Wholesale Support at MerrillLynch Investment Managers.
- Affiliations include CFA Institute- Colegio Universitario de Estudios Financieros (CUNEF), BS
7299-I-CT-IV-14Oct15.7MFS® International Value Equity

8299-I-CT-IV-14Oct15.8MFS® International Value Equity
MFS International Value Equity team (continued)
Camille Humphries Lee, CFA - Investment Officer- Institutional Equity Portfolio Manager- As an Institutional Portfolio Manager, participates in the research process and strategy discussions.
Assesses portfolio risk, customizes portfolios to client objectives and guidelines, and manages daily cashflows. Communicates investment policy, strategy, and positioning.
- Joined MFS in 2000.- Previous experience includes 3 years as Research Analyst at SG Cowen Securities Corporation; 8 years as
Research Analyst and Associate Analyst at Alex Brown.- Affiliations include Boston Security Analysts Society, Inc., CFA Institute- University of Virginia, MBA- University of Virginia, BA

9299-I-CT-IV-14Oct15.9MFS® International Value Equity
MFS International Value Equity team additional resources
Nevin P. Chitkara - Investment Officer- Equity Portfolio Manager- As a Value Equity Portfolio Manager, responsible for final buy and sell decisions, portfolio construction, risk
and cash management. Participates in the research process and strategy discussions.- Joined MFS in 1997; previous positions include Equity Research Analyst.- Previous experience includes 5 years as Analyst, Acquisition Associate and Manager at General
Electric Company.- Massachusetts Institute of Technology, MBA- Boston University, BS, magna cum laude
Steven R. Gorham, CFA - Investment Officer- Equity Portfolio Manager- Serves on Global Equity Management Team- As a Value Equity Portfolio Manager, responsible for final buy and sell decisions, portfolio construction, risk
and cash management. Participates in the research process and strategy discussions.- Joined MFS in 1989; previous positions include Equity Research Analyst; Marketing Representative;
Teleservices Representative.- Affiliations include Boston Security Analysts Society, Inc., CFA Institute- Boston College, MBA- University of New Hampshire, BS

10299-I-CT-IV-14Oct15.10MFS® International Value Equity
- Investment Officer- Equity Portfolio Manager- Serves on Global Equity Management Team- As a Value Equity Portfolio Manager, responsible for final buy and sell decisions, portfolio construction, risk
and cash management. Participates in the research process and strategy discussions.- Joined MFS in 1998; previous positions include Equity Research Analyst.- Previous experience includes 2 years as Vice President & Equity Analyst at Merrill Lynch; 2 years as Equity
Research Analyst at Credit Lyonnais.- Served five years in the British Army reaching the rank of Captain- Royal Military College, Sandhurst , Graduate Course- Oxford University, MA, upper 2nd class history degree
MFS International Value Equity team additional resources (continued)
Barnaby Wiener1
1 Effective 31-Dec-14 Barnaby Wiener relinquished his manager responsibilities on the MFS International Value Equity Strategy.
Katrina Mead, CFA - Investment Officer- Institutional Equity Portfolio Manager- As an Institutional Portfolio Manager, participates in the research process and strategy discussions.
Assesses portfolio risk, customizes portfolios to client objectives and guidelines, and manages daily cashflows. Communicates investment policy, strategy, and positioning.
- Joined MFS in 1997; previous positions include Equity Research Analyst.- Previous experience includes 2 years as Financial Analyst - Real Estate Advisory Services at Coopers &
Lybrand, Financial Advisory Services.- Affiliations include Boston Security Analysts Society, Inc., CFA Institute- University of Pennsylvania, MBA- Villanova University, BS, magna cum laude

11299-I-CT-IV-14Oct15.11MFS® International Value Equity
MFS International Value Equity team additional resources (continued)
Ann Marie Costello - Managing Director, Investment Product Specialist- As an Investment Product Specialist, communicates investment policy, strategy and tactics, performs
portfolio analysis and leads product development.- Joined MFS in 2001.- Previous experience includes 13 years as Senior Product Manager, Investment Specialist, Senior Statistical
Analyst - Performance and Analytics, and Supervisor - Institutional Accounting at Putnam Investments.- Suffolk University, MBA- University of Massachusetts, BS
Nicholas J. Paul, CFA - Director, Investment Product Specialist- As an Investment Product Specialist, communicates investment policy, strategy and tactics, performs
portfolio analysis and leads product development.- Joined MFS in 2010.- Previous experience includes 9 years as an Investment Product Manager and Consultant at
Putnam Investments.- Affiliations include Boston Security Analysts Society, Inc., CFA Institute- Boston College, MBA, honors, Beta Gamma Sigma- West Virginia University, BA

12299-I-CT-IV-14Oct15.12MFS® International Value Equity
Commitment to world class client service results in enduring relationships
Representative MFS institutional client list1Serving over 800 institutional clients globally
Public funds • Andra AP-Fonden• Bureau of Labor Funds, Taiwan• Canada Post Corporation, Canada• City of Phoenix• County of Los Angeles• Government Pension Fund, Thailand• Lærernes Pension• Federation of National Public Service Workers Personnel
Mutual Aid Associations, Japan• Government Pension Investment Fund of Japan• London Pensions Fund Authority• Lønmodtagernes Dyrtidsfond• LSR, The Pension Fund for State Employees in Iceland• Massachusetts Water Resources Authority• Nebraska Investment Council• Parliamentary Contributory Pension Fund
1 As of 30-Jun-15. This does not represent a complete list of MFS’ institutional clients. The selection of clients represents a sampling of those who have agreed to the use of their names. It is not known whether the listed clients approve or disapprove of MFS Institutional Advisors Inc. or the advisory service provided. The criteria used to include the above listed clients are a mix ofinvestment style, type of client, and other considerations.
Corporate• American Airlines • Bristol-Myers Squibb• CenturyLink• Chrysler • Google• Manulife Financial, Canada• MeadWestvaco Corporation• Mitsubishi Electric Pension Fund• Nestle• Panasonic Pension Fund, Japan• PepsiCo Inc• Robert Bosch GmbH• Telstra Super, Australia• Toyota Motor Corporation, Japan
Sub-advised accounts• GuideStone Capital Management• NTUC Income Insurance, Singapore• Russell Investment Group• ANZ, New Zealand Investments
Non-profit & other• Archdiocese of New York• Children’s Hospital of Pittsburgh• Construction and Building Industry
Superannuation Fund, Australia
• Furman University• National Gallery of Art• North Shore Long Island Jewish Health System• Oregon and Southwest Washington Painters• Providence College• REST Industry Super, Australia• Saskatchewan HealthCare Employees' Pension
Plan, Canada• Texas A&M Foundation• Trinity University• UFCW Tri-State Pension• Unipension• University of British Columbia, Canada• University of Western Ontario, Canada
30848.3

13299-I-CT-IV-14Oct15.13MFS® International Value Equity
Key contacts
Carolyn Lucey, CIMA Director Relationship Manager Phone: 617.954.5980 Email: [email protected]
Chris RooneyClient Service Manager Phone: 617.954.6574 Email: [email protected]
Mailing AddressMFS Investment Management 111 Huntington Avenue, 23rd Floor Boston, MA 02199

INVESTMENT PROCESS AND DISCIPLINE

15299-I-CT-IV-14Oct15.15MFS® International Value Equity
What makes us different from other international value managers?
Integrated global research platform• Collaborative culture critical to process• Combines equity, fixed-income, and quantitative analysis
Disciplined, consistent strategy• Seeks sustainable returns in various market environments• Assess investment opportunities in context of 3 to 5 year time horizon
Rigorous valuation discipline• Patient, contrarian approach• Focus on downside risk management
Distinguishing characteristics
Integrated approach to analyzing value and evaluating risk

16299-I-CT-IV-14Oct15.16MFS® International Value Equity
GoalPer investment guidelines, on an annual basis MFS is expected to outperform the MSCI World ex U.S. IMI ND Index, net of fees, to be measured over a market cycle of three-to-five years. The reference stylefor MFS is the MSCI World Value ex U.S. IMI ND Index.
Strategy
Invest rather than speculateMost market participants speculate on near-term information and over-react to short-term newsflow. • We invest on a 3 to 5 year time horizon. Our global research platform, collaborative investment
approach and compensation structure are all aligned with this timeframe.
Analyze rather than forecastMost market participants attach too much weight to forecasts, which often prove inaccurate, particularly at inflection points.• Typically, we seek an analytical advantage by evaluating the long-term quality, sustainability,
improvement potential and intrinsic value of businesses.
Focus on downside riskMost market participants overemphasize upside potential vs. downside risk.• We manage capital with the goal of avoiding stocks with substantial downside risk, and only invest
where valuations more than compensate for inherent risks.
Investment approach
Leverage long-term analysis to exploit market inefficiencies

Investment process overview
Portfolio constructionStock analysisIdea generation MFS® International Value Equity
Invest rather than speculate Focus on downside risk
Research analysts
Portfolio managers
Attractive valuation
Risk/return
Risk review
Analyze rather than forecast
Evaluate quality
Determine appropriate valuation
Assess improvement potential
900-1,100 non-U.S. stocks rated byanalyst team
300 to 400 non-U.S. buy candidates
150 to 200 stocks that fit investment approach
Quantitative analysis
Besthigh-quality value ideas
80 to 100 holdings
Rigorous analysis of business, risk and valuation17
299-I-CT-IV-14Oct15.17MFS® International Value Equity

Idea generation: Invest rather than speculate
BOSTONTORONTO
MEXICO CITY
SÃO PAULO
SYDNEY
SINGAPORE
HONG KONG
TOKYO
LONDON
88 research analysts26 U.S. equity; 35 non-U.S. equity; 27 fixed-income; backed by 22 research/investment associates
8 global sector teamsorganized by region and sectors; cross-bordercollaboration
11 analyst-managedstrategiesUSD 42.4 billion inassets undermanagement
73 portfolio managerswith significant industryexperience in value,core, growth, and fixedincome
Quantitative screens11 quantitative analystsprovide proprietaryresearch models, stockrankings, and scenariotesting; backed by 14quantitative researchassociates
Global collaboration and integration provide competitive advantages
As of 30-Jun-15.
18299-I-CT-IV-14Oct15.18MFS® International Value Equity

Assess durability of returns and intrinsic value
Stock analysis: Analyze rather than forecast
Intrinsicvalue
Evaluatequality
Determineappropriatevaluation
Assessimprovement
potential
• Changes in supply/demand• Relative profitability and restructuring
potential• Analysis of change in management
• Examine a broad range of approaches• Assess value relative to history, peers,
market
• Sustainability of business model• Industry growth rate, cyclicality and risk• Management strength and capital allocation
19299-I-CT-IV-14Oct15.19MFS® International Value Equity

20299-I-CT-IV-14Oct15.20MFS® International Value Equity
Portfolio construction: Focus on downside risk
Entry points
• Negative short-term event• Underappreciated duration of returns• Unrecognized improvement potential
Exit points
• Expensive valuation• Fundamentals change• Attractive alternatives
Portfolio construction
• Attractive valuation• Determine position size by conviction and liquidity• Manage and evaluate risk and return
- Security level and systemic risk assessment
Seeks to invest where we believe valuations more than compensate for inherent risks
• Senior management semiannual risk review:portfolio vs. objectives
• Typical portfolio exposure has been:- Position size < 5% of portfolio at purchase - Industry weighting < 25% of portfolio

21299-I-CT-IV-14Oct15.21MFS® International Value Equity
Portfolio guidelines1. The portfolio shall be composed of cash equivalents and equity securities of companies doing business outside the United States (as defined using MSCI
classification of issuer or issue) with minimum market capitalizations of $200 million. Equity securities shall be restricted to those issues listed on the majorlocal-country stock exchanges. The markets that MFS can invest in are those within the following indices:a. Morgan Stanley-Capital World ex-U.S. Value Investable Market Index ND (MSCI World ex-U.S. Value IMI ND)b. Morgan Stanley-Capital World ex-U.S. Equity Investable Market Index ND (MSCI World ex-U.S. Equity IMI ND)
2. SEC Rule 144A international equity instruments with registration rights are fully permissible. Those instruments without registration rights must not exceed 10%of the lesser of cost or market value of any single international equity portfolio.
3. American Depository Receipts (ADRs) are permissible up to 2.5% of the total portfolio. Investing in Emerging Markets is prohibited. Emerging markets shall bedefined as those countries included in the MSCI Emerging Markets Investable Market Index ND.
4. In order to minimize transaction costs and market impact associated with country reclassification, and as MSCI reclassifies specific countries from one market toanother (such as from emerging to developed or frontier to emerging), MFS, with advance notification to the Retirement Plan Manager, may invest in suchcountries, subsequent to the announcement of MSCI’s formal reclassification and prior to its effective date.
5. MFS shall not use (non-currency) derivatives within the portfolio without the expressed written consent of the Plan. If MFS elects to use derivatives as part of itsinvestment strategy, the Plan requires that MFS document the rationale for using such instruments. MFS shall not invest in letter or restricted stock, nakedoptions or future contracts, and uncovered short positions or commodities. Use of any derivative instrument for speculation is prohibited.
6. Currency hedging up to a maximum of 25% of the portfolio (notional) is permitted for defensive purposes. Currency hedging shall be effected through the use offorward currency contracts and put and call options.
7. For prudent diversification the portfolio shall have a minimum of 30 issues quoted in at least 10 stock markets, although assets will not be specifically allocatedto individual countries or markets. No more than 5% of the portfolio at the lesser of cost or market value shall be invested in any one issue. In addition, no issueshall be purchased in the Portfolio if more than 15% of the outstanding shares of that company are held by the Manager in the total of all of its accounts.
8. The cash equivalent portion should not normally exceed 15% of the portfolio. Cash equivalents may be U.S. dollar or non-U.S. dollar denominated.
LADWP’s investment guidelines
Note: This section is only intended to serve as a summary of the client’s investment guidelines.Please consult the current investment management agreement for complete investment guidelines.

MARKET OVERVIEW

23299-I-CT-IV-14Oct15.23MFS® International Value Equity
We remain cautious in our outlook for international markets. We do not believe that the quantitative easing programs in Europe or Japan willdrive lasting economic recoveries in those regions. In our view, self-sustaining economic growth is contingent on the reform of labor marketsand reduction of elevated debt levels in both Europe and Japan. While the sovereign debt default in Greece didn't trigger a broader financialcrisis in Europe, it provided a sober warning with regard to the risks created by excessive levels of debt within the context of the 19 membercurrency union, particularly if one of the larger peripheral countries should falter. Looking beyond Europe, we believe that trouble may bebrewing in other regions, China in particular. China is the second biggest economy in the world and the largest contributor to global growthover the past decade. In spite of the government's efforts to stimulate the economy, growth in China continues to slow. Elsewhere, Russia'saggressions in Eastern Europe and weak economic conditions in Latin America add to the list of challenges to global growth.
Market overviewAs of 31 August 2015
The views expressed in this presentation are subject to change at any time. These views should not be relied upon as investment advice, as securities recommendation, or as an indication oftrading intent on behalf of any other MFS investment product.
PERFORMANCE REVIEW

25299-I-CT-IV-14Oct15.25MFS® International Value Equity
Compliance with LADWP’s investment guidelinesAs of 31 August 2015
Yes No
All companies doing business outside the United States ✔Minimum market cap of $200 million ✔Equity securities listed on the major local-country stock exchanges ✔Emerging markets prohibited ✔Minimum of 30 issues quoted in at least 10 stock markets ✔No more than 5% of the portfolio invested in any one issue ✔No issue purchased if more than 15% of the outstanding shares of that company are held by the Mgr in total of all accounts managed. ✔Cash equivalent portion should not normally exceed 15% of the portfolio. ✔
Note: This section is only intended to serve as a summary of the client’s investment guidelines.Please consult the current investment management agreement for complete investment guidelines.

26299-I-CT-IV-14Oct15.26MFS® International Value Equity
Japan UnitedStates
Europeex U.K.
U.K. Asiaex Japan
Pacificex Japan
EmergingMarkets
Canada
4.2
-0.1-6.4
-12.8-16.1
-21.8 -22.9 -25.3
Telec
ommu
nicati
onSe
rvice
s
Healt
h Car
e
Cons
umer
Stap
les
Infor
matio
nTe
chno
logy
Cons
umer
Disc
retio
nary
Indus
trials
Fina
ncial
s
Utilit
ies
Mater
ials
Ener
gy
5.1 1.9 2.2 6.51.6
-1.5
0.9
-2.1 -2.2
0.4
-9.4 -7.2 -10.0 -9.0 -12.5 -11.1
-27.2-22.4
-36.5 -37.8
MSCI World ex US Value IMI MSCI World ex US IMI
Region performance (%)1, 1 year as of 31-Aug-15 Sector performance (%) 1 year as of 31-Aug-15
Portfolio Value (Employees’ Retirement, Disability & Death Benefit Plan)Initial Value as of 31-Aug-14 $559,882,782Contributions +41,624Withdrawals -52,458,061Change in Market Value +6,364,427Market Value as of 31-Aug-15 $513,830,771Portfolio Value (Retiree Health Benefits Fund)Beginning value as of 31-Aug-14 $96,110,199Contributions +7,151Withdrawals -11,397,034Change in market value +1,203,099Ending value as of 31-Aug-15 $85,923,415
Portfolio performance (%), net of fees, as of 31-Aug-15
1 Year
0.3 0.3
-12.5 -8.8
Employees' Retirement, Disability and Death Benefit Plan
Retiree Health Benefits Fund
MSCI World ex US Value IMI
MSCI World ex US IMI
1 Source: FactSet. Region performance based on MSCI regional/country indexes.2 Source: Estimates based on FactSet Research Systems, Inc. Portfolio Analysts Application.
The analysis of MSCI World ex US Value IMI and MSCI World ex US constituents are brokenout by GICS Sectors.
Market and portfolio overview

27299-I-CT-IV-14Oct15.27MFS® International Value Equity
Historical performance in diverse markets (USD)
1 MSCI World ex US Value IMI with net dividends reinvested. Source: benchmark performance from SPAR, FactSet Research Systems Inc. Based on quarterly returns in USD.
MFS International Value composite (gross of fees) vs MSCI World ex US Value IMI1, October 2003 – June 2015
Downside risk management, upside participation
Market return less than -5%
Market return -5% to 5%
Market return greater than 5%
Total0
5
10
15
20
25
30
Numb
er of
quar
ters a
bove
/below
benc
hmar
k
Number of outperforming quarters
Number of underperforming quarters
Average quarterly +4.6% +1.3% -1.4% +0.9%relative performance

28299-I-CT-IV-14Oct15.28MFS® International Value Equity
Historical performance in diverse markets (USD)
1 MSCI World ex US IMI with net dividends reinvested. Source: benchmark performance from SPAR, FactSet Research Systems Inc. Based on quarterly returns in USD.
MFS International Value composite (gross of fees) vs MSCI World ex US IMI1, October 2003 – June 2015
Downside risk management, upside participation
Market return less than -5%
Market return -5% to 5%
Market return greater than 5%
Total0
5
10
15
20
25
30
Numb
er of
quar
ters a
bove
/below
benc
hmar
k Number of outperforming quarters
Number of underperforming quarters
Average quarterly +4.3% +0.9% -0.7% +0.9%relative performance

29299-I-CT-IV-14Oct15.29MFS® International Value Equity
Employees’ Retirement, Disability & Death Benefit PlanPerformance overview
Excess returns (%) vs.MSCI World ex US Value IMI 6.5 12.8 6.4 5.0MSCI World ex US IMI 4.4 9.1 5.1 4.7
YTD 1 Year 2 Years Since inception(6-Jul-12)
3.3
-3.2-1.1
0.3
-12.5-8.8
8.5
2.1 3.4
13.38.3 8.6
Portfolio (net)
MSCI World ex US Value IMI
MSCI World ex US IMI
Cumulative returns (%), as of 31-Aug-15

30299-I-CT-IV-14Oct15.30MFS® International Value Equity
YTD 1 Year 2 Years Since inception(6-Jul-12)
3.3
-3.2 -1.1
0.3
-12.5-8.8
8.5
2.1 3.4
13.38.3 8.6
Portfolio (net)
MSCI World ex US Value IMI
MSCI World ex US IMI
Retiree Health Benefits Fund Performance overview
Cumulative returns (%), as of 31-Aug-15
Excess returns (%) vs.MSCI World ex US Value IMI 6.5 12.8 6.4 5.0MSCI World ex US IMI 4.4 9.1 5.1 4.7
31299-I-CT-IV-14Oct15.31MFS® International Value Equity
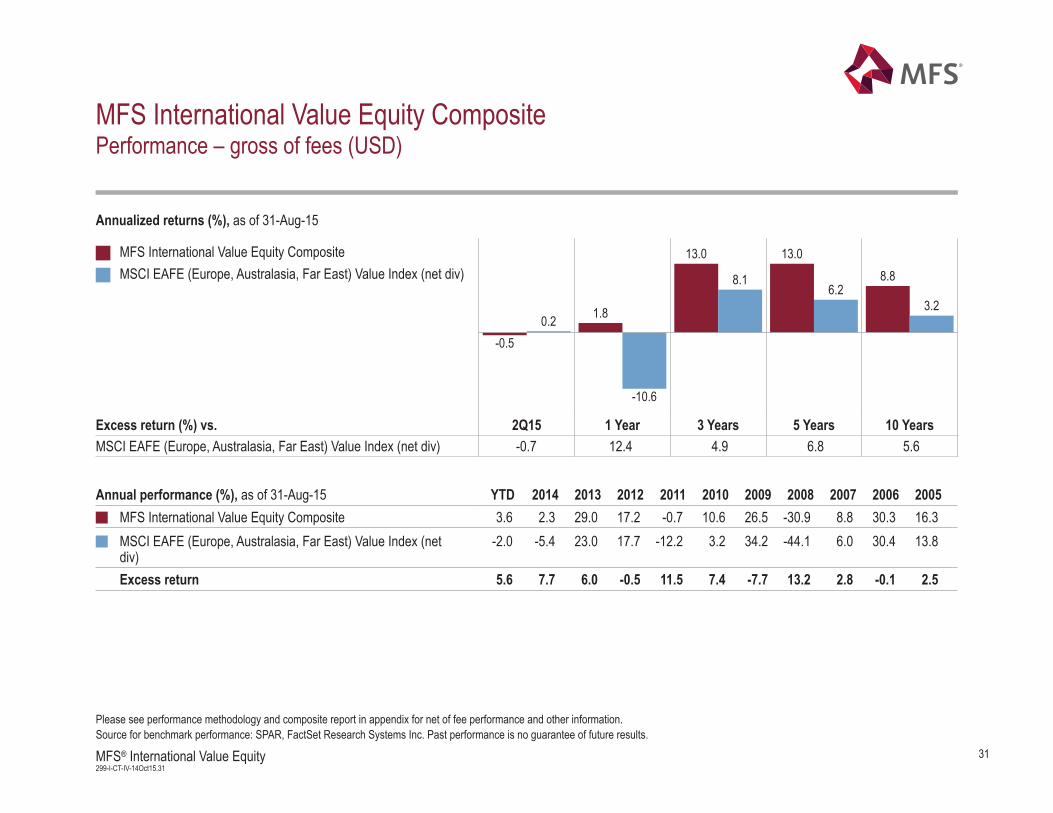
MFS International Value Equity CompositePerformance – gross of fees (USD)
Annualized returns (%), as of 31-Aug-15
Annual performance (%), as of 31-Aug-15 YTD 2014 2013 2012 2011 2010 2009 2008 2007 2006 2005
MFS International Value Equity CompositeMSCI EAFE (Europe, Australasia, Far East) Value Index (net div)
-0.5
1.8
13.0 13.08.8
0.2
-10.6
8.16.2
3.2
2Q15 1 Year 3 Years 5 Years 10 YearsExcess return (%) vs.MSCI EAFE (Europe, Australasia, Far East) Value Index (net div) -0.7 12.4 4.9 6.8 5.6
MFS International Value Equity Composite 3.6 2.3 29.0 17.2 -0.7 10.6 26.5 -30.9 8.8 30.3 16.3 MSCI EAFE (Europe, Australasia, Far East) Value Index (netdiv)
-2.0 -5.4 23.0 17.7 -12.2 3.2 34.2 -44.1 6.0 30.4 13.8
Excess return 5.6 7.7 6.0 -0.5 11.5 7.4 -7.7 13.2 2.8 -0.1 2.5
Please see performance methodology and composite report in appendix for net of fee performance and other information. Source for benchmark performance: SPAR, FactSet Research Systems Inc. Past performance is no guarantee of future results.

32299-I-CT-IV-14Oct15.32MFS® International Value Equity
MFS International Value Equity CompositePerformance – gross of fees (USD)
Annualized returns (%), as of 31-Aug-15
Annual performance (%), as of 31-Aug-15 YTD 2014 2013 2012 2011 2010 2009 2008 2007 2006 2005
MFS International Value Equity CompositeMSCI World (ex-US) Investable Market Index Value (net div)MSCI World (ex-US) Investable Market Index (net div)
-0.5
1.8
13.0 13.08.8
0.5
-12.5
7.4 6.03.4
1.0
-8.8
7.9 6.74.2
2Q15 1 Year 3 Years 5 Years 10 YearsExcess return (%) vs.MSCI World (ex-US) Investable Market Index Value (net div) -1.0 14.3 5.6 7.0 5.4MSCI World (ex-US) Investable Market Index (net div) -1.5 10.6 5.1 6.3 4.6
MFS International Value Equity Composite 3.6 2.3 29.0 17.2 -0.7 10.6 26.5 -30.9 8.8 30.3 16.3 MSCI World (ex-US) Investable Market Index Value (net div) -3.2 -5.5 22.2 17.6 -12.3 6.6 38.3 -44.4 6.1 28.8 14.4 Excess return 6.8 7.8 6.8 -0.4 11.6 4.0 -11.8 13.5 2.7 1.5 1.9MSCI World (ex-US) Investable Market Index (net div) -1.1 -4.5 21.6 16.5 -12.7 10.7 35.3 -44.0 11.7 25.6 15.7 Excess return 4.7 6.8 7.4 0.7 12.0 -0.1 -8.8 13.1 -2.9 4.7 0.6
Please see performance methodology and composite report in appendix for net of fee performance and other information. Source for benchmark performance: SPAR, FactSet Research Systems Inc. Past performance is no guarantee of future results.

33299-I-CT-IV-14Oct15.33MFS® International Value Equity
How has this translated into performance results? (USD)
MFS International Value Equity composite Rolling 5-year periods (gross of fees) vs. MSCI EAFE Value1 (1Q98 – 2Q15)Average rolling 5 year annualized excess returns since inception: 4.4%
1 MSCI EAFE Value with net dividends reinvested. Source: benchmark performance from SPAR, FactSet Research Systems, Inc.
Disciplined approach, historical relative returns
-10
0
10
20
30
-10 -5 0 5 10 15 20 25 30
Mana
ger r
eturn
s (%
)
Benchmark returns (%)
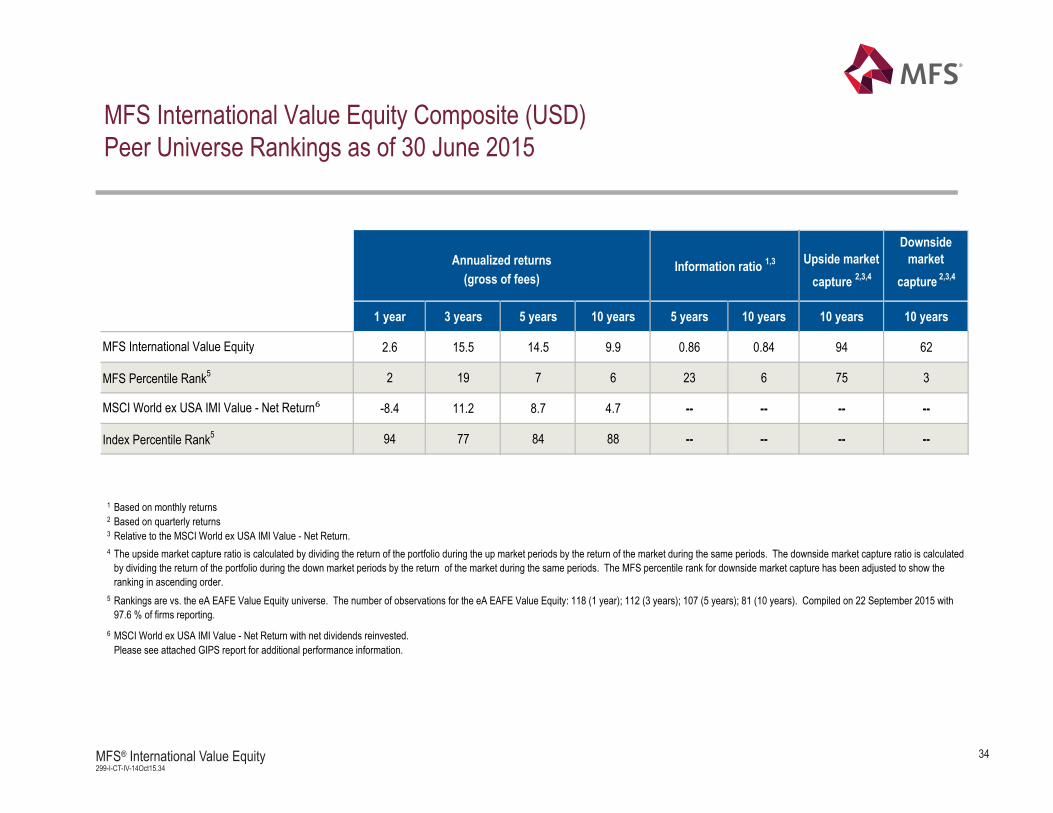
MFS International Value Equity Composite (USD)Peer Universe Rankings as of 30 June 2015
Upside market Downside
market capture 2,3,4 capture 2,3,4
1 year 3 years 5 years 10 years 5 years 10 years 10 years 10 years
2.6 15.5 14.5 9.9 0.86 0.84 94 62
2 19 7 6 23 6 75 3
-8.4 11.2 8.7 4.7 -- -- -- --
94 77 84 88 -- -- -- --
1 Based on monthly returns 2 Based on quarterly returns3 Relative to the MSCI World ex USA IMI Value - Net Return.4
5
6 MSCI World ex USA IMI Value - Net Return with net dividends reinvested.Please see attached GIPS report for additional performance information.
MFS International Value Equity
MFS Percentile Rank5
MSCI World ex USA IMI Value - Net Return
Index Percentile Rank5
The upside market capture ratio is calculated by dividing the return of the portfolio during the up market periods by the return of the market during the same periods. The downside market capture ratio is calculated by dividing the return of the portfolio during the down market periods by the return of the market during the same periods. The MFS percentile rank for downside market capture has been adjusted to show the ranking in ascending order.Rankings are vs. the eA EAFE Value Equity universe. The number of observations for the eA EAFE Value Equity: 118 (1 year); 112 (3 years); 107 (5 years); 81 (10 years). Compiled on 22 September 2015 with 97.6 % of firms reporting.
Annualized returns Information ratio 1,3
(gross of fees)
34299-I-CT-IV-14Oct15.34MFS® International Value Equity

MFS International Value Equity Composite (USD)Peer Universe Rankings as of 30 June 2015
Upside market Downside
market capture 2,3,4 capture 2,3,4
1 year 3 years 5 years 10 years 5 years 10 years 10 years 10 years
2.6 15.5 14.5 9.9 0.90 0.83 95 66
2 19 7 6 20 7 71 2
-5.1 11.5 9.2 5.4 -- -- -- --
68 74 76 73 -- -- -- --
1 Based on monthly returns 2 Based on quarterly returns3 Relative to the MSCI World ex USA IMI - Net Return.4
5
6 MSCI World ex USA IMI - Net Return with net dividends reinvested.Please see attached GIPS report for additional performance information.
MFS International Value Equity
MFS Percentile Rank5
MSCI World ex USA IMI - Net Return
Index Percentile Rank5
The upside market capture ratio is calculated by dividing the return of the portfolio during the up market periods by the return of the market during the same periods. The downside market capture ratio is calculated by dividing the return of the portfolio during the down market periods by the return of the market during the same periods. The MFS percentile rank for downside market capture has been adjusted to show the ranking in ascending order.Rankings are vs. the eA EAFE Value Equity universe. The number of observations for the eA EAFE Value Equity: 118 (1 year); 112 (3 years); 107 (5 years); 81 (10 years). Compiled on 22 September 2015 with 97.6 % of firms reporting.
Annualized returns Information ratio 1,3
(gross of fees)
35299-I-CT-IV-14Oct15.35MFS® International Value Equity

36299-I-CT-IV-14Oct15.36MFS® International Value Equity
Performance drivers – regionsRelative to MSCI World ex US Value IMI Index (USD) – one year as of 31 August 2015
Attribution results are generated by the FactSet application utilizing a methodology which is widely accepted in the investment industry. Results are based upon daily holdings using a buy and holdmethodology to generate individual security returns and do not include expenses. As such, attribution results are essentially estimates and may not aggregate to the total return of the portfolio or ofthe benchmark which can be found elsewhere in this presentation.
Average relative Region Stock Currency Relative weighting (%) selection (%) + selection (%) + effect (%) = contribution (%)Contributors Europe ex-UK 7.9 0.5 3.3 0.7 4.5 United Kingdom -0.8 0.2 2.9 -0.3 2.8 Japan 4.3 1.0 2.1 -0.4 2.7 North America -7.2 1.7 0.7 0.1 2.6 Cash 4.0 0.1 – 0.4 0.5 Asia/Pacific ex-Japan -7.6 0.8 -0.1 -0.2 0.4 Currency Options 0.1 0.2 – -0.1 0.1
Detractors Developed - Middle East/Africa -0.6 0.1 – -0.2 -0.1
Total 4.6 8.9 -0.0 13.5

37299-I-CT-IV-14Oct15.37MFS® International Value Equity
Performance drivers – countryRelative to MSCI World ex US Value IMI Index (USD) – one year as of 31 August 2015
Attribution results are generated by the FactSet application utilizing a methodology which is widely accepted in the investment industry. Results are based upon daily holdings using a buy and holdmethodology to generate individual security returns and do not include expenses. As such, attribution results are essentially estimates and may not aggregate to the total return of the portfolio or ofthe benchmark which can be found elsewhere in this presentation.
Average relative Sector Stock Currency Relative weighting (%) selection (%) + selection (%) + effect (%) = contribution (%)Contributors Japan 4.3 0.9 2.1 -0.2 2.8 United Kingdom -0.8 0.1 2.8 -0.2 2.8 Canada -7.2 1.7 0.7 0.2 2.6 Germany 4.1 0.3 2.1 -0.2 2.2 Switzerland 8.9 0.2 0.4 0.8 1.4 Australia -3.5 0.3 0.1 0.3 0.7 Spain -2.5 0.2 0.5 -0.1 0.7 Netherlands 1.7 0.2 0.5 -0.1 0.6 Cash 4.0 0.0 – 0.5 0.5 Norway 0.2 0.0 0.3 -0.1 0.2 Singapore -1.5 0.2 – -0.1 0.1 Denmark 0.8 0.1 0.1 -0.1 0.1 Portugal -0.2 0.1 – -0.0 0.0 Austria -0.3 0.1 – -0.0 0.0 New Zealand -0.2 0.0 – -0.0 0.0 Detractors Sweden -0.2 0.0 -0.3 -0.1 -0.4 Hong Kong -2.5 0.3 -0.3 -0.4 -0.4 Israel -0.6 -0.0 – -0.1 -0.1 Finland -1.0 -0.1 – -0.0 -0.1 Belgium -0.6 -0.0 – -0.0 -0.1 Italy -2.4 -0.1 0.0 -0.0 -0.1 Ireland 0.1 0.1 -0.1 -0.1 -0.1 France -0.7 0.0 -0.0 -0.0 -0.0 Currency Options 0.0 0.0 – -0.0 -0.0 United States -0.0 0.0 – -0.0 -0.0Total 4.6 8.9 -0.0 13.5

38299-I-CT-IV-14Oct15.38MFS® International Value Equity
Performance drivers – sectorsRelative to MSCI World ex US Value IMI Index (USD) – one year as of 31 August 2015
Average relative Sector Stock Currency Relative weighting (%) selection (%) + selection (%) + effect (%) = contribution (%)Contributors Consumer Staples 22.2 2.7 0.4 0.2 3.4 Energy -8.6 2.8 0.2 -0.2 2.8 Financials -18.4 -0.4 2.9 -0.1 2.4 Materials -5.4 1.1 0.9 0.1 2.0 Information Technology 9.5 1.5 -0.2 -0.3 0.9 Health Care 5.3 0.8 -0.3 0.3 0.8 Cash 4.0 0.1 – 0.4 0.5 Industrials 1.6 0.2 0.4 -0.1 0.4 Telecommunication Services -0.9 0.0 0.5 -0.1 0.4 Currency Options 0.1 0.2 – -0.1 0.1 Utilities -5.9 0.2 – -0.1 0.0 Detractors Consumer Discretionary -3.4 -0.2 -0.2 0.1 -0.3 Total 8.9 4.6 -0.0 13.5
Attribution results are generated by the FactSet application utilizing a methodology which is widely accepted in the investment industry. Results are based upon daily holdings using a buy and holdmethodology to generate individual security returns and do not include expenses. As such, attribution results are essentially estimates and may not aggregate to the total return of the portfolio or ofthe benchmark which can be found elsewhere in this presentation.

39299-I-CT-IV-14Oct15.39MFS® International Value Equity
Average weighting Returns Relative Portfolio (%) Benchmark (%) Portfolio (%)1 Benchmark (%) contribution (%)Contributors KDDI Corp 3.2 0.2 32.4 32.4 1.2 Nomura Research Institute Ltd 1.8 0.0 30.8 0.1 0.7 Reckitt Benckiser Group PLC 3.3 – 7.3 – 0.6 Kao Corp 3.1 – 7.6 – 0.6 Kose Corp 0.6 – 129.4 – 0.6 Deutsche Wohnen Ag 1.5 0.0 18.8 6.7 0.5 Royal Dutch Shell PLC 0.6 2.6 -25.6 -33.1 0.5 Santen Pharmaceutical 1.0 – 37.4 – 0.4 Novartis AG 2.3 0.7 11.9 0.8 0.4 Banco Santander – 1.3 – -35.0 0.4
Detractors Esprit Holdings 0.5 0.0 -48.0 -48.0 -0.3 Mitsubishi UFJ Financial Group, Inc – 1.0 – 17.7 -0.3 Brambles Ltd 2.3 – -19.4 – -0.3 Neopost SA 0.7 0.0 -43.2 -43.2 -0.2 Ericsson Lm 2.2 – -19.8 – -0.2 Computershare Ltd 0.7 0.0 -37.4 -27.7 -0.2 Ck Hutchison – 0.5 – 19.2 -0.2 Toyota Motor Corp – 1.3 – 5.3 -0.2 Barclays PLC – 0.8 – 10.6 -0.2 Imperial Tobacco Group PLC – 0.6 – 16.4 -0.1
Performance drivers – stocksRelative to MSCI World ex US Value IMI Index (USD) – one year as of 31 August 2015
1 Represents performance for the time period stock was held in portfolio. Attribution results are generated by the Factset application utilizing a methodology which is widely accepted in the investment industry. Results are based upon daily holdings using a buy and hold
methodology to generate individual security returns and do not include expenses. As such, attribution results are essentially estimates and may not aggregate to the total return of the portfolio or ofthe benchmark which can be found elsewhere in this presentation.

40299-I-CT-IV-14Oct15.40MFS® International Value Equity
Performance drivers – regionsRelative to MSCI World ex US IMI Index (USD) – one year as of 31 August 2015
Attribution results are generated by the FactSet application utilizing a methodology which is widely accepted in the investment industry. Results are based upon daily holdings using a buy and holdmethodology to generate individual security returns and do not include expenses. As such, attribution results are essentially estimates and may not aggregate to the total return of the portfolio or ofthe benchmark which can be found elsewhere in this presentation.
Average relative Region Stock Currency Relative weighting (%) selection (%) + selection (%) + effect (%) = contribution (%)Contributors Japan 4.5 0.8 2.2 -0.3 2.7 Europe ex-UK 5.0 0.3 1.6 0.3 2.3 North America -7.4 1.3 0.6 0.2 2.1 United Kingdom 1.8 -0.1 1.9 -0.1 1.8 Asia/Pacific ex-Japan -7.3 1.0 -0.2 -0.1 0.7 Cash 4.0 -0.1 – 0.4 0.4 Currency Options 0.1 0.2 – -0.1 0.1
Detractors Developed - Middle East/Africa -0.6 -0.0 – -0.1 -0.1 Emerging Markets -0.0 0.1 – -0.1 -0.0
Total 3.5 6.1 0.2 9.9

41299-I-CT-IV-14Oct15.41MFS® International Value Equity
Attribution results are generated by the FactSet application utilizing a methodology which is widely accepted in the investment industry. Results are based upon daily holdings using a buy and holdmethodology to generate individual security returns and do not include expenses. As such, attribution results are essentially estimates and may not aggregate to the total return of the portfolio or ofthe benchmark which can be found elsewhere in this presentation.
Average relative Sector Stock Currency Relative weighting (%) selection (%) + selection (%) + effect (%) = contribution (%)Contributors Japan 4.5 0.8 2.2 -0.2 2.8 Canada -7.4 1.3 0.5 0.3 2.1 United Kingdom 1.8 -0.1 1.9 0.0 1.8 Germany 4.0 0.3 1.6 -0.2 1.7 Switzerland 5.5 -0.0 0.4 0.5 0.9 Australia -3.4 0.4 0.0 0.3 0.7 Spain -1.5 0.1 0.5 -0.0 0.6 Netherlands 1.2 0.1 0.3 -0.1 0.4 Cash 4.0 -0.1 – 0.5 0.4 Singapore -1.4 0.3 – -0.1 0.2 Norway 0.7 -0.1 0.3 -0.2 0.0 Portugal -0.2 0.1 – -0.0 0.0 New Zealand -0.2 0.0 – -0.0 0.0 Austria -0.3 0.0 – -0.0 0.0 Detractors France 0.3 0.0 -0.4 -0.0 -0.4 Sweden -0.6 -0.0 -0.3 -0.0 -0.4 Denmark -0.2 -0.0 -0.2 -0.1 -0.3 Hong Kong -2.3 0.4 -0.3 -0.4 -0.2 Italy -1.9 -0.1 -0.0 -0.0 -0.1 Israel -0.6 -0.1 – -0.1 -0.1 Belgium -1.2 -0.1 – -0.0 -0.1 Ireland 0.1 0.0 -0.0 -0.1 -0.1 Currency Options 0.0 0.0 – -0.0 -0.0 Finland -0.8 0.0 – -0.0 -0.0 United States -0.0 0.0 – -0.0 -0.0 China -0.0 0.0 – -0.0 -0.0 Total 3.2 6.4 0.2 9.9
Performance drivers – countryRelative to MSCI World ex US IMI Index (USD) – one year as of 31 August 2015

42299-I-CT-IV-14Oct15.42MFS® International Value Equity
Performance drivers – sectorsRelative to MSCI World ex US IMI Index (USD) – one year as of 31 August 2015
Attribution results are generated by the FactSet application utilising a methodology which is widely accepted in the investment industry. Results are based upon daily holdings using a buy and holdmethodology to generate individual security returns and do not include expenses. As such, attribution results are essentially estimates and may not aggregate to the total return of the portfolio or ofthe benchmark which can be found elsewhere in this presentation.
Average relative Sector Stock Currency Relative weighting (%) allocation (%) + selection (%) + effect (%) = contribution (%)Contributors Financials -6.4 0.0 2.7 -0.1 2.7 Consumer Staples 16.8 1.0 1.2 0.1 2.3 Energy -5.5 2.2 0.2 -0.0 2.3 Materials -5.3 0.8 0.7 0.1 1.6 Telecommunication Services 0.8 0.2 0.7 -0.1 0.7 Information Technology 6.9 0.6 0.2 -0.3 0.5 Cash 4.0 -0.1 .– 0.5 0.4 Industrials -1.7 0.1 0.2 -0.1 0.1 Utilities -3.3 0.2 .– -0.1 0.1 Currency Options 0.1 0.1 .– -0.0 0.1 Financial Services -0.0 0.1 .– -0.1 0.0
Detractors Consumer Discretionary -6.8 -0.5 -0.4 0.1 -0.7 Health Care 0.4 0.1 -0.6 0.2 -0.3
Total 4.7 4.9 0.2 9.9

43299-I-CT-IV-14Oct15.43MFS® International Value Equity
Performance drivers – stocksRelative to MSCI World ex US IMI Index (USD) – one year as of 31 August 2015
1 Represents performance for the time period stock was held in portfolio. Attribution results are generated by the Factset application utilising a methodology which is widely accepted in the investment industry. Results are based upon daily holdings using a buy and hold
methodology to generate individual security returns and do not include expenses. As such, attribution results are essentially estimates and may not aggregate to the total return of the portfolio or ofthe benchmark which can be found elsewhere in this presentation.
Average Weighting Returns Relative Portfolio (%) Benchmark (%) Portfolio (%)1 Benchmark (%) contribution (%)Contributors KDDI Corp 3.2 0.2 32.4 32.4 1.1 Nomura Research Institute Ltd 1.8 0.0 30.8 30.8 0.6 Kose Corp 0.6 0.0 129.4 129.4 0.6 Kao Corp 3.1 0.1 7.6 7.6 0.5 Reckitt Benckiser Group PLC 3.3 0.3 6.7 6.7 0.5 Deutsche Wohnen Ag 1.5 0.0 17.2 18.5 0.4 Santen Pharmaceutical 1.0 0.0 37.4 37.4 0.4 BHP Billiton PLC .– 0.8 .– -40.5 0.3 Deutsche Annington Immobilien 1.2 0.1 18.8 9.2 0.3 OBIC Co Ltd 0.8 0.0 32.0 32.0 0.3
Detractors Brambles Ltd 2.3 0.1 -19.4 -19.4 -0.3 Esprit Holdings 0.5 0.0 -48.0 -48.0 -0.3 Ericsson Lm 2.2 0.2 -19.8 -19.8 -0.3 Neopost SA 0.7 0.0 -43.2 -43.2 -0.3 Valeant Pharmaceuticals Intl Inc .– 0.4 .– 95.2 -0.2 Computershare Ltd 0.7 0.0 -37.4 -37.4 -0.2 DnB NOR ASA 1.4 0.1 -22.5 -22.5 -0.2 Novo Nordisk .– 0.6 .– 22.8 -0.2 Toyota Motor Corp .– 1.1 .– 6.7 -0.1 TDC A/S 0.7 0.0 -23.5 -23.5 -0.1

PORTFOLIO REVIEW AND CHARACTERISTICS

45299-I-CT-IV-14Oct15.45MFS® International Value Equity
Top 10 portfolio holdings
MSCI World MSCI WorldAs of 31-Aug-15 Country Sector Portfolio (%) ex US IMI (%) ex US IMI Value (%)
Nestle SA Switzerland Consumer Staples 4.5 1.5 1.6
Danone SA France Consumer Staples 3.8 0.2 0.0
Reckitt Benckiser Group PLC United Kingdom Consumer Staples 3.6 0.4 0.0
KDDI Corp Japan Telecommunication Services 3.3 0.3 0.3
Kao Corp Japan Consumer Staples 2.8 0.1 0.0
Compass Group PLC United Kingdom Consumer Discretionary 2.6 0.2 0.0
Brambles Ltd Australia Industrials 2.5 0.1 0.0
Henkel AG & Co KGaA IPS Germany Consumer Staples 2.4 0.1 0.0
Japan Tobacco Inc Japan Consumer Staples 2.3 0.3 0.5
Nomura Research Institute Ltd Japan Information Technology 2.1 0.0 0.0
46299-I-CT-IV-14Oct15.46MFS® International Value Equity
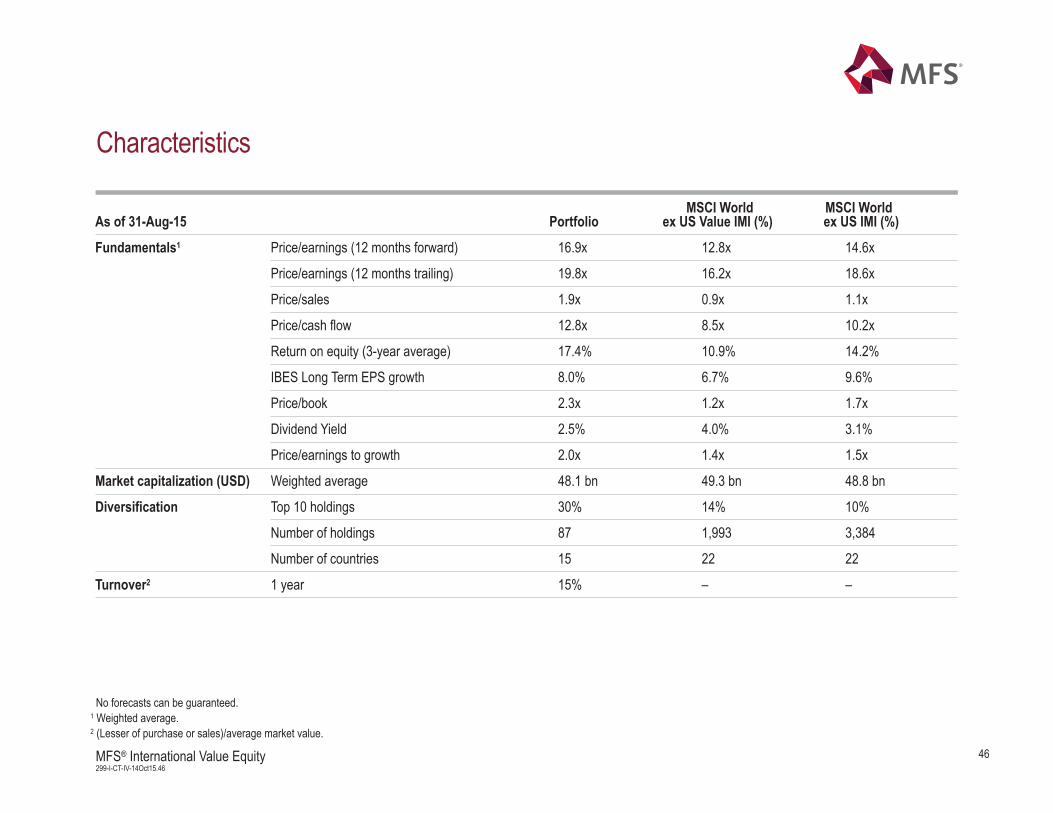
Characteristics
No forecasts can be guaranteed.1 Weighted average.2 (Lesser of purchase or sales)/average market value.
As of 31-Aug-15 Portfolio ex US Value IMI (%) ex US IMI (%)
Fundamentals1 Price/earnings (12 months forward) 16.9x 12.8x 14.6x
Price/earnings (12 months trailing) 19.8x 16.2x 18.6x
Price/sales 1.9x 0.9x 1.1x
Price/cash flow 12.8x 8.5x 10.2x
Return on equity (3-year average) 17.4% 10.9% 14.2%
IBES Long Term EPS growth 8.0% 6.7% 9.6%
Price/book 2.3x 1.2x 1.7x
Dividend Yield 2.5% 4.0% 3.1%
Price/earnings to growth 2.0x 1.4x 1.5x
Market capitalization (USD) Weighted average 48.1 bn 49.3 bn 48.8 bn
Diversification Top 10 holdings 30% 14% 10%
Number of holdings 87 1,993 3,384
Number of countries 15 22 22
Turnover2 1 year 15% – –
MSCI World MSCI World

47299-I-CT-IV-14Oct15.47MFS® International Value Equity
Characteristics
As of 31-Aug-15 Portfolio ex US Value IMI (%) ex US IMI (%)
Risk/reward (USD)1 Standard deviation 12.3% 16.0% 15.3%
Barra predicted tracking error 2 – 4.5% 3.5%
Beta vs. – 0.71 0.75
R-square – 85% 87%
Correlation – 0.92 0.93
Alpha (annualized) – 8.28 7.50
Sharpe ratio – 1.1% 1.1%
Jensen’s alpha – 8.7 7.9
Treynor ratio – 18.3 17.3
No forecasts can be guaranteed.1 Based on 5-year composite monthly data.
MSCI World MSCI World
Source: Barra. The Barra information may only be used for your internal use, may not be reproduced or redisseminated in any form and may not be used to create any financial instruments or products or any indices. The Barra information is provided on an "as is" basis and the user of this information assumes the entire risk of any use made of this information.
Barra, each of its affiliates and each other person involved in or related to compiling, computing or creating any Barra information (collectively, the "Barra Parties") expressly disclaims all warranties(including without limitation, any warranties of originality, accuracy, completeness, timeliness, non-infringement, merchantability and fitness for a particular purpose) with respect to this information.Without limiting any of the foregoing, in no event shall any Barra Party have any liability for any direct, indirect, special, incidental, punitive, consequential (including, without limitation, lost profits) orany other damages.
32

48299-I-CT-IV-14Oct15.48MFS® International Value Equity
Region and country weights
Portfolio (%)
Underweight/overweight (%)
4.5% cash and other. The assets included in "Other" carry risks including market, credit, counterparty, currency and liquidity risks. The inclusion of these assets may understate or overstate the fund'sactual cash position. Portfolio does not own securities in the Developed - Middle East/Africa region (0.7%).
1 Portfolio does not own securities in the following countries: Singapore 1.2%; Belgium 1.2%; Finland 0.8%; Israel 0.7%; and 3 other countries with weights less than 0.5% totaling 0.7%.
Underweight/overweightas of 31-Aug-15 (%) MSCI World ex US IMI (%)
Europe ex-U.K. 44.7 40.7 4.0Switzerland 13.0 8.2 4.8Germany 11.4 7.8 3.6Netherlands 3.9 2.4 1.5Norway 1.4 0.7 0.7Ireland 0.5 0.5 0.0Sweden 2.9 2.9 0.0France 8.3 8.5 -0.2Denmark 1.4 1.7 -0.3Spain 1.6 3.1 -1.5Italy 0.4 2.5 -2.1Other 1 0.0 2.5 -2.5
United Kingdom 19.2 18.7 0.5Japan 26.0 22.0 4.0Asia/Pacific ex-Japan 3.8 9.9 -6.1Hong Kong 0.4 2.7 -2.3Australia 3.3 5.7 -2.4Other 1 0.0 1.5 -1.5
North America 1.9 8.1 -6.2Canada 1.9 8.1 -6.2
4.0
0.5
4.0
-6.1
-6.2
Europeex-U.K.
UnitedKingdom
Japan
Asia/Pacificex-Japan
North America

49299-I-CT-IV-14Oct15.49MFS® International Value Equity
Region and country weights
Underweight/overweight as of 31-Aug-15 (%)
UnitedKingdom
North America
Japan
Europeex-U.K.
Developed –Middle East/Africa
Asia/Pacificex-Japan -6.5
-0.6
7.8
3.6
-6.2
-2.6
4.5% cash and other. The assets included in "Other" carry risks including market, credit, counterparty, currency and liquidity risks. The inclusion of these assets may understate or overstate the portfolio'sactual cash position.
1 Portfolio does not own securities in the following countries: Singapore 1.3%; Israel 0.6%; Finland 1.1%; Belgium 0.6%; and 3 other countries with weights less than 0.5% totaling 0.7%.
Portfolio (%) Underweight/overweight (%)
MSCI World ex USValue IMI (%)
Europe ex-U.K. 44.7 36.8 7.8Switzerland 13.0 5.4 7.6Germany 11.4 6.6 4.8Netherlands 3.9 1.8 2.1Denmark 1.4 0.7 0.7Sweden 2.9 2.4 0.5Norway 1.4 1.1 0.2Ireland 0.5 0.4 0.1France 8.3 9.4 -1.1Italy 0.4 2.7 -2.4Spain 1.6 4.1 -2.5Other 1 0.0 2.2 -2.2
United Kingdom 19.3 21.8 -2.6Japan 26.0 22.4 3.6Asia/Pacific ex-Japan 3.8 10.3 -6.5Australia 3.4 5.8 -2.4Hong Kong 0.4 3.0 -2.6Other 1 0.0 1.5 -1.5
North America 1.9 8.0 -6.2Canada 1.9 8.0 -6.2
Developed - Middle East/Africa 0.0 0.6 -0.6Other 1 0.0 0.6 -0.6

50299-I-CT-IV-14Oct15.50MFS® International Value Equity
Sector weights
Cons
umer
St
aples
Finan
cials
Indus
trials
Infor
matio
n Te
chno
logy
Healt
h Ca
re
Cons
umer
Di
scre
tiona
ry
Telec
ommu
nicati
on
Servi
ces
Mater
ials
Ener
gy
Utilit
ies
27.6
5.1
10.2
20.7
38.1
26.2
11.810.4
13.511.7
2.45.1
9.36.9
11.0
5.58.9
13.1
5.0 5.3 4.4 3.1
8.0 7.4
0.8
8.85.8
0.0
6.03.3
Portfolio MSCI World ex US Value IMI MSCI World ex US IMI
As of 31-Aug-15
Relative exposure to:
MSCI World ex US Value IMI -17.4 1.4 -3.4 -8.0 -5.0 2.4 -0.3 22.5 9.3 6.0MSCI World ex US IMI -5.6 -1.7 -7.6 -5.0 -4.3 -1.7 0.7 17.4 6.6 -3.3
4.5% cash and other. The assets included in "Other" carry risks including market, credit, counterparty, currency and liquidity risks. The inclusion of these assets may understate or overstate the fund'sactual cash position.
51299-I-CT-IV-14Oct15.51MFS® International Value Equity
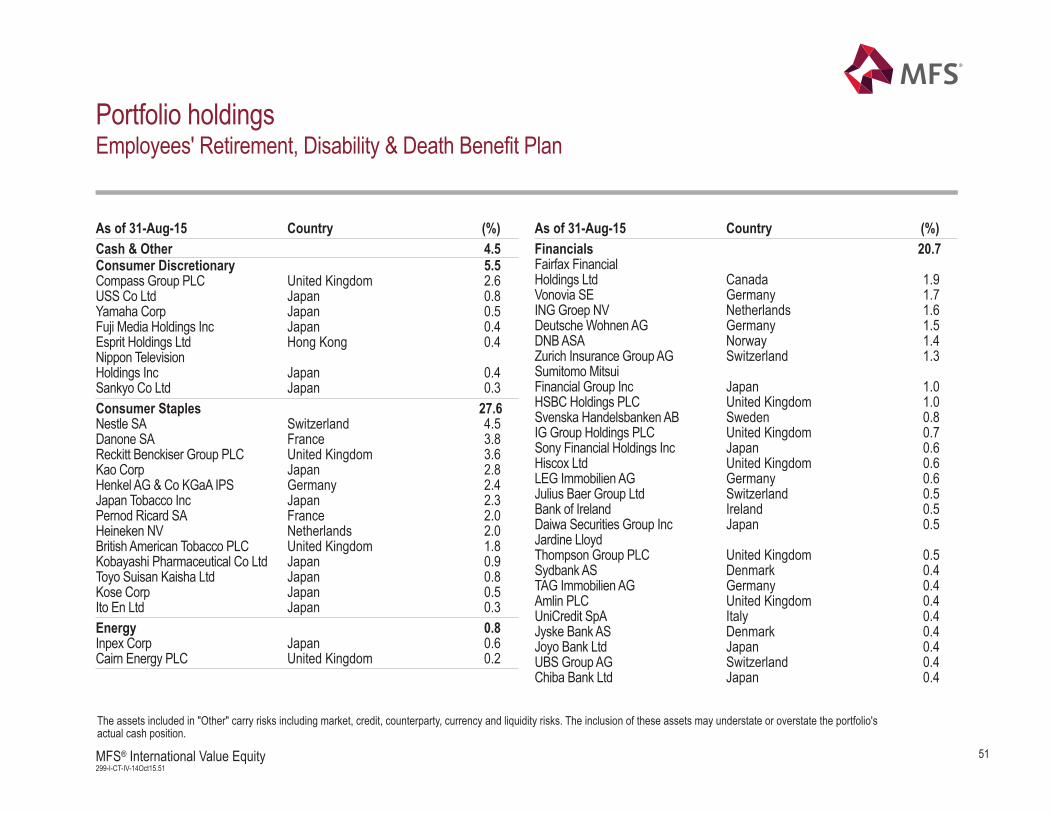
Portfolio holdingsEmployees' Retirement, Disability & Death Benefit Plan
The assets included in "Other" carry risks including market, credit, counterparty, currency and liquidity risks. The inclusion of these assets may understate or overstate the portfolio's actual cash position.
As of 31-Aug-15 Country (%) As of 31-Aug-15 Country (%)Cash & Other 4.5Consumer Discretionary 5.5Compass Group PLC United Kingdom 2.6USS Co Ltd Japan 0.8Yamaha Corp Japan 0.5Fuji Media Holdings Inc Japan 0.4Esprit Holdings Ltd Hong Kong 0.4Nippon TelevisionHoldings Inc Japan 0.4Sankyo Co Ltd Japan 0.3Consumer Staples 27.6Nestle SA Switzerland 4.5Danone SA France 3.8Reckitt Benckiser Group PLC United Kingdom 3.6Kao Corp Japan 2.8Henkel AG & Co KGaA IPS Germany 2.4Japan Tobacco Inc Japan 2.3Pernod Ricard SA France 2.0Heineken NV Netherlands 2.0British American Tobacco PLC United Kingdom 1.8Kobayashi Pharmaceutical Co Ltd Japan 0.9Toyo Suisan Kaisha Ltd Japan 0.8Kose Corp Japan 0.5Ito En Ltd Japan 0.3Energy 0.8Inpex Corp Japan 0.6Cairn Energy PLC United Kingdom 0.2
Financials 20.7Fairfax FinancialHoldings Ltd Canada 1.9Vonovia SE Germany 1.7ING Groep NV Netherlands 1.6Deutsche Wohnen AG Germany 1.5DNB ASA Norway 1.4Zurich Insurance Group AG Switzerland 1.3Sumitomo MitsuiFinancial Group Inc Japan 1.0HSBC Holdings PLC United Kingdom 1.0Svenska Handelsbanken AB Sweden 0.8IG Group Holdings PLC United Kingdom 0.7Sony Financial Holdings Inc Japan 0.6Hiscox Ltd United Kingdom 0.6LEG Immobilien AG Germany 0.6Julius Baer Group Ltd Switzerland 0.5Bank of Ireland Ireland 0.5Daiwa Securities Group Inc Japan 0.5Jardine LloydThompson Group PLC United Kingdom 0.5Sydbank AS Denmark 0.4TAG Immobilien AG Germany 0.4Amlin PLC United Kingdom 0.4UniCredit SpA Italy 0.4Jyske Bank AS Denmark 0.4Joyo Bank Ltd Japan 0.4UBS Group AG Switzerland 0.4Chiba Bank Ltd Japan 0.4

52299-I-CT-IV-14Oct15.52MFS® International Value Equity
The assets included in "Other" carry risks including market, credit, counterparty, currency and liquidity risks. The inclusion of these assets may understate or overstate the portfolio's actual cash position.
Portfolio holdingsEmployees' Retirement, Disability & Death Benefit Plan (continued)
Hachijuni Bank Ltd Japan 0.4Euler Hermes Group France 0.3North Pacific Bank Ltd Japan 0.3Health Care 9.3Bayer AG Germany 1.9GlaxoSmithKline PLC United Kingdom 1.7Roche Holding AG Switzerland 1.6Novartis AG Switzerland 1.6Santen Pharmaceutical Co Ltd Japan 1.1Terumo Corp Japan 0.8Nihon Kohden Corp Japan 0.6Industrials 11.8Brambles Ltd Australia 2.5Bunzl PLC United Kingdom 2.0Yamato Holdings Co Ltd Japan 1.8Cobham PLC United Kingdom 1.3Legrand SA France 1.0Brenntag AG Germany 0.9SGS SA Switzerland 0.8Geberit AG Switzerland 0.5Schindler Holding AG Switzerland 0.4Glory Ltd Japan 0.4Intertek Group PLC United Kingdom 0.3IMI PLC United Kingdom 0.2Information Technology 11.7Nomura ResearchInstitute Ltd Japan 2.1TelefonaktiebolagetLM Ericsson Sweden 2.0
Amadeus IT Holding SA Spain 1.6Hirose Electric Co Ltd Japan 1.0Halma PLC United Kingdom 0.9Obic Co Ltd Japan 0.8Dassault Systemes France 0.7Infineon Technologies AG Germany 0.7Computershare Ltd Australia 0.5Spectris PLC United Kingdom 0.5Neopost SA France 0.4ASM International NV Netherlands 0.3Materials 3.1Givaudan SA Switzerland 1.4Symrise AG Germany 1.3Orica Ltd Australia 0.4Telecommunication Services 5.0KDDI Corp Japan 3.3Vodafone Group PLC United Kingdom 1.1TDC AS Denmark 0.6
As of 31-Aug-15 Country (%) As of 31-Aug-15 Country (%)

53299-I-CT-IV-14Oct15.53MFS® International Value Equity
The assets included in "Other" carry risks including market, credit, counterparty, currency and liquidity risks. The inclusion of these assets may understate or overstate the portfolio's actual cash position.
Portfolio holdingsRetiree Health Benefits Fund
As of 31-Aug-15 Country (%) As of 31-Aug-15 Country (%)Cash & Other 4.5Consumer Discretionary 5.5Compass Group PLC United Kingdom 2.6USS Co Ltd Japan 0.9Yamaha Corp Japan 0.5Fuji Media Holdings Inc Japan 0.4Esprit Holdings Ltd Hong Kong 0.4Nippon TelevisionHoldings Inc Japan 0.4Sankyo Co Ltd Japan 0.3Consumer Staples 27.6Nestle SA Switzerland 4.5Danone SA France 3.8Reckitt Benckiser Group PLC United Kingdom 3.6Kao Corp Japan 2.8Henkel AG & Co KGaA IPS Germany 2.4Japan Tobacco Inc Japan 2.3Pernod Ricard SA France 2.0Heineken NV Netherlands 2.0British American Tobacco PLC United Kingdom 1.8Kobayashi Pharmaceutical Co Ltd Japan 0.8Toyo Suisan Kaisha Ltd Japan 0.7Kose Corp Japan 0.5Ito En Ltd Japan 0.3Energy 0.8Inpex Corp Japan 0.6Cairn Energy PLC United Kingdom 0.2
Financials 20.7Fairfax FinancialHoldings Ltd Canada 1.9Vonovia SE Germany 1.7ING Groep NV Netherlands 1.6Deutsche Wohnen AG Germany 1.5DNB ASA Norway 1.4Zurich Insurance Group AG Switzerland 1.3Sumitomo MitsuiFinancial Group Inc Japan 1.0HSBC Holdings PLC United Kingdom 1.0Svenska Handelsbanken AB Sweden 0.8IG Group Holdings PLC United Kingdom 0.7Sony Financial Holdings Inc Japan 0.6Hiscox Ltd United Kingdom 0.6LEG Immobilien AG Germany 0.6Julius Baer Group Ltd Switzerland 0.5Bank of Ireland Ireland 0.5Daiwa Securities Group Inc Japan 0.5Jardine LloydThompson Group PLC United Kingdom 0.5Sydbank AS Denmark 0.4TAG Immobilien AG Germany 0.4Amlin PLC United Kingdom 0.4UniCredit SpA Italy 0.4Jyske Bank AS Denmark 0.4Joyo Bank Ltd Japan 0.4UBS Group AG Switzerland 0.4Chiba Bank Ltd Japan 0.4

54299-I-CT-IV-14Oct15.54MFS® International Value Equity
The assets included in "Other" carry risks including market, credit, counterparty, currency and liquidity risks. The inclusion of these assets may understate or overstate the portfolio's actual cash position.
Portfolio holdingsRetiree Health Benefits Fund (continued)
Hachijuni Bank Ltd Japan 0.4Euler Hermes Group France 0.3North Pacific Bank Ltd Japan 0.3Health Care 9.3Bayer AG Germany 1.9GlaxoSmithKline PLC United Kingdom 1.7Roche Holding AG Switzerland 1.6Novartis AG Switzerland 1.6Santen Pharmaceutical Co Ltd Japan 1.1Terumo Corp Japan 0.8Nihon Kohden Corp Japan 0.6Industrials 11.8Brambles Ltd Australia 2.5Bunzl PLC United Kingdom 2.0Yamato Holdings Co Ltd Japan 1.8Cobham PLC United Kingdom 1.3Legrand SA France 1.0Brenntag AG Germany 0.9SGS SA Switzerland 0.8Geberit AG Switzerland 0.5Schindler Holding AG Switzerland 0.4Glory Ltd Japan 0.4Intertek Group PLC United Kingdom 0.3IMI PLC United Kingdom 0.2Information Technology 11.7Nomura ResearchInstitute Ltd Japan 2.1TelefonaktiebolagetLM Ericsson Sweden 2.0
Amadeus IT Holding SA Spain 1.6Hirose Electric Co Ltd Japan 1.0Halma PLC United Kingdom 0.9Obic Co Ltd Japan 0.8Dassault Systemes France 0.7Infineon Technologies AG Germany 0.7Computershare Ltd Australia 0.5Spectris PLC United Kingdom 0.5Neopost SA France 0.4ASM International NV Netherlands 0.3Materials 3.1Givaudan SA Switzerland 1.4Symrise AG Germany 1.3Orica Ltd Australia 0.4Telecommunication Services 5.0KDDI Corp Japan 3.3Vodafone Group PLC United Kingdom 1.1TDC AS Denmark 0.6
As of 31-Aug-15 Country (%) As of 31-Aug-15 Country (%)

FEE SCHEDULE
56299-I-CT-IV-14Oct15.56MFS® International Value Equity
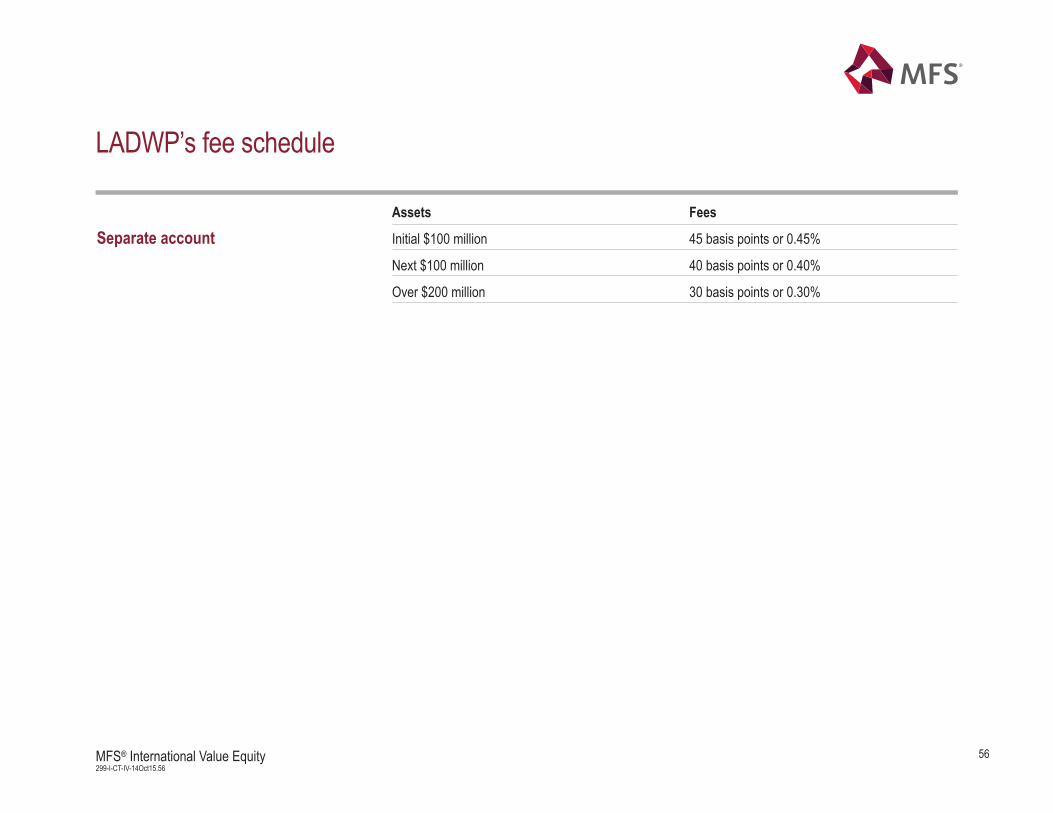
Assets Fees
Separate account Initial $100 million 45 basis points or 0.45%
Next $100 million 40 basis points or 0.40%
Over $200 million 30 basis points or 0.30%
LADWP’s fee schedule
57299-I-CT-IV-14Oct15.57MFS® International Value Equity
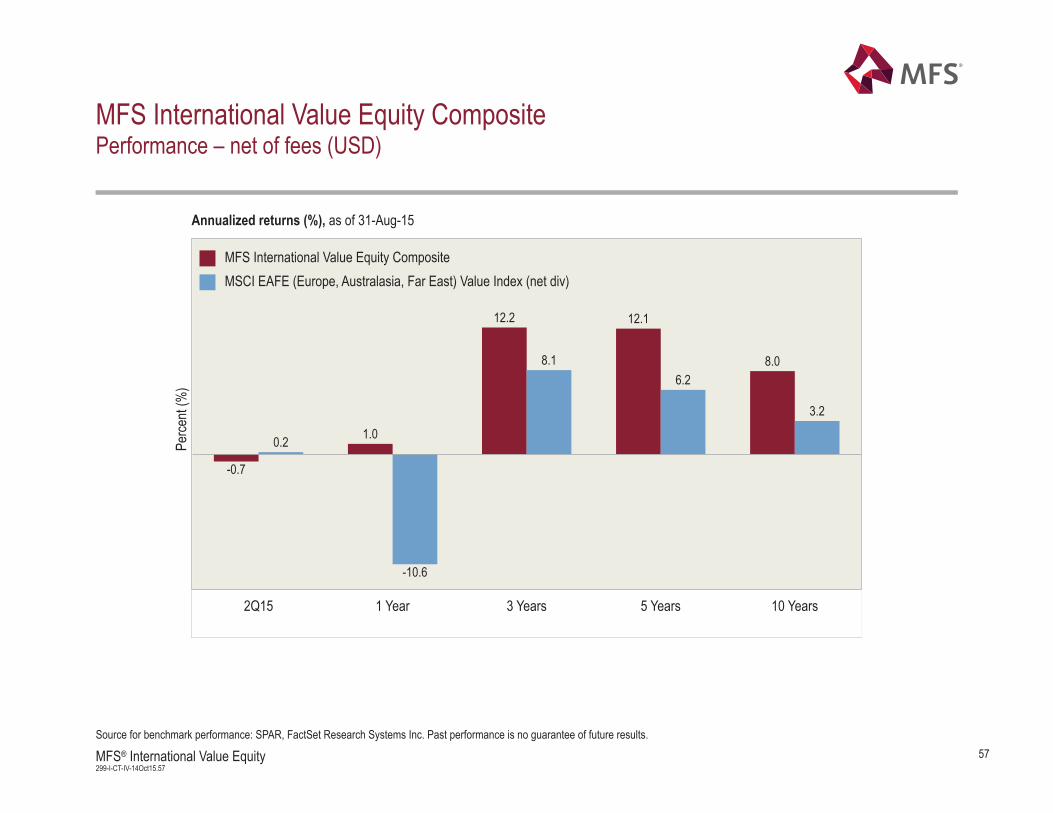
MFS International Value Equity CompositePerformance – net of fees (USD)
Annualized returns (%), as of 31-Aug-15
Source for benchmark performance: SPAR, FactSet Research Systems Inc. Past performance is no guarantee of future results.
Perce
nt (%
)
MFS International Value Equity CompositeMSCI EAFE (Europe, Australasia, Far East) Value Index (net div)
-0.7
1.0
12.2 12.1
8.0
0.2
-10.6
8.16.2
3.2
2Q15 1 Year 3 Years 5 Years 10 Years

58299-I-CT-IV-14Oct15.58MFS® International Value Equity
MFS International Value Equity CompositePerformance – net of fees (USD)
Annualized returns (%), as of 31-Aug-15
Source for benchmark performance: SPAR, FactSet Research Systems Inc. Past performance is no guarantee of future results.
Perce
nt (%
)
MFS International Value Equity CompositeMSCI World (ex-US) Investable Market Index Value (net div)MSCI World (ex-US) Investable Market Index (net div)
-0.7
1.0
12.2 12.1
8.0
0.5
-12.5
7.46.0
3.41.0
-8.8
7.96.7
4.2
2Q15 1 Year 3 Years 5 Years 10 Years

Composite: MFS International Value Equity CompositeBenchmark: MSCI EAFE Value - Net Return
Creation Date: 19-Oct-2005
Inception Date: 01-Dec-1997
Investment Objective: To provide long-term capital appreciation and current income by investing principally in attractively valued equities of companies whose operations lie outside of the U.S. Stock selection is based solely on MFS proprietary research process and therefore excludes assets managed by external parties or non-MFS sub-advisors.
Institutional Separate Accounts Fee ScheduleAsset Breakpoints (USD) FeeFor Assets Up To 50 MM 75 bpFor Assets From 50 MM To 100 MM 60 bpFor Assets Over 100 MM 50 bp
Derivative Exposure DisclosureCertain MFS portfolios in this composite may utilize derivative instruments to manage risk or to achieve timely and cost effective implementation of the investment strategy. As of 30-Jun-2015, the number of accounts in the composite shown below held derivatives with the following average equivalent exposure of total net assets:
Number of Accounts ExposureLong Exposure 13 0.69%Short Exposure 13 -0.69%
Accounts are eligible for inclusion in the composite if they have assets greater than 2 MM USD. Accounts are included as of their first full month of performance.
Accounts in Annualized 3-YearComposite and Benchmark Return Composite Composite at Standard Deviation Assets in Composite
Period Gross of fees Net of fees Benchmark Dispersion End of Period Composite Benchmark (USD million) %Firm2015 Q2 -0.47 -0.65 0.22 0.04 18 9.50 11.58 $32,695.5 7.4
2015 Q1 6.83 6.63 3.89 0.24 18 10.96 14.26 $31,212.1 7.1
2014 2.33 1.56 -5.39 0.23 19 10.87 14.32 $27,757.3 6.5
2013 29.04 28.09 22.95 0.58 20 12.32 17.45 $22,037.3 5.3
2012 17.21 16.34 17.69 0.23 19 14.59 20.56 $12,317.2 3.8
2011 -0.68 -1.43 -12.17 0.10 12 19.87 24.86 $6,494.2 2.9
2010 10.60 9.78 3.25 n/a 9 n/a n/a $5,104.7 2.3
2009 26.50 25.57 34.23 n/a <6 n/a n/a $3,009.2 1.6
2008 -30.86 -31.39 -44.09 n/a <6 n/a n/a $998.4 0.8
2007 8.77 7.96 5.96 n/a <6 n/a n/a $1,540.1 0.8
2006 30.25 29.30 30.38 n/a <6 n/a n/a $1,109.9 0.6
2005 16.33 15.48 13.80 n/a <6 n/a n/a $596.3 0.4MFS Investment Management® claims compliance with the Global Investment Performance Standards (GIPS®) and has prepared and presented this report in compliance with the GIPS® standards. MFS has been independently verified for the periods 1-Jan-1988 through 31-Dec-2013. Verification assesses whether (1) the firm has complied with all the composite construction requirements of the GIPS standards on a firm-wide basis and (2) the firm's policies and procedures are designed to calculate and present performance in compliance with the GIPS® standards. MFS International Value Equity Composite has been examined for the periods 01-Dec-1997 through 31-Dec-2013. The verification and performance examination reports are available upon request.
Total Gross-of-fee returns in USD (includes both capital appreciation and income), are net of transaction costs, withholding taxes and direct expenses, but before management fees, custody and other indirect expenses. Certain institutional accounts hold Canadian trusts subject to custody and other indirect expenses. Certain accounts may be subject to fair valuation as conditions warrant. Typical separate accounts utilize 4:00 PM (London Time) foreign exchange rates; retail products will use rates deemed most appropriate for daily NAV per share calculations. The possibility exists for performance dispersion between otherwise similarly managed accounts and also with the benchmark. Net composite returns are prepared by subtracting from the monthly gross returns one-twelfth of the maximum applicable annual institutional separate account fee. Returns based on actual management fees, including non-separate account fees and performance based fees, would be lower for the following periods -2005: 15.30; 2006: 29.11; 2007: 7.74; 2008: -31.49; 2009: 25.44. Total returns of the benchmark are provided for each period depicted, expressed in USD. Source of Benchmark Performance: FACTSET ®. Benchmark returns are not examined by independent accountants. MSCI EAFE Value - Net Return - a market capitalization-weighted index that is designed to measure equity market performance for value securities in the developed markets, excluding the U.S. and Canada. Composite Dispersion is measured by the asset-weighted standard deviation of account returns for all accounts in the composite for the full period. For composites containing less than six accounts, dispersion is deemed not meaningful. Prior to 31-Mar-2009 accounts would be eligible for inclusion in the composite if they had assets greater than 5.0 MM USD and as of their second full month of performance. Certain accounts in this composite may make tactical allocation to U.S. and Canadian based securities, where each investment is deemed to be consistent with the composite's overall investment objective. For purposes of GIPS® compliance, the firm is defined as MFS Investment Management® which is comprised of Massachusetts Financial Services Company (MFS) and MFS Institutional Advisors, Inc. (MFSI), each of which is a registered investment advisor, MFS Heritage Trust Company, a New Hampshire Trust company, and MFS Investment Management Canada Limited, a registered investment advisor. Total firm assets are calculated at market value and include assets managed by MFS, MFSI, MFS Heritage Trust Company and MFS Investment Management Canada Limited as well as assets managed by MFS and MFSI in a sub-advisory capacity on behalf of affiliated investment advisors that may or may not be registered under the United States Investment Advisers Act of 1940, such as MFS International (U.K.), Ltd. (MIL UK) and MFS Investment Management K.K. (MIMKK), as well as assets managed by MFS and MFSI on behalf of unaffiliated investment advisors that may or may not be registered under the United States Investment Advisers Act of 1940. Total firm assets for GIPS purposes do not include assets of non-discretionary advisory relationships. In November of 2011 MFS acquired McLean Budden Limited (now MFS Investment Management Canada Limited). Total firm assets from 31-Mar-2012 forward include the assets of institutional and pooled MFS Investment Management Canada Limited products. Assets from 31-Dec-2012 forward include the MFS Investment Management Canada Limited PPM product assets. A complete list of firm composites and descriptions, along with additional information regarding policies for valuing portfolios, calculating and reporting performance, and preparing compliant presentations are available upon request.
Run Time: 22-Jul-15 11:09:38 AM AEDIV Page 1 of 1
Performance Presentation Report 2015, Q2

GLOSSARY OF INVESTMENT TERMS

61299-I-CT-IV-14Oct15.61MFS® International Value Equity
Glossary of terms
Alpha is a measure of the difference between a portfolio's actual returns and its expected performance, given its level of risk asmeasured by beta. A positive alpha figure indicates the portfolio has performed better than its beta would predict. In contrast, anegative alpha indicates the portfolio's underperformance, given the expectations established by the fund's beta.
Beta is a measure of a portfolio's sensitivity to market movements. The beta of the market is 1.00 by definition. A portfolio with abeta of 0.85 would indicate that the portfolio is expected to perform 15% worse that the market's excess return during up marketsand 15% better during down markets , assuming all other factors remain constant.
Earnings-per-share (EPS) growth represents the annualized rate of net-income-per-share growth over the trailing three-yearperiod for the stocks held by the portfolio. Earnings-per-share growth gives a good picture of the rate at which a company hasgrown its profitability per unit of equity.
Excess return is defined as the portfolio's achieved rate of return minus the benchmark return over the same period.
Information ratio is a measure of risk adjusted performance. Dividing the portfolio active return by portfolio tracking error givesyou the information ratio.
Predicted tracking error (also called active risk) is a measure of the expected deviation from the benchmark.
Price/book ratio of the portfolio is the weighted average of the price/book ratios of all the stocks in the portfolio. Book value is thetotal assets of a company, less total liabilities. A company's book value is calculated by dividing the market price of its outstandingstock by the company's book value, and then adjusting for the number of shares outstanding (Stocks with negative book valuesare excluded from this calculation.). The price/book ratio can tell investors approximately how much they're paying for acompany's assets, based on historical, rather than current, valuations.
Price/cash flow is a stock's current price divided by the trailing 12-month cash flow per share. For the portfolio this numberrepresents the weighted average of the price/cash-flow ratios of the stocks in the portfolio. Price/cash-flow represents the amountan investor is willing to pay for a dollar generated from a particular company's operations. Price/cash-flow shows the ability of abusiness to generate cash and acts as a gauge of liquidity and solvency.

62299-I-CT-IV-14Oct15.62MFS® International Value Equity
Glossary of terms (continued)
P/E (12 month forward) is a stock's current price divided by the company's trailing 12-month earnings per share. The (P/E) ratioof the portfolio is the weighted average of the price/earnings ratios of the stocks in the portfolio. The P/E ratio of a company,which is a comparison of the cost of the company's stock and its expected next 12-month earnings per share, is calculated bydividing these two figures.
Price/sales is a stock's current price divided by the company's trailing 12-month sales per share. For the portfolio this numberrepresents the weighted average of the price/sales ratios of the stocks in the portfolio. Price/sales represents the amount aninvestor is willing to pay for a dollar generated from a particular company's operations.
R-Squared is the measure of correlation between a portfolio and the market (benchmark). Values range between 0 and 1. Thehigher the value of R-Square, the greater the correlation between the two. R-squared can be used to determine the significanceof a particular beta or alpha. Generally, a higher R-squared will indicate a more useful beta figure. If the R-squared is lower, thenthe beta is less relevant to the fund's performance.
Realized tracking error (also called active risk) is a measure of the actual deviation from the benchmark.
Return on Equity (ROE) represents the amount of net income returned as a percentage of shareholders equity. Return on equitymeasures a corporation's profitability by revealing how much profit a company generates with the money shareholders haveinvested. ROE can be one measure of quality of a company.
Sharpe Ratio is calculated by using standard deviation and excess return to determine reward per unit of risk. The higher theSharpe ratio, the better the portfolio's historical risk-adjusted performance.
Standard Deviation is a statistical measurement of dispersion about an average and depicts how widely a portfolio's returnsvaried over a certain period of time. When a portfoliohas a high standard deviation, the predicted range of performance is wide,implying greater volatility.