italian trade commission webinar canada – december 9, 2014 gs global solutions
TRANSCRIPT

Canadian Automotive Industry Overview
Italian Trade CommissionWebinar Canada – December 9, 2014GS Global Solutions

GS Global Solutions
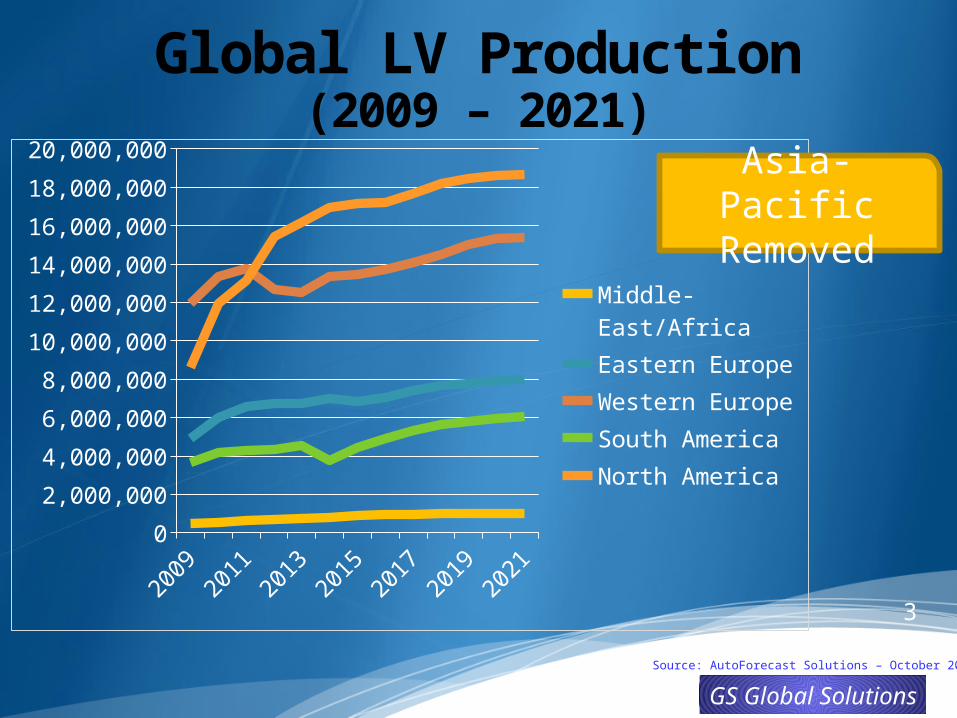
Global LV Production(2009 – 2021)
20092010
20112012
20132014
20152016
20172018
20192020
20210
10,000,00020,000,00030,000,00040,000,00050,000,00060,000,00070,000,000
Middle-East/AfricaAsia-PacificEastern EuropeWestern EuropeSouth AmericaNorth America
Region 2013 (Mil) 2021 (Mil) 2021 VS. 2013 Growth 2021 vs. 2009 CAGR 2021 vs. 2013 CAGR
NA 16.18 18.69 15.5% 6.7% 1.8%
SA 4.57 6.08 33.2% 4.3% 3.6%
WE 12.54 15.40 22.9% 2.1% 2.6%
EE 6.76 8.00 18.5% 4.2% 2.1%
AP 43.48 58.43 34.4% 6.0% 3.8%
ME/A 0.75 1.03 38.1% 6.9% 4.1%
TOTAL 84.26 107.62 27.7% 5.2% 3.1%
Source: AutoForecast Solutions – October 2014
2021 = 107.6 Million
GS Global Solutions
Global LV Production(2009 – 2021)
20092011
20132015
20172019
20210
2,000,000
4,000,000
6,000,000
8,000,000
10,000,000
12,000,000
14,000,000
16,000,000
18,000,000
20,000,000
Middle-East/AfricaEastern EuropeWestern EuropeSouth AmericaNorth America
3
Source: AutoForecast Solutions – October 2014
Asia-Pacific Removed

GS Global Solutions
New NAFTA Environmental RegulationsSmaller, lighter vehicles, with upgraded fuel-efficient powertrains.
Will people want to drive much smaller vehicles? Will vehicle profit be high enough to justify investment?2017-2025 standards require a 65% improvement in fuel economy over current levels.
Higher consumer ownership and operating cost. Will consumers accept paying more … possibly much more … for transportation?How de we as suppliers support global platforms and still look after local business opportunities?
4
NAFTA Megatrends

GS Global Solutions
Key drivers, enablers and constraints2013 2014-16
Employment/Income Growth
Driving Age Population Growth
Age of Fleet
Ownership and Operating Cost
Affluence/Financial Stability
Technology
Fuel Economy Regs
Supply Chain Constraints
5Source: AutomotiveCompass
NAFTA Auto Outlook

GS Global Solutions
NAFTA LV Production(2009 – 2021)
20092010
20112012
20132014
20152016
20172018
20192020
20210
5,000,000
10,000,000
15,000,000
20,000,000
United StatesMexicoCanada
Region 2013 (Mil) 2021 (Mil) 2021 VS. 2013 Growth 2021 vs. 2009 CAGR 2021 vs. 2013 CAGR
Canada 2.37 1.80 -24.0% 1.7% -3.4%Mexico 2.93 4.33 48.2% 9.1% 5.0%
United States 10.88 12.55 15.3% 6.9% 1.8%TOTAL NA 16.18 18.68 15.5% 6.7% 1.8%
6
Source: AutoForecast Solutions – October 2014

GS Global Solutions
NAFTA LV Production(2009 – 2021)
20092010
20112012
20132014
20152016
20172018
20192020
20210%
10%
20%
30%
40%
50%
60%
70%
80%
90%
100%
United StatesMexicoCanada
7
18.7M (2021)
Canada NAFTA Market Share Declining
17.1%9.6%
Source: AutoForecast Solutions – October 2014

GS Global Solutions
NAFTA LV Production(2009 – 2021)
20092010
20112012
20132014
20152016
20172018
20192020
20210
2,000,000
4,000,000
6,000,000
8,000,000
10,000,000
12,000,000
14,000,000
CanadaMexicoUnited States
8
Continued gap
increase
Source: AutoForecast Solutions – October 2014

GS Global Solutions
NAFTA LV Production(2009 – 2021)
20092011
20132015
20172019
20210
2,000,0004,000,0006,000,0008,000,000
10,000,00012,000,00014,000,00016,000,00018,000,00020,000,000
Canada MichiganSouthern US MexicoRest of NA
9
Mexico growing at the expense of Canada
Region 2013 2021
Canada 14.7% 9.6%
Michigan &Southern US
40.0% 40.7%
Mexico 18.1% 23.2%
Rest of United States
27.3% 26.5%
Source: AutoForecast Solutions – October 2014

GS Global Solutions
Canadian Production Facilities5 Major OEMS – GM, Ford, Chrysler, Honda and ToyotaGM – 2 plants in Oshawa (Camaro, Regal, Impala, XTS), CAMI Facility in Ingersoll (Equinox/Terrain)Ford – Oakville (Edge, MKX, Flex, MKT), St. Thomas (Crown Vic, Grand Marquis, Town Car – closed Sep 11)Chrysler – Brampton (300C, Charger, Challenger, Lancia Thema), Windsor (Caravan, T&C, Lancia GV, Routan)Toyota – Cambridge (RX, Corolla, Matrix), Woodstock (RAV4)Honda – Alliston 1 & 2 (Civic, CR-V)

GS Global Solutions
Canadian LV Production(2009 – 2021)
20092010
20112012
20132014
20152016
20172018
20192020
20210
500,000
1,000,000
1,500,000
2,000,000
2,500,000
ToyotaHondaGMFordFiat-Chrysler
11
VM 2013 2021 Volume Diff (2021 vs. 2013)
Fiat-Chrysler 572K 557K -15KFord 258K 246K -12KGM 627K 133K -494K
Honda 408K 394K -14KToyota 505K 470K -35KTOTAL 2,371K 1,773K -570K
Source: AutoForecast Solutions – October 2014

GS Global Solutions
Top20 Country Ranking – 2013-20212013 Rank 2013 Volume 2021 Rank 2021 Volume
China 20,905,245 China 32,157,310United States 10,884,072 United States 12,327,504
Japan 9,194,394 Japan 9,719,592Germany 5,650,674 Germany 6,176,447
South Korea 4,463,220 India 5,472,900India 3,674,104 Brazil 4,839,542Brazil 3,489,242 South Korea 4,677,959
Mexico 2,925,621 Mexico 4,395,016Thailand 2,651,035 Thailand 2,989,325Canada 2,370,493 Spain 2,844,354Spain 2,019,361 Russia 2,362,894Russia 1,909,115 France 2,144,283France 1,722,558 United Kingdom 1,929,163
United Kingdom 1,519,230 Indonesia 1,841,158
Indonesia 1,134,732 Canada 1,772,480Turkey 1,089,132 Czech Republic 1,398,801
Czech Republic 1,071,936 Turkey 1,261,532Slovakia 866,594 Italy 1,147,945
Argentina 781,940 Slovakia 1,005,616Italy 647,521 Argentina 880,392
12
<3 positions moved UP 3+ position moves UP
<3 positions moved DOWN 3+ position moves DOWN
No Change
10
15
Source: AutoForecast Solutions – July 2014

GS Global Solutions
Sales of Canadian-Assembled AP Vehicles
HondaThru October 2014
70% of domestic Honda car sales are Canadian-built.62% of domestic Honda Light Trucks are Canadian-built.
ToyotaThru October 2014
61% of domestic Toyota car sales are Canadian-built.40% of domestic Toyota Light Trucks are Canadian-built.
LexusThru October 2014
88% of domestic Lexus Light Trucks are Canadian-built.
Source: Global Automakers of Canada (GAC)– October 2014

GS Global Solutions
Canada: Production RiskFrom most stable to most risky
Honda/ToyotaProduction supports NAFTA consumptionOnly location for RAV4 production in NAFTAStrong domestic supply chain
FordOakville ONLY source of Edge, Flex, MKT, MKXNew investment in global Edge program
FCAWindsor only source for MinivansBramalea only source for Challenger, Charger, 300 (NAFTA)
GMAll Canadian-built vehicles can be built elsewhere!Equinox – 4 Locations in NAFTATerrain - 2 locations in NAFTA; exiting Canada in 2017Camaro – LEAVING Canada Prod in late 2015Regal – LEAVING Canada Prod 2017Impala – LEAVING Canada Prod late 2019XTS – Replaced by LTS in 2016/2017 (Hamtramck/China)
Source: AutoForecast Solutions – July 2014

GS Global Solutions
Top 20 Country Analysis(2013 vs. 2021)
ChinaUnited States
JapanGermany
South KoreaIndia
BrazilMexico
ThailandCanada
SpainRussiaFrance
United KingdomIndonesia
TurkeyCzech Republic
SlovakiaArgentina
Italy
0 20,000,000
2021 2013
South Korea (#7)
India (#5)
Brazil (#6)
Canada (#15)
Spain (#10)
Russia (#11)
France (#12)
United Kingdom (#13)
Indonesia (#14)
Turkey (#17)
Czech Republic (#16)
Slovakia (#19)
Argentina (#20)
Italy (#18)
-5 -4 -3 -2 -1 0 1 2
2021 Ranking Moves
15
Source: AutoForecast Solutions – October 2014

GS Global Solutions
Canadian Complete Vehicle vs. Parts Exports

GS Global Solutions
Why is Canada the best place in the G7 to do business?
Strongest Economic Growth in the G7
The Soundest Banking System in the World
The Lowest Business Costs in the G7
1 The International Monetary Fund. World Economic Outlook April 2010.2 The World Economic Forum. The Global Competitiveness Report 2010 - 2011.3 KPMG. Competitive Alternatives 2010.

GS Global Solutions
Connected Vehicle
CUTACanadian Urban
Transit Association
ITS CanadaIntelligent
Transportation Systems
APMAAutomotive Parts
Manufacturers
AcademiaUniversity
Researchers
Government
Federal & Provincial
CTA – OTACanadian & Ontario
Trucking Associations
EMCElectric Mobility
CanadaFirst
RespondersPolice/ Fire/Ambulance
Canadian Connected Vehicle Expertise

GS Global Solutions
6. Supply-Chain Transformation
1. Customer Facing Focus
Increasingthe Value
of theBusiness
10. Core Competencies
9. Systems & Modules
8. Globalization
7. Resource Pressure
2. Growth
3. Cost Reduction
4. Technology
5. Brand Management
Global Supplier Trends