it sector update - mailers.sparkcapital.inmailers.sparkcapital.in/uploads/daily/sector...
TRANSCRIPT

IT Sector Update Sector Outlook
Neutral
Stock performance (%)
1m 3m 12m
CNXIT (0.3) (10.3) 23.6
Sensex (2.3) (8.2) 3.5
Date June 10, 2015
Market Data
SENSEX 26482
Nifty 8022
CNX IT 11143
Relative performance
Impact of Redefining Demand environment
In this report, we discuss three themes: Digital, Rebirth of Captives and attrition. We believe these three themes
are intertwined and drive each other. Digital has been a buzzword in the sector over the last couple of years and
this shift is being driven by rapid changes in technology. The key differentiator for vendors in Digital would be
their ability to demonstrate deep domain knowledge and build use case, thus favouring firms which has higher
consultative approach to selling. Companies under our coverage are investing significantly to beef up their
capabilities resulting in increased cost in people and capability development. Number of global corporations are
increasingly leveraging technology to drive their competitive advantage and this decision is driving higher
usage of captives especially in newer areas of spend “Change the business”. Coupled with increased
compliance requirements especially in BFS, we believe captives are back in vogue. A combination of increased
competitive pressure, growth of captives and weakness in select verticals such as Oil & Gas and Retail would
result in constant currency revenue growth of 10-11% for FY16E. We retain our preference for large-caps in the
sector with TCS and Wipro being our top picks.
Digital a double edged sword for vendors: Companies especially with high consumer interaction are adopting digital
technologies in a hurry, with some of the companies relying on vendors while others such as Tesco, Target and Wal-
Mart are using in-house capabilities. Even companies, which have existing vendors, are leaning in favour of vendors
with not only strong technological capability but also deep domain knowledge and ability to deliver outcomes such as
better customer satisfaction, higher revenues or lower costs. Vendors are investing significant resources to partner with
clients in their chosen verticals.
Rise of Captives: Our channel checks indicate increased activity from captive centres in India especially in BFS
vertical. The common thread across these captives are in two areas: 1) Incremental discretionary spend in digitizing
their business process or to drive better insights into customers 2) Activities focused on regulatory reporting and
compliance in BFS.
Spike in attrition: Industry level attrition is at four year high led by strong growth in captives rapid growth in
ecommerce and increased start up activity in India. Traditionally increased attrition has been correlated with better
revenue growth, however we do not subscribe to this view for FY16E/FY17E. Higher attrition and fight for talent would
impact offshore costs for vendors.
TCS and Wipro top picks: Large-caps are our preferred ownership in the sector especially TCS and Wipro led by
diversified business and attractive risk reward. We would continue to stay away from mid caps as the risk reward
continues to be unattractive with low growth differential. Also, we believe companies (like Persistent) which have
technical capabilities and weak domain expertise would face strong revenue headwinds in the coming years
SRIVATHSAN RAMACHANDRAN, CFA [email protected] +91 44 4344 0039
AISHWARIYA KPL [email protected] +91 44 4344 0040 Find Spark Research on Bloomberg (SPAK <go>),
Thomson First Call, Reuters Knowledge and Factset
Page 1
Sector Update
-10%
0%
10%
20%
30%
40%
50%
Jun-1
4
Aug-1
4
Oct-
14
Dec-1
4
Feb-1
5
Apr-
15
Jun-1
5
Sensex Index
CNXIT Index

IT Sector Update Sector Outlook
Neutral
Page 2
IT coverage universe
* * Dec end FY16E refers to CY15E; *** June end, * adjusted for treasury shares
Financial summary
P/E EV/EBITDA EV/sales
Company CMP Rs. TP Rs. Rating FY15P FY16E FY17E FY15P FY16E FY17E FY15P FY16E FY17E
Cyient 530 550 Add 16.8 15.1 13.5 12.9 9.7 9.0 1.9 1.5 1.4
eClerx 1,562 1,140 Sell 21.0 18.3 17.8 16.2 13.2 13.2 5.4 4.9 4.6
Firstsource 29 45 Buy 8.8 7.0 6.1 5.5 4.5 3.4 0.7 0.6 0.5
HCL Tech*** 911 850 Reduce 17.0 17.4 16.5 12.7 12.3 11.4 3.2 2.9 2.6
Hexaware** 277 240 Reduce 25.6 19.8 17.9 16.2 13.8 13.0 3.0 2.6 2.3
Infosys 1,992 2,060 Add 18.5 18.3 17.4 13.6 12.6 11.7 3.8 3.5 3.1
KPIT 104 120 Reduce 8.7 8.6 7.5 6.3 5.1 4.6 0.7 0.7 0.6
Mindtree 1,356 940 Sell 21.4 21.2 20.2 15.3 13.8 12.9 3.0 2.6 2.3
Mphasis 372 330 Reduce 11.6 11.7 11.3 6.8 6.6 5.8 1.1 1.0 0.9
NIIT Tech 387 370 Reduce 20.7 12.8 10.5 8.8 5.6 5.7 0.9 0.8 0.8
Persistent 748 560 Sell 20.6 20.3 18.8 13.7 11.9 11.0 2.8 2.5 2.2
TCS 2,562 2,590 Add 25.5 22.4 20.8 17.7 16.1 15.0 5.1 4.6 4.2
Tech Mahindra* 541 560 Add 18.1 16.3 14.6 12.1 11.4 10.3 2.2 1.9 1.7
Wipro 544 620 Add 15.5 14.6 14.2 11.4 10.1 9.4 2.6 2.4 2.1
Intellect 101 140 Buy NM NM 87.8 NM NM 73.4 0.9 0.8 0.8
IT Sector Update Sector Outlook
Neutral
Page 3
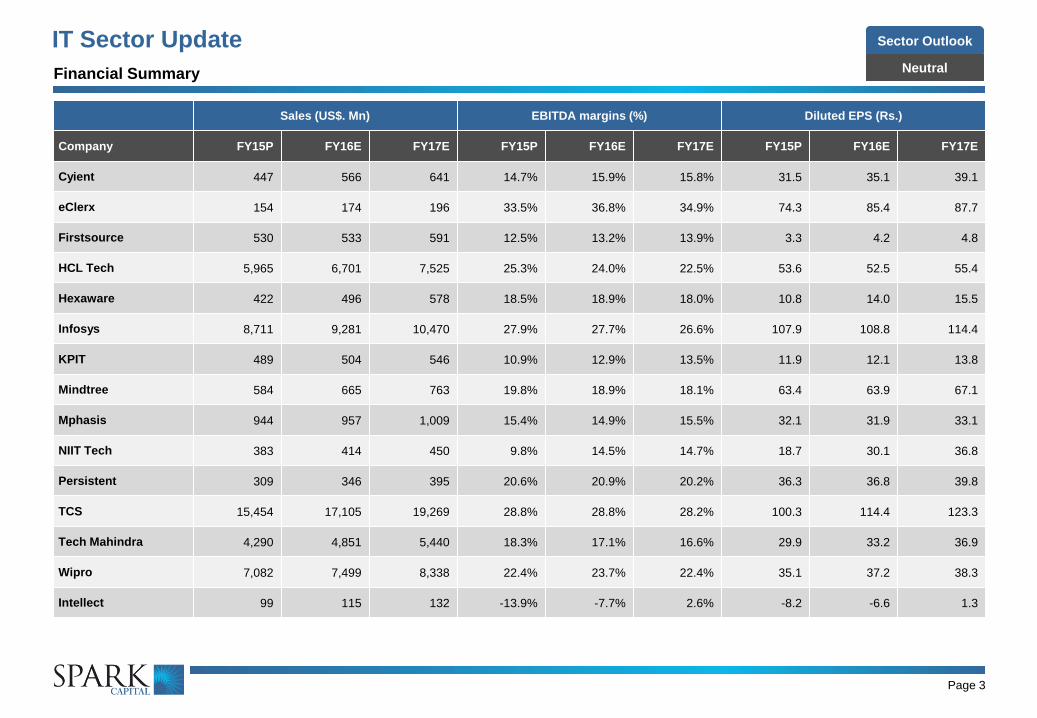
Sales (US$. Mn) EBITDA margins (%) Diluted EPS (Rs.)
Company FY15P FY16E FY17E FY15P FY16E FY17E FY15P FY16E FY17E
Cyient 447 566 641 14.7% 15.9% 15.8% 31.5 35.1 39.1
eClerx 154 174 196 33.5% 36.8% 34.9% 74.3 85.4 87.7
Firstsource 530 533 591 12.5% 13.2% 13.9% 3.3 4.2 4.8
HCL Tech 5,965 6,701 7,525 25.3% 24.0% 22.5% 53.6 52.5 55.4
Hexaware 422 496 578 18.5% 18.9% 18.0% 10.8 14.0 15.5
Infosys 8,711 9,281 10,470 27.9% 27.7% 26.6% 107.9 108.8 114.4
KPIT 489 504 546 10.9% 12.9% 13.5% 11.9 12.1 13.8
Mindtree 584 665 763 19.8% 18.9% 18.1% 63.4 63.9 67.1
Mphasis 944 957 1,009 15.4% 14.9% 15.5% 32.1 31.9 33.1
NIIT Tech 383 414 450 9.8% 14.5% 14.7% 18.7 30.1 36.8
Persistent 309 346 395 20.6% 20.9% 20.2% 36.3 36.8 39.8
TCS 15,454 17,105 19,269 28.8% 28.8% 28.2% 100.3 114.4 123.3
Tech Mahindra 4,290 4,851 5,440 18.3% 17.1% 16.6% 29.9 33.2 36.9
Wipro 7,082 7,499 8,338 22.4% 23.7% 22.4% 35.1 37.2 38.3
Intellect 99 115 132 -13.9% -7.7% 2.6% -8.2 -6.6 1.3
Financial Summary

IT Sector Update Sector Outlook
Neutral
Page 4
Our current estimates assumes Rs./$ rate of Rs.60.8/$ for FY16E & Rs.58/$ for FY17E. Given below is the EPS sensitivity analysis at various rates
Source: Spark Capital Research
Company Name
FY16E EPS FY17E EPS
Rs.60/$ Rs.62/$ Rs.64/$ Rs.58/$ Rs.60/$ Rs.62/$
Cyient 35.1 37.2 39.0 39.1 41.5 43.6
eClerx 85.4 91.8 97.1 87.7 94.5 100.2
HCL Tech 52.5 55.7 58.4 55.4 58.8 61.7
Hexaware 14.0 14.7 15.4 15.5 16.3 17.0
Infosys 108.8 115.4 121.0 114.4 121.5 127.6
KPIT 12.1 12.8 13.4 13.8 14.7 15.4
Mindtree 63.9 68.2 71.5 67.1 71.7 75.3
Mphasis 31.9 33.5 34.8 33.1 34.8 36.2
NIIT Tech 30.1 31.8 33.1 36.8 38.9 40.6
Persistent 36.8 39.4 41.4 39.8 42.7 44.9
TCS 114.4 121.2 127.1 123.3 130.9 137.5
Tech Mahindra 33.2 35.2 36.9 36.9 39.2 41.2
Wipro 37.2 39.4 41.4 38.3 40.6 42.7
IT Sector Update Sector Outlook
Neutral
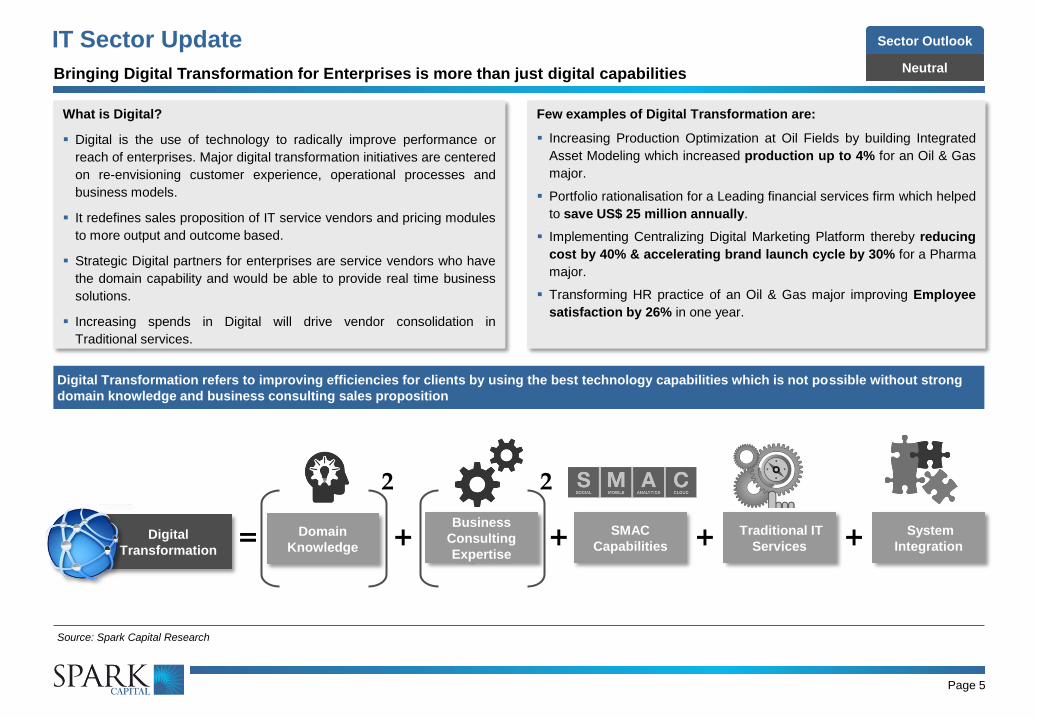
Digital Transformation refers to improving efficiencies for clients by using the best technology capabilities which is not possible without strong
domain knowledge and business consulting sales proposition
Source: Spark Capital Research
Page 5
Digital
Transformation
SMAC
Capabilities
Traditional IT
Services
System
Integration = + + + + Domain
Knowledge
2
Business
Consulting
Expertise
2
What is Digital?
Digital is the use of technology to radically improve performance or
reach of enterprises. Major digital transformation initiatives are centered
on re-envisioning customer experience, operational processes and
business models.
It redefines sales proposition of IT service vendors and pricing modules
to more output and outcome based.
Strategic Digital partners for enterprises are service vendors who have
the domain capability and would be able to provide real time business
solutions.
Increasing spends in Digital will drive vendor consolidation in
Traditional services.
Few examples of Digital Transformation are:
Increasing Production Optimization at Oil Fields by building Integrated
Asset Modeling which increased production up to 4% for an Oil & Gas
major.
Portfolio rationalisation for a Leading financial services firm which helped
to save US$ 25 million annually.
Implementing Centralizing Digital Marketing Platform thereby reducing
cost by 40% & accelerating brand launch cycle by 30% for a Pharma
major.
Transforming HR practice of an Oil & Gas major improving Employee
satisfaction by 26% in one year.
Bringing Digital Transformation for Enterprises is more than just digital capabilities

IT Sector Update Sector Outlook
Neutral Case study explaining how Digital solution is a bundled offering
Page 6
Digital (Big Data Analytics) Case Study: How Infosys helped a US
based Pharmacy Retailer to reduce shrink by 5%
Background:
A US based pharmaceutical retailer which operates more than 5,000 stores
globally. The client had challenges with the existing loss prevention
management system. Large scale of operations and disparate data
sources slowed their ability to take informed, timely decisions which further
affected their ability to reduce losses across all its stores.
Business Need:
A solution which enables management of unwarranted losses arising from
theft, wastage and poor inventory management (commonly known as
shrink) and improve profitability with the existing hardware infrastructure.
Notably, these losses are close to 1% of the overall revenue in the retail
industry and the average net profitability is also 1%, which means
profitability will be a washout if losses are not arrested.
IT Solution:
1. A centralised data repository which stores data in structured data model
2. Alert based reporting capabilities which uses consolidated data from all
sources including POS data, stock ledger data, store data, master data
etc.
3. Advanced analytics to track and manage losses at store and SKU level
and project data for future analysis.
Outcome achieved:
1. Client was able to identify additional losses prevention cases which
reduced the losses by 5%
2. Time taken to identify a “case” reduced from 6-8 weeks to less than a
week while time taken for data mining reduced from 4-6 weeks to less
than a week.
Case Process chart shows how Digital offering is a bundled product of
traditional IT services with Analytics services
Source: Company, Spark Capital Research
Page 6
Data Collection
Streamlining of Data
Creating Repository of Consolidated Data
Data Validation & Testing
Analytics on Collected Data
Creation of Virtual Store Setup
Creation of Similar User Interface Across all
System
Communication among all servers to fetch real-
time data
Modeling existing data for future analysis on
real-time basis (e.g. Inventory loss, Mismatch)
Generating reports on consistent basis
Data
Warehousing
Testing
Data
Analytics
Digital
User Interface
Digital
User Interface
System
Integration
Data
Analysis
BPO
In memory for processing real-time data Storage &
Services
Source: http://www.infosys.com/industries/retail/casestudies/Documents/loss-prevention-
pharmacy-retailer.pdf

IT Sector Update Sector Outlook
Neutral
Digital or SMAC is a new layer complemented by Traditional IT services. We subscribe to TCS, CTSH and INFY’s view that
Digital revenues can’t be quantified separately as deals won are bundled with Traditional IT services.
Going ahead, growth in Digital services will drive growth in Traditional IT services as well.
Page 7
Digital is not a Standalone
Service
Digital offerings begin as pilot projects or as proof of concept to an existing client. As these deals materialize and gain scale,
service providers get upgraded as strategic Digital partners and scale up market share with the client. With increasing budget
allocations to Digital, companies would reduce the budgets for Traditional IT services. This would drive vendor
consolidation across major accounts in the medium term.
Digital Transformation
Projects Would Drive Vendor
Consolidation in Traditional IT
services
When Digital moves from peripheral to core processes of companies the differentiation for the IT service vendor is not only in
Digital capabilities but also domain expertise and consulting acumen.
Vertical strength differs across companies and large caps (including CTSH, ACN, CapGemini) are more strongly positioned
given their traditional consulting practice.
Vishal Sikka’s recent initiative of increasing collaborative efforts of consultants & sales managers of Traditional IT services
would aid Infosys in winning more deals & other companies would follow suit.
We believe companies (like Persistent) which have technical capabilities and weak domain expertise would face
strong revenue headwinds in the coming years
Digital transforms sales
proposal from an IT service
proposition to business
consulting proposition
Pricing from Traditional services would continue to decline for all companies.
It would not be surprisingly to see sharp pricing decline for ISPs (like Infosys 4QFY15) in the near term.
Lower realisations will bring in cost rationalisation across ISPs and we would see decline in travel expenses, pyramid
rationalisation and sharp increased in utilisation in the near term.
Channel checks indicate there are price cuts of 5%-15% across some verticals.
Pricing would become
increasingly become more
outcome and output based
from fixed and T&M
We will see business consulting firms (like McKinsey, Deloitte Bain, BCG, Booz etc.) developing IT capabilities either
by organically or inorganically (acquisitions or by strategic partnerships).
Strategic partnerships with consulting firms would be a win win situation for mid cap service providers who have limited domain
expertise or Digital capabilities
Deloitte is the strong growing contender in both spaces. Deloitte IT services had a CAGR of 9.5% in the last six years and is a
US$ 17.5 bn entity (FY14)
Differentiation between IT
service providers and
consulting firms would
become minimal
Digital Transformation: Key pointers
CTSH – Cognizant; ACN - Accenture
IT Sector Update Sector Outlook
Neutral
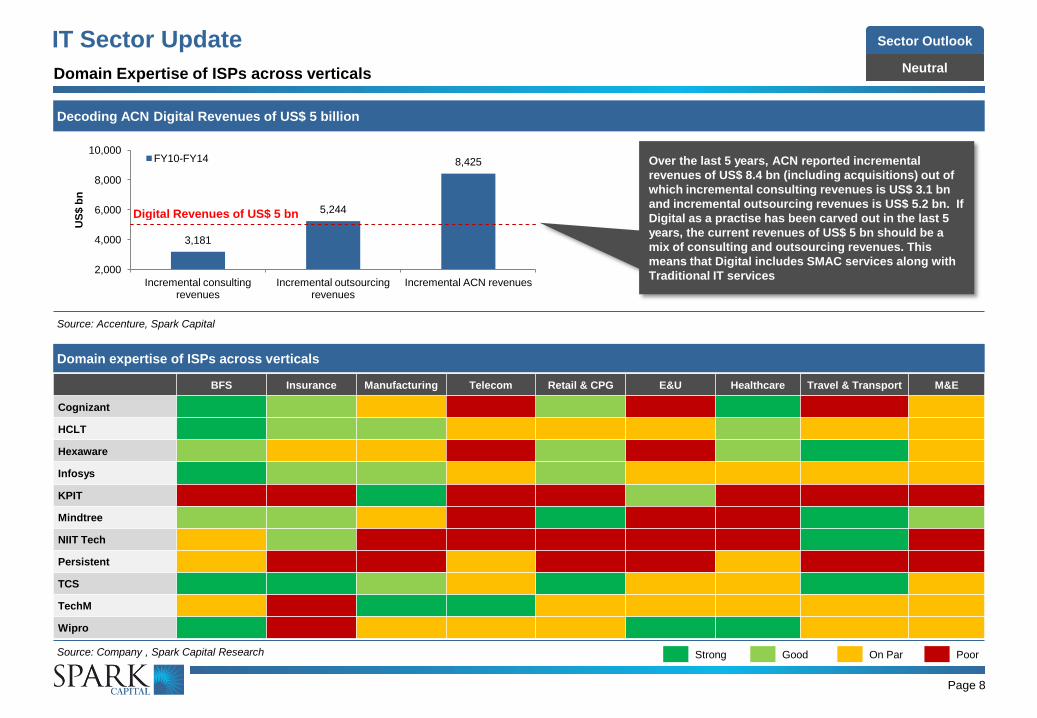
Domain expertise of ISPs across verticals
Source: Company , Spark Capital Research
Page 8
Decoding ACN Digital Revenues of US$ 5 billion
Source: Accenture, Spark Capital
Over the last 5 years, ACN reported incremental
revenues of US$ 8.4 bn (including acquisitions) out of
which incremental consulting revenues is US$ 3.1 bn
and incremental outsourcing revenues is US$ 5.2 bn. If
Digital as a practise has been carved out in the last 5
years, the current revenues of US$ 5 bn should be a
mix of consulting and outsourcing revenues. This
means that Digital includes SMAC services along with
Traditional IT services
3,181
5,244
8,425
2,000
4,000
6,000
8,000
10,000
Incremental consulting revenues
Incremental outsourcing revenues
Incremental ACN revenues
US
$ b
n
FY10-FY14
Digital Revenues of US$ 5 bn
Strong Good On Par Poor
Domain Expertise of ISPs across verticals
BFS Insurance Manufacturing Telecom Retail & CPG E&U Healthcare Travel & Transport M&E
Cognizant
HCLT
Hexaware
Infosys
KPIT
Mindtree
NIIT Tech
Persistent
TCS
TechM
Wipro

IT Sector Update Sector Outlook
Neutral
Deloitte: The silent competitor whose inherent strength could pose
huge risks to ISPs
Deloitte is one the most reputed consultancy firms which provides audit,
consulting, financial advisory, tax related services and enterprise risk
services to various clients worldwide.
As of FY14, Deloitte had revenues of US$ 34.2 bn out of which US$
17.5 bn revenues are from IT services. This segment grew at a CAGR
of 9.5% over the last six years.
Given strong Digital capabilities and domain expertise, Deloitte has
been winning significant deals in the tech space. Strengthening foothold
of Deloitte could pose huge risks to traditional IT services firms.
Deloitte IT services revenue grew at a CAGR of 9.5% over the last 6
years
Source: Bloomberg, Spark capital
Deloitte IT services is the Fifth largest company (by revenues) in the
Tech space
Source: NASSCOM, Company
Deloitte: The silent competitor whose inherent strength could pose huge risks to ISPs
Page 9
Deloitte capabilities in the emerging service lines as rated by third
party consultants:
Global Leader in Analytics IT consulting – Kennedy consulting research
and advisory
Worldwide Leader in business consulting Service – IDC Marketscape
Leader in Business Intelligence in Asia Pacific - Forrester Research
Global leader in HR process consulting – Kennedy consulting research
and advisory
Leader in Life science sector consulting - Kennedy consulting research
and advisory
Leader in mobility IT and strategy Consulting - Kennedy consulting
research and advisory
10.7%
14.9%
10.9% 5.1%
6.2%
0.0%
4.0%
8.0%
12.0%
16.0%
0
4,000
8,000
12,000
16,000
20,000
2010 2011 2012 2013 2014
US
$ m
n
Revenues YoY Growth
56.4
32.5 29.0
18.9 17.5
0
10
20
30
40
50
60
IBM Global Services
HP Services Accenture PLC
Fujitsu Ltd Deloitte Consulting
LLP
US
$ b
n
ISP – Indian service provider

IT Sector Update Sector Outlook
Neutral
Page 10
Disruptions is happening at all layers of IT stack whether it is Servers, Storage, Software, Network or Applications
Source: Company , Spark Capital Research
Professional
Services
Professional
Services
Professional
Services
Professional
Services
Professional
Services
Applications
Data
Runtime
Middleware
O/S
Virtualization
Servers
Storage
Networking
Applications
Data
Runtime
Middleware
O/S
Virtualization
Servers
Storage
Networking
Applications
Data
Runtime
Middleware
O/S
Virtualization
Servers
Storage
Networking
Applications
Data
Runtime
Middleware
O/S
Virtualization
Servers
Storage
Networking
Applications
Data
Runtime
Middleware
O/S
Virtualization
Servers
Storage
Networking
Four disruptions to traditional IT services – SaaS, IaaS, PaaS, BPaaS
On-Premises Infrastructure as a
Service
Platform as a
Service
Software as a
Service
Business Process
as a service
Managed by the Enterprise either in-house or outsourced Managed by cloud vendors
IT Sector Update Sector Outlook
Neutral
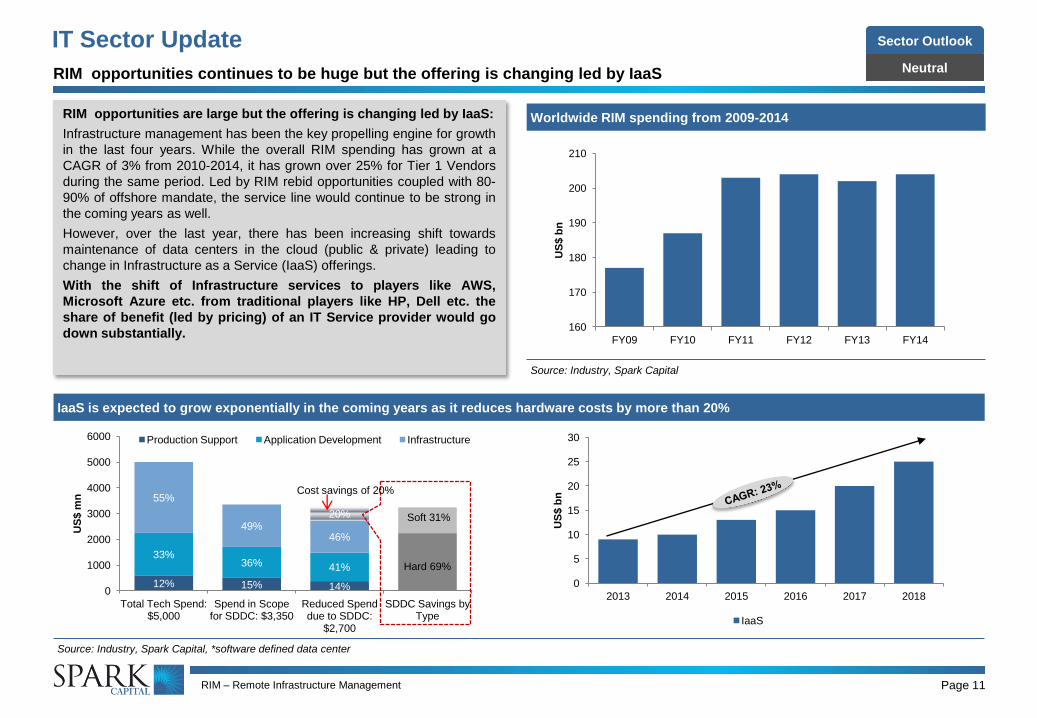
RIM opportunities are large but the offering is changing led by IaaS:
Infrastructure management has been the key propelling engine for growth
in the last four years. While the overall RIM spending has grown at a
CAGR of 3% from 2010-2014, it has grown over 25% for Tier 1 Vendors
during the same period. Led by RIM rebid opportunities coupled with 80-
90% of offshore mandate, the service line would continue to be strong in
the coming years as well.
However, over the last year, there has been increasing shift towards
maintenance of data centers in the cloud (public & private) leading to
change in Infrastructure as a Service (IaaS) offerings.
With the shift of Infrastructure services to players like AWS,
Microsoft Azure etc. from traditional players like HP, Dell etc. the
share of benefit (led by pricing) of an IT Service provider would go
down substantially.
Worldwide RIM spending from 2009-2014
Source: Industry, Spark Capital
IaaS is expected to grow exponentially in the coming years as it reduces hardware costs by more than 20%
Source: Industry, Spark Capital, *software defined data center
Page 11
RIM opportunities continues to be huge but the offering is changing led by IaaS
12% 15% 14%
33% 36% 41%
55%
49% 46%
20%
0
1000
2000
3000
4000
5000
6000
Total Tech Spend: $5,000
Spend in Scope for SDDC: $3,350
Reduced Spend due to SDDC:
$2,700
SDDC Savings by Type
US
$ m
n
Production Support Application Development Infrastructure
Hard 69%
Soft 31%
Cost savings of 20%
160
170
180
190
200
210
FY09 FY10 FY11 FY12 FY13 FY14
US
$ b
n
0
5
10
15
20
25
30
2013 2014 2015 2016 2017 2018
US
$ b
n
IaaS
RIM – Remote Infrastructure Management

IT Sector Update Sector Outlook
Neutral
Universe of Cloud Services
)
Source: Cap Gemini, Spark Capital
Revenue/Employee & margins of Standalone Platform BPO companies
Source: Spark Capital
CLOUD
UNIVERSE
SaaS
PaaS
En
ab
lem
en
t an
d
Pro
fessio
na
l S
erv
ices
IaaS
ERP
CRM
Security
Billing Document
Management Communication
and Collaboration Business
Intelligence Digital
Content
Creation
Content
Management
Desktop
Productivity
Consulting
Maintenance
and Support
Wholesale
Capacity
White Label
Services
Cloud
Broker
System
Integration
Disaster
Recovery
Hosting on
Demand
Service
Management
Storage
on Demand
Testing and
Development
Compute
on Demand
Backup
Services
Virtual
Servers
App Server
Database
Integration
Middleware
Network Assets Object Data Stores
Message Queues
Application Development
Environment
SCM
BPaaS would become increasingly popular in the BPO space:
With the increase adoption of SMAC, As-a-Service business proposition
has become very popular and better defined. Subscription based models in
SaaS is extending to Pay as you use and Pay per transaction (in PaaS and
IaaS) respectively. However, this business proposition is not entirely a new
concept as Standalone BPO platforms entities especially in payments
processing, payrolls, procurement etc. has been working on these modules
for the last 10 years. These business operate at an healthy EBITDA
margins of ~30% and have better Rev/employee metrics than both IT and
BPO players. With domain based BPO to continue on a strong growth
trajectory, BPaaS would grow better than legacy outsourcing in the coming
years.
Among ISPs, large caps (TCS, Infosys & Wipro, CTSH) have strong
BPO platforms, with TCS Diligenta earning the largest revenue
amongst all. However, IT mid caps doesn't have scalable BPO
platforms and we believe this would reduce BPO growth in mid caps
in 2-3 year timeframe.
As a service business proposition would replace legacy outsourcing
Page 12
EBITDA margins (%) Rev/employee ('000)
Paychex Inc. 43% 198
ADP 22% 200
FIS 30% 160
Fiserv Corp. 32% 241
Global payment Inc. 21% 618
Jack Henry & Associates 35% 235

IT Sector Update Sector Outlook
Neutral
Industry wise attrition remains at an all time high despite tepid
revenue growth
Source: Company, Spark Capital, *includes cognizant and excludes Mphasis, TechM & KPIT
With SMAC gaining momentum, the number of start-ups incorporated
in India is on the rise and expected to quadruple by 2020
Source: NASSCOM, Company
29.0
%
23.8
%
11.4
%
14.1
%
11.9
%
19.9
%
14.6
%
15.6
%
17.4
%
18.0
%
0%
5%
10%
15%
20%
25%
30%
35%
FY11 FY12 FY13 FY14 FY15
US$ revenue growth Attrition (%)
Industry wise attrition – led by change in market dynamics while
overall demand environment continues to be stable:
Historically, sharp increase in attrition among ISPs used to be a leading
indicator for better revenue growth. However, in the last six quarters,
though attrition has increased more than 200 bps across companies,
demand commentary continues to remain tepid. We believe FY16E
industry revenue growth would come in at the lower end of the
NASSCOM guided range of 11-13%.
The disconnect is primarily led by increase in the number of start-ups
especially in the SMAC space, strong hiring by captives with renewed
focus on insourcing and increase in involuntary attrition. Notably, sharp
increase in attrition not only point at supply side changes but also shift in
demand environment as well.
Industry level attrition at the highest level in the last 4 years
Page 13
Tech Start-ups employs around 65,000 to 75,000 people as of 2014:
India currently has more than 3,100 start-ups with 800+ start-ups added
in 2014. Led by the Digital & E-Commerce wave coupled with strong
funding by PE players & Tech giants, the start-up count is expected to
increase to 11,500+ by 2020, while the number of employees is expected
to move up to 2,50,0000 to 3,50,000 from the current 65,000-75,000.
Notably, more than 60% of these start-ups boosts of a decent presence in
either Big Data, App Development, Cloud or IoT space. The Top tier
among the start ups boosts of fortune 500 companies like Citi, AIG, P&G,
Microsoft, Pfizer, Novartis, Airbus, Boeing etc.
With increase in demand for niche services and strong access to capital,
start-ups could provide stiff competition in hiring limited talent (especially
in Digital).
480 525 590 680
805
2000
0
500
1000
1500
2000
2500
2010 2011 2012 2013 2014 2020

IT Sector Update Sector Outlook
Neutral
As of FY15, GIC contributes around US$ 27 bn of the total IT-BPM revenues (US$ 7.5 bn – IT, US$ 5.5 bn - BPM, US$ 14 bn – ER&D) and employs
around 10-15%, 20-25% and 55-60% of total employees in IT, BPM and ER&D segments respectively
Source: NASSCOM, Spark Capital
ISP 70-72%
GIC 10-15%
MNC 10-15%
ISP 60-65% GIC 20-25%
MNC 15-16%
ISP 28-35%
GIC 55-60%
MNC 10-12%
Page 14
Insourcing is gaining more steam across all verticals and this time it is different:
Our channel checks and media reports suggest insourcing is gaining more steam over the last two years with more than 70 companies setting up GICS in
India increasing the total number to 1,440+. Existing captives are aggressively increasing the headcount as well. The pickup in captive activity is seen
across verticals, largely skewed towards BFS and most of the captives are putting in capabilities to gain end-to-end ownership of products/processes.
Channel checks indicates gross hiring in captives could be around 2,00,000-2,50,000 for FY16E. We believe the change in trend from outsourcing to
insourcing is led by key structural changes in enterprises due to which we believe captives, this time, is here to stay forever. The changes include:
1. Technology is getting redefined as core competency with increased focus in Digital & Analytics investments. Companies prefer to establish their our
R&D centers rather than outsourcing to a third party vendor. E.g. Wal-Mart Labs established a tech centre in Bangalore to take on its E-commerce rival
Amazon.
2. During 2006-2010 period, most Indian captives were managed by employees of the parent company with less stringent processes on utilisation rates,
employee pyramid and cost structures which made outsourcing to a third party vendor more profitable. Today, most of the GICs are managed by ex-
veterans of ISP who have prior in hand experience in rationalizing pyramid, driving utilisation rates, offshore effort etc., which has made GICs more
profitable than outsourcing to ISPs.
3. With the recent data breach in some banks and a retail firm, companies have become increasingly reluctant to offshore work related to data
compliance, security and competitive differentiated offerings.
IT
Number of people employed by MNC, GIC & ISP as % of total employees in IT, BPM & ER&D segments
Insourcing is gaining more steam and this time it is different
BPM ER&D
GIC – Global In house center

IT Sector Update Sector Outlook
Neutral
Page 15
Interesting quotes on reasons for insourcing:
“Silicon Valley is coming. There are hundreds of start-ups with a lot of
brains and money working on various alternatives to traditional banking,
There is much for us to learn in terms of real-time systems, better
encryption techniques, and reduction of costs and ‘pain points’ for
customers” – Jamie Dimon, Chairman and CEO JP Morgan on
disruption technology.
“We are changing our technology DNA, because historically most of our
technology has been outsourced to third-party vendors. But now we’re like,
“hey we’ve got to build world-class capability”, because we are not
competing with an average technology company. We are competing with a
top technology company like, say, Amazon. It’s a technology company first
and a retailer second” – Naveen Kapoor, MD, Target India.
Snapshot of few insourcing activities across Global majors
Company Vertical/ Country of Origin Hiring Target Other Details
RBS BFSI/UK 5,600 (12 mths) Current strength: 14,000 Major hiring in Analytics (SaaS & SQL).
Citibank BFSI/US 3,500 Developing centers in Chennai & Pune, establishing management team
Astra Zeneca Pharma/UK 400 Center in Chennai, current strength 600 and plans to increase headcount to 2,500
Visa BFSI/US 2,000 Center in Bangalore, for development of key API and SDKs.
Danse Bank BFSI/Denmark 800 Establishing captive in Bangalore. Buying out employees of ITC Infotech, used to handle IT activities of
Danse Bank from 2006.
Daimler Auto/Germany 1,000 Center in Bangalore housing more than 2,300 people out of which 1,100 are part of IT team and
remaining are R&D engineers
Red Mart Retail/Singapore Development center in Bangalore for Analytics.
Cargill Food & Agri/US 650 Center in Bangalore, hired 120 people. Planning to increase the total strength to 1,000 overtime
MasterCard BFSI/US Center Baroda & Pune. To build mobility solutions such as Master-Pass
Source: Channel checks, News Articles, Spark Capital
Revenue and cost implications for ISPs led by captives
Implications for ISPs:
Ramp up in captive strength is revenue detrimental for ISPs especially for
companies which have large revenue contribution from a single client (E.g.
Polaris Consulting earns > 40% of revenues from Citi Bank) and for IT
service vendors who have a huge exposure to services like Risk &
Compliance, Security etc. E.g. Mphasis has a huge exposure to Risk &
Compliance activities of U.S banks.
Captives in India are scouting for the top talent especially in Digital areas
and are willing to pay top dollars for them. With these resources being
limited, strong demand can drive up salaries for Digital segments, posing
strong headwinds to margins.
IT Sector Update Sector Outlook
Neutral Disclaimer
Page 16
0
500
1000
1500
2000
1-May-12 1-Nov-12 1-May-13 1-Nov-13 1-May-14 1-Nov-14 1-May-15
Historical Target
eClerx
0
10
20
30
40
50
60
1-May-12 1-Nov-12 1-May-13 1-Nov-13 1-May-14 1-Nov-14 1-May-15
Historical Target
Firstsource Solutions
0
200
400
600
800
1000
1200
1-May-12 1-Nov-12 1-May-13 1-Nov-13 1-May-14 1-Nov-14 1-May-15
Historical Target
HCL Tech
Report Date CMP (Rs.) TP (Rs.) Recommendation
26/May/15 1,535 1,150 Sell
23/Mar/15 1,590 1,140 Sell
02/Feb/15 1,290 1,070 Sell
24/Nov/14 1,250 1,150 Sell
31/Oct/14 1,348 1,150 Sell
07/Oct/14 1,398 1,250 Sell
19/Aug/14 1,291 1,080 Sell
01/Aug/14 1,291 1,080 Sell
01/Jul/14 1,160 900 Sell
21/May/14 1,205 900 Sell
07/Apr/14 1,243 880 Sell
22/Jan/14 1,143 880 Sell
Report Date CMP (Rs.) TP (Rs.) Recommendation
20/Nov/13 1,160 880 Sell
25/Oct/13 937 880 Reduce
07/Oct/13 903 830 Reduce
23/Jul/13 798 760 Reduce
28/May/13 674 690 Reduce
28/Jan/13 633 660 Reduce
30/Oct/12 705 660 Reduce
31/Jul/12 693 660 Reduce
11/Jun/12 632 660 Sell
18/May/12 696 660 Sell
16/Mar/12 770 650 Sell
02/Mar/12 767 650 Sell
Report Date CMP (Rs.) TP (Rs.) Recommendation
06/May/15 32 45 Buy
23/Mar/15 28 45 Buy
25/Feb/15 32 45 Buy
09/Feb/15 32 45 Buy
24/Nov/14 37 46 Buy
17/Nov/14 40 46 Buy
07/Oct/14 41 52 Buy
19/Aug/14 38 45 Buy
02/Aug/14 37 45 Buy
01/Jul/14 41 36 Buy
05/May/14 33 36 Buy
07/Apr/14 28 36 Buy
Report Date CMP (Rs.) TP (Rs.) Recommendation
03/Feb/14 24 30 Buy
25/Nov/13 22 25 Buy
24/Oct/13 19 25 Buy
07/Oct/13 19 25 Buy
07/Aug/13 12 17 Buy
09/May/13 11 12 Add
20/Feb/13 11 11 Reduce
26/Oct/12 14 10 Sell
17/May/12 9 8 Reduce
Report Date CMP (Rs.) TP (Rs.) Recommendation
22/Apr/15 890 880 Reduce
23/Mar/15 980 880 Sell
02/Feb/15 897 840 Reduce
17/Dec/14 780 825 Reduce
24/Nov/14 817 790 Reduce
20/Oct/14 758 790 Reduce
07/Oct/14 870 838 Reduce
19/Aug/14 762 735 Reduce
04/Aug/14 758 735 Reduce
01/Jul/14 750 700 Reduce
21/Apr/14 713 700 Reduce
07/Apr/14 699 625 Sell
20/Jan/14 690 580 Sell
Report Date CMP (Rs.) TP (Rs.) Recommendation
02/Dec/13 531 490 Sell
28/Oct/13 540 605 Add
07/Oct/13 560 580 Add
01/Aug/13 469 500 Add
29/Apr/13 341 383 Add
05/Feb/13 341 355 Reduce
19/Oct/12 299 310 Reduce
26/Jul/12 257 255 Reduce
11/Jun/12 248 253 Reduce
19/Apr/12 252 253 Reduce
16/Mar/12 254 225 Reduce
02/Mar/12 243 225 Reduce
IT Sector Update Sector Outlook
Neutral Disclaimer
Page 17
0
50
100
150
200
250
300
350
1-May-12 1-Nov-12 1-May-13 1-Nov-13 1-May-14 1-Nov-14 1-May-15
Historical Target
Hexaware Report Date CMP (Rs.) TP (Rs.) Recommendation
04/May/15 282 270 Reduce
23/Mar/15 269 275 Add
11/Feb/15 241 265 Add
24/Nov/14 220 180 Sell
07/Nov/14 211 180 Sell
07/Oct/14 204 175 Reduce
19/Aug/14 151 135 Reduce
24/Jul/14 150 135 Reduce
01/Jul/14 158 150 Reduce
30/Apr/14 153 140 Reduce
07/Apr/14 161 150 Reduce
11/Feb/14 142 150 Add
Report Date CMP (Rs.) TP (Rs.) Recommendation
13/Nov/13 122 135 Add
07/Oct/13 129 130 Add
25/Jul/13 109 125 Buy
07/Jun/13 82 115 Buy
30/Apr/13 83 115 Buy
11/Feb/13 84 115 Buy
13/Dec/12 87 115 Buy
06/Nov/12 114 145 Buy
01/Aug/12 114 145 Buy
11/Jun/12 127 145 Add
30/Apr/12 130 145 Add
02/Mar/12 108 120 Add
0
500
1000
1500
2000
2500
1-May-12 1-Nov-12 1-May-13 1-Nov-13 1-May-14 1-Nov-14 1-May-15
Historical Target
Infosys
0
100
200
300
400
500
600
700
1-May-12 1-Nov-12 1-May-13 1-Nov-13 1-May-14 1-Nov-14 1-May-15
Historical Target
Cyient
Report Date CMP (Rs.) TP (Rs.) Recommendation
27/Apr/15 1,995 2,060 Add
23/Mar/15 2,257 2,310 Add
18/Feb/15 2,279 2,300 Add
12/Jan/15 2,074 2,190 Add
17/Dec/14 1,938 2,230 Add
05/Dec/14 2,102 2,230 Add
24/Nov/14 2,073 2,190 Buy
13/Oct/14 1,944 2,190 Buy
07/Oct/14 1,925 2,023 Buy
19/Aug/14 1,780 1,880 Buy
14/Jul/14 1,663 1,880 Buy
01/Jul/14 1,628 1,950 Buy
Report Date CMP (Rs.) TP (Rs.) Recommendation
16/Jun/14 1,588 1,890 Buy
16/Apr/14 1,630 1,950 Buy
07/Apr/14 1,658 1,980 Buy
13/Jan/14 1,776 2,020 Buy
02/Dec/13 1,663 1,935 Buy
14/Oct/13 1,638 1,820 Add
07/Oct/13 1,511 1,600 Reduce
25/Jul/13 1,451 1,350 Reduce
15/Apr/13 1,109 1,200 Reduce
Report Date CMP (Rs.) TP (Rs.) Recommendation
11/May/15 490 550 Add
24/Apr/15 492 550 Add
23/Mar/15 536 570 Add
16/Jan/15 575 590 Add
05/Jan/15 512 540 Add
24/Nov/14 525 500 Add
16/Oct/14 448 500 Add
07/Oct/14 465 500 Add
25/Aug/14 403 440 Add
19/Aug/14 411 390 Buy
18/Jul/14 338 390 Buy
01/Jul/14 353 390 Add
08/May/14 320 355 Add
Report Date CMP (Rs.) TP (Rs.) Recommendation
28/Apr/14 319 355 Add
07/Apr/14 338 365 Buy
10/Mar/14 342 365 Add
17/Jan/14 346 360 Add
17/Oct/13 241 300 Buy
07/Oct/13 213 260 Buy
23/Jul/13 182 225 Buy
24/Jun/13 180 220 Buy
26/Apr/13 164 220 Buy

IT Sector Update Sector Outlook
Neutral Disclaimer
Page 18
0
50
100
150
200
1-May-12 1-Nov-12 1-May-13 1-Nov-13 1-May-14 1-Nov-14 1-May-15
Historical Target
Intellect Design Arena
0
500
1000
1500
2000
1-May-12 1-Nov-12 1-May-13 1-Nov-13 1-May-14 1-Nov-14 1-May-15
Historical Target
Mindtree
Report Date CMP (Rs.) TP (Rs.) Recommendation
28/Apr/15 110 140 Buy
23/Mar/15 116 145 Buy
02/Feb/15 105 140 Buy
20/Nov/14 76 100 Buy
Report Date CMP (Rs.) TP (Rs.) Recommendation
17/Apr/15 1,380 910 Sell
23/Mar/15 1,402 1,000 Sell
09/Mar/15 1,475 1,040 Sell
20/Jan/15 1,418 1,090 Sell
24/Nov/14 1,212 910 Sell
16/Oct/14 1,035 910 Sell
07/Oct/14 1,141 890 Sell
19/Aug/14 1,029 720 Sell
18/Jul/14 875 720 Sell
01/Jul/14 881 680 Sell
10/Jun/14 791 620 Sell
21/Apr/14 703 620 Sell
Report Date CMP (Rs.) TP (Rs.) Recommendation
07/Apr/14 710 640 Sell
17/Jan/14 740 650 Reduce
17/Oct/13 690 635 Reduce
07/Oct/13 615 625 Reduce
27/Sep/13 600 625 Reduce
23/Jul/13 473 510 Add
23/Apr/13 425 465 Add
0
100
200
300
400
500
600
1-May-12 1-Nov-12 1-May-13 1-Nov-13 1-May-14 1-Nov-14 1-May-15
Historical Target
MphasiS Report Date CMP (Rs.) TP (Rs.) Recommendation
26/May/15 379 350 Reduce
23/Mar/15 387 340 Sell
16/Feb/15 358 350 Reduce
24/Nov/14 408 350 Sell
31/Oct/14 408 350 Sell
07/Oct/14 422 395 Sell
19/Aug/14 435 350 Sell
04/Aug/14 443 350 Sell
01/Jul/14 426 360 Reduce
19/May/14 385 365 Reduce
07/Apr/14 411 360 Sell
19/Mar/14 404 380 Reduce
Report Date CMP (Rs.) TP (Rs.) Recommendation
07/Oct/13 439 430 Sell
10/Sep/13 423 400 Reduce
30/May/13 489 410 Sell

IT Sector Update Sector Outlook
Neutral Disclaimer
Page 19
0
200
400
600
800
1000
1-May-12 1-Nov-12 1-May-13 1-Nov-13 1-May-14 1-Nov-14 1-May-15
Historical Target
Persistent
0
100
200
300
400
500
600
1-May-12 1-Nov-12 1-May-13 1-Nov-13 1-May-14 1-Nov-14 1-May-15
Historical Target
NIIT Technologis
0
50
100
150
200
250
1-May-12 1-Nov-12 1-May-13 1-Nov-13 1-May-14 1-Nov-14 1-May-15
Historical Target
KPIT
Report Date CMP (Rs.) TP (Rs.) Recommendation
23/Apr/15 710 560 Sell
23/Mar/15 737 640 Sell
28/Jan/15 900 650 Sell
24/Nov/14 643 545 Sell
21/Oct/14 634 545 Sell
07/Oct/14 745 600 Sell
19/Aug/14 610 455 Sell
31/Jul/14 625 455 Sell
01/Jul/14 541 485 Sell
22/Apr/14 526 440 Sell
07/Apr/14 543 430 Sell
28/Jan/14 495 430 Sell
Report Date CMP (Rs.) TP (Rs.) Recommendation
02/Dec/13 435 430 Reduce
22/Oct/13 371 400 Add
07/Oct/13 345 315 Add
17/Sep/13 288 315 Add
01/Aug/13 262 288 Add
Report Date CMP (Rs.) TP (Rs.) Recommendation
06/May/15 395 370 Reduce
23/Mar/15 375 390 Reduce
15/Jan/15 384 400 Reduce
24/Nov/14 379 410 Reduce
16/Oct/14 394 410 Reduce
07/Oct/14 412 460 Reduce
19/Aug/14 370 390 Reduce
15/Jul/14 408 390 Reduce
01/Jul/14 443 520 Buy
Report Date CMP (Rs.) TP (Rs.) Recommendation
30/Apr/15 124 125 Reduce
23/Mar/15 191 190 Reduce
23/Jan/15 212 200 Reduce
24/Nov/14 171 160 Reduce
27/Oct/14 168 160 Reduce
07/Oct/14 162 180 Reduce
19/Aug/14 153 155 Reduce
24/Jul/14 155 155 Reduce
01/Jul/14 172 170 Reduce

IT Sector Update Sector Outlook
Neutral Disclaimer
Page 20
0
500
1000
1500
2000
2500
3000
1-May-12 1-Nov-12 1-May-13 1-Nov-13 1-May-14 1-Nov-14 1-May-15
Historical Target
TCS
0
200
400
600
800
1-May-12 1-Nov-12 1-May-13 1-Nov-13 1-May-14 1-Nov-14 1-May-15
Historical Target
Tech mahindra
0
200
400
600
800
1-May-12 1-Nov-12 1-May-13 1-Nov-13 1-May-14 1-Nov-14 1-May-15
Historical Target
Wipro
Report Date CMP (Rs.) TP (Rs.) Recommendation
17/Apr/15 2,574 2,620 Add
23/Mar/15 2,611 2,670 Add
09/Mar/15 2,696 2,780 Add
16/Jan/15 2,539 2,790 Add
17/Dec/14 2,499 2,760 Add
15/Dec/14 2,450 2,760 Add
24/Nov/14 2,615 2,680 Add
17-0ct-14 2,678 2,680 Buy
07/Oct/14 2,775 2,750 Add
09/Sep/14 2,643 2,740 Add
19/Aug/14 2,488 2,580 Add
18/Jul/14 2,380 2,580 Add
Report Date CMP (Rs.) TP (Rs.) Recommendation
01/Jul/14 2,425 2,430 Add
16/Jun/14 2,213 2,400 Add
22/Apr/14 2,220 2,430 Add
17/Apr/14 2,196 2,420 Add
07/Apr/14 2,136 2,420 Add
17/Jan/14 2,350 2,460 Add
02/Dec/13 1,985 2,280 Buy
17/Oct/13 2,215 2,330 Add
07/Oct/13 2,090 2,160 Add
25/Jul/13 1,783 1,890 Add
18/Apr/13 1,455 1,610 Add
Report Date CMP (Rs.) TP (Rs.) Recommendation
27/May/15 636 670 Add
23/Mar/15 678 690 Add
03/Feb/15 724 753 Add
07/Jan/15 635 735 Buy
17/Dec/14 670 688 Add
24/Nov/14 654 710 Add
21/Nov/14 675 710 Add
30/Oct/14 599 650 Add
07/Oct/14 630 680 Add
19/Aug/14 551 575 Add
04/Aug/14 532 575 Add
01/Jul/14 538 568 Buy
Report Date CMP (Rs.) TP (Rs.) Recommendation
15/May/14 460 528 Buy
07/Apr/14 453 566 Buy
05/Feb/14 443 508 Buy
02/Dec/13 423 463 Buy
08/Nov/13 394 450 Buy
07/Oct/13 361 408 Buy
12/Sep/13 333 395 Buy
20/Aug/13 313 363 Buy
04/Jul/13 250 293 Buy
11/Jun/13 242 293 Buy
Report Date CMP (Rs.) TP (Rs.) Recommendation
22/Apr/15 588 620 Add
23/Mar/15 653 670 Add
12/Mar/15 655 700 Add
19/Jan/15 556 660 Buy
17/Dec/14 535 685 Buy
24/Nov/14 570 660 Buy
27/Oct/14 560 660 Buy
07/Oct/14 615 660 Buy
16/Sep/14 568 660 Buy
19/Aug/14 548 590 Add
28/Jul/14 550 590 Add
01/Jul/14 546 580 Add
16/Jun/14 530 580 Add
Report Date CMP (Rs.) TP (Rs.) Recommendation
21/Apr/14 554 580 Reduce
07/Apr/14 553 580 Reduce
20/Jan/14 553 520 Reduce
02/Dec/13 473 470 Reduce
23/Oct/13 515 460 Sell
07/Oct/13 482 460 Reduce
01/Aug/13 438 410 Reduce

IT Sector Update Sector Outlook
Neutral
Spark Disclaimer
Spark Capital Advisors (India) Private Limited (Spark Capital) and its affiliates are engaged in investment banking, investment advisory and institutional equities and
infrastructure advisory services. Spark Capital is registered with SEBI as a Stock Broker and Category 1 Merchant Banker.
We hereby declare that our activities were neither suspended nor we have defaulted with any stock exchange authority with whom we are registered in the last five years. We
have not been debarred from doing business by any Stock Exchange/SEBI or any other authorities, nor has our certificate of registration been cancelled by SEBI at any point of
time.
Spark Capital has a subsidiary Spark Investment Advisors (India) Private Limited which is engaged in the services of providing investment advisory services and is registered
with SEBI as Investment Advisor. Spark Capital has also an associate company Spark Infra Advisors (India) Private Limited which is engaged in providing infrastructure
advisory services.
This document does not constitute or form part of any offer or solicitation for the purchase or sale of any financial instrument or as an official confirmation of any transaction.
This document is provided for assistance only and is not intended to be and must not alone be taken as the basis for an investment decision. Nothing in this document should
be construed as investment or financial advice, and nothing in this document should be construed as an advice to buy or sell or solicitation to buy or sell the securities of
companies referred to in this document.
Each recipient of this document should make such investigations as it deems necessary to arrive at an independent evaluation of an investment in the securities of companies
referred to in this document (including the merits and risks involved), and should consult its own advisors to determine the merits and risks of such an investment. This
document is being supplied to you solely for your information and may not be reproduced, redistributed or passed on, directly or indirectly, to any other person or published,
copied, in whole or in part, for any purpose. This report is not directed or intended for distribution to or use by any person or entity who is a citizen or resident of or located in
any locality, state, country or other jurisdiction, where such distribution, publication, availability or use would be contrary to law, regulation or which would subject Spark Capital
and/or its affiliates to any registration or licensing requirement within such jurisdiction. The securities described herein may or may not be eligible for sale in all jurisdictions or to
a certain category of investors. Persons in whose possession this document may come are required to inform themselves of and to observe such applicable restrictions. This
material should not be construed as an offer to sell or the solicitation of an offer to buy any security in any jurisdiction where such an offer or solicitation would be illegal.
Spark Capital makes no representation or warranty, express or implied, as to the accuracy, completeness or fairness of the information and opinions contained in this
document. Spark Capital , its affiliates, and the employees of Spark Capital and its affiliates may, from time to time, effect or have effected an own account transaction in, or
deal as principal or agent in or for the securities mentioned in this document. They may perform or seek to perform investment banking or other services for, or solicit
investment banking or other business from, any company referred to in this report.
This report has been prepared on the basis of information, which is already available in publicly accessible media or developed through an independent analysis by Spark
Capital. While we would endeavour to update the information herein on a reasonable basis, Spark Capital and its affiliates are under no obligation to update the information.
Also, there may be regulatory, compliance or other reasons that prevent Spark Capital and its affiliates from doing so. Neither Spark Capital nor its affiliates or their respective
directors, employees, agents or representatives shall be responsible or liable in any manner, directly or indirectly, for views or opinions expressed in this report or the contents
or any errors or discrepancies herein or for any decisions or actions taken in reliance on the report or the inability to use or access our service in this report or for any loss or
damages whether direct or indirect, incidental, special or consequential including without limitation loss of revenue or profits that may arise from or in connection with the use of
or reliance on this report.
Absolute
Rating
Interpretation
BUY Stock expected to provide positive returns of >15% over a 1-year horizon REDUCE Stock expected to provide returns of <5% – -10% over a 1-year
horizon
ADD Stock expected to provide positive returns of >5% – <15% over a 1-year
horizon SELL Stock expected to fall >10% over a 1-year horizon
Disclaimer
Page 21

IT Sector Update Sector Outlook
Neutral Disclaimer (Cont’d)
Spark Capital and/or its affiliates and/or employees may have interests/positions, financial or otherwise in the securities mentioned in this report. To enhance transparency,
Spark Capital has incorporated a disclosure of interest statement in this document. This should however not be treated as endorsement of views expressed in this report:
Disclosure of interest statement ECLX, FSOL HCLT, HEXW, CYL, INDA, MTCL,
MPHL, PSYS, NITEC, KPIT, TECHM, WPRO TCS, INFO
Analyst financial interest in the company No No
Group/directors ownership of the subject company covered No No
Investment banking relationship with the company covered No No
Spark Capital’s ownership/any other financial interest in the company covered No Yes
Associates of Spark Capital’s ownership more than 1% in the company covered No No
Any other material conflict of interest at the time of publishing the research report No No
Receipt of compensation by Spark Capital or its Associate Companies from the subject company covered for in
the last twelve months:
Managing/co-managing public offering of securities
Investment banking/merchant banking/brokerage services
products or services other than those above
in connection with research report
No
No
Whether Research Analyst has served as an officer, director or employee of the subject company covered No No
Whether the Research Analyst or Research Entity has been engaged in market making activity of the Subject
Company; No No
Analyst Certification of Independence
The views expressed in this research report accurately reflect the analyst’s personal views about any and all of the subject securities or issuers; and no part of the research
analyst’s compensations was, is or will be, directly or indirectly, related to the specific recommendation or views expressed in the report.
Additional Disclaimer for US Institutional Investors
This research report prepared by Spark Capital Advisors (India) Private Limited is distributed in the United States to US Institutional Investors (as defined in Rule 15a-6 under
the Securities Exchange Act of 1934, as amended) only by Decker and Co, LLC, a broker-dealer registered in the US (registered under Section 15 of Securities Exchange Act
of 1934, as amended). Decker and Co accepts responsibility on the research reports and US Institutional Investors wishing to effect transaction in the securities discussed in
the research material may do so through Decker and Co. All responsibility for the distribution of this report by Decker and Co, LLC in the US shall be borne by Decker and Co,
LLC. All resulting transactions by a US person or entity should be effected through a registered broker-dealer in the US. This report is not directed at you if Spark Capital
Advisors (India) Private Limited or Decker and Co, LLC is prohibited or restricted by any legislation or regulation in any jurisdiction from making it available to you. You should
satisfy yourself before reading it that Decker and Co, LLC and Spark Capital Advisors (India) Private Limited are permitted to provide research material concerning investment
to you under relevant legislation and regulations;
Page 22