it industry strategy and insight · • share of segment • channel mix change ... opportunity...
TRANSCRIPT

Industry specific cover image
May. 2013
贾贯华
Industry strategy and insight
企业IT价值评估的策略和方法

Copyright ©2012 Oracle. All rights reserved.
内容提要
2
• 为什么要进行IT价值的评估
• 使用价值导图确认企业的战略价值
• 利用财务报表评估IT价值
• 制定IT投资的财务评估
• 利用甲骨文Inisght帮您进行IT价值评估
Copyright ©2012 Oracle. All rights reserved. 3
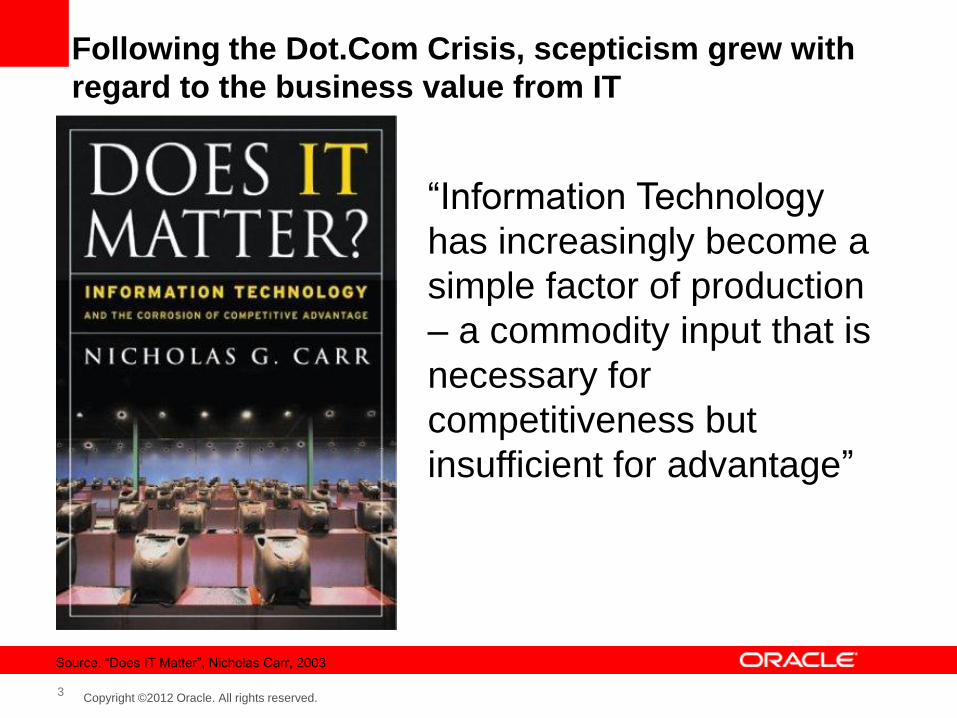
Following the Dot.Com Crisis, scepticism grew with
regard to the business value from IT
“Information Technology
has increasingly become a
simple factor of production
– a commodity input that is
necessary for
competitiveness but
insufficient for advantage”
Source. “Does IT Matter”, Nicholas Carr, 2003

Copyright ©2012 Oracle. All rights reserved.
Trends 2010-2019: From IT Productivity to an
Intelligent Economy
4
IDC predict IT
growth will be
focused on these
four areas in this
decade.

Copyright ©2012 Oracle. All rights reserved.
内容提要
5
• 为什么要进行IT价值的评估
• 使用价值导图确认企业的战略价值
• 利用财务报表评估IT价值
• 制定IT投资的财务评估
• 利用甲骨文Inisght帮您进行IT价值评估

Copyright ©2012 Oracle. All rights reserved. 6
Strategy is how an organisation intends to create
value for its stakeholders.
"If we succeed, how will we
look to our shareholders?”
The Strategy
Financial Perspective
"To achieve our vision, how
must we look to our
customers?”
Customer Perspective
"To satisfy our customers, at
which processes must we
excel?”
Internal Perspective
"To achieve our vision, how
must our organization learn
and improve
Learning & Growth
Strategy Maps
A simple model of the
value creation process
Through cause-effect
diagrams and linked to
the creation of
measures
Objectives
• Provide
technology
& resources
• % new technology used by staff
Inte
rna
l L
ea
rnin
g
Cu
sto
me
r
Measures
• Provide
personalized
care
• Customer satisfaction survey rating
Longer Term (3-5 year) View
• Service level
spot check
rating
• Keep patients
informed
Fin
an
cia
l
• Grow high-
margin
service
• % revenue from high-margin services
Strategy and Map
L4
P1
P2
F1
F2
C1

Copyright ©2012 Oracle. All rights reserved. 7
Example Balanced Scorecard
Perspective
Financial Perspective
F1 Increase earnings per share F2 Add and retain high value customers F3 Increase revenue per customer F4 Reduce cost per customer
Strategic Objectives Strategic Measures
Customer Perspective
Customer Management
Inte
rnal
Pe
rsp
ecti
ve
Human Capital
Lea
rnin
g &
Gro
wth
Pe
rsp
ecti
ve
Product Innovation
Operations Management
Information Capital
Organization Capital
• Net income (vs. plan) • Revenue mix (by target segment) • Revenue per customer • Cost per customer
C1 Become a trusted financial advisor C2 Provide superior service
• Customer satisfaction (survey) • Share of wallet • Target customer retention
I1 Understand customer segments I2 Shift to appropriate channel I3 Cross-sell the product line
• Share of segment • Channel mix change • Cross-sell ratio
I4 Develop new products • Revenue from new products (%)
I5 Minimize problems I6 Provide rapid response
• Service error rate • Request fulfillment time
L1 Insure readiness of strategic jobs • Strategic job readiness
L2 Insure availability of strategic info • Information portfolio readiness
L3 Create a customer-focused culture L4 Build cadre of leaders L5 Align the organization L6 Best practice sharing
• Customer survey • 360° Survey (leadership model) • Strategic awareness survey • Personal goals aligned to BSC (%) • KMS utilization/currency
Responsible Citizen I7 Build diversity reflecting community • Diversity mix versus community
Targets
+$100M 30%(A) 70%(B)
$300 $75
90% 50% 90%
30% 40% 2.5
50%
0.% < 24hrs
1.0
100%
100%
100% 70% 90% 100% 100%

Copyright ©2012 Oracle. All rights reserved. 8
•Improve Market
Share / Manage
Competition
•Reduce Cost Structure
•Increase Revenue
•Increase VAS Usage
(ARPU)
•Increase subscriber
base (market share)
•Additional
processing capacity
for bill generation
•Improve transaction
speed
•Improve speed to
load data for audit
effectiveness
•Additional CDR
processing capacity
•Additional CDR
storage capacity
•Improve data
compression
•Reduce cost related
to fraud
•Reduce billing costs
/ cycle times
•Improve CSR
productivity
•Reduce storage,
facilities & power
costs
Sample Map Strategic Priorities to IT Operational Priorities
•Increase cross-sell
/up-sell of services
•Improve speed to
generate insightful
reports from DW
•Outside
•Pressure •Strategies
•Business Perspective
•Enablers •IT Implications
•Ma
na
ge
da
ta v
olu
me
gro
wth
acro
ss th
e b
usin
ess,
with
ou
t h
avin
g im
plic
atio
ns o
n c
ost
•IT Perspective
•Manage Capacity in
Real Time
•Increase CDR
processing speed /
reduce risk
•Improve mediation
speed
•Data
+ V
oic
e
Copyright ©2012 Oracle. All rights reserved.
内容提要
9
• 为什么要进行IT价值的评估
• 使用价值导图确认企业的战略价值
• 利用财务报表评估IT价值
• 制定IT投资的财务评估
• 利用甲骨文Inisght帮您进行IT价值评估

Copyright ©2012 Oracle. All rights reserved.
Core Financial Statements
10
• Shows revenue, expenses, and profit /loss over a period of time
• Revenue and expenses can be one-time or recurring. They can be from core operations or non-core operations
• Also known as Statement of Operations or P/L
Income Statement(损益表)
Balance Sheet (资产负债表)
Cash Flows Statement
(现金流量表)
• Shows assets, liabilities, and owners’ equity at a particular point in time. It’s a snapshot, not a flow, view
• Assets = Liabilities + Owners’ Equity
• All resources (assets) are owned by creditors (liabilities) or owners (equity). Hence, everything is “balanced”
• Shows the sources (inflows) and uses (outflows) for cash over a period of time
• Business activities are divided into operating, investing, and financing categories
• Bridges net income from income statement to cash on balance sheet

Copyright ©2012 Oracle. All rights reserved.
Leveraging Financial Statements on the
Discovery Path
11
1 2 3 4
FINANCIAL
STATEMENT
RATIOS
COMPARISON
ANALYSIS
PRELIMINARY
INSIGHT
FURTHER
DISCOVERY
• Offer a fact-based
starting point
• Attract everyone’s
attention
• Provide a
scorecard on the
company’s strategy
and execution
• Drive future
shareholder value
prospects
• Use earlier work to
open more doors
• Determine focused
capabilities these
initiatives need to
achieve the
business
objectives
• Understand how
Oracle offerings
could help and
start prioritizing
• Compare relative
to peers, best-in-
class, or internal
goals
• Check both trends
and most recent
period
• Understand gaps
• Link improvement
opportunities with
current or potential
strategic initiatives
• Estimate potential
impact of
improvement

Copyright ©2012 Oracle. All rights reserved.
Currency: USD, in Millions Source: OneSource
Benchmarking: Peer Comparison
Table View
Opportunities
Strengths
China
Unicom
(Hong Kong)
Limited
Peer Avg. China
Telecom
Corporation
Limited
Telefonica
SA
Hutchison
Whampoa
Limited
China Mobile
Ltd.
PCCW
Limited
1 Year Revenue Growth (%) 21.9 5.8 18.3 -5.6 4.4 8.7 3.1
Revenue / Employee ($) 180,663 241,049 146,747 290,340 125,350 486,641 156,164
Gross Margin (%) 61.3 66.7 67.4 72.1 46.8 93.7 53.3
Operating Margin (%) 3.8 14.4 7.5 16.7 10.1 26.9 11.1
Profit Margin (%) 2.9 11.7 5.3 6.8 13.3 23.1 10.1
SGA Expenses / Revenues
(%)
17.9 32.5 42.4 13.2 NA 34.4 40.1
Asset Turnover 0.5 0.5 0.6 0.5 0.3 0.6 0.5
Day Sales OutStanding
(DSO)
22.7 52.6 30.3 73.2 91.3 16.2 52.2
Days In Inventory (DII) 20.0 42.7 21.5 24.2 53.5 79.4 34.7

Copyright ©2012 Oracle. All rights reserved. 13
Key Performance
Indicator (KPI)
China Unicom (Hong
Kong) Limited Opportunity Analysis Sensitivity Analysis
Affected
Parameter Baseline
Value
($m)
KPI Value Peer
Average
Oppty.
($ m)
Change
in KPI
Potential
($ m)
Revenue Growth (1 Year,
%) 39,446 21.91 5.78 - 1% 394
Revenue
Revenue / Employee ($) 39,446 180,663 241,049 13,185 1% 394 Revenue
Gross Margin (%) 24,196 61.34 66.68 2,106 1% 242 Gross Profit
Operating Profit Margin (%) 1,509 3.82 14.44 4,187 1% 15
Operating
Profit
SG&A Expenses /
Revenues (%) 7,047 17.86 32.54 - -1% 70
SG&A
Expenses
Reduction
Day Sales Outstanding
(DSO) 22.68 52.60 - -1 day 108
Receivables
Reduction
Days In Inventory (DII) 19.98 42.70 - -1 day 42
Inventory
Reduction
Opportunity Analysis
Opportunities
Strengths
Industry: Communications Services Source: OneSource Data as of 09/05/2013 *Currency: USD, in millions
Saving opportunity
Copyright ©2012 Oracle. All rights reserved. 14
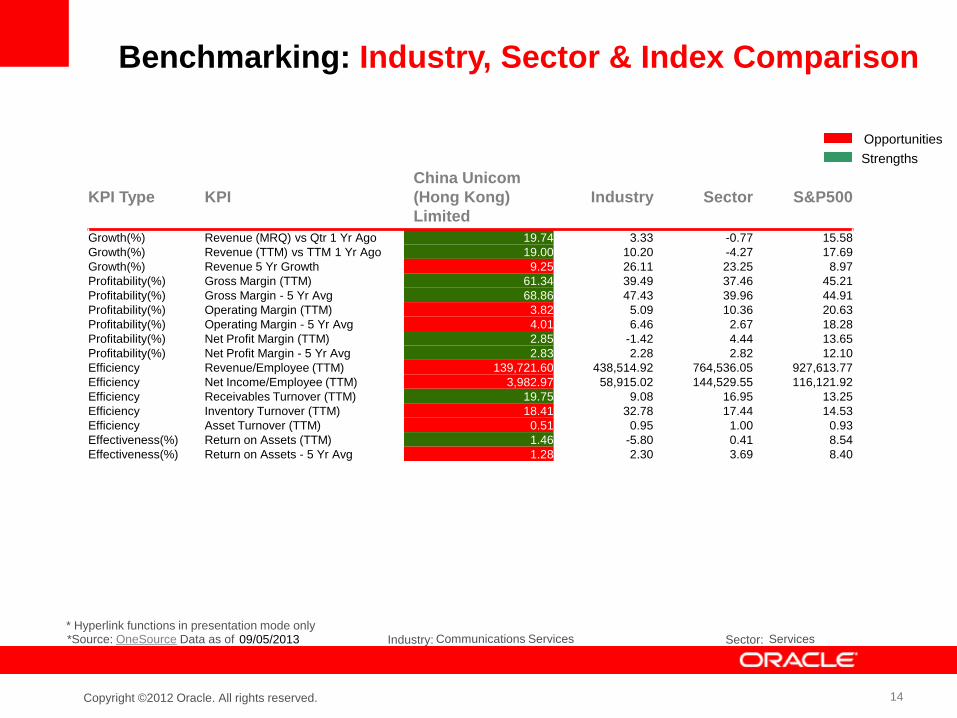
Opportunities
Strengths
*Source: OneSource Data as of Industry: Sector: Services 09/05/2013 Communications Services
Benchmarking: Industry, Sector & Index Comparison
* Hyperlink functions in presentation mode only
KPI Type KPI
China Unicom
(Hong Kong)
Limited
Industry Sector S&P500
Growth(%) Revenue (MRQ) vs Qtr 1 Yr Ago 19.74 3.33 -0.77 15.58
Growth(%) Revenue (TTM) vs TTM 1 Yr Ago 19.00 10.20 -4.27 17.69
Growth(%) Revenue 5 Yr Growth 9.25 26.11 23.25 8.97
Profitability(%) Gross Margin (TTM) 61.34 39.49 37.46 45.21
Profitability(%) Gross Margin - 5 Yr Avg 68.86 47.43 39.96 44.91
Profitability(%) Operating Margin (TTM) 3.82 5.09 10.36 20.63
Profitability(%) Operating Margin - 5 Yr Avg 4.01 6.46 2.67 18.28
Profitability(%) Net Profit Margin (TTM) 2.85 -1.42 4.44 13.65
Profitability(%) Net Profit Margin - 5 Yr Avg 2.83 2.28 2.82 12.10
Efficiency Revenue/Employee (TTM) 139,721.60 438,514.92 764,536.05 927,613.77
Efficiency Net Income/Employee (TTM) 3,982.97 58,915.02 144,529.55 116,121.92
Efficiency Receivables Turnover (TTM) 19.75 9.08 16.95 13.25
Efficiency Inventory Turnover (TTM) 18.41 32.78 17.44 14.53
Efficiency Asset Turnover (TTM) 0.51 0.95 1.00 0.93
Effectiveness(%) Return on Assets (TTM) 1.46 -5.80 0.41 8.54
Effectiveness(%) Return on Assets - 5 Yr Avg 1.28 2.30 3.69 8.40

Copyright ©2012 Oracle. All rights reserved.
内容提要
15
• 为什么要进行IT价值的评估
• 使用价值导图确认企业的战略价值
• 利用财务报表评估IT价值
• 制定IT投资的财务评估
• 利用甲骨文Inisght帮您进行IT价值评估

Copyright ©2012 Oracle. All rights reserved.
Server Consolidation – Illustrative Example
(Major Assumptions)
• Approximately 40 older, EOL Sun servers are consolidated onto four
T5440 Sun servers
• The T5440 servers have more cores, more memory, and faster
processors, so they can handle the existing workload
• Oracle Standard Edition is running on most of the older servers. It is
licensed by chip ($17,500 per chip) and 22% annual maintenance
rate under pre-CIC (Sun) conditions
• 25% growth
• 20% hardware discount
• Legacy Sun service model (tiered-pricing and non-standardized
warranty periods) with a 10% service discount
• 10% cost of capital (mid-year discounting)
16
Note: Illustrative example only. Results will vary.

Copyright ©2012 Oracle. All rights reserved. 17
Total Benefit
Annual EBIT Basis for Tight Financial Coupling
Server Hardware Cost Delta
$806K
•
Server Hardware Service
Cost Delta
$420K
Storage Hardware Service
Cost Delta
$252K
Improved Space Utilization
$425K
•Facilities Power Cooling
Improve Power Utilization
$525K
Reduction in Cost To
Identify SOD Violations
$84K
Storage Hardware Cost Delta
$840K
Provisioning Efficiency
$1.14M
•Productivity Improvements
Reduce Unplanned
Downtime
$2.11
Reduce Planned Downtime
$688K
System Admin, Operator
Productivity
$306K
• Total Cost of Ownership
Patching Efficiency
$1.14M
Freight, Installation
$252K Server Utilization, Virtualization
$840K
Identify The TCO and ROI Model Drivers
•Key Deliverables

Copyright ©2012 Oracle. All rights reserved.
TCO/ROI Cash Flows – Solution A (Installed Base)
Illustrative Example
18
Note: Illustrative example only. Results will vary.
INVESTMENTS INITIAL YEAR 1 YEAR 2 YEAR 3 YEAR 4 YEAR 5 TOTAL
Hardware Acquisition $0 $0 $295 $236 $194 $360 $1,085
Software Licenses $0 $219 $711 $671 $736 $1,143 $3,481
Tape Media $0 $0 $0 $0 $0 $0 $0
Hardware Service $0 $141 $177 $221 $263 $357 $1,159
Software Maintenance $0 $0 $0 $0 $0 $0 $0
Power, Cooling, and Floor Space $0 $63 $98 $124 $147 $201 $633
Freight, Installation, and Other
Implementation Costs $0 $0 $19 $14 $10 $29 $71
TOTAL (Undiscounted) $0 $424 $1,300 $1,265 $1,349 $2,091 $6,429
Currency: USD (000)
Total Cash Flows (NPV basis): $4.6M

Copyright ©2012 Oracle. All rights reserved.
TCO/ROI Cash Flows – Solution B (Proposed)
Illustrative Example
19
Note: Illustrative example only. Results will vary.
INVESTMENTS INITIAL YEAR 1 YEAR 2 YEAR 3 YEAR 4 YEAR 5 TOTAL
Hardware Acquisition $370 $0 $88 $167 $79 $151 $855
Software Licenses $280 $62 $147 $248 $193 $294 $1,224
Tape Media $0 $0 $0 $0 $0 $0 $0
Hardware Service $0 $0 $29 $38 $56 $67 $191
Software Maintenance $0 $0 $0 $0 $0 $0 $0
Power, Cooling, and Floor Space $0 $9 $12 $18 $22 $29 $91
Freight, Installation, and Other
Implementation Costs
$0 $0 $0 $0 $0 $0 $0
TOTAL (Undiscounted) $650 $71 $277 $471 $350 $541 $2,360
Currency: USD (000)
Total Cash Flows (NPV basis): $1.9M

Copyright ©2012 Oracle. All rights reserved.
TCO/ROI Cash Flows – Illustrative Example
20
Note: Illustrative example only. Results will vary.
SOLUTION COST SUMMARY INITIAL YEAR 1 YEAR 2 YEAR 3 YEAR 4 YEAR 5 TOTAL
Total Solution A cash flow $0 $424 $1,300 $1,265 $1,349 $2,091 $6,429
Total Solution B cash flow $650 $71 $277 $471 $350 $541 $2,360
Net cash flow -$650 $353 $1,023 $794 $999 $1,549 $4,069
Cumulative net cash flow -$650 -$297 $726 $1,520 $2,519 $4,069
Net cash flow (discounted) -$650 $321 $846 $597 $682 $962 $2,757
Cumulative net cash flow
(discounted) -$650 -$329 $516 $1,113 $1,795 $2,757
Currency: USD (000)
Financial Metrics and Assumptions •Total Savings (NPV): $2,757K
•Net Initial Investment: $650K
•ROI (based on total cash flows): 424%
•Payback (months): 16
•Cost of 3-month Delay: $77K
•Cost of Capital (Solution A): 10%
•Discounting (Solution A): Year-End

Copyright ©2012 Oracle. All rights reserved.
TCO/ROI Cash Flows Chart – Illustrative Example
21
INVESTMENT COSTS AND BENEFITS
$ Millions
$4.1M 5-Year Total Savings
-$1.0
-$0.5
$0.0
$0.5
$1.0
$1.5
$2.0
$2.5
Year 0 Year 1 Year 2 Year 3 Year 4 Year 5
Savings Solution A Solution B
Payback: ~16 mo.
NET PRESENT VALUE
$ Millions
NPV: $2.7M, ROI: 424%
-$1.0
-$0.5
$0.0
$0.5
$1.0
$1.5
$2.0
$2.5
$3.0
$3.5
Year 0 Year 1 Year 2 Year 3 Year 4 Year 5
Note: Illustrative example only. Results will vary.

Copyright ©2012 Oracle. All rights reserved.
内容提要
22
• 为什么要进行IT价值的评估
• 使用价值导图确认企业的战略价值
• 利用财务报表评估IT价值
• 制定IT投资的财务评估
• 利用甲骨文Inisght帮您进行IT价值评估

Copyright ©2012 Oracle. All rights reserved. 23
Insight Brings the Right Expertise to Articulate
Oracle’s Unique Value Proposition
Oracle Insight
• A methodology focused on enabling greater customer business
value
• Drives business impact by helping view technology as enablers
of business value
• Helps build a compelling value proposition
• Assists with alignment with your executive team
Industry
Experience
Solution
Knowledge
Value
Analysis

Copyright ©2012 Oracle. All rights reserved.