it enhanced communication protocols for building project ... · 2.8 factors affecting ict adoption...
TRANSCRIPT

IT Enhanced Communication Protocols for
Building Project Management By Small and Medium Enterprises In The Indian Construction Industry
By Vanita Ahuja
Bachelor of Architecture
Masters in Building Science and Construction Management
A thesis submitted in partial fulfillment of the requirements for the degree of
Doctor of Philosophy
2007
QUEENSLAND UNIVERSITY OF TECHNOLOGY
School of Urban Development Faculty of Built Environment and Engineering


_______________________________________________________________________ i
ABSTRACT AND KEY WORDS
The Research has developed protocols for effective adoption of Information
Communication Technologies (ICT) for Building Project Management by Small and
Medium Enterprises (SMEs) in the Indian construction industry.
Project Managers are required to facilitate the integration of work of all the agencies and
project team organizations are geographically separated beyond national boundaries or
in context of large countries like India, within the national boundaries. In doing so, there
is a need to make better use of information and knowledge generated in all stages of
development. The key to project information management is the information flow
associated with inter-organizational communication and the effectiveness of the project
manager to communicate with and feedback to the rest of the project team throughout
the project life cycle. Better communication can be achieved by using computer tools for
effective data processing and information management, through Information
Communication Technologies (ICT). As the majority of the construction organizations
are Small and Medium Enterprises (SMEs), the communication management research is
required to address management and communication processes adopted by SMEs. These
issues can be addressed by global research, but also require clear understanding of the
management and communication processes followed by SMEs of each distinct regional
area or country.
The research was conducted through a sequential mixed methods approach focusing on
collecting and analyzing both quantitative and qualitative data in the study in a
sequential manner. To develop a balance check mechanism, the research was divided
into four phases: Interpretive analysis of perceived benefits of use of ICT for building
project management, conducted by Interpretive Structural Modeling analysis;
Questionnaire survey data collection and empirical analysis of data including Structural
Equation Modeling analysis (quantitative method); Semi-structured interview survey
data collection and analysis including Data Envelopment Analysis (quantitative and

____________________________________________________________________ ii
qualitative method) and case studies analysis conducted by SAP-LAP analysis
(qualitative method) leading to synthesis of the results of the four phases. The
purpose of this four-phase, sequential mixed methods study was to start with the
pragmatic assumptions; obtain statistical, quantitative results from a broad sample of
organizations to analyze or study research variables at industry and organization
levels and then follow up with a few organizations and projects to study the research
variables at the level of the organization and people.
Synthesis of the knowledge enhancement from the literature survey, data analysis
results and their interpretation led to the proposed ‘IT Enhanced Communication
Protocols for Building Project Management’. The protocols are proposed as a
‘Strategic Model for Enhancing ICT Diffusion in Building Projects’. The model is
based on Everett Rogers’s ‘Diffusions of innovations theory’ and is formulated at
three levels of study i.e industry, organization and people. It is discussed as a generic
framework of five stages of Roger’s ‘Diffusions of innovations theory’ i.e
Knowledge, Persuasion, Decision, Implementation and Confirmation.
Keywords: building project management, ICT, Indian construction industry, SMEs

____________________________________________________________________ iii
TABLE OF CONTENTS Title Page Abstract and Key Words i Table of Contents iii List of Figures x List of Tables xiii List of Abbreviations and Acronyms xvi Acknowledgement xviii Publications xx Statement of Original Authorship xxi Chapter 1: Introduction 1.1 Research Background 1
1.1.1 Building Project Management and ICT 1 1.1.2 ICT Adoption in the Construction Industry and Research
Requirements 2 1.1.3 IT Enhanced communication protocols 4
1.2 Research Problem, Aim and Objectives 5 1.2.1 Research Aim 5 1.2.2 Research Objectives 6
1.3 Research Overview 7 1.4 Delimitation of Scope 10 1.5 Outline of the Thesis 11 1.6 Summary 13 Chapter 2: Literature Review 2.1 Introduction 15 2.2 Construction Information and ICT 16 2.3 ICT and Building Project Management 17 2.4 ICT Tools and Technologies 19 2.5 Small and Medium Enterprises (SMEs) and the Indian Construction
Industry 23 2.5.1 Definition of SMEs 23 2.5.2 SMEs and the construction Industry 24 2.5.3 Characteristics and Specific Requirements of SMEs 25 2.5.4 Indian Construction Industry 27
2.6 Characteristics of Global Research and Research in India 29 2.7 Strategic Adoption of ICT in the Construction Industry 32
2.7.1 Requirement of Strategic Adoption of ICT by the Construction Industry at the Level of each Organization and at the Industry Level 33
2.7.2 Benchmarking a Strategic Tool 36 2.7.2.1 Benchmarking Definition 39
2.8 Factors Affecting ICT Adoption for Building Project Management 43

____________________________________________________________________ iv
2.8.1 Strategic Adoption and Diffusion of ICT 44 2.8.2 Cultural Factors 46 2.8.3 Available Technology 48 2.8.4 Training and Education 48 2.8.5 Organization Level Factors 49 2.8.6 Perception Based Factors 50
2.8.6.1 Perceived Benefits 50 2.8.6.2 Perceived Barriers 51
2.8.7 Industry Drivers 53 2.8.8 Summary of Factors 54
2.9 Strength of the Contemporary Research 56 2.10 Gaps in Contemporary Research and Identification of Research
Areas 57 2.11 Summary 59 Chapter 3: Research Methodology 3.1 Introduction 61 3.2 Research Variables 61
3.2.1 Justification of the Chosen Research Variables 62 3.3 Hypotheses Formulation 64
3.3.1 Hypotheses Determining Dimensions of Qualitative Factors 64 3.3.2 Hypotheses of Causal Relationships 64 3.3.3 Supplementary Hypotheses 65
3.4 Research Design 65 3.4.1 Understanding of the Characteristics of Research Problem 65 3.4.2 Unit of Analysis 67 3.4.3 Data Collection and Analysis Approach 67
3.5 Research Methods 70 3.5.1 Interpretive Structural Modeling (ISM) 71 3.5.2 Questionnaire Survey (Industry Level) 72
3.5.2.1 Questionnaire Design 73 3.5.2.2 Survey Population 74 3.5.2.3 Validation of Questionnaire 75 3.5.2.4 Pilot Survey 76 3.5.2.5 Survey Administration 77 3.5.2.6 Data Analysis 78
3.5.3 Semi-Structured Interview Survey (Organization level) 82 3.5.3.1 Benchmarking Structure Attributes 83 3.5.3.2 Benchmarking Framework Administration 85 3.5.3.3 Data Envelopment Analysis (DEA) Technique 88
3.5.4 Case Studies (Organization and Project level) 94 3.5.4.1 SAP-LAP Analysis 95
3.6 Data Analysis Results Synthesis Methodology and Framework for Results Formulation 99
3.6.1 Categorization of Organizations and People Based on ICT Adoption 101
3.7 Justification of the Methodology 105 3.8 Summary 106

____________________________________________________________________ v
Chapter 4: Interpretive Structural Modeling Analysis 4.1 Introduction 109 4.2 Interpretive Structural Modeling (ISM) 109 4.3 Analysis 111
4.3.1 Research Variables 111 4.3.2 Structural Self-Interaction Matrix (S SIM) 111 4.3.3 Reachability Matrix 113 4.3.4 Level Partitions 116 4.3.5 Developing Conical Matrix 118 4.3.6 ISM Based Model 119
4.4 MICMAC Analysis 123 4.5 Discussion and Hypotheses Formulation 124 4.6 Further Analysis 126 4.7 Summary 126 Chapter 5: Questionnaire Survey Data Analysis 5.1 Introduction 127 5.2 Respondents’ Profile 127 5.3 Data Reliability 130 5.4 Hypothesis Testing 131
5.4.1 Hypotheses Determining Dimensions of Qualitative Factors 131 5.4.1.1 Hypothesis HD1 131 5.4.1.2 Hypothesis HD2 and HD3 132 5.4.1.3 Hypothesis HD4 133 5.4.1.4 Hypothesis HD5 134 5.4.1.5 Hypothesis HD6 136
5.4.2 Hypotheses of Causal Relationships – Hypothesis HR1 137 5.4.3 Supplementary Hypotheses 140
5.4.3.1 Hypothesis HS1 140 5.4.3.2 Hypothesis HS2 141 5.4.3.3 Hypothesis HS3 144 5.4.3.4 Hypothesis HS4 145
5.5 Status of ICT Adoption in the Indian Construction Industry 146 5.6 Perception Based Data Analysis 153
5.6.1 Perceived Barriers 154 5.6.2 Perceived Enablers 156 5.6.3 Perceived Benefits 159 5.6.4 Scenario Building for the Industry 161
5.7 Cultural Factors 163 5.8 Issues Identified from the Open Ended Questions 168 5.9 Findings of Data Analysis and Further Analysis Requirement 169
5.9.1 Identified Issues for Actions Required at the Level of Industry, Organization or People 169
5.9.2 Cultural Factors that are required to be Considered 174 5.9.3 Issues that require Further Study 175
5.10 Summary 176

____________________________________________________________________ vi
Chapter 6: Structural Equation Modeling Analysis on Questionnaire Survey Data
6.1 Introduction 177 6.2 Structural Model Derived from the Hypotheses of Causal
Relationships 177 6.3 Model Specification 178 6.4 Structural Equation Modeling (SEM) 181 6.5 Data Collection 183 6.6 Analysis 183
6.6.1 Data Validity 184 6.6.2 Statistical Results and Analysis of the Hypothesized Model 184 6.6.3 Model Modification – Step 1 187 6.6.4 Model Modification - Step 2 188 6.6.5 Model Modification – Step 3 (Final Model) 190
6.7 Discussion and Findings 192 6.7.1 Discussion 192
6.7.2 Findings 195 6.8 Summary 198 Chapter 7: Benchmarking Framework Development and Case Study Analysis 7.1 Introduction 199 7.2 Benchmarking Framework Development 199
7.2.1 Objectives of the Required Benchmarking Framework 200 7.2.2 Benchmarking Framework Development, Structure and
Measurement System 201 7.2.3 Benchmarking Framework and the Organization Management
Information Systems 205 7.2.4 Benchmarking Framework Attributes 207
7.3 Benchmarking Process 208 7.4 Benchmarking Framework Administration and Finalization 209
7.4.1 Benchmarked Organizations 209 7.4.2 Benchmarking of Organizations and Analysis 212 7.4.3 Benchmarking Framework Validation and Finalization 225 7.4.4 BenchMeasurement 226 7.4.5 Benchmarking and BenchMeasurement Discussion 230
7.5 Bench Learning - Case Study Analysis 231 7.5.1 Actors 234 7.5.2 Processes 234 7.5.3 Case Study 1: Real Estate Organization (REO) 234
7.5.3.1 Introduction 234 7.5.3.2 ICT Adoption for Building Project Management – Strategic Issues 236 7.5.3.3 Extent of ICT Adoption for Building Project Management 236 7.5.3.4 Perceptions of the Senior Managers and Project Managers 237 7.5.3.5 Factors Perceived as affecting use of ICT for Building Project Management 238 7.5.3.6 Situation 238

____________________________________________________________________ vii
7.5.3.7 Learning 240 7.5.4 Case Study 2: Project Management Consultancy Organization (PMCO) 241
7.5.4.1 Introduction 241 7.5.4.2 ICT Adoption for Building Project Management – Strategic Issues 242 7.5.4.3 Extent of ICT Adoption for Building Project Management 243 7.5.4.4 Perceptions of the Senior Managers and Project Managers 244 7.5.4.5 Factors Perceived as affecting use of ICT for Building Project Management 244 7.5.4.6 Situation 245 7.5.4.7 Learning 246
7.5.5 Case Study 3 – Architectural Organization (AO) 248 7.5.5.1 Introduction 248 7.5.5.2 ICT Adoption for Building Project Management – Strategic Issues 249 7.5.5.3 Extent of ICT Adoption for Building Project Management 249 7.5.5.4 Perceptions of the Senior Managers and Project Managers 250 7.5.5.5 Factors Perceived as affecting use of ICT for Building Project Management 251 7.5.5.6 Situation 252 7.5.5.7 Learning 253
7.5.6 Action and Performance 253 7.5.7 SAP-LAP Synthesis of Case Studies 257
7.6 Synthesis of the Case Study Analysis Results and Framework for BenchAction and BenchMonitoring 260
7.7 Discussion 264 7.8 Suggested Benchmarking Framework with Reference to
The Existing Benchmarking Studies 266 7.9 Summary 267 Chapter 8: Interpretation of Data Analysis and Discussions 8.1 Introduction 269 8.2 Synthesis of the Study 269
8.2.1 Status of ICT Adoption for Building Project Management 270 8.2.2 Perceived Barriers, Benefits and Enablers for Effective
ICT Adoption 272 8.2.3 Causal Relationships between Factors 275 8.2.4 Cultural Factors 276 8.2.5 Benchmarking Framework Analysis 278
8.3 Model of IT Enhanced Communication Protocols for Building Project Management 285
8.3.1 Industry Level Framework for Planning, Designing and Implementing ‘Strategic Model for Enhancing ICT Diffusion for Building Project Management’ 286

____________________________________________________________________ viii
8.3.2 Organization Level Framework for Planning, Designing and Implementing ‘Strategic Model for Enhancing ICT Diffusion for Building Project Management’ 290
8.3.2.1 Step 1: Knowledge, Persuasion and Decision 292 8.3.2.2 Step 2: Finalization and Implementation of the Strategy for ICT Adoption for Building Project Management 293 8.3.2.3 Step 3: Planning 296 8.3.2.4 Step 4: System Design and preparation of organization for the new system 296 8.3.2.5 Step 5: Familiarizing associating organizations with the system adopted 296 8.3.2.6 Step 6: Pilot Implementation 297 8.3.2.7 Step 7: System Implementation 297 8.3.2.8 Step 8: Post Implementation System Monitoring 297
8.3.3 Framework at the Level of Construction Professionals or People 298 8.3.4 Discussion 299
8.4 Summary 300 Chapter 9: Summary and Conclusions 9.1 Introduction 301 9.2 Summary of Research Findings 301
9.2.1 Summary of Research Process 301 9.2.2 Summary with Respect to Research Objectives 303
9.2.2.1 Research objectives (i,ii) 304 9.2.2.2 Research objective (iii - v) 305 9.2.2.3 Research objective (vi) 307 9.2.2.4 Research objective (vii) 307 9.2.2.5 Research objective (viii) 308
9.2.3 Summary of Data Analysis 310 9.3 Significant Research Contributions 313 9.4 Implications and Relevant Research Audience 315
9.4.1 Implications for National level bodies and Academic Institutions 315
9.4.2 Implications for Construction Organizations 316 9.4.3 Implications for People or Project Managers 316 9.4.4 Implications at International Level 317
9.5 Limitations of the Research Study 317 9.5.1 Limitations with respect to the Questionnaire Survey and Data Analysis 317 9.5.2 Limitations with respect to the Benchmarking Framework
Analysis 317 9.6 Recommendations for Future Research 318 9.7 Summary 319

____________________________________________________________________ ix
References 321 List of Appendices Appendix A: Questionnaire Survey 345 Appendix B: Interpretive Structural Modeling (ISM) Calculations 363 Appendix C: Structural Equation Modeling (SEM) Analysis Data 367 Appendix D: Benchmarking Framework 373 Appendix E: Data Envelopment Analysis (DEA) Data 379

____________________________________________________________________ x
LIST OF FIGURES Figure 1.1: Relation between Industry, Organization and People 5 Figure 1.2: Research Overview 9 Figure 2.1: Relation of ‘Strategy for ICT Adoption’ with the other Strategies of the Organization 33 Figure 2.2: Classification of Types of Benchmarking 41 Figure 2.3: Factors Affecting ICT Adoption for Building Project Management 55 Figure 3.1: Benchmarking Process Model 87 Figure 3.2: Graph Explaining the Concept of Efficiency Frontier 90 Figure 3.3: Graph Showing Production Function of CRS and IRS 92 Figure 3.4: SAP-LAP Paradigm 98 Figure 3.5: SAP-LAP Paradigm Synthesizes Analytic as well as Synthetic Mode of Inquiry 98 Figure 3.6: Rogers’s Five-Stage Model for D iffusion of Innovation 100 Figure 3.7: Rogers’s Technology Adoption Curve 102 Figure 3.8: Geofrey Moore’s Modified Technology Adoption Curve 102 Figure 3.9: Relation between Difficulty of Changing Versus Cost of Change 103 Figure 3.10: Research Framework 107 Figure 4.1: ISM Based Model 120
Figure 4.2: MICMAC Analysis (Driving Power and Dependence Diagram) 124 Figure 5.1: Distribution of the Respondent Organizations with respect to the Type of Organization 128 Figure 5.2: Distribution of the Respondent Organizations with Respect to the Size of Organizations 129 Figure 5.3: Mode of Project Execution by the Respondent Organizations (in last 5 years) 129 Figure 5.4: Distribution of the Respondents with Respect to Number of Years of Experience 130 Figure 5.5: Distribution of organizations (in %) for variable ICT adoption on Building Projects 135 Figure 5.6: Distribution of Respondent Organizations as per the Turnover in Indian Rupees (INR) 138 Figure 5.7: Percentage of office and site staff with access to computers 146 Figure 5.8: Distribution of Respondent Organizations for Rate of Increase of IT based Communication in last 5 years 147 Figure 5.9: Distribution of Organization for the Method of Receiving Bids 148 Figure 5.10: Distribution of Organizations for formal Time and Cost Management Processes Adoption 149 Figure 5.11: Mean and Std. Deviation Values of Respondent Organizations for Scores for Formal Time and Cost Management Processes Adoption 150 Figure 5.12: Method of Communicating Electronic Information within Office and with Project Sites 151

____________________________________________________________________ xi
Figure 5.13: Method of Communicating Electronic Information between Office and other Project Agencies 152 Figure 5.14: Relation between the groups in which the perceptions are studied 154 Figure 5.15: Matrix with the Distribution of Organizations for Different
Levels of Perceptions of Barriers and Benefits and Results of Scenario Building 162
Figure 5.16: Identified Issues and Cultural Factors 175 Figure 6.1: Structural Model Derived from the Hypotheses of Causal Relationships 179 Figure 6.2: Hypothesized Model to be tested 181 Figure 6.3: Modified Structural Model – Step 1 187 Figure 6.4: Modified Structural Model – Step 2 188 Figure 6.5: Standardized Path Coefficients and Factor Loadings of Model Modification - Step 3 (Final Model) 192 Figure 6.6: Final Structural Model 194 Figure 6.7: Aggregate Scores of Respondent Organizations for Tools used for Identified Project Management Processes 197 Figure 6.8: Mean and Std. Deviation of Respondent Organizations for Scores for Tools used for Project Management Processes 197 Figure 7.1: Relationship between Performance/Measurement Indicators 204 Figure 7.2: Construction Project Management Organization Structure with Respect to Decision Making and Information Management 206 Figure 7.3: Benchmarking Framework Indicators Spanning all the Levels of the Organizations 207 Figure 7.4: Comparison of Performance Measures Values of MI1 213 Figure 7.5: Comparison of Performance Measures Values of MI2 214 Figure 7.6: Comparison of Performance Measures Values of MI3 215 Figure 7.7: Comparison of Performance Measures Values of MI4 216 Figure 7.8: Comparison of Performance Measures Values of MI5 217 Figure 7.9: Comparison of Performance Measures Values of MI6 219 Figure 7.10: Comparison of Performance Measures Values of MI7 220 Figure 7.11: Comparison of Performance Measures Values of MI8 221 Figure 7.12: Comparison of Measurement Indicator Values for Three Organizations 222 Figure 7.13: Reference Comparison Values of PMCO with respect to REO 228 Figure 7.14: Reference Comparison Values of AO with respect to REO 229 Figure 7.15: Reference Contribution Values of PMCO and AO for Determining Potential Improvement Values of REO 230 Figure 7.16: Relation between Rating and Efficiency of Analyzed Organizations 231 Figure 7.17: Relation between all Data Analysis Components 232 Figure 7.18: Suggested Benchmarking Process 263 Figure 8.1: Salient Features of the Suggested Benchmarking Framework 279 Figure 8.2: Categorization of Building Project Management Organizations for ICT Adoption as Derived from the Benchmarking Framework 284

____________________________________________________________________ xii
Figure 8.3: Industry Level Framework for Planning, Designing and Implementing ‘Strategic Model for Enhancing ICT Diffusion
in Building Projects’ 287 Figure 8.4: Organization Level Framework for Planning, Designing and
Implementing ‘Strategic Model for Enhancing ICT Diffusion in Building Projects’ 291 Figure 8.5: Schematic Diagram of Model for Diffusion of ICT in the Indian Construction Industry for Buildin g Project Management 299 Figure 9.1: Categorization of Data Collection and Analysis Techniques and their Relation 303 Figure 9.2: Input Research Constructs and Output analysis Results at Each Stage of Study 311 Figure 9.3: Proposed Parameters for Measuring ICT Adoption for Building Project Management by Construction Organizations 312

____________________________________________________________________ xiii
LIST OF TABLES Table 2.1: Research Papers Discussing Research Conducted in India for IT Adoption by the Construction Industry 32 Table 2.2: Research Papers Discussing National Level Research Initiatives 37 Table 2.3: Research Papers Discussing International Research in Formulating Methodologies for Evaluating Information Systems in the Construction Industry 38 Table 2.4: Definitions and Salient Features of Benchmarking 39 Table 2.5: Research Papers Discussing Strategic Adoption of ICT in the Construction Industry 45 Table 2.6: Research Papers Discussing Synergy between Technology, Process and Cultural Issues 47 Table 2.7: Research Papers Discussing Perceived Benefits and Barriers of ICT Adoption in the Construction Industry 54 Table 2.8: Summarization of Research Conducted, Research Required and Validation of the Research Objectives 57 Table 3.1: Identification of Micro Variables for the Macro Variables and Type of Study Required for Each Variable 63 Table 3.2: Categorization of Organizations With Respect to Adoption of ICT and the Type of Change Required in the Process 104 Table 4.1: Perceived Benefits of ICT Adoption for Building Project Management 112 Table 4.2: Structural Self Interaction Matrix 114 Table 4.3: Initial Reachability Matrix 115 Table 4.4: Final Reachability Matrix with Transitivities (1) 115 Table 4.5: Iteration I 117 Table 4.6: Levels of Benefits 118 Table 4.7: Conical Form of Reachability Matrix 119 Table 5.1: Cronbach’s Alpha Values 130 Table 5.2: Non Parametric Friedman Test for Ranking Extent of Use of ICT between Different Groups 132 Table 5.3: Wilcoxon Signed Ranks Test for Comparing Internal
and External/collaborative use of ICT for Building Project Management 132
Table 5.4: Descriptive Statistics of Test Variables of Hypotheses HD2 and HD3 133 Table 5.5: t-test results for Hypotheses HD2 and HD3 133 Table 5.6: Organizations having Communication Management Strategy within the Organization 134 Table 5.7: Extent of ICT Adoption Varies between Different Projects 134 Table 5.8: Wilcoxon Signed Ranks Test for Comparing Reasons for Differential ICT Adoption on Building Projects 136 Table 5.9: Wilcoxon Signed Ranks Test for Comparing scores of Personal Meetings and Teleconferences 137 Table 5.10: Oneway ANOVA Test for Testing Relation between Turnover of the Organization and Extent of Use of ICT 139 Table 5.11: Descriptive Statistics for Hypothesis HR1 140

____________________________________________________________________ xiv
Table 5.12: Descriptive Statistics of test variable 'benefits' 141 Table 5.13: t-test Results for Perceived Importance of Benefits of use of ICT for Building Project Management 141 Table 5.14: Mean and Std. Deviation of the Perceived Industry Drivers 142 Table 5.15: Descriptive Statistics of Test Variable 'drivers' 143 Table 5.16: t-test Results for Perceived Industry Drivers for Increased Use of ICT for Building Project Management 144 Table 5.17: Descriptive Statistics for Hypothesis HS3 144 Table 5.18: Oneway ANOVA Test for Difference in Use of ICT for Different Groups of Sample Organizations 145 Table 5.19: Correlation Between Four Groups of Benefits 145 Table 5.20: Oneway ANOVA Test for Testing Relation between 'Percentage of Site Staff with Access to Computers' and 'Extent of ICT Adoption' 146 Table 5.21: Descriptive Statistics of 'Extent of ICT Adoption' for Distribution of 'Percentage of Site Staff with Access to Computers' 147 Table 5.22: Software used for Building Project Management 153 Table 5.23: Descriptive Statistics – Perceived Barriers 155 Table 5.24: Descriptive Statistics – Perceived Enablers 157 Table 5.25: Descriptive Statistics – Perceived Benefits 160 Table 5.26: Mean and Std. Deviation for Test Variable ‘emailpho’ 163 Table 5.27: t-test Results for Communication in which e-mail is followed by Phone Call 163 Table 5.28: Mode of Information Storage 164 Table 5.29: Response of Organizations for Methodology Most Often Used
for Communicating Information for General Administration Processes (80%-100% times) 165
Table 5.30: Response of Organizations for Methodology Most Often Used for Communicating Information for Building Project Management
Processes (80%-100% times) 166 Table 5.31: Descriptive Statistics for the Perceived Factors 167 Table 5.32: Identified Issues that are required to be Addressed 169 Table 6.1: Model Specification 180 Table 6.2: Regression Weights/Path Coefficients and Factor Loadings 185 Table 6.3: Covariance between Exogenous Variables 186 Table 6.4: Estimates 189 Table 6.5: Model Fit Indices 190 Table 6.6: Squared Multiple Correlations 191 Table 7.1: Identified Gaps in Practice and Trends 223 Table 7.2: Categorization of Identified Trends 225 Table 7.3: Inputs and Outputs for DEA Analysis 226 Table 7.4: Data Values for Three Analyzed Organizations 227 Table 7.5: Efficiency Scores for Analyzed Organizations 227 Table 7.6: Potential Improvement Required in REO 229 Table 7.7: Gaps in Practice and the Identified Reasons (REO) 241 Table 7.8: Gaps in Practice and the Identified Reasons (PMCO) 247 Table 7.9: Gaps in Practice and the Identified Reasons (AO) 254 Table 7.10: Actions Required to Increase ICT Adoption for Building Project Management in the Studied Organizations and Expected Performance Changes 255
____________________________________________________________________ xv
Table 7.11: Relation between Identified Trends and Collective Actions 257 Table 7.12: Relation between Identified Trends, Gaps in Practice and Suggested Actions 262 Table 8.1: Relation between the Suggested Scenario Building framework
and the Benchmarking Framework 275 Table 8.2: Required Strategic Industry Level Implementation Actions 288
____________________________________________________________________ xvi
LIST OF ABBREVIATIONS AND ACRONYMS 3D 3 Dimensional 4D 4 Dimensional AEC Architecture Engineering Construction AMC Annual Maintenance Contract AMOS Analysis of Moment Structures ANOVA Analysis of Variance AO Architectural Organization ASEAN Association of South East Asian Nations B2B Business to Business CD Compact Disc CDT Corporación de Desarrollo Tecnológico CEO Chief Executive Officer EDM Electronic Document Management CFI Comparative fit index CIC Computer Integrated Construction CII Construction Industry Institute CORENET Construction and Real Estate NETwork CRC CI Cooperative Research Center for Construction Innovation CRS Constant Returns to Scale CSCW Computer Supported Collaborative Work DEA Data Envelopment Analysis DISR Department of Industry, Science and Resources DMU Decision Making Unit DRS Decreasing Returns to Scale DTI Department of Trade and Industry ERP Enterprise Resource Planning FM Facilities Management GDP Gross Domestic Product GFI Goodness of Fit index GIS Geographical Information System GPS Global Positioning System HR Human Resource HVAC Heating Ventilating and Air Conditioning I-O Input-Output ICPM Integrated Construction Project Management ICT Information Communication Technologies IFC Industry Foundation Classes IM Interactive Management INR Indian Rupees IRS Increasing Returns to Scale IS Information Systems ISM Interpretive Structural Modeling ISO International Standardization Organization IT Information Technology KPI Key Performance Indicators LAN Local Area Network

____________________________________________________________________ xvii
M&E Material and Equipment MI Measurement Indicator MIS Management Information Systems MS Microsoft NFI Normed fit index ORCM Online Remote Construction Ma nagement PM Project Management PMBOK Project Management Book of Knowledge PMCO Project Management Consultancy Organization PMI Project Management Institute R&D Research and Development REO Real Estate Organization RFI Request for Information RFID Radio Frequency Identification Device RMSEA Root Mean Square Error of Approximation SAP-LAP Situation Actor Process – Learning Action Performance SEM Structural Equation Modeling SME Small and Medium Enterprise SPSS Statistical Package for Social Sciences SSIM Structural Self- Interaction Matrix STD. Standard STEP Standard for the Exchange of Product data TPC Technology-process-culture UK United Kingdom US United States USA United States of America USB Universal Serial Bus VRS Variable Returns to Scale WAN Wide Area Network

____________________________________________________________________ xviii
ACKNOWLEDGEMENT
The journey of my research study has been challenging, exciting, apprehensive and a
novel experience for me. Research was primarily conducted in India, but I never felt
alien to the administrative and education system of QUT.
I would like to express my sincere gratitude and thanks to my principal supervisor,
Associate Professor Jay Yang for having faith in me and giving me an opportunity to
conduct research under his supervision, as an external student. His insightful advice
and constant support was always a great help.
I would like to thank my external supervisor, Assistant Professor Ravi Shankar for
his invaluable and enriching comments, for spending lot of his valuable time in
supervising me and for providing structure to my research. The rigorous analysis in
this research has been possible due to the infrastructure support that I received from
his institute, IIT Delhi.
I am grateful to my associate supervisor, Professor Martin Skitmore for his
invaluable suggestions in the early stages of the research, as they provided a
direction to the research.
I would like to thank administrative staff of BEE research office as well as of other
departments of QUT with whom I have communicated during these three years. They
helped me in having a smooth research journey and I never felt that I was so much
geographically away from QUT.
I am grateful to all the respondents of questionnaire survey for taking out time from
their busy routine to answer the questionnaire and to Dr. Tulsi Adhikari for providing
necessary help.
My husband Punit and my parents have always been there for me as a rock support.
Last but not the least I want to thank my children Satvik and Bhumika who at their

____________________________________________________________________ xix
tender age understood the importance of this research for me. In the beginning it was
difficult for them to comprehend it, but by the end of the research period they were
keeping a check on my timeline and helping me in every possible way that they
could. This research would not have been possible without their support. I dedicate
this thesis to them.

____________________________________________________________________ xx
PUBLICATIONS
Papers Published
Yang, J., Ahuja, V. and Shankar, R., 2007. Managing Building Projects through
Enhanced Communication – An ICT Based Strategy for Small and Medium
Enterprises, Proceedings of the CIB World Building Congress 2007, Cape
Town, South Africa, May, 2007.
Ahuja, V., Yang, J. and Shankar, R., 2006. Strategic Use of ICT for Construction
Organisations - Requirements and Implementation Issues, Proceedings of
INCITE / ITCSED 2006 Conference, Organized by Construction Industry
Development Council India and Glasgow Caledonian University, November
2006, New Delhi, India, 1, pp.235-250.
Ahuja. V., Yang, J. and Shankar, R., 2006. Web Based Communication for
Construction Projec t Management, Proceedings of the World Conference on
Accelerating Excellence in the Built Environment, Birmingham, UK, October,
2006.
Yang, J. and Ahuja, V., 2006. Communication Protocol for Building Project
Management - ICT Enhanced Approaches for the Indian Building Practice,
Proceedings of the CIB W089 Conference: BEAR 2006, Hong Kong, China,
April, 2006.
Ahuja. V. and Yang, J., 2005. Towards ‘IT’ Enabled Supply Chain Communication
in Construction Project Management, In Ribeiro, F.L., Love, P.E.D., Davidson,
C.H., Egbu, C.O. and Dimitrijevic, B. Ed. Proceedings of CIB Conference on
Information and Knowledge Management in Global Economy, Lisbon,
Portugal, 1, pp.289-302.

__________________________________________________________________________________ Page 1
Chapter 1: Introduction
CHAPTER 1
INTRODUCTION 1.1 Research Background
1.1.1 Building Project Management and ICT
Building construction projects involve many stakeholders or agencies at all the stages
of the projects from design to construction and for each project the supply chain is
different. Projects are managed by designated Project Managers, Architects,
Contractors on behalf of the Client or by the Clients themselves depending upon the
contract and the project type. Project Managers are required to facilitate the
integration of work of all the agencies and project team organizations are
geographically separated beyond national boundaries or in the context of large
countries like India, within the national boundaries. Also, there is increased demand
to complete the projects within estimated time, cost and as per the specified quality.
One of the building industry’s answers to increased demands is to make better use of
information and knowledge that is generated in all stages of development because
communication or data handling often takes about 75% to 90% of a project
manager’s time in the construction industry (Fisher and Yin 1992; Alshawi and
Ingirige 2002). Also, two-thirds of the construction problems are caused by
inadequate communication and exchange of information and data, where 85% of
commonly associated problems are process related and not product related (Smit et
al. 2005). The key to project information management consists of the information
flows associated with inter-organizational communication (Stewart et al. 2005) and
the effectiveness of the project manager to communicate, evaluate and feedback to
the rest of the project team during each stage of the project life -cycle determines how
efficiently the project’s goals will be achieved (Alshawi and Ingirige 2002). Thus,
there is a requirement of a system that provides; shared project information, analysis
tools to analyze the information, a collaborative infrastructure to handle the flow of
information, a multi device access to the pertaining information and a system that

__________________________________________________________________________________ Page 2
Chapter 1: Introduction
ensures the persistence of the underlying information among the participants (Pena-
Mora and Dwivedi 2002).
Collection, analysis and real time communication of information is essential for the
quick detection of time, cost, scope and quality deviations from planned performance
and timely decision making for responding to problems, disputes and deviations
detected from the planned performance. At present, the communication problem
between the team members is often a cause for project delay, expensive reworking
and building defects (Huang et al. 2002) and with traditional tools of communication,
the project managers often lose the ability of timely change management. Required
communication can be achieved by using IT for effective data management and
information communication or by using Information Communication Technologies
(ICT).
ICT provides opportunities for real time access of information to all and improves
coordination and collaboration between project team members. Benefits of ICT
adoption include an increase in the quality of documents and speed of work; better
financial control and communications, and simpler and faster access to common data
as well as a decrease in documentation errors (Nitithamyong and Skibniewski 2006).
ICT is required not only to free up project managers for more decision making tasks
but also to deliver the required levels of ‘consistency and reliability’ of information
in the construction supply chains because use of incorrect data can compromise the
scheduled completion of a project and lead to wastage of resources (Sturges and
Bates 2001).
1.1.2 ICT Adoption in the Construction Industry and Research Requirements
The construction industry has been slow in embracing IT tools and techniques and
compared to other sectors, available and often easily accessible technology is not
being utilized to the full. This is reflected both, in the literature and in practice (Opfer
1997; Egbu et al. 2001; Love et al. 2004). This is due to a number of historical,
industrial and market forces that perpetuate the industry’s culture, thus affecting the
extent of ICT adoption in day-to-day business processes (Baldwin et al. 1999).
Effective adoption or diffusion of ICT through organizations is required to be

__________________________________________________________________________________ Page 3
Chapter 1: Introduction
effectively managed to better prepare for future ICT applications adoption
(Peansupap and Walker 2005) and issues for slow adoption of ICT are required to be
studied. The issues can be categorized as technical, managerial, cultural and
socio/political due to differing perceptions of project team members. The
requirement is to match technological innovation with the perceived needs and
preparedness for change on the part of the industry (Weippert and Kajewski 2004).
ICT adoption research is a component of research dealing with IT adoption in the
construction industry. A review of the literature review indicates that IT research in
construction until now has predominantly had a technical rather than a managerial
focus such as investment justification, strategy and strategic information systems
planning (Love et al. 2004). Little consideration has been given to the ‘human
factors’ associated with IT exploitation, like issues of team working, culture and
motivation of the workforce to embrace IT for team working through different
approaches, including training and education (Egbu et al. 2002). But, in a technology
driven change of any kind, the technology itself is only one of the several inter-
related components that potentially ensure improved performance (Cabrera et al.
2001 cited in Weippert and Kajewski 2004). With respect to ICT, its implementation
will inevitably be unsuccessful if the organization’s culture is not properly aligned
with, and supportive of an overall business strategy (Schneider 2000 cited in
Weippert and Kajewski 2004). So, research should also consider strategic as well as
managerial issues (Back and Moreau 2000). It should become a business objective of
the construction industry and should give equal prominence to technology, people
and processes involved in construction projects. Only in such a scenario will it be
adopted by the industry as a whole.
(SMEs) as 97% of the organizations employ less than 20 persons, and can be
classified as Small and Medium enterprises (SMEs) (Katranuschkov et al. 2001). So,
the communication management research is required to address management and
communication processes adopted by SMEs. These issues can be addressed by global
research, but also require clear understanding of the management and communication
processes followed by SMEs of each distinct regional area or country.

__________________________________________________________________________________ Page 4
Chapter 1: Introduction
1.1.3 IT Enhanced communication protocols
‘Protocol’ is defined as an accepted behavior in a situation. IT enhanced
communication is a component of a computerized information system which
includes generating, coding, processing, storing and communicating information
(Chitkara 2001, p.529-550). Thus, IT enhanced communication protocols are
required to define accepted methods of conducting these processes. In a construction
project, all the supply chain members are brought together to achieve one main
objective i.e to develop and build a particular project (Villagarcia and Cardoso 1999)
to meet desirable goals and standards. At all stages of the project, information is
generated, stored and communicated by all the supply chain members. So, to have
effective communication, all the supply chain members should follow the accepted
methods or the communication protocols. Also, at any time, each construction
organization is involved in more than one project and is a part of more than one
supply chain (Dainty et al. 2001). This unique nature of the construction industry
necessitates that the communication protocols are adopted by the industry as a whole
and do not remain project specific. With the advent of ICT, communication protocols
that support the effective adoption of ICT by the whole industry are required to be
developed. As per McDonagh (1995) the potential of the new technologies including
IT would be fully realized and optimized only if frameworks or principles are
developed and adopted for comprehensive, integrated information systems which
permit consistency and ease of exchange of information be tween different users of
the same information in different combinations for different purposes and across the
whole range of projects and programs.
People, who are a part of different project team organizations, manage projects and
the project team organizations are a part of the construction industry (Fig. 1.1). In an
organization, adoption of ICT is primarily initiated by top management, but effective
adoption of ICT is still dependent on project managers who have the main
responsibility for managing the construction projects (Peansupap and Walker 2005).
So, the protocols have to address technical, managerial, social and cultural issues and
be implemented at the level of industry, organization and project or people.

__________________________________________________________________________________ Page 5
Chapter 1: Introduction
1.2 Research Problem, Aim and Objectives
Based on the discussed research background, the research problem is defined as
below:
Building project management requires collaboration and coordination between all the
project team organizations, which can be achieved by effective communication
management. When project team organizations are geographically separated, such
effective communication can be achieved by IT enabled communication or by ICT.
Construction industry has been slow in adopting ICT and research is required to
study the factors affecting ICT adoption for building project management and to
develop communication protocols to be adopted by the construction industry. But,
majority of the organizations in the construction industry are SMEs and research is
required to address the specific requirements and management and communication
processes followed by SMEs of each distinct regional area or country.
1.2.1 Research Aim
The Research Aim is to develop protocols for effective adoption of Information
Communication Technologies (ICT) for Building Project Management by Small and
Medium Enterprises (SMEs) in the Indian construction industry.
The Oxford dictionary defines the word ‘effective’ as ‘producing the intended
result’. In the context of this research, effectiveness of ICT adoption can be assessed
INDUSTRY
ORGANIZATION
PEOPLE
Fig. 1.1 Relation between Industry, Organization and People
__________________________________________________________________________________ Page 6
Chapter 1: Introduction
by the extent to which ICT tools and technologies replace manual methods in the
information system supporting building project management processes. Research
would identify the critical success factors that can help SMEs overcome the
technical, managerial, social and cultural barriers for effective ICT adoption for
building project management i.e getting the intended results or maximum benefits of
ICT adoption in the industry. The research is in the context of the Indian construction
industry. As shown by the preliminary literature study conducted, the requirement is
to develop technical and managerial protocols to be adopted at industry, organization
and people/project levels so that in the industry, ICT becomes an integral part of the
building project management process. Such research requires an understanding of the
basic project management processes executed by SMEs in Indian Construction
Industry; method of communication adopted; perceived drivers, barriers and enablers
affecting ICT adoption and perceived benefits of ICT.
1.2.2 Research Objectives
Research Objectives in support of the Research Aim are discussed below:
i. To identify generic project management processes adopted by SMEs in India
for building project management.
ii. To identify the extent of Information communication technologies (ICT)
adopted by SMEs for building project management.
iii. To identify perceived barriers and associated enablers for IT enhanced
communication management by SMEs and to develop model for establishing
structural relationships amongst them.
iv. To assess perceived industry requirements driving adoption of ICT by SMEs.
v. To identify perceived benefits of ICT adoption.
vi. To identify factors other than perceived enablers, barriers, benefits and industry
drivers affecting adoption of ICT.
vii. To study the causal relationships between all the identified factors.
viii. To provide a framework for increasing effective ICT adoption for Building
Project Management and suggest method of validation of the framework.

__________________________________________________________________________________ Page 7
Chapter 1: Introduction
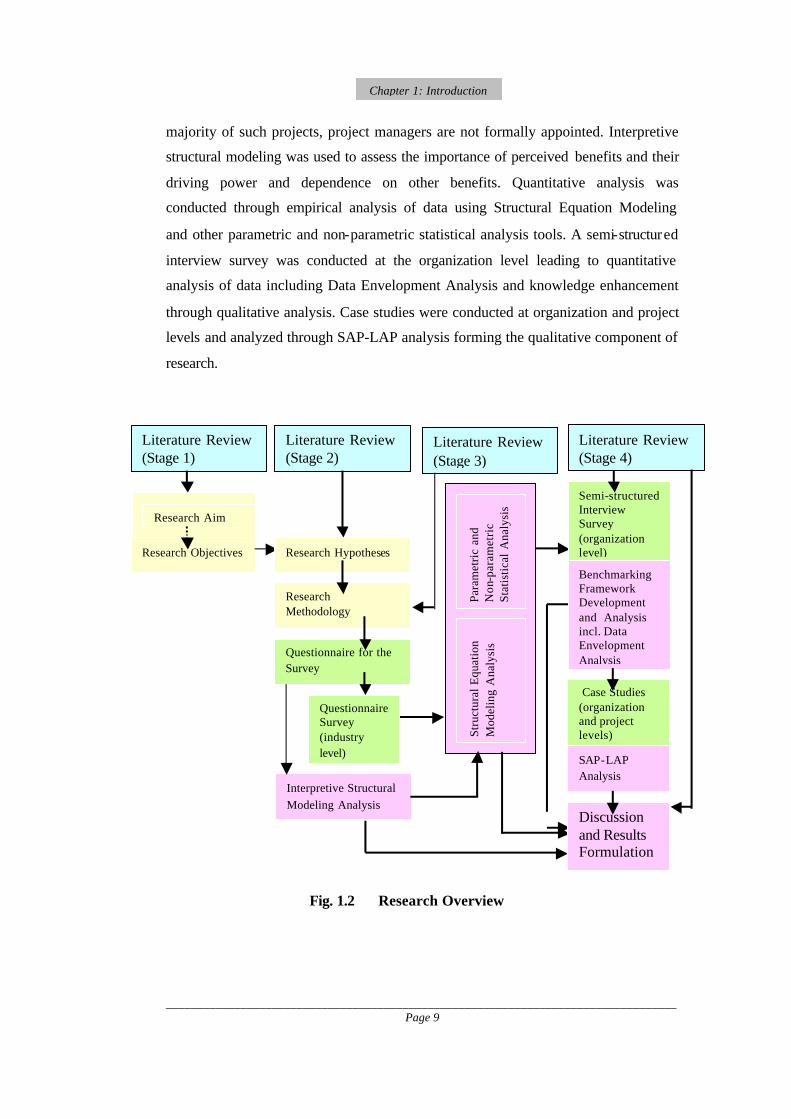
1.3 Research Overview
Research Aim and Objectives conceptualized the focus of this study, projecting
factors and issues that underpin effective ICT adoption by SMEs for building project
management. This section provides an overview of the research process. Research
methodology is described in detail in Chapter 3, which presents a description of the
research methods that addressed the issues related to this study.
The research endeavor was not to automate the current communication process, but
rather to align it for adoption of the unique capabilities of computers over those of
humans. As ICT adoption is to be based on the principle that technology adoption
should be business driven, ICT facilitated communication protocols should play a
part in and be integral with construction development phases and business processes.
Research Framework
A research framework helps to structure the research process into logical steps and
appropriate stages. The establishment of an action plan helps to guide and direct the
research so that there is a clear connection between all the stages, i.e formulation of
research aim and objectives, literature review, data collection and analysis and the
findings and conclusions identified in the course of the analysis. Fig. 1.2 provides an
overview of the research framework that encompasses the research processes, which
were applied and were suitable for this research.
The research process was supported at all stages by a detailed literature review and
study of conceptual as well as empirical literature. The literature was reviewed at
four separate stages in the research process. The first stage review was a preliminary
exploration of the communication system adopted for building project management,
structure of the construction industry and related issues that required consideration
and further study. Thus, it involved a review of the conceptual literature concerning
the concepts and theories and the empirical literature consisting of earlier studies,
which are similar to the one proposed. This material is presented mainly in Chapter 1
as an introduction to the research and led to the formulation of research problem and
objectives. The second stage of the review was conducted to study the research

__________________________________________________________________________________ Page 8
Chapter 1: Introduction
background in context of research objectives. This helped in identification of
research variables and research areas. It validated the research objectives. This part
of the literature review is presented in Chapter 2. The third stage of the literature
review was related to the study of research methodologies. It was an important stage
of literature study as only by using appropriate methodologies and methods of
research, applied with rigor, can the body of knowledge for construction be
established and advanced with confidence (Fellows and Liu 2003). This study led to
the formulation of research design and finalization of research methodology. This
part of the literature review is presented in Chapter 3 and subsequently discussed in
detail in related chapters. The fourth stage of the literature review or advanced
literature review was conducted after the questionnaire survey. It helped in the
formulation of research construct for the semi-structured interview survey and case
studies analysis and was drawn upon for discussion and formulation of results. It is
presented intermittently from Chapter 7. The whole process of literature review
facilitates continuous knowledge building that is required for the research process.
The research design is concerned with making the research problem researchable by
setting up the study in a way that will produce specific answers to specific questions
(Oppenheim 1992). The Research Methodology was designed to achieve the research
objectives by way of including effective data collection, analysis and their validation
methodologies. The study required an understanding of the present status of ICT
adoption for building project management by SMEs, measure of identified factors
affecting ICT adoption and causal relationships between these factors. Some of the
factors could be measured quantitatively, but some factors like human or cultural
factors required qualitative assessment. Thus, the research methodology divided the
research into quantitative and qualitative research. Data for quantitative analysis was
collected through a questionnaire survey. The organizations that were included in the
survey sample, were either managing building projects after being appointed as
Project Managers or had the authority to manage their projects if a Project Manager
had not been appointed formally. Therefore three groups of organizations were
included in the sample: builders including contractors who construct and manage
their own projects; project management consultancy organizations which are
formally appointed as project managers on building projects and architectural
organizations which manage small to medium size building projects since for
__________________________________________________________________________________ Page 9
Chapter 1: Introduction
majority of such projects, project managers are not formally appointed. Interpretive
structural modeling was used to assess the importance of perceived benefits and their
driving power and dependence on other benefits. Quantitative analysis was
conducted through empirical analysis of data using Structural Equation Modeling
and other parametric and non-parametric statistical analysis tools. A semi-structured
interview survey was conducted at the organization level leading to quantitative
analysis of data including Data Envelopment Analysis and knowledge enhancement
through qualitative analysis. Case studies were conducted at organization and project
levels and analyzed through SAP-LAP analysis forming the qualitative component of
research.
Str
uctu
ral
Equ
atio
n M
odel
ing
Ana
lysi
s P
aram
etri
c an
d N
on-p
aram
etri
c S
tati
stic
al A
naly
sis
Literature Review (Stage 3)
Fig. 1.2 Research Overview
Research Aim
Research Objectives
Literature Review (Stage 1)
Research Hypotheses
Questionnaire for the Survey
Questionnaire Survey (industry level)
Interpretive Structural
Modeling Analysis
Literature Review (Stage 2)
Research Methodology
Literature Review (Stage 4)
Semi-structured Interview Survey (organization level)
Discussion and Results Formulation
Benchmarking Framework Development and Analysis incl. Data Envelopment Analysis
Case Studies (organization and project levels)
SAP-LAP Analysis

__________________________________________________________________________________ Page 10
Chapter 1: Introduction
1.4 Delimitation of Scope
This section helps to identify a planned, justified scope of the study beyond which
generalization of the results was not intended. The identified delimitations are
additional to the limitations and key assumptions. ‘Delimitations’ are within the
control of the researcher and ‘limitations’ are not. Limitations caused by the methods
used are identified and explained in Chapter 9 as summary of all the limitations that
became evident throughout the course of the study. Key assumptions are described in
relevant sections.
The identified delimitations are discussed below:
• The research is conducted for building project management and data is
collected from organizations responsible for the management of building
projects. The results could be generalized for heavy civil construction, but
after due consideration of the characteristics of supply chain issues, the size
of participating organizations, management procedures and contract
conditions relevant for heavy civil construction.
• The research is conducted from the perspective of Small and Medium
Enterprises (SMEs). The results can be generalized for larger organizations,
but some of the identified factors affecting ICT adoption for building project
management might not be relevant for large organizations.
• Research data was collected from the Indian construction industry and the
results are applicable for India. However, these results can be generalized for
other countries after studying the extent and characteristics of similarities
between the construction industries of these countries.
• Suggested communication protocols are arrived at after studying technical,
managerial and social/cultural factors affecting ICT adoption for building
project management. But, the technical issues are studied in terms of the
applicability, usage and standardization of features and not with respect to
development of technical features.

__________________________________________________________________________________ Page 11
Chapter 1: Introduction
1.5 Outline of the Thesis
The chapters in this thesis are so structured that each chapter can be read and
understood autonomously. They are presented sequentially as an integral part of the
whole thesis with relevant referencing and linking information to the preceding and
succeeding chapters. Each chapter encapsulates elements of the design process that
satisfy the aim and objectives of this research and demonstrates an understanding and
appreciation of research processes, methodologies, analysis, writing up, discussion
and summarization of results based on analysis and acquired knowledge. Each
chapter starts with an introduction and ends with the summary of research discussed
in the chapter. In each chapter intermediate results or issues that are studied in
subsequent chapter are shown in a highlighted box.
Chapter 1 introduces the research background related to the importance of effective
communication for building project management and ICT adoption to achieve this.
Based on this research background, the research problem, aim and objectives are
formulated. This chapter also presents a brief overview of the research framework
and research scope.
Chapter 2 presents a review of the literature related to ICT adoption for building
project management, characteristics and specific requirements of SMEs and the
characteristics of the Indian Construction Industry. Factors affecting ICT adoption
have been identified at the level of industry, organization and people. The study of
global research conducte d in this area helped in the identification of the gap in
literature and research areas.
Chapter 3 provides discussions on the processes by which the research objectives
are achieved. It examines in detail the issues pertaining to the research design and
methodology, data collection and analysis methods, key research activities and
validation methods. Research hypotheses are formulated and after discussion about
research methodology, the framework for synthesis of the research components and
results formulation is discussed.

__________________________________________________________________________________ Page 12
Chapter 1: Introduction
Chapter 4 presents Interpretive Structural Modeling (ISM) analysis of the
relationship between the perceived benefits of adopting ICT for building project
management. Analysis results identify the dependence and driving power of each
benefit with respect to other benefits. A developed ISM model is then presented and
additional hypotheses are formulated.
Chapter 5 presents empirical analysis of data collected through the questionnaire
survey. Analysis is conducted through parametric and non-parametric statistical
techniques. Hypotheses are tested, discussion on perception based data is presented
and the analysis is summarized.
Chapter 6 presents a structural model of causal relationships between quantifiable
factors affecting ICT adoption for building project management, derived from
‘Hypotheses of causal relationships’. This structural model is tested through
Structural Equation Modeling (SEM) technique and the final model is presented.
Chapter 7 presents a framework for benchmarking ICT adoption for building project
management. It further discusses finalization and validation of the framework
through semi-structured interviews conducted at the organization level in three
organizations which had also responded for the questionnaire survey. It includes
measurement of efficiency of organizations in implementing their strategies for ICT
adoption. It is conducted through Data Envelopment Analysis (DEA) technique. This
chapter also discusses case studies of these three organizations conducted at
organization and project levels. Case studies are analyzed through SAP-LAP analysis
and social, cultural and behavioral factors affecting ICT adoption are studied.
Chapter 8 synthesizes the results of research studies conducted for achieving the
research aim and objectives. The results or the IT enhanced communication protocols
are discussed as a generic framework of a ‘Strategic Model for Enhancing ICT
Diffusion in Building Projects’.
Chapter 9 summarizes the research study. It presents a summary of findings,
significant research contributions, implications of research at the level of industry,

__________________________________________________________________________________ Page 13
Chapter 1: Introduction
organization and people and also discusses the limitations of the research study. It
also identifies future research scope emanating from the research study conducted.
1.6 Summary
This chapter discussed the basic premise for the research and the thesis. It first
introduced the research background, which helped in the identification of the
research problem. The research aim and objectives were established. An overview of
the research process was briefly discussed and the research scope was identified. An
outline of the thesis structure was also presented. This chapter leads to the detailed
discussion of the research process, with the next chapter presenting the literature
review.


__________________________________________________________________________________ Page 15
Chapter 2: Literature Review
CHAPTER 2
LITERATURE REVIEW 2.1 Introduction
The construction industry is a data based and information dependent industry. The
amount of information generated and exchanged during all the stages of a project can
be substantial (McIntosh and Sloan 2001) and in various formats: drawings, contract
documents, analysis results, planning schedules, photographs, reports. Further, the
project participants are changed with every project and the information generated by
many sources, at many levels of abstraction and detail, and retained by the creator of
that information contributes to fragmentation of the industry (Smit et al. 2005).
Construction projects involve large capital investments, multi-disciplines, widely
dispersed project participants, tighter schedules, and stringent quality standards and
these factors coupled with high-speed developments in Information and
Communication Technology (ICT) have influenced the project management
practices to take a new turn (Alshawi and Ingirige 2002). But, the literature survey
and the study of the construction industry reflect that the available technology is not
being utilized to its full potential (Egbu et al. 2001). This can be achieved by giving
careful consideration to the human touch (Weippert and Kajewski 2004) i.e. cultural
issues and strategic adoption of ICT in the industry.
In construction industry, majority of the construction organizations can be
categorized as Small and Medium enterprises (SMEs) and the communication
management research is required to address management and communication
processes adopted by SMEs. Also, by virtue of the number of organizations, greatest
strategic scope exists at this level (ed. Betts 1999, p. 58). Thus, strategic adoption of
ICT by the construction industry is defined by the strategic and operational
requirements of SMEs. These issues can be addressed by global research, but also
require clear understanding of the management and communication processes
followed by the SMEs of each distinct regional area or country.

__________________________________________________________________________________ Page 16
Chapter 2: Literature Review
2.2 Construction Information and ICT
Information in a construction organization can be grouped under three categories:
• Information required for managing internal operations of the organization.
• Information required for assessing the construction industry, organization’s
position in the industry and the policy decisions required for future direction.
• Information required for managing construction projects.
For the first category of information, ICT is required to integrate the communication
between all departments or engineering groups, branch offices or organizational sub-
units and levels within the organizations.
For the second category of information, ICT is required to bring agility into the
information system. A constant flow of information from internal and external
sources allows informed decision making and improves the environmental scanning
and the co-ordination of a response (Retik and Langford 2001).
The third category of information is generated due to the communication between the
organizations and the multiple agencies which are a part of the project team. Project
information is usually considered as the processed and presented data in a given
situation, and is the data that enables effective action (Marsh and Flanagan 2000
cited in Smit et al. 2005).
The significance of the scale of project information management and the requirement
to adopt ICT in projects can be understood by the following information reported in
an Australian Government report: “A $10 million project with monthly cash-flows of
$500,000 might have as many as 50 contracts, 5 different consultants, 200 tenders,
600 final drawings, 3,000 amended drawings, 150 contract variations, 600 site
instructions, and 6 meetings per week” (Fujitsu Center Report 1998 cited in Weippert
et al. 2002).

__________________________________________________________________________________ Page 17
Chapter 2: Literature Review
2.3 ICT and Building Project Management
In a building project, various stakeholders are involved at all the stages and project
managers are required to integrate efforts of all the stakeholders.
The Egan report stresses the requirement for project managers to integrate the
projects’ phases (from conception to final delivery) leading to performance
improvement (Alshawi and Ingirige 2002). Intense integration of alliance partners
requires excellence in communication at all levels, i.e. at Application level, System
level and Business level or Industry level (Fischer and Froese 1996; Alshawi and
Ingirige 2002; Walker et al. 2002). As per Walker et al. (2002) this generally requires
a quantum leap in the adoption of shared IT systems and information processing
integration. Thus, individual information systems developed by individual functional
managers or construction managers are required to be integrated for a project.
Integration strategies on the construction projects include managerial and technical
strategies. Technical integration focuses on workplace technology to improve
integration, particularly computer-integrated construction (CIC), which strives to
share the information among computer applications (Fischer and Froese 1996). For
managerial integration, Internet and Intranet related Computer Supported
Collaborative Work (CSCW) applications and especially Web-related applications
are one of the major concerns of CSCW research (Zhu et al. 2001). Study of the
literature identifie s that there is research being conducted with respect to
information/communication management to enhance collaborative project
management on construction projects (Rezgui et al. 1998; Construct IT for Business
Report 2000b; O’Brien, 2000; Pena -Mora and Dwivedi 2002).
The collaboration among the diverse participants in a project is essentially measured
by how effectively the communication channels were managed. The effectiveness of
the project manager to communicate, evaluate and feedback to the rest of the project
team during each stage of the life cycle determines how efficiently the project’s goals
will be achieved (Alshawi and Ingirige 2002). A Project Manager managing multiple
projects typically shares resources with team members working on many projects
over a shorter time. In such a situation, the key management issues could be resolved

__________________________________________________________________________________ Page 18
Chapter 2: Literature Review
by good communication management (Haugan, 2002, p.12-18). Also, in this scenario
it is essential not only to support the communication processes within a project, but
also to consider the multi-project work and the individual requirements of the players
as well (Katranuschkov et al. 2001). The communication system should be:
Sufficiently flexible so that it can be modified to suit the unique requirements of the
individual project managers; Adaptable to many different projects; and Adaptable to
differing customer information requirements.
Research has highlighted the importance of effective communication for the success
of a project (Thomas et al. 1998; Tam 1999). It was concluded in a study that the top
thirty potential problems contributing to poor project performance could be classified
under five categories, out of which communication problems were listed as the third
category and all the five categories involve communications to some extent (Thomas
et al. 1998).
The time delays and increased cost of construction projects can be traced back to
poor coordination caused by inadequate information, insufficient, inappropriate,
inaccurate, inconsistent, or late information or a combination of them all (Tam 1999).
Communication has also been linked to team effectiveness, the integration of work
units across organizational levels, characteristics of effective supervision, job
satisfaction, and overall organizational effectiveness (Green 2001).
The extensive physical distance between project participants, extending over national
boundaries is one of the main causes leading to delays in decision-making (Deng et
al. 2001 cited in Alshawi and Ingirige 2002). In such a scenario, communication
problems, ranging from delays to distortion of messages, impose strains on project
management in construction (Alshawi and Ingirige 2002).
In the construction industry, supply chains are typically formed by all the project
team organizations. SMEs occupy a critical role in these supply chains and given the
number of specialist firms operating within the construction industry, there are
considerable challenges in terms of improving project performance through better
supplier integration and ensuring process conformity and alignment (Dainty et al.
2001). Alshawi and Ingirige (2002) identified that communication often takes about

__________________________________________________________________________________ Page 19
Chapter 2: Literature Review
75% to 90% of a project manager’s time in the construction industry and computer
based systems are required not only to free up the managers for more decision-
making tasks but also to deliver the required levels of ‘consistency and reliability’ of
information in the supply chains.
The specific characteristics of Supply Chain communication management for
building projects can be summarized as under (Ahuja and Yang 2005):
• The total information structure is required to be integrated in terms of
generation and flow of information and associated decision-making.
• Throughout the project lifecycle, team organizations are required to obtain
real time information, as they are required to coordinate and collaborate for
project execution. Availability of real time information also helps in change
management, which is an intrinsic part of construction projects.
• To achieve integrated information processing, there should be an automated
flow of information between all the software used by project team
organizations. Appropriate categorization of information and the streamlining
of reporting requirements is necessary.
• At various points in the supply chain, information is collected from various
team organizations and then collated and processed for shared use.
Standardization of data handling processes as well as project information is
required to ensure maximum efficiency.
Adoption of ‘IT enhanced communication’ or ‘Information Communication
Technologies’ (ICT) can help in achieving required communication in building
projects. Jaafari and Manivong (1998) summarize the research in this area by stating
that effective implementation of ICT within projects, as well as the entire industry,
would improve the communication processes by an order of magnitude, and would
thus benefit the delivery of all the phases and functions on projects.
2.4 ICT Tools and Technologies
ICT is being adopted for building project management. Internet is the worldwide
system for exchanging and distributing free-format information and is regarded as an

__________________________________________________________________________________ Page 20
Chapter 2: Literature Review
ideal platform for building up Information Systems (Smit et al. 2005). It has evolved
from being a scientific ne twork only, to a platform that is enabling a new generation
of business (Li et al. 2003a) or e-business that includes electronic project information
exchange, e-commerce and e-tendering (Construct IT for Business Report 2000b) .
Internet and its object-oriented client/server applications can be explored in various
formats for the communication purposes. Internet is also increasingly being adopted
for project management within the construction industry and has shown to help in
timely, well-integrated and effective project delivery (Construct IT for Business
Report 2000b).
Internet as the communication platform facilitates speedy transmission of
information and also saves money in communication with overseas construction sites
through the computer network. The system offers many benefits such as improved
efficiency, better management and decision-making and enhanced performance of
construction organizations (Tam 1999). Common Internet services or shared use of
common databases can be utilized for information sharing (Construct IT for Business
Report 2000a). Thus, Internet helps to communicate information more effectively
during the construction process.
Web-based applications greatly help in solving the problems caused by geographic
fragmentation. As cited by Zhu et al. (2001), in reality, the Internet and Web-related
technologies penetrated into the daily operation of project construction in the early
and mid 1990s (Wright 1993; Setzer 1994; Angelo 1995; Shearer 1995 cited in Zhu
et al. 2001). Using a web-based database as a centralized repository of project
information has several distinct advantages including: Reduced manual distribution
costs; Integration of project information; Simple management of access rights;
Document storage & archiving; Continuous access to project information; and
Minimal software requirement (Construct IT for Business Report 2000b). Integrating
organization database and world wide web (www) functions, supports the decision-
makers in conducting long-distance evaluations at various project sites and upgrades
the effect and efficiency of the decision-making process (Hsueh et al. 2007).
The project web sites hold the promise of promoting truly collaborative work
approaches, and offering an open and non-hierarchical approach to managing project

__________________________________________________________________________________ Page 21
Chapter 2: Literature Review
information (O’Brien 2000). Combining 4D visualization with web-based
information management facilitates dispersed project team partners to make
collaborative decisions for construction planning and scheduling (Kang et al. 2007).
Researchers have identified twelve critical factors affecting performance of web
based project management systems as: project type, project duration, Internet access
availability, type of Internet connection, level of internal support, ability of project
managers, usage frequency of advanced features, level of support provided by a
service provider, functionality and reliability of the web based system, data security
and reliability, external integration ability of the system and the unique
characteristics of the organization using the system (Nitithamyong and Skibniewski
2007). Supply chain software are also evolving towards Internet applications that
communicate with the Enterprise Resource Planning systems (Green 2001). Internet
has also provided a rich environment for deve loping ‘e-commerce’ applications in
construction and among the different types of e-commerce, business-to-business
(B2B) is the most widely used (Li et al. 2003a). For e-commerce, Internet can host a
domain – specific search tool specialised in retrieving product-related online
information (Lin and Soibelman 2007). Researchers have also discussed web based
GIS systems for e -commerce (Li et al. 2003b).
Videoconferencing combines a simple way to hold meetings and share documents
live over the Internet, with the ability to view and annotate documents, drawings and
models and to share applications. Videoconferencing dramatically improves the
efficiency, productivity and accountability within a construction organization (Sahai
2004). Tools providing services of groupware, remote access, file sharing and
whiteboard discussions can be used individually or together, to provide customized
solutions for design coordination and site-to-office communication.
Intranets aid internal organizational collaboration. The role of Intranets has changed
significantly from a passive role of providing organization information to its
employees to a more dynamic role to share and capture knowledge and some
organizations leverage them as tools for achieving sustainable competitive advantage
(Ingirige and Sexton 2007). Extranets promote project collaboration, team working
and e-commerce. They also enable users to red line drawings and control work
through auditable paper trails (Tayeh and Gil 2007). Both help in standardization of
__________________________________________________________________________________ Page 22
Chapter 2: Literature Review
the communication processes and improve data flows (Construct IT for Business
Report 2000a). Timeliness, accuracy and multi-locational availability of information
and formal flexibility are the defining elements of improved information quality
enabled by EDM technologies (Back and Bell 1995).
Using a 3D model for more than a visual study allows the development team to gain
strategic insights, minimize cost and schedule risk, improve supply chain
management and improve constructability. The visual presentation of complex
information coming from various disciplines permits more time at project meetings
to be spent on solving problems and making decisions (Henderson 2002). Virtual
Reality is an enhanced communication tool, which conveys design ideas and design
problems to all the members of the team more effectively (Koh et al. 2002). It allows
planners to intuitively interact with the virtual environment and objects as if they
were real by immersing them in a 3D computer-generated simulation and facilitates
the evaluation of different scenarios with limited expense and effort (Li et al. 2003c).
‘nD modelling’ approach is also being utilised. It refers to information about building
projects that includes 3 dimensional geometry (3D), plus the additional “dimensions”
of time, cost, organizations etc. (an additional “nD”). nD modelling tools are a series
of multi-disciplinary ICT based design and analysis applications that access an nD
model through an interoperable standard (Construct IT Initiative Report 2003).
Materials tracking system called Radio Frequency Identification Device (RFID)
couples radio frequency identification technology with highly miniaturized chips that
enable materials to be identified and tracked at any point along the supply chain. Li
et al. (2005) have studied application of an integrated Global Positioning System
(GPS) and Geographical Information System (GIS) technology to the reduction of
construction waste. The study is developed from automatic data capture system such
as the barcoding system for construction material and equipment (M&E)
management onsite, whilst the integrated GPS and GIS technology is combined to
the M&E system based on the Wide Area Network (WAN).
__________________________________________________________________________________ Page 23
Chapter 2: Literature Review
2.5 Small and Medium Enterprises (SMEs) and the Indian Construction
Industry
The construction industry predominantly consists of SMEs. It is a heterogeneous
sector encompassing small, unorganized enterprises as well as modern and more
organized ones.
2.5.1 Definition of SMEs
The small and medium enterprises, both in size and shape, are not uniform across the
globe. There is no generally agreed definition of SMEs (ASEAN Report 1997;
University of Strathclyde Library Services Report 2005). “The best description of the
key characteristics of a small firm remains that describe d by the Bolton Committee in
its 1971 Report on the Small Firms. This stated that a small firm is an independent
business, managed by its owner or part-owners and having a small market share. It
recognised that size is relevant to sector i.e. a firm of a given size could be small in
relation to one sector where the market is large and there are many competitors;
whereas a firm of similar proportions could be considered large in another sector
with fewer players and/or generally smaller firms within it. Similarly, it recognised
that it may be more appropriate to define size by the number of employees in some
sectors but more appropriate to use turnover in others” (DTI Report 2005). Similar
concept is utilised in USA and as per their classification, small orga nizations of most
general and heavy construction industries have annual receipts of $28.5 million or
less each (University of Strathclyde Library Services Report 2005).
For statistical purposes, the Department of Trade and Industry of UK usually uses the
following definitions: small firm: 0 - 49 employees; medium firm: 50 - 249
employees; large firm: 250 employees or more (DTI Report 2005).
In the ASEAN region few informal definitions are observed. In Thailand for
example, various administrative organizations classify SMEs based on the measure
of fixed assets, registered capital, sales or number of employees (ASEAN Report
1997). The guidelines of Infocomm Development authority of Singapore define
SMEs as entities with: fixed assets less than S$15 million; and, number of full time

__________________________________________________________________________________ Page 24
Chapter 2: Literature Review
employees less than 200. The “Very small” SMEs are on the lower spectrum of the
above criteria and constitute a very large number of SMEs (Huin 2004).
The definition adopted by the Indian government is based on the level of investment
in plant, machinery or other fixed assets whether held on an ownership, lease or hire
purchase basis. It seeks to keep in view the socio-economic environment in India,
where the capital is scarce and the labour is abundant. “However, a definition exists
only for small-scale industry and the medium enterprise definition is of more recent
origin. At present, a small-scale industrial unit is an industrial undertaking in which
the investment in plant and machinery does not exceed INR 10 million, except for
some trades. A comprehensive legislation, which would enable the paradigm shift
from small-scale industry to SMEs is under consideration in the parliament”
(Balasubramanian 2006). The organizations which are neither small nor large are
treated as medium enterprises.
In the literature, researchers have defined SMEs for construction industry. As per
Laufer and Tenah (1985) a medium sized firm is considered to be one handling 5-10
projects simultaneously, each representing a total of 200,000 t o 1 million man-hours.
Based on the number of employees, Dainty et al. (2001) define a small firm as
having 24 or less workers and a medium size firm as having 25-114 workers; Sturges
and Bates (2001) identify SMEs as having staff upto 299 and Love et al. (2004)
identify SMEs as employing less than 250 people.
2.5.2 SMEs and the construction Industry
In the construction industry, majority of the organizations can be categorized as
SMEs. While the US construction industry includes large companies, statistics
indicate that over two-thirds construction firms have less than five employees
(Halpin and Woodhead 1987 cited in Hegazy and Ersahin 2001). The majority of
these small firms are specialist subcontractors working with the general contractor
(Hegazy and Ersahin 2001). In Australia, there are approximately 158,000 firms and
the overwhelming majority are micro-businesses, employing an average of 2.3
people (DISR Report 1999 cited in Love et al. 2004). Dainty et al. (2001) report that
in UK construction industry, almost 97.6% firms employ 24 or less workers and can

__________________________________________________________________________________ Page 25
Chapter 2: Literature Review
be categorized as small firms, almost 2% firms employ 25-114 workers and can be
categorized as medium size firms, and only about 0.4% firms employ 115 or more
workers. In Portugal, the small and medium enterprises were responsible for 72% of
the total output in 1998 (Ribeiro and Lopes 2002).
The construction organizations in India had their origins as start up ventures by
entrepreneurial individuals and over a period of time, they grew in size (Sreepuram
and Rao 2006). Still, most of the organizations are SMEs and
proprietary/individualistic in nature with 90% of the total construction work being
executed by them (Nehru 2001). Moreover, Indian private companies are wary of
forming consortiums (Mejie and Punia 2004), and it restricts size of these
organizations.
Infrastructure projects require large investments and project teams from contractors
and other project team organizations. Thus it is assumed that on such projects large
organizations are important part of the project teams, but on the building projects,
majority of the project team organizations are SMEs.
2.5.3 Characteristics and Specific Requirements of SMEs
Small and medium-sized enterprises are socially and economically important as the
majority of the workforce is employed by SMEs (University of Strathclyde Library
Services Report 2005). A huge pool of SMEs exists to service the huge and fairly
large enterprises respectively or to provide specialty or outsourcing services to these
corporations (Huin 2004). There is a growing recognition worldwide that the SMEs
have an important role to play in the present context due to their greater resource-use
efficiency, capacity for employment generation, technological innovation, promoting
inter-sectoral linkages and raising exports. They help in developing entrepreneurial
skills and innovation (Enterprise and Industry Report 2005) and their locational
flexibility is also an important advantage in reducing the regional imbalances.
The SMEs do not function as a collection of formal structural departments and their
requirements including operating requirements, logistics fulfillment and the financial
capabilities are vastly different from those of the large organizations, leading to the

__________________________________________________________________________________ Page 26
Chapter 2: Literature Review
requirement of a closer understanding of their strategic and operational requirements
(Huin 2004).
“The CEO of an SME is involved in most of the strategic decisions and major
operational decision-making. At the middle level there are two distinct groups of
direct operational managers, the professionals and ‘upgraders’. Majority of the latter
group managers have years of related work experience and intimate knowledge of
the operational tasks, sometimes across different departments in the organization.
This knowledge is very useful to the SMEs as it allows cross-checking and network-
decision-making. At the execution level there are the professionals who are usually
IT literate (e.g., the planners, buyers, production supervisors etc.)” (Huin 2004).
Thus, in the SMEs, strategic planning for ICT adoption would be done at the top or
middle level, but, it would be supported, executed and defined by the ICT
capabilities of the staff at the execution level. In a survey, 25 of the 30 SMEs
reported staff turnover rate exceeding 20%. This high turnover rate adversely
impacts how SMEs manage their labor resource (Huin 2004). It also impacts the
level of ICT usage in the SMEs.
One of the most important issues that hinders the growth of SMEs in a globalised
scenario is that of access to appropriate technology when technology upgradation is
the key to facing global competition (Balsubramanian 2006). It is easier for large
firms to be involved in the development and adoption of the emerging technology
(Froese 1996) , whereas SMEs have difficulty in dedicating resources to research,
development and training (Acharya 2006). So, with respect to the SMEs, it is
necessary to develop means to get the information about innovations out rapidly and
in a form that will interest the potentially concerned decision makers. It has been
discussed that there has to be a link between any technology watch service and the
deep knowledge of the ‘client’ SME (Davidson 2001).
The projects can require involvement of a great number of small and large
enterprises with varying collaborations (Goodman and Chinowsky 2000). Larger
organizations view the contract organizations as an extension of their facility and it is
usual for them to ensure that the operational procedures and quality standards of their
contract organizations are compatible with theirs (Huin 2004). So, when the SMEs

__________________________________________________________________________________ Page 27
Chapter 2: Literature Review
are managing the projects as contract organizations, their ICT adoption is determined
by the requirements of large organizations. In the manufacturing industry, an SME
would primarily be an extension of a large organization as its contract organization.
But, in the construction industry, an SME may also be independently managing the
building projects. In such a situation, the extent of ICT adoption would be
determined by the ICT capability of the SME and its staff.
Decentralization of the information, the resources and the decision-making processes
is commonly found in SMEs and there are low levels of management structures in
SMEs (Huin 2004). So, they have to struggle hard to break the barrier of traditional
management and administration to enter the computerized era (Laufer and Tenah
1985). It cannot be expected that SMEs would have an Internet strategy or a person
with the required knowledge (Katranuschkov et al. 2001). Also, they cannot afford
the complicated conversion from paper to electronic processes, which often requires
expensive information exchange technology (Ribeiro and Lopes 2002). With respect
to subcontractors or SMEs, an information system should be easy to use, transparent
and low cost (Hegazy and Ersahin 2001). SMEs also seem to be risk averse regarding
IT investment due to the perceived budget constraints (Peansupap and Walker 2005)
and there is still a long way to go for ICT adoption by SMEs.
2.5.4 Indian Construction Industry
The Indian construction industry is an important part and second largest activity of
the Indian economy. Apart from its large size, it acts as a vanguard and sets pace for
the growth of all other sectors (Vaid 2000 cited in Ranadive and Gaikwad 2006). It
employs over 31 million people (Nehru, 2001) increasing at over 1 million per year
(Mejie and Punia 2004), contributes 5.2% of GDP and constitutes of 40% of the
investment in India (Ranadive and Gaikwad 2006).
There has been a substantial growth in the Indian construction industry. Mejie and
Punia (2004) report that in 5 years prior to 2004 (the period of reporting), India was
hovering between INR 30,000 million to 120,000 million in the global overseas
construction market. But, recently there has been a sudden growth to about INR
200,000 million. At the time of reporting, 167 export contracts (construction, turnkey

__________________________________________________________________________________ Page 28
Chapter 2: Literature Review
and consultancy) valued at INR 200,000 million (approx. US$ 4445 million) were
under execution in 43 countries by 36 Indian companie s. Further growth is also being
observed. With the sudden growth in the construction activity in the country, most
of the organizations have substantial projects to execute. With globalization,
increasing competition and awareness of the clients, there is a requirement to deliver
projects successfully and to build up the organizations. Typically the senior
management of the organization is caught up in a conflict of building up the
organization for future requirements versus the current fulfillment of the contractual
obligations (Sreepuram and Rao 2006).
In the Indian construction industry, projects are primarily executed on the item rate
contract arrangement and contractors join the project team from the execution stage.
Contractors of major components of works like civil works, plumbing works,
electrical works, HVAC or mechanical works, interiors and other works like
installation of lifts, aluminium doors and windows, termite treatment, water filtration
and softening plant etc. have direct contract with the clients. Thus, communication
between clients and other agencies is also substantial.
The strengths of the Indian construction industry are (Mejie and Punia 2004): its
manpower strength including manpower with high level technical and management
skills, and construction experience of every type of construction in all types of
terrains and climates; government initiatives for providing financial incentives to
construction organizations; manufacturing of varied construction materials and
equipment in the country; agility and adaptability to the changing global construction
scenario and working with overseas organizations.
One of the identified weaknesses of the Indian construction industry is that it is not
seen as an IT savvy sector (Mejie and Punia 2004; Nehru 2001). It is felt that the
information age has done little to transform the SMEs in the construction industry as
IT benefits users in the automation of processes, systems, data collection – all of
which are issues faced by the larger organizations. The requirement is that
organizations should realize the true value of IT and of reengineering of traditional
systems of working (Ranadive and Gaikwad 2006). With respect to ICT, one of the
major barriers is that formal reporting is not practised in these organizations

__________________________________________________________________________________ Page 29
Chapter 2: Literature Review
(Sreepuram and Rao 2006). The requirement is to have an industry level initiative for
studying the factors affecting present ICT adoption in the industry, and building up
the industry for future requirements. But, the literature review did not indicate any
such industry-wide initiative.
2.6 Characteristics of Global Research and Research in India
The initial research in the area of ICT adoption in the construction industry primarily
had a technical focus. Research was undertaken for development of open, high-level,
computer interpretable communication between project participants resulting in the
development of standard product models including the Standard for the Exchange of
Product data (STEP) (Luiten and Tolman 1997; Han et al. 1998) and the Industry
Foundation Classes (IFC) (Han et al. 1998); shared project models and object
oriented models were developed for storing and managing design documents and
information (Fisher and Froese 1996; Stumpf et al. 1996; Mokhtar et al. 1998) and
managing design changes (Hegazy et al. 2001) leading to the model based
approaches to information representation and structuring as a shift from the
document based approach to the model based approach (Rezgui and Cooper 1998);
integrated, networked working environments were developed for the wider business
processes of communication, cooperation, collaboration, information exchange,
triggering of activities (Platt 1996); and decision support systems were developed for
management functions (Yang 1997).
Tekes, the National Technology Agency of Finland conducted Vera program
addressing IT for the AEC/FM industries. The technological vision of the program
was centered on the integration of all AEC/FM information throughout the lifecycle
of the projects using information modeling standards – specifically the Industry
Foundation Classes (IFCs) and many issues related to the work processes and
services associated with the adoption of IFC related technology in practice. In an
evaluation report for the program, Froese (2002) identified that a strong and specific
technological vision is extremely beneficial in focusing and directing the research
and development efforts. If vision provides the direction for technology
development, perceived benefits of the new technology pr ovide the motivation for its

__________________________________________________________________________________ Page 30
Chapter 2: Literature Review
adoption. However, with respect to ICT, the perceived benefits of its application are
defined qualitatively. Good quantitative data would go a long way towards the
justification of the use of the technology. Evaluation of benefits of use of a
technology is essential for the adoption of the technology. “Kiviniemi, the program
manager of Vera program also noted that the IFC technology is not the only
component of a collaborative information system. Enabling technologies and
specifications, an ICT infrastructure, software applications, processes, education,
people, and the development of various databases are all necessary parts of the
culture” (Henderson 2002).
By the start of the 21st century, the global research community identified that inspite
of the high level technical research in this area, ICT adoption by the construction
industry was slow as compared to the other industries (Egbu et al. 2001). Reasons for
the same were studied and it was realized that the ICT adoption approach should be
goal-centered and based on the premise that one must plan based on the objectives of
the system, not only on the technology available (Smith et al. 2001). In addition to
creating the technology itself, there is a requirement to create servic es and work
processes related to the new technology (Froese 2002). Internal systems for use of
IT have been developed in various agencies in the construction industry, but
information sharing between the agencies and joint utilization of this information are
a bottleneck (Kiviniemi 2001). The IT director of an organization stated: “We should
pay 90% attention to the organization and 10% to the technical side of IT” (ed. Betts
1999, p.211). In the construction industry where work is project centric and involves
multiple enterprises for each project, majority of which are SMEs, equal
consideration is required to be given to the technology, the process and the culture or
people (Egbu et al. 2001; Huang et al. 2002; Alshawi and Ingirige 2003). Further
research is required to identify ways to overcome industry related cultural ‘barriers’,
‘modifying’ traditional work ‘habits’ and improving procedures for ICT
implementation and application opportunities within the construction industry
(Weippert et al. 2003). Also, utilization of networking techniques is contingent upon
broad utilization of IT in the whole value chain (Kiviniemi 2001) or supply chain of
construction projects.

__________________________________________________________________________________ Page 31
Chapter 2: Literature Review
In the evaluation report of the Vera program conducted by VTT of Finland, Froese
(2002) has noted that the development of new technology should be led by a vision
that has been developed for the development efforts and a high priority should be
placed on studies that provide qualitative evidence of the benefits of the technology.
Consequently, the research in previously focused technical areas has been taken
ahead (Katranuschkov et al. 2001; Yang and Peng 2001; Zhu et al. 2001; Tuncer et
al. 2002; Brilakis and Soibelman 2005) and new technical issues like real time
information capture (Akinci et al. 2006; Song et al. 2006), artificial intelligence (Al-
Jibouri and Mawdesley 2002), mobile computing (Ward et al. 2004; Kimoto et al.
2005; Reinhardt et al. 2005), 4D planning (Liston et al. 2001; Wang et al. 2004;
Chau et al. 2005), virtual reality (Li et al. 2003c; Savioja et al. 2003), networked
environments for present technology (Liston et al. 2001; O’Brien et al. 2002; Finne
2003; Nuntasunti and Bernold 2006), e-commerce (Li et al. 2003a,b) etc. are also
being studied.
Soft issues or management issues for effective implementation of ICT in the
construction industry are also being studied. Further sections critique significant
findings of research in these issues and identify and highlight the important variables.
Research in India
In India, the research has been conducted for IT adoption by the construction
industry, but literature review has not identified the research with focus on ICT for
the construction industry.
Table 2.1 chronologically lists some of the research papers discussing the research
conducted in India. These research papers show that the research in India is at a
nascent stage and also at individual levels.
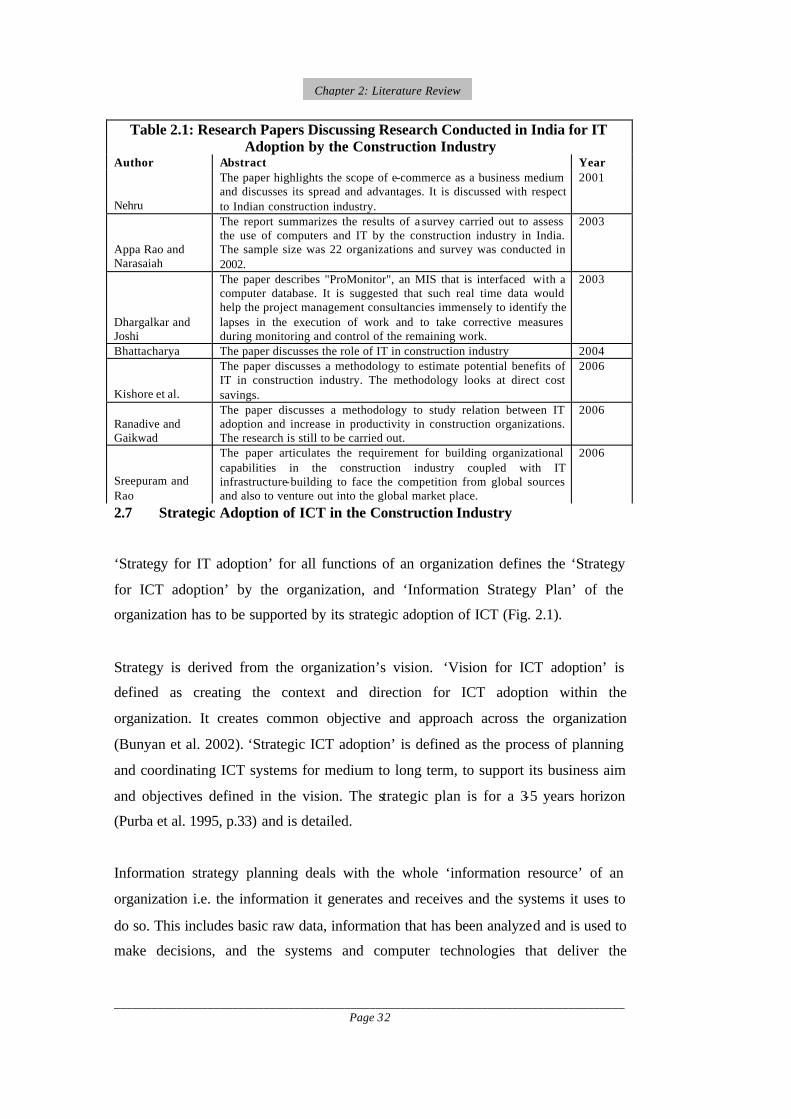
__________________________________________________________________________________ Page 32
Chapter 2: Literature Review
2.7 Strategic Adoption of ICT in the Construction Industry
‘Strategy for IT adoption’ for all functions of an organization defines the ‘Strategy
for ICT adoption’ by the organization, and ‘Information Strategy Plan’ of the
organization has to be supported by its strategic adoption of ICT (Fig. 2.1).
Strategy is derived from the organization’s vision. ‘Vision for ICT adoption’ is
defined as creating the context and direction for ICT adoption within the
organization. It creates common objective and approach across the organization
(Bunyan et al. 2002). ‘Strategic ICT adoption’ is defined as the process of planning
and coordinating ICT systems for medium to long term, to support its business aim
and objectives defined in the vision. The strategic plan is for a 3-5 years horizon
(Purba et al. 1995, p.33) and is detailed.
Information strategy planning deals with the whole ‘information resource’ of an
organization i.e. the information it generates and receives and the systems it uses to
do so. This includes basic raw data, information that has been analyzed and is used to
make decisions, and the systems and computer technologies that deliver the
Table 2.1: Research Papers Discussing Research Conducted in India for IT Adoption by the Construction Industry
Author Abstract Year
Nehru
The paper highlights the scope of e-commerce as a business medium and discusses its spread and advantages. It is discussed with respect to Indian construction industry.
2001
Appa Rao and Narasaiah
The report summarizes the results of a survey carried out to assess the use of computers and IT by the construction industry in India. The sample size was 22 organizations and survey was conducted in 2002.
2003
Dhargalkar and Joshi
The paper describes "ProMonitor", an MIS that is interfaced with a computer database. It is suggested that such real time data would help the project management consultancies immensely to identify the lapses in the execution of work and to take corrective measures during monitoring and control of the remaining work.
2003
Bhattacharya The paper discusses the role of IT in construction industry 2004
Kishore et al.
The paper discusses a methodology to estimate potential benefits of IT in construction industry. The methodology looks at direct cost savings.
2006
Ranadive and Gaikwad
The paper discusses a methodology to study relation between IT adoption and increase in productivity in construction organizations. The research is still to be carried out.
2006
Sreepuram and Rao
The paper articulates the requirement for building organizational capabilities in the construction industry coupled with IT infrastructure-building to face the competition from global sources and also to venture out into the global market place.
2006

__________________________________________________________________________________ Page 33
Chapter 2: Literature Review
information i.e. ICT. It also examines how these systems relate to the organization’s
general business environment (Construct IT for Business Report 2000a).
Researchers have highlighted the requirement to align ‘Information strategy plan’
supported by ‘Strategic adoption of ICT’ with the business strategy of the
organization (Construct IT for Business Report 2000a; Leuven and Voordijk 2001;
Retik and Langford 2001, p.125-144). It helps in estimating cost of the new IT
systems and includes cost of hardware, software and support (Construct IT for
Business Report 2000). It also helps business managers to gain a greater
understanding of the potential of ICT and helps to improve their understanding of the
organization’s business requirements by the IT staff, thus enhancing the efficiency of
the system. It also ensures adequate consideration of those areas where technology
itself may be an underlying change agent (Purba et al. 1995). Consequently, it
supports and shapes an organization’s competitive strategy.
2.7.1 Requirement of Strategic Adoption of ICT by the Construction Industry
at the Level of Each Organization and at the Industry Level
Construction organizations have different departments or engineering groups and
researchers have highlighted that departmentally isolated approaches to the
technology implementation in construction organizations have often led to “islands
of automation” or “functional silos” in many of the present organizations (Back and
Moreau 2000). In such a scenario the users may be satisfied with their individual
STRATEGY FOR ‘IT’ ADOPTION IN ALL FUNCTIONS OF THE ORGANIZATION
Information Strategy Plan
Strategy for ‘ICT’ Adoption
Fig. 2.1 Relation of ‘Strategy for ICT Adoption’ with the other Strategies of the Organization

__________________________________________________________________________________ Page 34
Chapter 2: Literature Review
systems. However, chaos arises when the users are required to share information
(Construct IT for Business Report 2000a). ICT can be adopted strategically, if the
organizations and industries can find ways of applying it to either improve individual
activities, or alter the linkages between them to make the overall value chain or value
system more efficient. Full efficiency will not be achieved through the adoption of
well designed but incompatible systems handling differing requirements and
purposes of each user (McDonagh 1995).
In the construction projects, data generated at each stage of the project is utilized at
all the successive stages upto the facilities management stage. Researchers have
highlighted the requirement to bridge the gap between design and planning stages of
projects (Yang and Lin 1998). Effective and seamless transfer of information
between all the stages and between project team agencies requires strategic adoption
of mutually compatible software, hardware and communication capabilities. It is
more relevant in the present scenario, since many of the technologies today are
dependent on the use and proper functioning of other technologies. For example, the
potential of an expert system is limited by the breadth and accuracy of the database
from which it draws information (Back and Moreau 2000).
In the context of the construction industry where inter-organization communication
is important, strategic ICT adoption is required at the industry level and
organizational strategies are required to be aligned with the industry wide strategy.
The project level strategies are required to be aligned with the organization level
strategy of the clients and the project management agencies. Industry wide strategic
ICT adoption would require the understanding, participation and support of all the
concerned professions, enterprises and government agencies. Such a national,
industry-wide approach is what is now being undertaken in the Construct IT
initiative in the UK, the Vera program in Finland, the CORENET project in
Singapore (ed. Betts 1999, p.124-131) and the CRC CI initiative in Australia.
The Construct IT initiative in UK was started in 1995 to improve competitive
performance of the UK construction industry by promoting research in the use of IT
in construction through an industry led network of major clients, consultants,
contractors, suppliers, IT and communications organizations and universities

__________________________________________________________________________________ Page 35
Chapter 2: Literature Review
(Construct IT Report 1998). Objectives of the program include initiating master’s
level industry-oriented learning programs, coordinating research, promoting
innovation, continuous redefinition of an industry vision, forming links with similar
international initiatives and establishing best current practices (DOE 1995 cited in
Construct IT Report 1998).
The ‘Vera Technology Program’ was launched by Tekes, the National Technology
Agency of Finland, in 1997. The target of the program was to promote the
implementation of IT adoption and enabled networks and to make it possible to
manage the information flows during the entire life cycle of the buildings, so that the
project team members share project data instead of paper documents. In the Vera
project, construction processes and information systems were developed
simultaneously. The aim of the program was to achieve: improvement in return on
investments; improved quality and overall profitability of construction; and increased
construction exports (Vera Program Report 2000).
The CORENET project is the acronym for ‘Construction and Real Estate NETwork’
project of Singapore, commenced in 1993. Singapore Building and Construction
Authority drives the project in partnership with the relevant industry bodies. It is a
major IT initiative undertaken in Singapore to re-engineer and streamline the
business processes of the construction industry to integrate the fragmented work
processes of a building project life cycle. The aim was to achieve a quantum leap,
especially in the quality and productivity aspects. Since the commencement of the
CORENET national program, key IT initiatives have been identified and appropriate
incentive schemes including capital grants for IT development have been put in place
to help the industry adopt IT (Hua 2005).
The CRC CI initiative is a research and development program initiated by
‘Cooperative Research Center for Construction Innovation’ in Australia. Its vision is
to lead the Australian property and construction industry in collaboration and
innovation, with the three objectives of (Brewer et al. 2003):
• enhancing the contribution of long-term scientific and technological research
and innovation to Australia's sustainable economic and social development.

__________________________________________________________________________________ Page 36
Chapter 2: Literature Review
• enhancing the collaboration between researchers, industry and government,
and improving efficiency in the use of intellectual and research resources.
• creating and commercially exploiting tools, technologies and management
systems to deliver innovative and sustainable constructed assets to further the
financial, environmental and social benefit to the construction industry and
the community.
Under this initiative, the research projects measuring ICT adoption in the
construction industry and studying factors for the effective adoption of ICT are being
undertaken (Brewer et al. 2003; Kajewski et al. 2004).
All these initiatives are industry led initiatives undertaken to combine research and
practice and aim to enhance sustained and effective adoption of IT/ICT in the
construction industry. Table 2.2 chronologically lists some more research papers
discussing such national level research initiatives.
2.7.2 Benchmarking a Strategic Tool
Measurement is one of the first steps in any improvement process (Lee et al. 2005).
So, to strategically increase effective adoption of ICT in the construction industry, a
system of evaluation of the ICT based Information Systems is required to be
developed. There is also a consensus among researchers and practitioners that ICT
related investments should be carefully justified, measured and controlled (Milis and
Mercken 2004) and a strong correlation exists between the control and measurement
of IS and higher effectiveness of IS, however measured (Shank and Govindarajan
1992 cited in Milis and Mercken, 2004). Researchers have serious doubts about the
efficacy of using traditional capital investment appraisal techniques for the appraisal
of ICT adoption and a multi-layer evaluation process is suggested (Milis and
Mercken 2004).

__________________________________________________________________________________ Page 37
Chapter 2: Literature Review
Table 2.2: Research Papers Discussing National Level Research Initiatives Reference Initiative Howard et al. (1998)
The paper summarizes IT barometer survey, which compares results from Denmark, Finland and Sweden on the use of computer hardware, software and communications. A network linking national IT centers is planned to exchange experience and coordinate this work, so that there can be greater integration of systems between different types of organizations in construction, and within international projects.
Clark et al. (1999)
The paper follows an element of the research program of the Construct-IT Center of Excellence, a UK-based organization responsible for promoting the strategic awareness of IT within construction enterprises. The program planned to benchmark IT adoption within ten mission-critical business processes including supplier management and cost and change management.
Carter et al. (2001)
The paper presents a view on the application of ICTs to construction and typical contractual relationships within the industry, before introducing the eLEGAL project. eLEGAL is a European cooperative research and development project, which is focusing on legal conditions and contracts regarding ICT adoption in project business.
Howard and Petersen (2001)
The paper reports on a two year research project carried out by the IT byg group at BYG.DTU for the Danish government agencies Erhvervsfremmestyrelsen and By- og Bolig-ministeriet. The objectives of the project were to collect data on IT adoption by the PPB housing consortia, a development project to test out various innovations, to map communications between the partners, and compare IT adoption with their original proposals.
Froese (2002) Tekes, the National Technology Agency of Finland conducted Vera program addressing IT for the AEC/FM industries. The technological vision of the program was centered on the integration of all AEC/FM information throughout the lifecycle of projects using information modeling standards – specifically the Industry Foundation Classes (IFCs) and many issues related to the work processes and services associated with the adoption of IFC related technology in practice.
Mui et al. (2002) The paper describes a survey done to establish the actual level of Internet usage in the Malaysian construction industry. It also discusses perceived benefits and barriers for the same.
Svidt and Christiansson (2006)
The paper summarizes experiences from the process of implementation of ICT based systems for resource management in SMEs. The findings are derived from the Danish project 'IT at the Construction Site' started in 2003 and ended in May 2005. The project has involved a number of small to medium sized construction enterprises and institutions within the building domain as well as ICT tools providers.
In the multi-enterprise scenario of the construction industry, effective adoption of
ICT for building project management requires measurement and improvement of the
system in the total supply chain of the projects and in the whole industry but, to date,
a methodology has not been developed to examine the potential contributions of
information management strategies in reducing overall project schedules and cost
(Back and Moreau 2000).
Table 2.3 chronologically lists some more papers discussing international research in
formulating methodologies for evaluating information systems in the construction
industry.

__________________________________________________________________________________ Page 38
Chapter 2: Literature Review
Table 2.3: Research Papers Discussing I nternational Research in Formulating Methodologies for Evaluating Information Systems in the Construction
Industry Authors Abstract Year
Back and Bell The paper discusses research that shows that time and cost process benefits attributable to EDM technologies are significant.
1995
Fowler and Walsh
The paper discusses through case studies the differing perceptions of various stakeholders regarding the success of information systems projects.
1999
Leuven and Voordijk
The paper discusses evaluation of ERP implementation in construction industry with reference to Nolan growth curve.
2001
Stewart and Mohamed
The paper looks at potential applications and benefits of using the Balanced Score Card as a framework to evaluate the performance improvement resulting from IT/IS implementation by a construction organization. To illustrate the application of the proposed framework, a project tier example is provided.
2001
Stewart and Mohamed
The paper builds upon the framework discussed by the authors in the earlier paper listed above. It investigates the interrelationship between the framework perspectives and indicators, in an attempt to validate the link between them. Using information collated from 82 professionals representing large construction contracting and project management organizations located within Australia, results from the study provide support for the proposed framework.
2004
Skibniewski and Zhang
The paper reviews IT investment evaluation methods and concludes that a single economic analytical method or a simple combination thereof is insufficient to justify or decline an investment in Web based Project Management. Authors put forward a multidimensional decision-making approach that the authors believe is closer to the style of decision-making in the construction business world.
2005
Yu et al.
The paper suggests an evaluation model for IS benefits in construction management processes. The model is based on the evaluation of IS implementation benefits at the construction management task level, and it is postulated that the benefits are composed of the effect and the possibility of IS implementation. 2006
Researchers have suggested balanced scorecard approach (Stewart and Mohamed
2001; Milis and Mercken 2004) and benchmarking as systems for the evaluation of
construction systems.
Lee et al. (2005) presented a benchmarking system developed by the Construction
Industry Institute (CII) for broad application in the construction industry; Ramirez et
al. (2004) have discussed a benchmarking system that has been recently established
in the Chilean construction industry by incorporating qualita tive management aspects
in addition to performance indicators; Love and Smith (2003) have proposed a
generic framework for benchmarking rework at the interfaces of a project’s life
cycle; Clark et al. (1999) have discussed benchmarking for studying the supplier
management system with respect to IT; Love et al. (2004) have reported a series of

__________________________________________________________________________________ Page 39
Chapter 2: Literature Review
benchmark metrics for benefits, costs and risks of IT and posit that these metrics can
serve as a reference point for initiating benchmarking, which should form an integral
component of the IT evaluation and learning process; Brewer et al. (2003) have
discussed a study commissioned by CRC CI in Australia to study the development of
a benchmarking tool to measure ICT uptake in the construction industry.
2.7.2.1 Benchmarking Definition
Benchmarking is a formal method and as per Fong et al. (1998) some researchers
(Camp 1989a; Mittelstaedt 1992) have suggested that a systematic method would
lead to outstanding performance while other informal methods would not.
Benchmarking has been defined in literature with different perspectives. Table 2.4
lists in chronological order some definitions and salient features of benchmarking as
defined in the literature.
Table 2.4: Definitions and Salient Features of Benchmarking Reference Definition and Salient Features Construct IT Report (1998)
• Benchmarking is the means for identifying performance levels and provides the basis for continuous improvement.
• Benchmarking studies are used to reveal the gap in performance in one organizat ion, between different organizations and best practice.
• It is intended to lead an organization to identify and adopt improved business processes by identifying actions that are needed to match and exceed best practice.
• It forces issues out into the open so that they can be dealt with according to the goals of the organization.
Bendell et al. (1998) Benchmarking approach is one of prevention of errors and faults rather than of detection and correction.
Clark et al. (1999)
• Benchmarking methodologies are primarily a tool for organizational continuous improvement.
• Benchmarking is ‘an external focus on internal activities, functions or operations in order to achieve continuous improvement’ (Leibfried and McNair 1994).
• It is one of the responses to competitive threats and includes studying internal and external practices of efficient companies with a view to learning and implementing superior processes that will contribute to a strategic competitive advantage (Leibfried and McNair 1994).
• Benchmarking through objective competitor analysis allows companies to measure products or services against competitors and best-in-class companies in other industries.
Love and Smith (2003)
• Benchmarking can be viewed as an operational process of continuous learning and adaptation that results in development of an improved organization.

__________________________________________________________________________________ Page 40
Chapter 2: Literature Review
Table 2.4 Continued
• Benchmarking focuses on the importance of understanding the tasks and activities in a process that produces an outcome and how improvements in the processes can take place (Schaffer 1992).
• A benchmark can be: anything taken or used as a point of reference or comparison; something that serves as a standard by which others may be observed or compared; anything or something that is comparatively measurable and a physiological or biological reference value against which performance is compared (Zairi 1996).
• Benchmarking is a suitable starting point for construction organizations embracing change and for learning, as it is a process that can be used to systematically acquire knowledge.
• For benchmarking to be effective at a project, at industry, or at competitive level, organizations should view it as a process of improvement rather than of exposing an organization’s weakness.
Costa et al. (2006) • Benchmarking is a systematic process of measuring and comparing an organization’s performance against that of the other similar organizations in key business activities. Then, lessons learned from other organizations are used to establish improvement targets and to promote changes in t he organization (KPI 2000; Barber 2004).
• Benchmarking adds value to performance measurement because it allows companies to compare their data; it also allows for better decision making based on these comparisons (Beatham et al. 2004).
• The general purpose of benchmarking and its function as an assessment process is to encourage continuous learning for both managers and organizations (Barber 2004).
• Benchmarking must be an integral part of the planning and ongoing process of improvement to ensure a focus on the external environment as well as to strengthen the use of factual information in developing plans (Camp 1995).
• Although the major focus of benchmarking is usually on planning and organizing, one of its main objectives is to introduce new ideas to an organization (Spendolini 1994).
• Benchmarking of managerial practices helps to accelerate and manage organizational changes by creating a culture of continuous improvement (Barber 2004).
• Benchmarking process can lead to benefits beyond productivity, if it is used for encouraging innovation.
These references help in summarizing benchmarking as a tool: to measure
mission-critical processes or the processes under study of an organization against
those of the other similar organizations in the same sector and similar sectors; to
establish a benchmark or a standard for comparison and help in continuous
improvement in the processes by helping organizations in measuring differences,
conducting objective competitor analysis, systematically acquiring knowledge,
improving productivity, introducing new ideas and encouraging innovation.

__________________________________________________________________________________ Page 41
Chapter 2: Literature Review
The above definition of benchmarking indicates that benchmarking results in an
industry wide measurement and improvement of the benchmarked system, by
facilitating comparison between different organizations.
Researchers have classified benchmarking with different perspectives. Lewis and
Naim (1995) have identified four types of benchmarking: internal, competitive,
parallel industry and best practice (Clark et al. 1999). Fong et al. (1998) have
classified benchmarking as per the nature of referent, content of benchmarking and
purpose for the relationship (Fig. 2.2).
Internal benchmarking is a comparison between different operating divisions,
departments or business units of the orga nization where data is often readily
available and accessible.
Competitive or competitor benchmarking occurs between organizations within the
same industry sector that sell an identical or similar goods or service. It is quite
difficult to achieve, as the competitors may not divulge private knowledge or other
key productivity data (Fong et al. 1998). In this benchmarking, two factors with
Fig. 2.2: Classification of the Types of Benchmarking Sourced from (Fong et al. 1998)
__________________________________________________________________________________ Page 42
Chapter 2: Literature Review
respect to methodology and content of benchmarking define the success of the
process:
• It should be performed in partnership by a third party benchmarking agency
and the focus should be on organizations learning from each other’s practices
(Fong et al. 1998). Independence of the benchmarking agency from all the
participating organizations increases willingness of the organizations to be
included or interviewed for the benchmarking process (Clark et al. 1999).
• Benchmarking should be directed at technical or general managerial
processes so that the commercially sensitive information is unlikely to be
exposed (Construct IT report 1998).
Industry benchmarking is similar to competitor benchmarking, so is the generic or
global benchmarking (Cox et al. 1997 cited in Fong et al. 1998). Industry
benchmarking is different from competitor benchmarking because it involves more
number of benchmarking or comparison parties and may also include non-
competitors. Thus it is more feasible.
Generic or Parallel Industry benchmarking occurs between organizations from
different sectors that undertake a similar process of production or service (Clark et al.
1999). It also introduces an element of innovation in the benchmarking process.
Global benchmarking involves the comparison with an organization from a global
perspective (Watson 1993 cited in Fong et al. 1998) where geographical location of
the organizations extends beyond country boundaries.
Process benchmarking pertains to the discrete work processes and operating systems
(Bogan and English 1994) while performance benchmarking is concerned about
outcome characteristics, such as elements of price, speed, and reliability (Cox et al.
1997 cited in Fong et al. 1998). Functional benchmarking applies the process
benchmarking for the comparison of particular business functions among two or
more organizations (Camp 1989b cited in Fong et al. 1998).
Strategic benchmarking involves the assessment of organizational strategies, such as
the long-term development of organizational infrastructure, rather than key
operational practices (Bogan and English 1994 cited in Fong et al. 1998).
Benchmarking is likely to be competitive when an individual “benchmarking
organization” initiates it and it is likely to be collaborative when it is initiated by a
respected third-party agent (Fong et al. 1998). Collaborative benchmarking

__________________________________________________________________________________ Page 43
Chapter 2: Literature Review
emphasizes the sharing of knowledge and conveys a learning atmosphere (Cox et al.
1997 cited in Fong et al. 1998).
Best practice benchmarking suggested by Lewis and Naim (1995) considers the
merits of a comparison with a particular market leader who is known to have an
exemplary process that is similar to the process under study (Clark et al. 1999).
While all of the operations of the process may not be totally transferable between
organizations due to different industry structures, there will often be important
lessons that can be learnt (Clark et al. 1999). Best practice benchmarking is called
innovation benchmarking by Davenport and Short (1990) as the target processes are
often borne out of innovative thinking and bold managerial implementation (Clark et
al. 1999).
As per Costa et al. (2006), a strategic performance measurement system for SMEs
must be very resource effective and should produce noticeable short-term results. In
addition, it must be dynamic and flexible enough to accommodate strategic changes,
since these organizations tend to experience sudden contingencies.
As per Bendell et al. (1998, p.163), all management and service areas are candidates
for benchmarking. Thus, a consistent ICT evaluation framework would allow
benchmarking ICT adoption for building project management by the SMEs. It can
provide organizations with the opportunity to document and review their business
processes so that the added value that the ICT adoption can provide is identified.
2.8 Factors Affecting ICT Adoption for Building Project Management
Peansupap and Walker (2005) state that effective ICT diffusion success could be
perceived in terms of factors that influence technology adoption and the way in
which successful adoption of technology by potential users could be sustained. They
have classified factors affecting ICT diffusion in an organization as static and
dynamic factors, where static factors like technological characteristics,
communication channel etc. fundamentally affect initial ICT diffusion and dynamic
factors like motivation, and training and technical support sustain ICT diffusion

__________________________________________________________________________________ Page 44
Chapter 2: Literature Review
changes. These factors have been discussed by researchers and are studied and
discussed below.
2.8.1 Strategic Adoption and Diffusion of ICT
Rogers (1962) defines that the diffusion process occurs within a soc iety as a group
process whereas the adoption process pertains to an individual. To achieve ICT
diffusion at the industry level, strategic adoption of ICT is required at the
organization level and also strategic initiatives are required at the industry level.
At the industry level, research should include SMEs and support should also be
provided to SMEs for training in and adoption of the developed technology (Froese
2002). Organizations require a realistic and reliable knowledge base which is to be
transmitted in the organization at a fast pace and made easily and instantly available
to engineers/managers at all the levels (Pandit and Munshi 1999). However, SMEs
do not see justification in spending money on large databases in isolation and require
help from large organizations and government bodies for the same. Standardization
of information transfer is very important at the national as well as international levels
and can also be achieved by the industry level initiatives.
Effective adoption of ICT would be achieved if appropriate ICT tools and
technologies are adopted and work processes are adapted for use of the technology.
Thus following factors are required to be considered strategically at the organization
level for effective adoption of ICT:
• ICT development in an organization should be business driven and should
play a part in and be integral with construction activities and business
processes of the organization (Construct IT for Business Report 2000a). Thus
a construction organization’s ‘Strategy for ICT adoption’ should be aligned
with its business objectives.
• CEOs and top managers’ perceptions of the importance of IT, help to align IT
strategies and goals with those of the organization as a whole. Equally
important, it sends a strong signal throughout the company that IT is being
taken very seriously (Bawden and Blakeman 1990 cited in ed. Brandon and
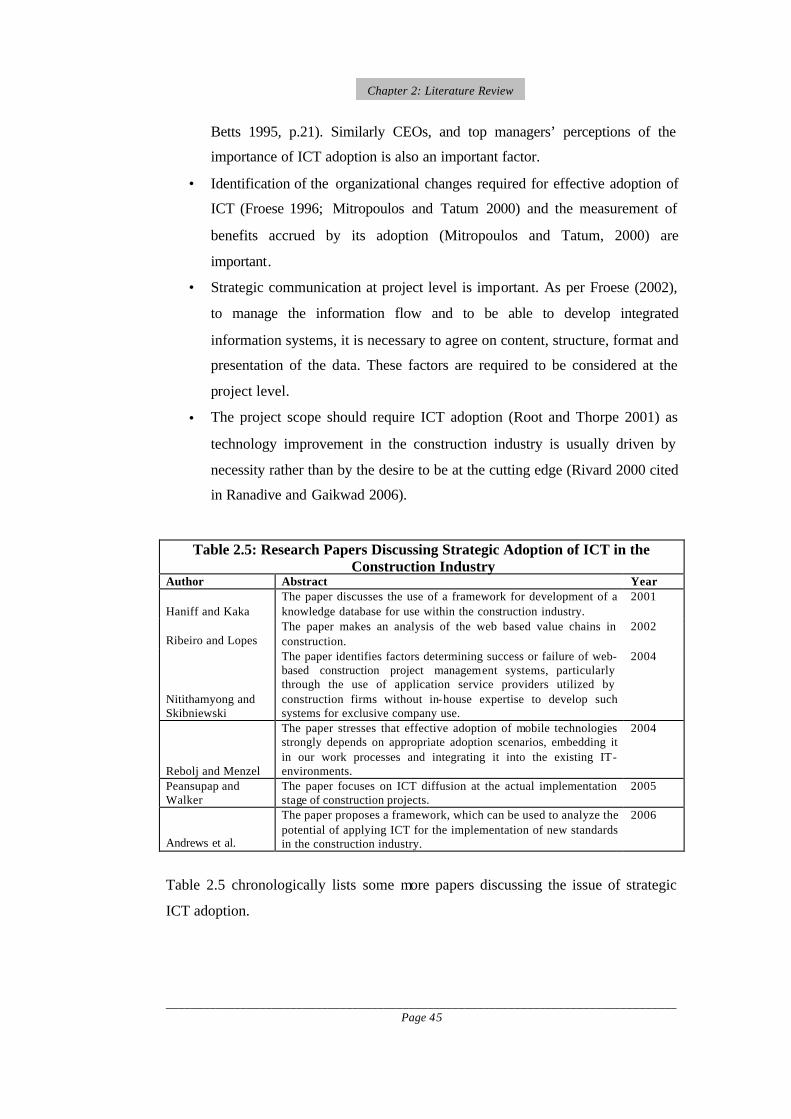
__________________________________________________________________________________ Page 45
Chapter 2: Literature Review
Betts 1995, p.21). Similarly CEOs, and top managers’ perceptions of the
importance of ICT adoption is also an important factor.
• Identification of the organizational changes required for effective adoption of
ICT (Froese 1996; Mitropoulos and Tatum 2000) and the measurement of
benefits accrued by its adoption (Mitropoulos and Tatum, 2000) are
important.
• Strategic communication at project level is important. As per Froese (2002),
to manage the information flow and to be able to develop integrated
information systems, it is necessary to agree on content, structure, format and
presentation of the data. These factors are required to be considered at the
project level.
• The project scope should require ICT adoption (Root and Thorpe 2001) as
technology improvement in the construction industry is usually driven by
necessity rather than by the desire to be at the cutting edge (Rivard 2000 cited
in Ranadive and Gaikwad 2006).
Table 2.5: Research Papers Discussing Strategic Adoption of ICT in the Construction Industry
Author Abstract Year
Haniff and Kaka The paper discusses the use of a framework for development of a knowledge database for use within the construction industry.
2001
Ribeiro and Lopes The paper makes an analysis of the web based value chains in construction.
2002
Nitithamyong and Skibniewski
The paper identifies factors determining success or failure of web-based construction project management systems, particularly through the use of application service providers utilized by construction firms without in-house expertise to develop such systems for exclusive company use.
2004
Rebolj and Menzel
The paper stresses that effective adoption of mobile technologies strongly depends on appropriate adoption scenarios, embedding it in our work processes and integrating it into the existing IT-environments.
2004
Peansupap and Walker
The paper focuses on ICT diffusion at the actual implementation stage of construction projects.
2005
Andrews et al.
The paper proposes a framework, which can be used to analyze the potential of applying ICT for the implementation of new standards in the construction industry.
2006
Table 2.5 chronologically lists some more papers discussing the issue of strategic
ICT adoption.

__________________________________________________________________________________ Page 46
Chapter 2: Literature Review
2.8.2 Cultural Factors
Effective implementation of ICT in the construction industry requires the study of
cultural issues. It has been reported that traditional practices and culture continue to
succeed in maintaining incapacity to use appropriate IT (Construct IT Initiative
Report 1998). The study is required to modify the working processes for increased
adoption of ICT. Cultural issues are required to be studied at the industry,
organization and project levels.
Culture is pervasive, not simply a variable that affects the organization, group or
team, but indistinguishable from these (Pepper, G.L. 1995 cited in Weippert and
Kajewski 2004). Every organization within the industry has its own unique culture,
sub-culture, character, nature and identity (Weippert and Kajewski 2004) and this
refers to the deeper level of basic assumptions, values, beliefs and practices that are
shared by most members of an organization. In a survey, it was found that high ICT
adoption by the organizations was influenced by an open discussion environment,
support from the colleagues and support from the supervisors (Peansupap and
Walker 2005). It is also reported that there is a tendency to accept electronic data
more readily than the written word, which is typically checked more thoroughly.
This is seen as a cultural problem, rather than a specific disadvantage of IT
(Construct IT Initiative Report 1998). Other researchers have also brought forward
these issues for further study.
The project culture is closely related to the organizational culture. It is defined by the
organizational design, structure and processes conducted in a particular context or
environment to achieve specific goals and objectives within a certain time frame and
budget allocation. These factors create a culture, which is unique to that project
although influenced by experiences from other similar projects (Cleland and Ireland
2002 cited in Tone 2005).
Recognizing the type of culture that exists in the organizations and the project
environments is particularly useful to enable the managers to determine the approach
and the strategies that facilitate interaction and communication (Tone 2005). Van
Oudenhoven (2001) claimed “that culture as found in the organizations within a

__________________________________________________________________________________ Page 47
Chapter 2: Literature Review
country should partly reflect the national culture.” It would be the national culture of
that industry. When organizational culture is ‘weak’ and appears to have little
influence, workplace values and behavior provide a clear reflection of the national
culture and values (Tone 2005). Also, in the case of a ‘weak’ organizational culture,
changes in policies, rewards, tasks and structures are likely to “modify organizational
behavior and cause a cultural shift” (Weippert and Kajewski 2004).
Many organizations decide to change their existing culture, based on the requirement
to implement a strategically driven change, or due to a certain ‘crisis’ or
‘opportunity’ being identified – i.e. many organizations are driven to change due to
the business demands and not necessarily to change the culture (Weippert and
Kajewski 2004). Thus, there is a requirement of an industry level initiative to educate
the organizations and people about the requirement of change in cultural issues for
effective adoption of ICT as it requires continuous technological and cultural
changes within the organizations. Researchers have highlighted that it can be
accomplished by building an innovative and adaptive culture that enhances
employees’ ability to adapt themse lves to an ever-changing work environment
(Stewart and Mohamed 2001).
Table 2.6 chronologically lists some more research papers discussing the requirement
to study synergy between technology, process and cultural issues.
Table 2.6: Research Papers Discus sing Synergy between Technology, Process and Cultural Issues
Author Abstract Year
Line
The paper discusses a philosophical, technological and social context for a full-scale experiment of using virtual teams for project execution.
1997
Egbu et al.
The paper studies the role of social issues, organizational culture and motivation in the effective adoption of IT for teamworking in construction.
2001
Sturges and Bates The paper deals with the influences of such issues as the industry, the climate and the culture on integrated data handling system.
2001
Huang et al.
The paper suggests an integrated Technology -process-culture model to support effective adoption of IT in the construction industry.
2002
Alshawi and Ingirige
The paper emphasizes that in order to successfully embrace web enabled PM, equal consideration should be given to technology, processes and people.
2003

__________________________________________________________________________________ Page 48
Chapter 2: Literature Review
2.8.3 Available Technology
ICT adoption in the construction industry leads to specific requirements with respect
to technology. Liberatore et al. (2001) have identified following technology related
issues as enablers of effective adoption of ICT and as areas of future research:
• Integrating PM software with other software packages and with enterprise
wide systems for such activities as materials management and financial
control.
• Increased flexibility of PM software.
• Ease of use issues including making the software more user friendly.
• Improved software capabilities to communicate project information with
project sites, increased capabilities to handle project uncertainty/risk and
improved methods to forecast activity duration.
A project web site provides a centralized, commonly accessible, reliable means of
transmitting and storing the project information, but people require a road map to
integrate the project web sites as a tool into their work on a daily basis (O’Brien
2000). Onsite work conditions may sometimes permit only the use of wireless or
portable devices. However it must be recognized that portable and handheld devices
simply cannot handle computationally heavy jobs due to their specific hardware
configurations (Pena-Mora and Dwivedi 2002). So, at remote sites, adequate
technological solutions are required. In the context of the Indian construction
industry, it is seen that India has a large population using English efficiently, but still
the majority in India cannot use this language. IBM, Microsoft and other IT agencies
have launched web sites, web portals and software in regional languages.
Availability of multilingual software could be considered as an enabler for effective
adoption of ICT in the Indian construction industry.
2.8.4 Training and Education
As per Froese (2002), training of construction executives is important for effective
adoption of a technology, otherwise the developed knowledge is lost. It could be
achieved by an industry level initiative of conducting ICT adoption training

__________________________________________________________________________________ Page 49
Chapter 2: Literature Review
programs in collaboration with researchers and academia. This would lead to a
widespread technological change in the industry that requires a good level of
awareness of the technology throughout the industry, understanding of the
technology and how to work with it (Froese 1996). Liberatore et al. (2001) have
identified making ICT training more accessible and less costly as an important
enabler for effective adoption of ICT.
Thus training of people in the industry is important. But, this is an issue to be dealt
with strategically at the industry level by providing training facilities for students and
executives and at the organization level by helping their executives in availing these
training facilities.
2.8.5 Organization Level Factors
In a survey conducted to assess the status of ICT adoption in the Australian
construction industry, it was found that the annual turnover of an organization has
an effect on the uptake of ICT and the training performance in ICT for an
organization (Kajewski et al. 2004).
As discussed above, Liberatore et al. (2001) have identified improving capabilities of
PM software as enablers of effective adoption of ICT and areas of future research.
Thus, IT tools or PM software adopted for project management processes would
have an effect on ICT adoption for the project management processes. But, the
decision to use the PM software is to be taken at the organization level. Also, the
project team members could use advanced PM software if they have high IT
capability leading to high ICT capability.
In an organization, effective communication is linked to the integration of work units
across organizational levels (Green 2001). Integrated communication system of the
organization should integrate all its project sites and the general administration team
in the head office leading to a similar ICT capability, ICT infrastructure and systems
across the whole organization. Thus, the level of ICT adoption for general
administration works would affect ICT adoption for project management processes.

__________________________________________________________________________________ Page 50
Chapter 2: Literature Review
Internet as the communication platform facilitates speedy transmission of
information and also saves money in communication with overseas construction sites
through the computer network compared to the traditional information handling
methods (Tam 1999). Thus, increased geographical separation between project
team members is an important factor that drives ICT adoption for the building
project management.
2.8.6 Perception Based Factors
In an organization, top management primarily initiates adoption of ICT, but effective
adoption of ICT is still dependent on the project managers who have the main
responsibility for managing the construction projects (Peansupap and Walker 2005)
and, as discussed above, to date a methodology has not been developed for the
construction industry to examine the potential contributions of information
management strategies in efforts to reduce overall project schedule and cost (Back
and Moreau 2000). As a result the benefits and barriers of ICT adoption are primarily
perception based and not quantifiable and these perceived benefits and barriers of the
project managers and senior management define the extent of ICT adoption by the
construction industry.
2.8.6.1 Perceived Benefits
The researchers have discussed the benefits of ICT in improving operational
performance through improved productivity – at project, organizational/team and
personal levels.
In a study Kajewski et al. (2004) have identified the benefits of ICT as:
• benefits to the project operations, both at the individual and at the
team/organization level.
• strategic benefits in the form of improved business opportunities that ICT
may provide.
• electronic banking and electronic archiving of documentation.
• intangible rewards of respect and self-fulfillment.

__________________________________________________________________________________ Page 51
Chapter 2: Literature Review
In a study Smit et al. (2005) have identified the benefits of ICT as:
• improved communication management due to availability of a single central
repository for all project documents accessible 24hrs-a-day from anywhere
• cost reduction in management and distribution of documents.
• increased document control leading to increased accountability and audit
capabilities.
• considerable time saving through more efficient processes.
• improved design development process leading to reduction in the number of
errors caused due to inefficient information management.
• fostering a more collaborative approach and providing the operators and
owners of the projects with access to correct ‘as built’ information.
As per Peansupap and Walker (2005), effective adoption of ICT also reduces
information re-entry by linking information between all construction processes. The
ability of the system to capture data at source once, accurately and on time, provides
major benefits. It helps with the consistency and reliability of the processes and reuse
of information thereby giving more scope for effective manipulation of information
(Construct IT Initiative Report 1998).
Above discuss ion of perceived benefits indicates that these benefits are default
drivers for ICT adoption by SMEs as these benefits would lead to successful
completion of projects and reduced cost of communication and project management.
It would be a cyclic process leading to their increased market competitiveness and
business advantage.
2.8.6.2 Perceived Barriers
There is poor supply-chain management in the construction industry and
communication is one of the technologies considered relevant to meet this challenge.
There are however, perceived barriers to the effective adoption of ICT for achieving
the required communication.
Root and Thorpe (2001) highlight lack of strategic direction within the industry, both
in terms of overall direction and the standards and protocols that would inform any

__________________________________________________________________________________ Page 52
Chapter 2: Literature Review
IT investment decision. As per Desai (1999), Barbour report has also identified
software incompatibility and lack of user education as an important barrier upon the
transition from paper to electronic record keeping. Such issues require strategic
initiatives at the industry level.
In collaborative working, benefits of any technology come through widespread
adoption of the technology, but in the construction industry there is a lack of critical
mass of construction projects requiring ICT adoption. This has resulted in
organizations being unwilling to make technological advances, especially with
respect to communication technologies (Root and Thorpe 2001).
Researchers have identified that organizations consider initial cost and cost of
keeping up to date with the technological developments in training and
hardware/software as important barriers for effective adoption of ICT (Root and
Thorpe 2001; Mitropoulos and Tatum 2000). This inability of organizations to
quantify process improvements and uncertainty of benefits from process and culture
changes is one of the primary barriers to the effective adoption of ICT for
construction project management.
In a survey it was found that not having an ICT professional on the site or within
ready access was a strong influential barrier to the uptake of ICT on projects
(Kajewski et al. 2004), since adequate support to the construction site processes is
important for collaborative ICT adoption in the construction projects. The inability to
share data in electronic form between project partners (Smit et al. 2005),
organization’s perception that ICT is not part of its core business, inconsistent
employee requirements on projects, not having an ICT implementation ‘champion’
on a project, demanding and inflexible workload and lack of ICT training and
experience (Kajewski et al. 2004) are also identified as significant barriers.
Champions are the individuals who are committed to the change and are in a position
to influence their organizations (Froese 1996) or the project teams. The champion
could be the project manager or the client.
Technology related barriers have also been identified. In a survey, it was found that
most of the respondents agreed that the quality of IT equipment and infrastructure

__________________________________________________________________________________ Page 53
Chapter 2: Literature Review
made available to them was a major factor in ensuring that they used it (Egbu et al.
2001). Therefore, inappropriate and inadequate ICT infrastructure is a barrier for its
effective adoption. Also, there is a fear of data security (Root and Thorpe 2001),
which requires attention. Table 2.7 chronologically lists some more research papers
discussing perceived benefits of and barriers to ICT adoption in the construction
industry.
2.8.7 Industry Drivers
In a survey it was found that amongst the identified drivers for ICT adoption, the
only issue with a below average mean response was ‘to help become industry leaders
in ICT adoption’ (Kajewski et al. 2004). As discussed above, Rivard (2000) has also
identified that technology improvement in the construction industry is usually driven
by necessity rather than by the desire to be at the cutting edge (Ranadive and
Gaikwad 2006). Thus, perceived industry drivers are important factors affecting the
adoption of ICT.
Some of the industry drivers identified in the literature very commonly are: increased
geographical separation between project team members, increased demand to
complete the projects in estimated time and cost and as per the specified quality, and
increased involvement of multiple agencies in the construction projects. Some of the
other discussed industry drivers are: requirement of larger organizations to ensure
that operational procedures and quality standards of their contract organizations are
compatible with their standards (Huin 2004) and the education of upcoming
construction program graduates in ICT technologies. Opfer (1997) has identified that
contractors have partly adopted computerized cost estimating and other systems due
to the fact that college-educated construction graduates were familiar with these
tools.

__________________________________________________________________________________ Page 54
Chapter 2: Literature Review
Table 2.7: Research Papers Discussing Perceived Benefits of and Barriers to ICT Adoption in the Construction Industry
Author Abstract Year
Love et al.
The paper aims to determine the barriers that small-medium sized contractors are experiencing when confronted with the requirement to implement e-commerce to sustain their competitiveness. It also proposes strategies that may be adopted by them to leverage the benefits of e-commerce.
2001
Nielsen and Sayar
The paper discusses a web-based case study for a building project to test a suggested information flow model. It provides a basis for automation and secures the information flow, document control and communication in construction companies. It looks at benefits of the process.
2001
Robeiro and Love
The paper demonstrates how the adoption of an e-business strategy can be used to create value throughout the supply chain in construction and provides insights into the benefits and limitations of the technologies used. Paper also suggests how different Internet and Web-based technologies can be used by SMEs to gain a competitive advantage in their respective marketplaces.
2003
Andresen et al.
The paper discusses the use of web for PM in four case studies. One of the major findings is that the planning of why and how the project web should be used is often rushed, not leading to expected efficiency gains.
2003
Chinowsky and Rojas
The paper presents the findings of a research that addresses the opportunities and potential barriers to successful virtual teams in the engineering, procurement and construction industry.
2003
Thorpe
The paper describes research into the use of Online Remote Construction Management (ORCM) on road construction projects, from the perspective of an industry representative in the research project. Observed benefits from using ORCM and issues in implementation are discussed.
2003
Weippert et al.
The paper describes ‘Best Practice Guidelines’ formulated to help reinforce the requirement for further research and development (R&D) of (a) innovative ICT tools and ICPM systems, (b) identifying ways to overcome industry cultural ‘barriers’ and ‘modifying’ traditional work ‘habits’ and (c) identifying improved implementation procedures and application opportunities within the construction industry.
2003
Kajewski and Weippert
The paper identifies the benefits and challenges to the adoption of e-Tender systems and considers future industry trends and recommendations.
2004
Ruikar et al
The paper highlights the drivers for adoption of extranets and its impact on end-user business processes. It also documents the end-user viewpoints on benefits and drawbacks of using project extranets.
2005
2.8.8 Summary of Factors
The above literature study and understanding of the construction industry has helped
in the identification and categorisation of the factors at the level of industry,
organization and people. Fig. 2.3 is a cause-effect diagram showing categorisation of

__________________________________________________________________________________ Page 55
Chapter 2: Literature Review
Strategic and technological co-ordination of factors at all the levels is essential for
effective diffusion of ICT at the industry level. This issue rose to prominence from
the work of Porter (1991) (Clark et al. 1999). Thus, a holistic study is required to
assess the effect of these factors, and these factors can not be studied in isolation.
Researchers have grouped the benefits of IT for construction project management
with respect to different perspectives: Serafeimedis and Smithson (2000) have
classified these benefits as tangible and intangible (Stewart and Mohamed, 2001);
similarly Andresen et al. (2003) have termed these benefits as economically
measurable, measurable and non-measurable benefits; Farbey et al. (1995) and Irani
and Love (2001) have categorized these benefits as being strategic, tactical and
operational (Love et al., 2004); Stewart and Mohamed (2004) have informed these
benefits as informational, automational and transformational. Peters (ed. Willcocks
1994, p.99-131) categorizes the benefits as those of enhanced productivity, business
expansion and risk minimization (Love et al. 2004).
Use of ICT for Building Project Management
Fig. 2.3 Factors Affecting ICT Adoption for Building Project Management
Training
Cultural Factors
Perceived Barriers
Perceived Benefits
People Level Factors Industry Level Factors
Training and Education
Available Technology
Strategic Issues
Industry Drivers
Cultural Factors
Use of ICT for General Administration
Turnover of the Organization Geographical Separation of Project Team Orgs.
IT Tools utilized for PM Processes
Organization Level Factors
Cultural Factors Strategic issues
Training of executives
__________________________________________________________________________________ Page 56
Chapter 2: Literature Review
In this research, with the focus on ICT adoption for building project management, the
benefits of ICT as perceived by people are categorized as benefits related to:
• Measures of Project Success
• Effective Team Management
• Effective use of Technology
• Increased Organizational Efficiency
The barriers as perceived by people and their mitigating enablers have also been
categorized as related to:
• Technology
• Projects
• Organization
• Industry
The identified perceived benefits, barriers, enablers and industry drivers are
discussed in detail in Chapter 4 and 5.
2.9 Strength of the Contemporary Research
Based on the review of the reported literature, following strengths of contemporary
research can be cited:
• Many international research journals have published and given significant
importance and thrust to the research on ‘IT adoption in the construction
industry’. Some of the books have also discussed issues concerned with the
strategic adoption of IT by the construction industry. These journals and books
have been referred for the literature review and are indicated in the References
section. Such publications provide a major boost to the research in this area.
• Recent technological advances in the tools adopted for communication have led
to the sudden and sustained scope of improvement in ICT adoption for project
management and specifically by SMEs. This has drawn attention of the
researchers studying technical as well as managerial and cultural issues affecting
adoption of ICT in the construction industry.

__________________________________________________________________________________ Page 57
Chapter 2: Literature Review
• Construction industry has now recognised the significance of effective adoption
of ICT for sustaining the global competitive environment. Workshops, seminars
and conferences are frequently held to provide a forum for researchers in this
area to meet and share their research findings and also to keep the managers
updated with the latest research and technical developments in this area. Papers
from proceedings of many such interactions are referred in the literature and are
indicated in the References section.
• As discussed in Sec. 2.7.1, national level initiatives have been taken in some
countries to assess the adoption of IT/ICT in the construction industry of their
country and to formulate strategies to increase its adoption.
2.10 Gaps in Contemporary Research and Identification of Research Areas
Table 2.8 identifies the research areas after identification of the gaps in literature and
leads to the validation of research topics and objectives.
Table 2.8: Summarization of Research Conducted, Research Required and Validation of the Research Objectives
S.No Research Conducted Research required Validation of research topic and objectives
1 Research conducted till date has primarily considered construction industry as a whole.
Requirement is to study ICT adoption for building construction projects and engineering or infrastructure projects separately, as the characteristics of supply chain issues, management procedures and contract conditions are different in both the categories of projects.
Identified research area validates the focus of the research topic i.e to study ICT adoption for building project management.
2 Research conducted till date has primarily studied adoption of IT by the construction in dustry, which would include applications for individual functions and communication technologies. Some of the later research papers do focus specifically on effective adoption of ICT by the construction industry.
Research is required to further study ICT adoption separately and also to study the causal relationship between uses of advanced IT applications and adoption of ICT.
Identified research area validates research objectives ‘vi and vii’.
3 Research conducted till date primarily studies factors affecting IT/ICT adoption either at the industry level, organization level or at the project level.
Requirement is to study the factors at all the three levels separately and also collectively.
Identified research area validates research objectives ‘iii, iv, v, vi and vii’.

__________________________________________________________________________________ Page 58
Chapter 2: Literature Review
Table 2.8 Continued 4 Research conducted till date
primarily studies IT/ICT adoption either at the design stage or at the project execution stage. But, project management integrates all the stages of the projects.
Requirement is to study factors for effective adoption of ICT at all the stages of the building construction projects for successful project management.
Identified research area validates research objectives ‘iii, iv, v, vi and vii’.
5 Research till date has been primarily conducted in Europe, USA and Australia. Recent research in South East Asian countries has also been reported. So, the survey data discussed in the research papers present status of IT/ICT adoption in these regions. As identified from Table 2.1, only one such survey has been reported for the Indian construction industry. But, the sample size of the survey was very small.
India is a large country and to study these issues specifically for Indian sub-continent, requirement is to conduct a survey covering large regional areas within India and to have a large sample size.
Identified research area validates research objective ‘i’.
6 As identified from Table 2.1, research in ICT adoption by the Indian construction industry is at a nascent stage
Requirement is to study factors affecting ICT adoption in the Indian construction industry and
Identified research area validates research objectives ‘iii, iv, v, vi and viii’.
and at individual levels. provide a framework to initiate a national level strategy for increasing its adoption.
7 Recent research has also studied issues in relation to SMEs, but project management structure followed by SMEs has not been studied.
Requirement is to study project management structure and extent of formal project management processes conducted by SMEs for building project management. This will help in understanding requirements for ICT adoption by SMEs for building project management. This study has to be region specific, even though the results can be generalized after due considerat ion. This research would be conducted with reference to Indian construction industry and generalized as suggested.
Identified research area validates research objective ‘ii’.
8 Research papers indicate some research efforts towards establishing frameworks for benchmarking IT/ICT adoption by the construction industry, but extensive research in this area is not
Research is required to further study and provide a framework for benchmarking the extent of ICT adoption for building project management by the organizations. A framework is required to collectively
Identified research area validates research objective ‘viii’.

__________________________________________________________________________________ Page 59
Chapter 2: Literature Review
reported. assess ICT adoption at organization and industry level. Through this framework, organizations should be able to measure their ICT adoption and align it with their business objectives. The framework should be general, but the levels (low to high) defined in the framework should be region specific. This research would develop a framework indicating levels with reference to Indian construction industry.
Thus, identified research areas validate identified research objectives.
2.11 Summary
In this chapter, literature review started with the background of research issues
related to ICT adoption for building project management, ICT tools and technologies
and the study of SMEs and the Indian construction Industry. This was followed by
the study of research background in these issues including international research and
research in India and the identification of research variables in terms of factors
affecting ICT adoption. The study of contemporary research helped in identification
of the strength of the research and gaps in research leading to the identification of
research areas. Identified research areas aligned with the research objectives, leading
to the validation of the objectives are discussed in Chapter 1. Thus, identified gaps
explain the context, significance and purpose of the research and provide direction
and motivation for the present research. The next chapter describes identified
research hypotheses and research methodology designed for conducting the research.


__________________________________________________________________________________ Page 61
Chapter 3: Research Methodology
CHAPTER 3
RESEARCH METHODOLOGY
3.1 Introduction
The guideline for designing the research methodology for the study was the
definition of ‘Research’ as given by Kothari (2005, p.6): “Research replaces intuitive
business decisions by more logical and scientific decisions.”
Research methodology includes research methods as well as the logic behind the
methods used in the context of the research study. Before designing the research
methodology, however, each major concept, which researcher wants to measure must
be explicitly understood and the framework for results formulation should be
defined. This helps in understanding what information is to be obtained for solving
the problem or for arriving at the research objectives. In this research, the major
concepts are the research variables or the factors affecting the adoption of ICT for
the building project management and the research hypotheses.
The design of the study for a complex subject is a very challenging task and requires
quite a bit of innovation. This task was approached systematically by identifying the
research variables, evolving the conceptual framework, formulating the hypotheses
and designing the research methodology to meet the objectives. A number of creative
ideas had to be explored to get feedback from senior executives of a large number of
organizations managing building projects in the Indian construction industry. Details
of the key steps in the design of the study are discussed in the following sections.
3.2 Research Variables
Factors affecting ICT adoption for building project management are the research
variables that are required to be studied. Fig. 2.3 presented the factors at the levels of
industry, organization and people. All these variables are required to be studied

__________________________________________________________________________________ Page 62
Chapter 3: Research Methodology
independently as well as together, because together these become the factors
affecting ICT adoption for building project management by the industry. People
work on the projects, but their adoption of ICT is defined by the variables attached
with them as well as by the variables attached with their organizations, since they
represent their organizations. Similarly ICT adoption by an individual organization is
defined by the variables attached with it as well as by the industry level variables,
since it represents its national construction industry. Thus, causal relationships
between these variables are required to be studied.
Variables with attached indicators can also be termed as macro variables with
attached indicators or micro variables. Indicators are the dimensions that help in
measuring and quantifying the macro variables. These need to be elaborated and
explained. Literature review and understanding of the construction industry has
helped in the identification of the micro variables for identified factor s, which would
be further divided into the measurable dimensions. Variables for which dimensions
are identified and can be measured quantitatively are measured and analyzed through
the quantitative assessment approach. For other variables, dimensions are identified,
measured and analyzed through further analysis utilizing qualitative analysis
approach. Table 3.1 lists the macro variables, identified micro variables and the
assessment approach for each macro variable.
3.2.1 Justification of the Chosen Research Variables
Many other variables, apart from the identified variables, indirectly affect ICT
adoption in the construction industry. However, the mindset in choosing the research
variables for this study was to consider the variables that directly affect ICT adoption
for building project management, as otherwise the study would have been
unmanageable.

__________________________________________________________________________________ Page 63
Chapter 3: Research Methodology
Table 3.1: Identification of Micro Variables for the Macro Variables and Type of Study Required for Each Variable
Macro variables Micro variables Type of study required Industry Level Factors Strategic Issues (IF1) Qualitative assessment Training and Education (IF2) Quantitative/Qualitative
assessment Perceived Drivers (IF3) Quantitative assessment Available Technology (IF4) Quantitative/Qualitative
assessment Cultural Factors (IF5) Quantitative/Qualitative
assessment Organization Level Factors Strategic issues (OF1) Quantitative/Qualitative
assessment Turnover of the Organization (OF2)
Quantitative assessment
Infrastructure maturity for use of ICT for general administration
Quantitative assessment ICT for general administration (OF3)
Extent of use of ICT for general administration
Quantitative assessment
IT Tools utiliz ed for Project Time Management processes
Quantitative assessment
IT Tools utilized for Project Cost Management processes
Quantitative assessment
IT Tools or advanced software utilized for building PM Processes (OF4)
IT Tools utilized for Project Resource Management and administrative processes
Quantitative assessment
Percentage of projects on which organization has interacted with geographically separated agencies within India in last 5 years
Quantitative assessment Geographical Separation of Project Team Orgs (OF5)
Percentage of projects on which organization has interacted with overseas agencies in last 5 years
Quantitative assessment
Cultural Factors (OF6) Quantitative/Qualitative assessment
Training of Executives (OF7) Quantitative/Qualitative assessment
People Level Factors Training (PF1) Quantitative/Qualitative
assessment Benefits related to effective use of technology
Quantitative assessment
Benefits related to effective team management
Quantitative assessment
Benefits related to measures of project success
Quantitative assessment
Perceived Benefits (PF2)
Benefits related to increased organizational efficiency
Quantitative assessment
Technology related barriers Quantitative assessment Projects related barriers Quantitative assessment Organizations related barriers Quant itative assessment
Perceived Barriers (PF3)
Industry related barriers Quantitative assessment Cultural Factors (PF4) Quantitative/Qualitative
assessment

__________________________________________________________________________________ Page 64
Chapter 3: Research Methodology
3.3 Hypotheses Formulation
Literature survey and deep understanding of Building Project Management has
resulted in the formulation of the following Research Hypotheses. Three sets of
hypotheses have been formulated. One set is ‘Hypotheses determining dimensions of
qualitative factors’ i.e factors that are to be qualitatively assessed. The second set is
‘Hypotheses of Causal relationships’ and tests the effect of identified quantitative
factors on ICT adoption for building project management. The third set covers
‘Supplementary Hypotheses’.
3.3.1 Hypotheses determining dimensions of qualitative factors
Dimension for Factor IF1:
HD1: For building project management, collaborative use of ICT is not as prevalent
as the internal use of ICT within organizations.
Dimensions for Factors IF2, OF7 and PF1:
HD2: It is perceived that education of the users for ICT adoption and its benefits is
important for increasing effective ICT adoption in building projects.
HD3: It is perceived that more accessible and less costly ICT training for executives
is important for increasing effective ICT adoption in building projects.
Dimensions for Factor OF1:
HD4: Majority of SMEs do not have a communication management strategy within
the organization.
HD5: Adoption of ICT by an SME is project specific and not organization specific.
Dimension for Factor IF5, OF6 and PF4:
HD6: Personal meetings are still preferred over teleconferences and other e-meeting
solutions for managing building projects.
3.3.2 Hypotheses of Causal Relationships
HR1: Organizations with higher turnover have higher adoption of ICT.
HR2: Increased use of advanced software for individual functions or processes
positively affects ICT adoption for communicating information with respect
to those processes.

__________________________________________________________________________________ Page 65
Chapter 3: Research Methodology
HR3: Geographical separation of the project team members positively affects ICT
adoption for building project management processes.
HR4: Perceived benefits of ICT adoption positively affect ICT adoption for the
building project management processes.
HR5: Perceived barriers for effective ICT adoption negatively affect ICT adoption
for the building project management processes.
3.3.3 Supplementary Hypotheses
HS1: It is perceived that adoption of ICT leads to significant benefits with respect
to building project management.
HS2: It is perceived that increase in ICT adoption by SMEs for managing building
projects is driven by industry requirements.
HS3: Extent of adoption of ICT for building project management differs for the
three groups of sample organizations i.e Builders, Project management
consultancy organizations, and Architectural organizations.
3.4 Research Design
Research design may be defined as the plan for moving from the research question to
the conclusion. A design, which yields maximal information and provides an
opportunity for considering many different aspects of a problem, is considered most
appropriate and efficient design in respect of a research problem (Kothari 2005, p.31-
52). Research design must contain: A clear statement of the characteristics of the
research problem; Unit of analysis; Data collection; and Analysis approach.
3.4.1 Understanding of the Characteristics of Re search Problem
To understand the nature of the research problem, the research aim is again
presented:
The Research Aim is to develop protocols for effective adoption of Information
Communication Technologies (ICT) for Building Project Management by Small and
Medium Enterprises (SMEs) in the Indian construction industry.

__________________________________________________________________________________ Page 66
Chapter 3: Research Methodology
As per Kothari (2005, p.1-21), based on the research aim and objectives, research can
be categorized as under:
Descriptive, Formulative or Analytical research: Descriptive research includes
surveys and fact-finding enquiries of different kinds. Formulative or exploratory
research aims at formulating a problem or developing a working hypothesis.
Analytical research involves using facts or information already available and
analyses and makes a critical evaluation of the material. This research can be
categorized as descriptive research.
Applied or Fundamental research: Applied or action research is aimed at discovering
a solution for some immediate practical problem facing a society or an
industrial/business organization, whereas fundamental or basic/pure research is
mainly concerned with generalizations and with the formulation of a theory. This
research can be categorized as applied research.
Conceptual or Empirical research: Conceptual research is related to some abstract
idea(s) or theories and is used by philosophers and thinkers to develop new concepts
or to reinterpret existing ones. Empirical research relies on experience and is a data-
based research. In such research, the researcher must first have a working hypothesis
or guess as to the probable results, and then works to get enough facts (data) to prove
or disprove the hypothesis. Empirical research is also appropriate when proof is
sought that certain variables affect other variables in some way. This research can
be categorized as empirical research.
Comprehensively considered, this research can be categorized as applied, since it
addresses the problem of increasing effective ICT adoption for building project
management by SMEs in the Indian construction industry; descriptive, since survey
is being conducted for data collection and empirical, because it involves testing the
hypotheses including testing the causal relationships between the research variables.
Such studies involving the testing of hypotheses of a causal relationship between
variables require a design, which will permit inferences about causality, in addition
to the minimization of bias and maximization of reliability (Kothari 2005, p.1-21).

__________________________________________________________________________________ Page 67
Chapter 3: Research Methodology
3.4.2 Unit of Analysis
Hussey and Hussey (1997) defined the unit of analysis as the kind of case to which
the phenomena in the research problem refers. The unit of analysis may be an
individual, an event, an object, a group of individuals or a relationship. Kervin
(1992) suggested that as a rule it is best to choose a unit of analysis at the lowest
level possible where the decisions are made. The best guides for choosing a unit of
analysis are the research aim and the objectives, as they explicitly refer to the focus
of the study.
The unit of analysis is required to be determined even as the research questions are
formulated because the data collection methods, sample size, and even the variables
included in the framework may sometimes be determined or guided by the level at
which the data will be aggregated at the time of analysis (Sekaran 2000, p.135-138
cited in Tone 2005).
In reference to this research study, organizations managing the building projects are
the lowest level where decisions for ICT adoption for building project ma nagement
are taken. However, subjective factors affecting ICT adoption at the project level are
also required to be studied. Thus, the unit of analysis for the research is both an SME
managing building projects and a building project being managed by that SME.
Based on the literature review, for the research study, an SME is defined as an
organization with its number of staff upto 250.
3.4.3 Data Collection and Analysis Approach
Data collection, data analysis and the development and verification of relationships
and conclusions are very much an interrelated and interactive set of processes. The
analysis occurs during the collection of data, as well as after it, and helps to shape the
direction of data collection (Saunders et al. 2000, p.380-406).
Data collection and analysis can be conducted through quantitative approach,
qualitative approach or mixed methods approach. The former involves generation of
data in the quantitative form, which can be subjected to rigorous quantitative analysis
in a formal and rigid fashion. Qualitative approach is concerned with the subjective

__________________________________________________________________________________ Page 68
Chapter 3: Research Methodology
assessment of attitudes, opinions and behavior. Research in such a situation is a
function of the researcher’s insights and impressions. Such an approach to research
generates results either in a non-quantitative form or in the form that is not subjected
to rigorous quantitative analysis.
Broyd (1999) claims that the industrial adoption of high technologies in the
construction sector can be described as a technology-process-culture (TPC) triangle
(Huang et al. 2002). Similarly effective adoption of ICT by construction
organizations requires utilization of this triangular paradigm and equal consideration
of the associated technology, process and cultural aspects. To consider social,
cultural and contextual variables affecting different latent constructs or factors, a
hybrid methodology utilizing the symbiotic relationship between quantitative and
qualitative studies is required to be utilized. Saunders et al. (2000) have also
suggested that it is often beneficial to use a mixed methods approach by combining
quantitative and qualitative methods and using primary and secondary data in the
same study, as it helps in using different methods for different purposes in the study
and enables triangulation to take place at the stage of the formulation of results.
Triangulation is used to describe a multi-method approach for ascertaining and
confirming results, so that the researcher has confidence that the phenomenon
observed is because of the ‘trait’ and not because of the ‘method’ (Srivastava and
Teo 2006).
As discussed above, in this research, study of the identified research variables
requires use of quantitative as well as qualitative methods. Thus, this research
focuses on collecting and analyzing both quantitative and qualitative data in a
sequential manner (sequential mixed methods). To develop a balanced check
mechanism, the research was divided into four phases: Interpretive analysis of
perceived benefits of ICT adoption for building project management, conducted by
ISM analysis; Questionnaire survey data collection and empirical analysis of data
including SEM analysis (quantitative method); Semi-structured interview survey data
collection and analysis including DEA analysis (quantitative and qualitative method);
and Case Studies analysis conducted by SAP-LAP analysis (qualitative method)
leading to synthesis of the results of the four phases. The purpose of this four-phase,
sequential mixed methods study was to start with pragmatic assumptions, obtain
__________________________________________________________________________________ Page 69
Chapter 3: Research Methodology
statistical, quantitative results from a broad sample of organizations to analyze or
study research variables at industry and organization level and then follow up with a
few organizations and projects to study the research variables at the level of
organization and projects to probe, explore and validate the results in more depth.
According to Wass and Wells (1994) semi-structured interviews may be used to
explore and explain themes that have emerged from the use of questionnaire
(Saunders et al. 2000, p.242-270). Data analysis in the mixed methods research
relates to the type of research strategy chosen for the procedures (Creswell 2003
cited in Tone 2005). For the sequential mixed method strategy of this research,
analysis occurs within both the quantitative and the qualitative stages of research.
The first phase was interpretive analysis of perceived benefits. Interpretive Structural
Modeling (ISM) technique was used to assess the importance of perceived benefits
of ICT adoption for building project management and their driving power and
dependence on other benefits. This led to the formulation of the additional
hypotheses of causal relationships and a framework for the benefits management
plan within the organizations.
Questionnaires are an efficient data collection mechanism when the researcher
knows exactly what is required and how to measure the variables of interest (Sekaran
2003). The second phase involved administering a questionnaire survey with
predominantly quantitative research questions to address the research variables.
Therefore, initially an extensive literature review was undertaken to help establish a
rationale for the research questions and to ascertain the extent and depth of existing
knowledge on the research variables. The literature was used deductively as a basis
for advancing research objectives (Creswell 2003, p.32). The data was analyzed
through rigorous statistical analysis. The results included a proposed framework for
benchmarking ICT adoption for building project management. It required
quantitative and qualitative assessment for validation and finalization. Qualitative
data analysis was also required to establish dimensions of research variables like
cultural issues that required qualitative assessment.
Semi-structured inte rviews are appropriate for triangulating the data collected by
questionnaire (Saunders et al. 2000, p.242-270), for exploring and explaining themes

__________________________________________________________________________________ Page 70
Chapter 3: Research Methodology
that emerge from the use of questionnaire survey and also to validate findings from
the use of questionnaire (Wass and Wells 1994 cited in Saunders et al. 2000, p.242-
270). Thus, the third phase consisted of semi-structured interviews conducted at the
organization level leading to finalization and validation of the benchmarking
framework. It included quantitative as well as qualitative analysis.
The purpose of case studies is, “to tell a big story through the lens of a small case.”
(Tan 2004). The fourth phase, the qualitative study was the case studies analysis
conducted to identify social, cultural and behavioral factors affecting ICT adoption.
Synthesis of the four phases of the study is a qualitative phase, as it required
researcher’s experience and judgment for the formulation of results.
Research methods generate techniques and appropriate data analysis techniques were
adopted for each stage of the research. The research methods and techniques adopted
in the three phases are discussed in detail in subsequent sections.
3.5 Research Methods
Research methodology is a way to systematically solve the research problem
(Kothari 2005, p.8) and it helps to structure the research process in logical steps
through appropriate stages. Only by using appropriate methodologies and methods of
research, applied with rigor, can the body of knowledge for construction be
established and advanced with confidence (Fellows and Liu 2003).
Research methodology has been planned to achieve the research objectives by way
of including effective data collection, analysis and their validation methodologies.
The whole process would facilitate continuous knowledge building that is required
for the research process.

__________________________________________________________________________________ Page 71
Chapter 3: Research Methodology
3.5.1 Interpretive Structural Modeling (ISM)
Perceived benefits of ICT adoption for building project management were identified
from the literature and after discussion with the experts from the industry and
academics. These identified perceived benefits are listed in Chapter 4 (Table 4.1).
Relation between these benefits and the dependence and the driving power of each
benefit with respect to other benefits was analyzed. This analysis provides
framework for the building project managers to plan adoption of ICT for the projects.
It shows that if they are planning ICT adoption for achieving certain benefits, then
what are the other driving benefits that should be achieved prior to that and also,
what are the dependent benefits that would be subsequently achieved by default. The
analysis required examination of direct and indirect relationships between the
benefits, rather than considering these benefits in isolation.
Interpretive Structural Modeling (ISM) technique has been applied to analyze the
relation between these benefits and to understand the dependence and the driving
power of each benefit with respect to other benefits.
ISM is one of the tools of Interactive Manage ment (IM) (Warfield 1974). It is a well-
known methodology for identifying and summarizing relationships among specific
elements, which define an issue or a problem and is a method by which order can be
imposed on the complexity of such elements (Mandal and Deshmukh 1994). The
developed model is portrayed in words as well as graphically.
ISM methodology is interpretive from the fact that the judgment of the expert group
decides whether and how the variables are related. It is structural too, as on the basis
of the relationships, an overall structure is extracted from the complex set of
variables. It is a modeling technique in which the specific relationships of the
variables and the overall structure of the system under consideration are portrayed in
a digraph model. ISM is primarily intended as a group learning process, but it can
also be used individually (Ravi and Shankar 2005).
ISM has been used by researchers for understanding direct and indirect relationships
among various variables in different industries. It has been used to study higher

__________________________________________________________________________________ Page 72
Chapter 3: Research Methodology
education program planning (Hawthorne and Sage 1975), energy conservation in
Indian cement industry (Saxena et al. 1992), vendor selection criteria (Mandal and
Deshmukh 1994), important elements for the implementation of knowledge
management in Indian industries (Singh et al. 2003), strategic decision making in
managerial groups (Bolaños and Nenclares 2005) and barriers of reverse logistics
(Ravi and Shankar 2005).
However, in the literature no evidence was found of use of ISM methodology for
construction related research. Watson (1978) has specifically discussed about ISM as
an appropriate tool for technology deployment assessment and was thus considered
appropriate for studying deployment of ICT in the construction industry.
ISM analysis is discussed in Chapter 4.
3.5.2 Questionnaire Survey (Industry Level)
The questionnaire survey was conducted for quantitative data collection and analysis.
It provided feedback about the validity, relevance and significance of potent ial
indicators for each research variable.
The mail questionnaire, as the term indicates, is a survey in which the questionnaires
are sent out by the researcher and answered by the respondents without the
researcher’s intervention (Dane 1990). Compared with personally administered
questionnaires, mail questionnaires can cover a wider geographical area, can be
conducted at low cost, both for data collection and processing, and avoid researcher’s
bias (Oppenheim 1992). Mail survey methodology was adopted, as India is a large
country and to have a sample representing the industry, a large sample size was
required. Also, for greater reliability, the sample size should be sufficiently large
(Kothari 2005, p.55-68). However, the return rates of the mail questionnaires are
typically low (Dane 1990; Bourque and Fielder 1995). A 30% response rate is
considered acceptable for statistically reliable information (Fellows and Liu 2003;
Sekaran 2003). Nevertheless, some effective techniques can be employed for
improving the response rates to the mail questionnaires, like sending follow-up

__________________________________________________________________________________ Page 73
Chapter 3: Research Methodology
letters, providing the respondents with self -addressed, stamped return envelopes, and
keeping the questionnaire brief.
Important components of the questionnaire survey are discussed below.
3.5.2.1 Questionnaire Design
As defined by Kothari (2005, p.95-121), a questionnaire is “basically a collection of
questions that fit the research topic and its objectives and the answers to which will
provide the data necessary to test the hypotheses formulated for the study”. Also as
per the definition of Nachmias and Nachmias (1981), the foundations of all the
questionnaires are the questions or statements for which the researcher intends to
seek answer or opinion in terms of level of agreement.
In designing a questionnaire, the researcher has to cautiously pass through the
various stages of clearly defining the research aim and objectives, research variables,
and relationship of variables and formulating hypotheses. The questionnaire has been
designed after identifying the measurable dimensions of research variables that can
be assessed quantitatively. The dimensions have been identified through the literature
review, enriched by the researcher’s experience and validated through pre-
consultations with experienced executives and academicians. As the response rates of
such surveys are not enthusiastic and the respondents are generally reluctant to spare
their time in responding to these questionnaires, primarily close-ended questions
were included so that lesser time and effort were required in filling up the
questionnaire. This also helped in getting the data in a standard format as required for
statistical analysis. The questionnaire was divided into four sections.
Section I contained questions that assess the organization size in terms of turnover
and staff strength, organization's area of expertise and primary mode of project
execution, project team structures in terms of geographical separation of project team
organizations, ICT maturity of the staff and the organization, and mode of
communication adopted for general administration. Section II was a tool for mapping
building project management (PM) processes adopted in the industry, assessment of
software applications adopted for these processes, and ICT adoption for each

__________________________________________________________________________________ Page 74
Chapter 3: Research Methodology
identified PM process. The PM processes have been divided under four groups: Time
Management; Cost Management; Project Administration and Resource Management;
and Communication Management. Section III assessed the perception of project
managers regarding perceived benefits, barriers, enablers and industry drivers
affecting ICT adoption for building project management. Qualitative perceptions
analysis is converted into quantitative values with the help of a five point Likert
scale. Section IV provided the data regarding respondent’s profile. It is considered
important to get this information since data reliability is related to the data source
and the identification of the position held by the person who completed the
questionnaire (Oppenheim 1992).
Exhaustive options were given for each question, but to get the accurate data, for
some questions respondents were also given an option to provide answers different
from the options given. Nominal, ordinal and interval scales were used in the
representation of options for different questions. Some questions were represented
through interval scale and for some questions yes/no option was given. Interval scale
was considered appropriate for those questions in which the requirement was to rate
the inequalities between organizations within equal intervals (Kothari 2005, p.69-
94). Ordinal scales were Likert-type 3-5 point scales. Likert type scales are normally
used in respondent-centered and stimulus -centered studies, i.e through these scales
we can study how responses differ between people and how responses differ between
stimuli (Kothari 2005, p.69-94). The sample population has been divided into three
groups as described below. Each group has a different stimuli based on their area of
expertise and their responses would differ accordingly.
3.5.2.2 Survey Population
The unit of analysis for the survey was organization and the sample population was
small and medium enterprises (SMEs) in the Indian construction industry. Survey
was conducted across India to minimize the regional bias. Survey sample was
selected from the Yellow Pages and the Notified lists of Professional bodies and falls
under the group of Purposive Sampling, which is considered desirable when the
universe is small and a known characteristic of it is to be studied intensively (Kothari
2005, p.17). In order to generalise the results, it is necessary to select a sample that is

__________________________________________________________________________________ Page 75
Chapter 3: Research Methodology
a true representation of the population. Thus, those organizations were included in
the sample, which were either managing building projects after being appointed as
the project managers or had the authority to manage their projects if a project
manager was not appointed formally. Therefore three groups of organizations were
included in the sample: builders including contractors who construct and manage
their own projects; project management consultancy organizations which are
formally appointed as project managers on building projects, and architectural
organizations which manage small to medium size build ing projects since on many
such projects, project managers are not formally appointed. Targeted respondents
were the senior level executives in the organizations.
3.5.2.3 Validation of Questionnaire
It is important that we are “measuring what we think we are measuring” (Kerlinger
1973). Thus, validation check is important to assure that what the researcher has in
mind when writing a questionnaire coincides with the respondents’ perceptions when
they go through it and the researcher gets an accurate result of the respondent’s
experience. Sekaran (2000, p.209) states that ‘goodness of measures’ is established
through the different kinds of validity and reliability and that results of any research
can only be as good as the measures that tap the concepts in the theoretical
framework (Tone 2005). According to Sekaran (2000), validity tests how well a
developed instrument measures the particular concept it intended to measure, while
reliability tests how consistently a measuring instrument measures the concept it is
supposed to measure. For a mixed methods approach, reliability and validity
measures apply just the same for both quantitative and qualitative data (Creswell
2003, p.220).
The questionnaire was tested for two main types of validity, which are conte nt
validity and criterion validity. Reliability was tested at the stage of data analysis.
Content validity represents the adequacy with which a specified domain of the
content is sampled (Nunally 1978) and validates that the instrument item has items
that cover all aspects of the variables being measured. Content validity cannot be
determined numerically. Its determination is subjective and judgmental. It primarily

__________________________________________________________________________________ Page 76
Chapter 3: Research Methodology
depends on an appeal to the propriety of the content and the way it is presented
(Nunally 1978). The instrument developed in this study demonstrates the content
validity, as the selection of measurement items was based on both, an exhaustive
review of the literature and evaluation by the academicians and practicing managers
during its pre-testing. Content validity was further tested during the pilot survey as
per the guidelines provided by Forza (2002).
Criterion related validity refers to the degree to which the measurements within the
questionnaire are meaningfully related to the objectives of the questionnaire. The
questionnaire was exposed to the experts from the industry and academics. Research
objectives and research variables being measured by the questionnaire were
explained to the experts and they were requested to give their opinion and
perceptions about it and their suggestions on how to improve it. Their suggestions
and opinions were incorporated into the questionnaire. Doing that, it was assured that
the measurements were meaningful to the objectives of the study.
3.5.2.4 Pilot Survey
Once the questionnaire validation was completed, it was subjected to pre-testing
through the pilot survey. The pilot survey respondents were selected from the same
population in which the main survey was to be conducted. Pilot survey was
undertaken to test the potential response rate, suitability and comprehensibility of the
questionnaire.
Questionnaire for the pilot survey was forwarded to 11 organizations and responses
were received from 7 organizations, leading to a response rate of about 64%. Later,
each respondent was interviewed on the basis of the questionnaire, with an objective
to locate the weak points of the questionnaire. Each respondent was requested to
communicate the difficulties faced in filling up the questionnaire and the possibilities
for further improvements for easy understanding of the respondents. The suggestions
regarding language, formulation of questions, sequencing, formatting etc. were
noted. The confusing and the problem questions were reformulated in consultation
with the respective respondents and rechecked with all the respondents individually.
Respondents were also asked to give their feedback regarding content of the

__________________________________________________________________________________ Page 77
Chapter 3: Research Methodology
questionnaire. This gives the researcher an indication of whether the questionnaire is
measuring the right concept and it is consistently measuring the concept being
measured, hence its validity and reliability Thus, the questionnaire was improved
with respect to the content, form, sequence of questions, spacing, arrangement and
physical appearance of the questionnaire, so as to get the desired response from the
respondents.
Primarily the questionnaire remained the same. But, in some questions respondents
had given multiple answers, which showed that for the processes indicated in those
questions, respondents were using multiple options. Such questions were modified to
understand the percentage of each option utilized by the respondents.
The modified questionnaire was forwarded for the main survey. Final form of the
questionnaire with all the details is presented in Appendix A.
3.5.2.5 Survey Administration
The questionnaire was administered with a brief write-up on the research objectives,
purpose of the questionnaire survey and the directions regarding filling it up.
Organizations were intimated about the survey through telephone or e-mail. After
receiving consent from them, the questionnaires were sent to them by post or through
e-mail, as suitable. Postal questionnaires were accompanied with self-addressed
envelopes for sending back the filled up questionnaires. Attempts were made to
minimize non-response through frequent and easy-to-understand correspondence
(Dillman 2000 cited in Prahinski and Benton 2004).
India is a large country and to minimize the regional bias, organizations in major
cities spread all over India were contacted. Sample size must fulfill the requirements
of efficiency, representativeness, reliability and flexibility (Kothari 2005, p.152-183).
Sample size is also governed by the data analysis technique to be adopted. ‘Structural
Equation Modeling’ (SEM) technique adopted for data analysis is a large sample size
technique. 149 usable responses were received for a response rate of 40.05%.
Detailed analysis of the respondents’ profile is discussed in Chapter 5.

__________________________________________________________________________________ Page 78
Chapter 3: Research Methodology
3.5.2.6 Data Analysis
The ‘Hypotheses determining dimensions of qualitative factors’, ‘Supplementary
hypotheses’ and hypothesis HR1 were tested through parametric and non-parametric
statistical analysis discussed in Chapter 5. HR1 studies the effect of ‘Turnover of the
organization’ on ICT adoption. This factor can’t be standardized for all the three
groups of organizations and was tested for each group separately. All other
‘Hypotheses of causal relationships’ were tested through ‘Structural Equation
Modeling’ (SEM) analysis discussed in Chapter 6.
Parametric and Non-parametric Statistical Analysis
Data analysis included testing the hypotheses and defining the status of ICT adoption
for building project management by SMEs in the Indian Construction Industry. This
was a very important component of the data analysis and provided a foundation for
the formulation of results. The analysis was conducted through the statistical analysis
software SPSS. Different statistical techniques used for data analysis are mentioned
briefly below, while detailed analysis is discussed in Chapter 5.
The reliability of the research instrument was evaluated using Cronbach’s coefficient
alpha (α). Cronbach's alpha is an index of reliability associated with the variation
accounted for by the true score of the "underlying construct". A ‘Construct’ is the
hypothetical variable that is being measured (Hatcher 1994 cited in Santos 1999).
Alpha coefficient ranges in value from 0 to 1 and may be used to describe the
reliability of the factors extracted from dichotomous (that is, questions with two
possible answers) and/or multi-point formatted questionnaires or scales (i.e., rating
scale). The higher the score, the more reliable the generated scale is (Santos 1999).
When data has a multidimensional structure, Cronbach's alpha is usually low. It
generally increases when the correlations between the items increase. For this reason,
the coefficient is also called the internal consistency or the internal consistency
reliability of the test.
Descriptive statistics indicators of mean, standard deviation, and frequency were
used to describe the basic features of the data in the study and to help in

__________________________________________________________________________________ Page 79
Chapter 3: Research Methodology
understanding three major characteristics of a variable in the study i.e. distribution,
central tendency and dispersion. Standard deviation is less affected by the
fluctuations of sampling (Kothari 2005, p.136). These advantages make standard
deviation and its coefficient a very popular measure of the dispersion or
scatteredness of a series. Descriptive statistics was useful in providing simple
summaries about the sample and the measures in graphical, tabular and statistical
format.
t-test was used to test the significance of a sample mean. One-way ANOVA test was
used to test the significance of the difference between the means of two samples.
Pearson correlation was used to test the association between the different variables.
Wilcoxon signed ranks test, a non-parametric alternative to paired sample t-test is
used to compare the difference between measurements of related samples. This test
was popularised by Siegel (1956) in his influential text book on non-parametric
statistics (cited in http://en.wikipedia.org/wiki/Wilcoxon_signed-rank_test). It can be
applied for the case of two related samples or repeated measurements on a single
sample. Like the t-test, the Wilcoxon test involves comparisons of differences
between measurements, so it requires that the data are measured at an interval level
of measurement. However, it does not require assumptions about the normal
distribution of the measurements. It uses z-statistics measure to test the significance
of difference between measurements. This test was used to test the hypotheses where
surveyed organizations are categorized based on their measures for two attributes of
a single factor.
Non-parametric Friedman test is used for two-way repeated measures analysis of
variance by ranks. It is a non-parametric test (distribution-free) used to compare the
observations repeated on the same subjects and is an alternative to the repeated
measures ANOVA, when the assumptions of normality or equality of variance are
not considered. Like many non-parametric tests, it uses the ranks of the data rather
than their raw values to calculate the statistic. This test was used to test the
hypothesis where significance of the ranking of the measure of a factor in the
surveyed organizations was to be tested. The ranking is also tested for significance
through the chi-square test.

__________________________________________________________________________________ Page 80
Chapter 3: Research Methodology
Structural Equation Modeling (SEM) Analysis
Structural model of the causal relationships between quantifiable factors affecting
ICT adoption for building project management was derived from the ‘Hypotheses of
causal relationships’. Correlation between factors can be calculated through Pearson
correlation, but, the correlation test does not allow us to make statements about
cause-and-effect relationship between factors (Stewart and Mohamed 2004). Also,
when there are multiple factors that influence one another and the problem occurs in
a chainlike fashion, it is required to identify the multiple, contextual crucial factors
that are associated with the problem, rather than establishing a singular cause-effect
relationship (Sekaran 2000). Thus, the structural model was tested through SEM
technique, since SEM enables us to concurrently test the hypothesized causal
relationships for the entire model (Meyer and Collier 2001). A systematic, iterative
process was used to determine which paths and factors should be eliminated from the
hypothesized model. Item elimination was based on weak loadings, path significance
and theoretical determination and thus the final model was derived. The model was
tested on AMOS 5.0, software used for formulating, fitting and testing structural
equation models to observed data.
SEM is an extension of the general linear model (GLM) and is a family of statistical
techniques, which incorporates and integrates path analysis and factor analysis
(NCSU 2006). It allows the evaluation of the entire models simultaneously, which
brings a more macro level perspective to the analysis rather than a micro-level one.
Maximum likelihood estimation is one of the techniques used in SEM analysis and
covariance is the basic statistic in SEM, even though other types of data such as
means can also be analyzed (Kline 1998, p.9-126). SEM consists of two components,
a measurement model and a structural model (Meyer and Collier 2001). In the
hypothesized model, the measurement model includes the relationships between the
factors and the questionnaire items (indicators) that operationalize the measurement
of those factors. It assesses how well the observed variables (indicators) reflect the
unobserved or latent variables (factors). A Structural model statistically represents
the hypothesized structure and testifies the causal relations between the latent
variables (factors).

__________________________________________________________________________________ Page 81
Chapter 3: Research Methodology
SEM has been widely applied to analyze relationships among variables in marketing,
customer research and quality issues (Bollen 1989; Bagozzi 1994; Meyer and Collier
2001; Datta 2003). In construction industry related research, Molenaar et al. (2000)
have applied SEM to test a causal relationship model describing and quantifying the
fundamental factors that affect contract disputes between owners and contractors in
the construction industry, Mohamed (2002) has applied SEM to conduct empirical
research aimed at examining the relationship between the safety climate and safe
work behavior in construction site environments, and Mohamed (2003) has also
applied SEM to investigate the relationships between reported risk and success
factors, and the performance of international construction joint ventures formed and
operated by Australian and British contracting organizations. As per the literature
study, however, SEM technique has not been widely applied in the construction
related research.
SEM analysis is discussed in Chapter 6.
Questionnaire Survey Data Analysis Synthesis and Framework for Further
Research
Questionnaire survey data analysis was quantitative data analysis. The significance
of the technical, managerial and perception based factors that affect ICT adoption
was analyzed. SEM analysis tested causal relationships between the quantifiable
factors affecting ICT adoption. There was inter-validation of results between the
different analyses conducted.
Data analysis led to the formulation of a framework for industry level benchmarking
of ICT adoption for the building project management. The framework was finalized
and validated through semi-structured interview survey. The objective of this
framework is to:
• define the method of measurement of the extent of ICT adoption for building
project management by construction organizations. This tool should enable
organizations to measure their ICT adoption and align it with their business
objectives.

__________________________________________________________________________________ Page 82
Chapter 3: Research Methodology
• help in defining levels of ICT adoption or provide the rating as low, medium
or high. These levels are with reference to the Indian construction industry as
the questionnaire survey has identified status of ICT adoption in the Indian
construction industry.
• help in measuring efficiency of organizations in implementing their strategies
for ICT adoption.
• study social and cultural factors affecting ICT adoption for the building
project management.
3.5.3 Semi-Structured Interview Survey (Organization level)
Semi structured Interviews were selected over unstructured interviews, as there was a
framework to be validated and compared with unstructured ones; semi-structured
interviews can focus on what the interviewer expects to acquire. Semi-structured
interviews provide an opportunity to collect a rich set of data as they provide an
opportunity:
• to the interviewees or respondents to hear themselves ‘thinking aloud’ about
the things they may not have previously thought about (Saunders et al. 2000,
p.242-270).
• to the researchers to adapt the questions as necessary, clarify doubts, and
ensure that responses are properly understood by repeating or rephrasing the
questions (Frey and Oishi 1995).
• to the researchers to obtain spontaneous responses to various questions and
issues.
• to the researchers to collect supplementary information about the
respondents’ personal characteristics and environment. This information is
often of great value in interpreting results (Saunders et al. 2000, p.242-270).
Semi structured interviews were conducted in 3 organizations, one organization each
from the respondents of each group of the surveyed organizations. The criterion for
selection of the organizations was their extent of ICT adoption as assessed from their
responses to the questionnaire survey. Organizations with higher ICT adoption were
selected and approached. Respondents were senior level executives. They were

__________________________________________________________________________________ Page 83
Chapter 3: Research Methodology
contacted personally and explained about the objective of the interview. After
receiving consent from them, the interview was conducted at a convenient time.
Semi-structured interviews were conducted with the following objectives:
• Discussion of the benchmarking framework.
• Rating of the organizations as per the suggested framework.
• Measurement of the efficiency of the organizations for implementing their
strategies for ICT adoption. It was conducted through Data Envelopment
Analysis (DEA) technique.
3.5.3.1 Benchmarking Framework Structure Attributes
Benchmarking study at the industry level requires an analysis of the existing
activities and practices in the industry with respect to the mission-critical processes
or the processes under study and requires academic and industrial knowledge.
Processes within the organizations should be measurable for comparison between
different organizations. Benchmarking study should be stakeholder driven, forward
looking and focused on quality (Construct IT report 1998). It should also identify the
appropriate basis for measurement (Bendell et al. 1998).
The key to any successful measurement system is simplicity, both in the nature of the
individual measures and in the means by which it is unified into a coherent, focused
whole (Bendell et al. 1998). A unified approach to measurement can be obtained by
identifying measurable critical success factors with respect to the processes under
study. These are the key indicators directly linked to those processes and should be
between 6-12 (Bendell et al. 1998). To effectively support improvement initiatives,
the measurement system should include a mixture of leading and lagging indicators
(Costa et al. 2006). According to Anderson and McAdam (2004), the use of
benchmarking should be extended beyond the comparison of lagging performance
measures (Costa et al. 2006). Although lagging indicators are important to assess the
achievement of an organization’s strategic objectives, leading performance measures
are also necessary because they are proactive and preventive in nature. Leading
measures help to anticipate the impact on the future desired results (Manoochehri
1999 cited in Costa et al. 2006).

__________________________________________________________________________________ Page 84
Chapter 3: Research Methodology
Developed measurement models should be multidimensional and facilitate alignment
of the performance indicators with an organization’s strategic objectives and should
link the indicators with key managerial processes of the organization (Costa et al.
2006). Thus, measurement needs to be undertaken through a structured methodology
as indicators and measures reflect the goals and objectives of each level of
assessment in the organizations. To avoid relying only on subjective assessment,
measures that extend beyond typical perceptions of performance must be included.
Thus, each indicator should have one or more performance measures that allow
quantitative data to be obtained for a particular process (Stewart and Mohamed
2001). Such composite indicators provide a powerful and reliable summary of the
measured data. Such indicators can also improve the reliability of the data in terms of
random variation associated with each term or measurement as random variation
tends to average to zero when summed across all the terms in the indicator.
In due course of time, the dynamic industry situation may change the gap between
the benchmarked organization and the best practice, may reposition the best practice
organization and may even change the best practice parameters. Thus, the framework
is required to be reviewed periodically in order to make suitable changes as well as
for introducing the new relevant factors and for omitting the factors that are not
relevant, or when periodic recalibration of a benchmarking framework is required.
Eight critical success factors or the performance/measurement indicators were
established after the questionnaire survey data analysis discussed in Chapters 5 and 6
and ongoing literature survey. Each indicator is measured by one or more
performance measures derived from the questionnaire as the questionnaire survey
data analysis provides the validity, relevance and significance of these performance
measures. The measures have their own metrics, data sources and minimum and
maximum limits relevant to the industry standards and established after the
questionnaire data analysis. The measures reflect the ‘Best Practice’ in the Indian
Construction industry. The goal was to develop generic measures that would be
meaningful to both, the participating organizations and the industry as a whole, and
would be repeatable to simplify the process of recalibration.

__________________________________________________________________________________ Page 85
Chapter 3: Research Methodology
The benchmarking framework development and its attributes are discussed in detail
in Chapter 7.
3.5.3.2 Benchmarking Framework Administration
Researchers have identified different models of the benchmarking process derived
from the essential features of the Deming cycle, namely focus, plan, do, and review.
Hamilton and Gibson Jr. (1996) have used the four-phase model of planning,
analysis, integration and action. Fong et al. (1998) have suggested a five-phase
model largely adapted from the model of Vaziri (1992) and Camp (1989b) (Fig. 3.1).
It includes an additional maturity phase. All the phases as explained by Fong et al.
(1998) are described below:
Planning phase includes identifying the processes to be benchmarked, establishing
the variables and measures (metrics) based on the current practices, finalizing the
data collection methodology, collecting the internal and external data, summarizing
and documenting the findings.
Analysis phase assesses an organization’s current state relative to that of the best
practice organizations and results in highlighting major opportunities, threats,
strengths, and weaknesses. It helps to discover the activities that require
improvement and to project future performance levels to be achieved through such
efforts. It requires a complete study of the organization. Since the desirable process
or function used by the best practice organization may not be transferable, it is the
organization’s effort to make sure that the transfer is feasible. After the appropriate
goals and changes are determined, the process of change can begin.
Integration phase includes integrating the analysis findings into the working system
of the organization. Findings must be accepted by both the operational and the
management personnel. The management committed to benchmarking would provide
adequate resources and supports for implementing the benchmarking programs.
Employee commitment from an operational level will facilitate benchmarking since
employees are the ones who carry out the benchmarking practices. Coordinating with
them closely not only helps them in knowing the progress of benchmarking
__________________________________________________________________________________ Page 86
Chapter 3: Research Methodology
implementation but also ensures their continuous support. This phase also includes
the establishment of functional goals, which target the benchmarking practices, and
creating the clear, quantifiable, and attainable obje ctives that support the
achievement of those goals.
Action phase induces the desired changes in the benchmarked organizations and
consists of three steps: developing action plans to reach the functional goals;
implementing specific action plans and monitoring their progress; and recalibrating
benchmarking measures.
Maturity phase includes assessing whether the newly benchmarked practices have
been fully integrated into the organization’s working and whether the organization
has been able to achieve the set objectives and goals, thus, establishing a new
benchmarking cycle.
Love and Smith (2003) have proposed a three-phase system of benchmarking
(organizations evaluating themselves against the best practice organizations in the
industry), bench learning (or ganizations determining how they can learn from the
best practice organizations) and bench action (actual implementation of the planned
changes through development of the skills of staff, training and organizational
development).
There is an overlap between the essential features of the two models discussed above
except for the focus on communication and commitment stressed in the model of
Fong et al. (1998). They have explained that communication of the benchmarking
findings to all the employees will help in gaining support, commitment, and
ownership.
Bench learning or the Analysis phase would allow migration of the benchmarking
initiatives from performance measurement processes to performance management
systems as suggested by Costa et al. (2006). It requires understanding how
performance can be improved and, as per Bendell et al. (1998), it requires qualitative
assessment.
Bench action or the Integration, Action and Maturity phases can generate innovation
in the industry and as per Garvin (1993) it can happen in a receptive environment. It

__________________________________________________________________________________ Page 87
Chapter 3: Research Methodology
requires national industry level initiatives to generate a receptive environment in the
industry (Costa et al. 2006). It could be a transnational as well as an international
initiative.
For the transnational initiative, benchmarking clubs can be initiated. These are
forums for individuals to learn from the best practices within a local support network
(Constructing Excellence 2004 cited in Costa et al. 2006), and for providing learning
opportunities to participating organizations by identifying and sharing their own and
other organizations’ best practices, gaps in the practices and methodology for
improvement. Inclusion of more organizations into the process would lead to
enhanced brainstorming and collection of more useful data. It would also lead to the
Fig. 3.1: Benchmarking Process Model Sourced from (Fong et al. 1998)

__________________________________________________________________________________ Page 88
Chapter 3: Research Methodology
development of a vast network of partners that can be developed with a regional or
even an international outlook (Fong et al. 1998). It is equally important that the
benchmarking teams share what they have learned with the aim of creating an
atmosphere in which knowledge transfer is actively encouraged (Hinton et al. 2000
cited in Costa et al. 2006). Learning cycles are set in motion once people absorb the
transferred knowledge and apply it to their local conditions. Brewer et al. (2003)
have discussed a web-based tool for benchmarking.
For an international initiative following mechanisms have been identified: technical
visits to foreign construction organizations and projects; workshops and seminars
involving organizations from different regions of the world; and the development of
web portals that make information on managerial practices, new technologies, and
performance measures widely available (Costa et al., 2006).
In this research, the suggested Benchmarking process is derived from the above two
discussed frameworks and is divided into four phases of:
• Benchmarking and BenchMeasurement
• BenchLearning
• BenchAction
• BenchMonitoring
These are discussed in detail in Chapter 7.
3.5.3.3 Data Envelopment Analysis (DEA) Technique
DEA is a data-oriented (Li et al. 2005), non-parametric methodology based upon
Input-Output system (Chiang et al. 2006) and utilizes the application of linear
programming. It is a tool for multi-criteria-decision-making and was originally
developed for performance measurement (Ramanathan 2003, p.109). It is used for
measuring the performance efficiency of organizational units, which are termed as
Decision-Making Units (DMUs). It aims to measure how efficiently a DMU uses the
resources available to generate a set of outputs (Charnes et al. 1978 cited in
Ramanathan 2003, p.25). DMUs can include manufacturing units, departments of big
organizations, a set of organizations or even practicing individuals. A DMU has
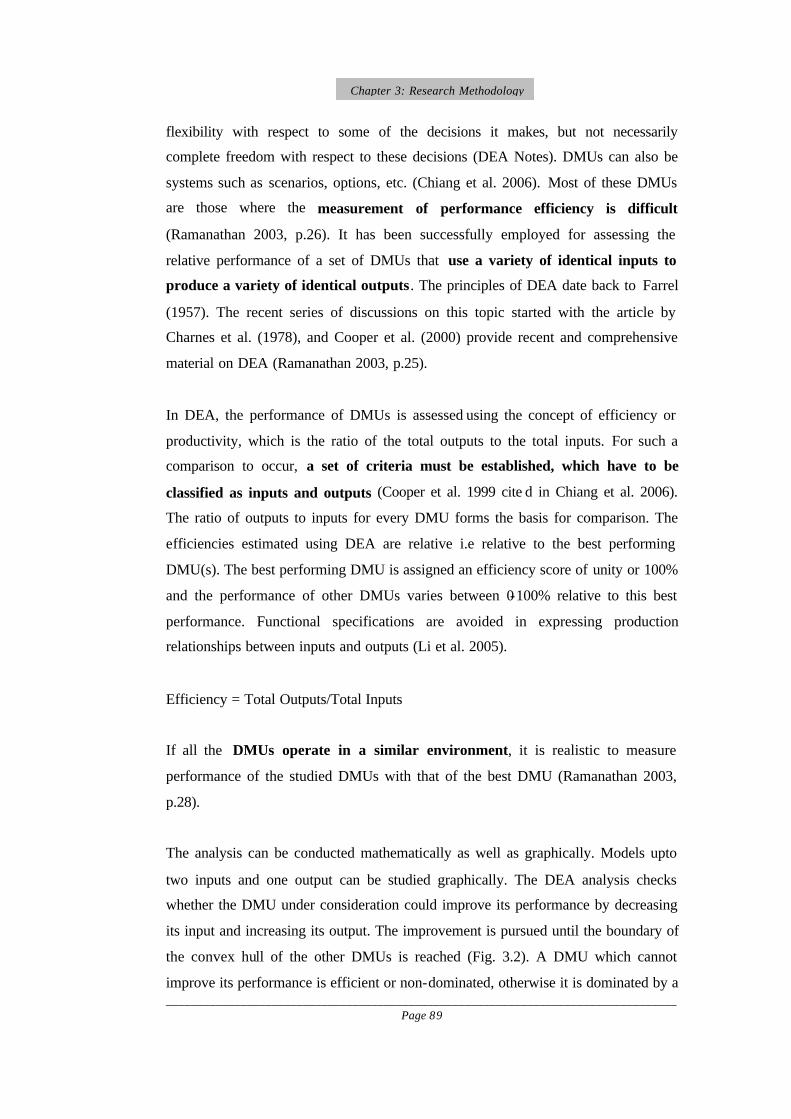
__________________________________________________________________________________ Page 89
Chapter 3: Research Methodology
flexibility with respect to some of the decisions it makes, but not necessarily
complete freedom with respect to these decisions (DEA Notes). DMUs can also be
systems such as scenarios, options, etc. (Chiang et al. 2006). Most of these DMUs
are those where the measurement of performance efficiency is difficult
(Ramanathan 2003, p.26). It has been successfully employed for assessing the
relative performance of a set of DMUs that use a variety of identical inputs to
produce a variety of identical outputs. The principles of DEA date back to Farrel
(1957). The recent series of discussions on this topic started with the article by
Charnes et al. (1978), and Cooper et al. (2000) provide recent and comprehensive
material on DEA (Ramanathan 2003, p.25).
In DEA, the performance of DMUs is assessed using the concept of efficiency or
productivity, which is the ratio of the total outputs to the total inputs. For such a
comparison to occur, a set of criteria must be established, which have to be
classified as inputs and outputs (Cooper et al. 1999 cite d in Chiang et al. 2006).
The ratio of outputs to inputs for every DMU forms the basis for comparison. The
efficiencies estimated using DEA are relative i.e relative to the best performing
DMU(s). The best performing DMU is assigned an efficiency score of unity or 100%
and the performance of other DMUs varies between 0-100% relative to this best
performance. Functional specifications are avoided in expressing production
relationships between inputs and outputs (Li et al. 2005).
Efficiency = Total Outputs/Total Inputs
If all the DMUs operate in a similar environment, it is realistic to measure
performance of the studied DMUs with that of the best DMU (Ramanathan 2003,
p.28).
The analysis can be conducted mathematically as well as graphically. Models upto
two inputs and one output can be studied graphically. The DEA analysis checks
whether the DMU under consideration could improve its performance by decreasing
its input and increasing its output. The improvement is pursued until the boundary of
the convex hull of the other DMUs is reached (Fig. 3.2). A DMU which cannot
improve its performance is efficient or non-dominated, otherwise it is dominated by a

__________________________________________________________________________________ Page 90
Chapter 3: Research Methodology
convex combination of other DMUs. The graph of an input function and an output
function is generated. The line joining the best performing DMUs and horizontal and
vertical lines connecting them to the two axes become the ‘Efficiency Frontier’. It
represents a standard of performance that the organizations not on the frontier should
try to achieve as it forms the basis of efficiency measurement (Ramanathan 2003,
p.31). Mathematically the efficient frontier is the convex hull of the data (DEA
Notes). Such an analysis using the efficiency frontier is often termed as ‘Frontier
Analysis’ (Farrel 1957 cited in Ramanathan 2003, p.32). The efficiency frontier
envelops the available data. Hence, the term ‘Data Envelopment Analysis’, which
was coined by Charnes et al. (1978) (cited in Ramanathan 2003, p.32). As shown in
Fig. 3.2, in an example of comparing organizations A,B,C and D with two inputs of
number of employees and amount of capital employed and one output of added
value, two organizations A and C are found to be the most efficient and lie on the
efficiency frontier.
The analysis does not reflect that the performance of the best performing DMU(s)
cannot be improved. It may or may not be possible. These are the best DMU(s) with
regard to the data used for analysis (Ramanathan 2003, p.32). The performance of
all the other DMUs is assessed in relation to this best achieved performance.
Thus, relative efficiencies are calculated based on the data available and not as
absolute efficiencies.
Fig. 3.2: Graph Explaining the Concept of Efficiency Frontier Sourced from (Ramanathan 2003)

__________________________________________________________________________________ Page 91
Chapter 3: Research Methodology
A general mathematical formulation is needed to handle the case of multiple inputs
and multiple outputs. This mathematica l formulation was provided by Charnes et al.
(1978) in a seminal paper providing the fundamentals of the mathematical aspects of
the frontier analysis (Ramanathan 2003, p.38). When comparing all the DMUs, the
mathematical model changes to an optimization problem by setting a mathematical
model that maximizes the relative efficiency of all the DMUs subject to the original
constraints. The relative efficiencies of all DMUs are computed, which indicate their
impact levels. In some studies the DEA is also used to find a virtual DMU as the
most efficient DMU (DEA Homepage 1996 )
The DEA has been developed and modified to include the aspects of realistic
characteristics of DMUs and their inputs and outputs.
• Realistically each DMU has multiple inputs and outputs, so it is essential to
calculate a composite efficiency value. This can be achieved by assigning
some degree of relative importance to every input and output (or so-called
weight) (Chiang et al. 2006). Thus, weights can be assigned to inputs and
outputs . The weights assigned should be flexible and reflect the requirement
(performance) of the individual DMUs. If required, a unique set of weights
can also be assigned to each DMU (Ramanathan 2003, p.39).
• The DEA analysis can be conducted as ‘Output Maximization’ program as
well as ‘Input Minimization’ program. In the former, the objective function is
to maximize the weighted sum of outputs by setting the weighted sum of
inputs to unity and in the latter, the objective function is to minimize the
weighted sum of inputs by setting the weighted sum of outputs to unity
(Ramanathan 2003, p.43).
• Initially the DEA model was based on the ‘Constant Returns to Scale’ (CRS).
It signified that inputs and outputs could be scaled linearly without increasing
or decreasing the efficiency. This was considered a limitation of the DEA and
limited its applicability in early years. The CRS model is also known as CCR
(Charnes, Cooper and Rhodes) model (Ramanathan 2003, p.42-45).
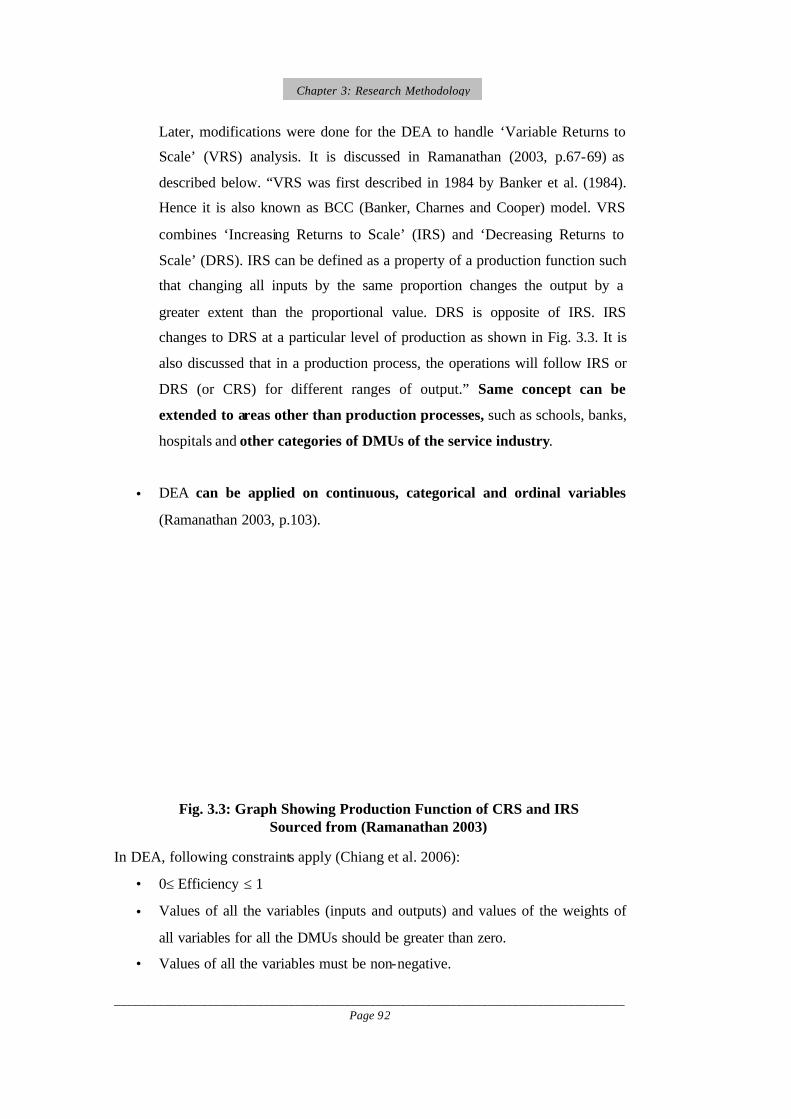
__________________________________________________________________________________ Page 92
Chapter 3: Research Methodology
Later, modifications were done for the DEA to handle ‘Variable Returns to
Scale’ (VRS) analysis. It is discussed in Ramanathan (2003, p.67-69) as
described below. “VRS was first described in 1984 by Banker et al. (1984).
Hence it is also known as BCC (Banker, Charnes and Cooper) model. VRS
combines ‘Increasing Returns to Scale’ (IRS) and ‘Decreasing Returns to
Scale’ (DRS). IRS can be defined as a property of a production function such
that changing all inputs by the same proportion changes the output by a
greater extent than the proportional value. DRS is opposite of IRS. IRS
changes to DRS at a particular level of production as shown in Fig. 3.3. It is
also discussed that in a production process, the operations will follow IRS or
DRS (or CRS) for different ranges of output.” Same concept can be
extended to areas other than production processes, such as schools, banks,
hospitals and other categories of DMUs of the service industry.
• DEA can be applied on continuous, categorical and ordinal variables
(Ramanathan 2003, p.103).
In DEA, following constraints apply (Chiang et al. 2006):
• 0≤ Efficiency ≤ 1
• Values of all the variables (inputs and outputs) and values of the weights of
all variables for all the DMUs should be greater than zero.
• Values of all the variables must be non-negative.
Fig. 3.3: Graph Showing Production Function of CRS and IRS Sourced from (Ramanathan 2003)

__________________________________________________________________________________ Page 93
Chapter 3: Research Methodology
Since DEA using linear programming techniques determines a best-practice or
efficient frontier of DMUs without a priori assumptions on the underlying functional
forms, DEA has been applied to various areas of efficiency evaluation (Zhu 2002;
Chen 2003; Yun et al. 2004 cited in Li et al. 2005). DEA has been applied in many
situations such as: health care (hospitals, doctors), education (schools, universities),
banks, manufacturing, benchmarking , management evaluation, fast food
restaurants, retail stores (DEA Homepage 1996), defense bases (army, navy, air
force), tax offices, prisons, non-profit making organizations, etc. (DEA Notes).
A few of the characteristics that make DEA powerful are (DEA Homepage 1996):
• DEA can handle multiple input and multiple output models.
• It does not require an assumption of a functional form relating inputs to
outputs.
• DMUs are directly compared against a peer or a combination of peers.
• Inputs and outputs can have very different units. For example, X1 could be in
units of lives saved and X2 could be in units of dollars without requiring an a
priori tradeoff between the two.
• The analyzed data sets may vary in size. Some analysts work on problems
with as few as 15 or 20 DMUs while others are tackling problems with over
10,000 DMUs.
It has been discussed that exploring the role of the construction sector in terms of the
consumptions and inputs may help formulate strategies to maximize construction
productivity (Ganesan et al. 1996; Chiang et al. 2001 cited in Chiang et al. 2006).
With respect to the construction research: Cheng and Li (2004) have applied DEA to
evaluate a set of locations for construction projects (Chiang et al. 2006); Li et al.
(2005) have applied DEA in a longitudinal study of measurement of the productivity
of Chinese construction industry; Anderson et al. (1998) have applied DEA to
measure efficiency of franchising in the residential real estate brokerage market;
Chiang et al. (2006) have examined repercussions of consumptions and inputs placed
on the construction sector by the use of Input–Output tables and DEA; Lacouture et
al. (2007) have discussed a DEA based tool for optimizing purchasing decisions in

__________________________________________________________________________________ Page 94
Chapter 3: Research Methodology
B2B construction marketplaces. But, as per the literature study, DEA has not been
applied widely in the construction relate d research.
In this research study, DEA has been conducted using ‘Frontier Analyst’ software
developed by University of Warwick and Banxia Software Ltd. UK. It helped in
measurement of the efficiency of organizations in implementing their strategies for
the adoption of ICT.
The semi-structured interview data analysis resulted in benchmarking or
measurement of ICT adoption by the studied organizations for building project
management, efficiency measurement and benchmarking framework finalization.
The analysis results are discussed in Chapter 7 and the final benchmarking
framework is presented in Appendix D.
3.5.4 Case Studies (Organization level and Project level)
Case study method is a form of qualitative analysis wherein careful and complete
observation of an individual or a situation or an institution is done, efforts are made
to study each and every aspect of the concerning unit in minute details and then from
the case data, generalizations and inferences are drawn (Kothari 2005, p.113-116). It
investigates a contemporary phenomenon within its real-life context, especially when
the boundaries between the phenomenon and the context are not clearly evident
(Majumdar and Gupta 2001). It is the most common qualitative method used in the
information systems and is particularly well suited to Information Systems research,
since the object of this discipline is to study the information systems in
organizations, and the "interest has shifted to organizational issues rather than
technical issues" (Benbasat et al. 1987 cited in Majumdar and Gupta 2001). Case
studies look deceptively simple, but require thorough familiarity with the existing
theoretical knowledge of the field of inquiry by the researcher and also the skill to
differentiate significant variables from insignificant ones (Duggal et al. 2001). An
unbiased approach is mandatory.
The purpose of the case studies is, “to tell a big story through the lens of a small
case” (Tan 2004). These are conducted to focus more on the typicalness of the

__________________________________________________________________________________ Page 95
Chapter 3: Research Methodology
situation in each organization as focus on the typicalness leads to meaningful
generalizations and scientific abstraction whereas uniqueness would preclude these
(Majumdar and Gupta, 2001). The case study method is suited to the situations where
the researcher is attempting to answer a “how” question (Yin 1989). It is also suited
to the situations where the phenomena and the context in which they exist are
difficult to separate.
Case study approach was selected to identify the social, cultural and behavioral
issues affecting ICT adoption through the study of gaps in practice and trends
identified in Benchmarking framework analysis. It also led to the validation of the
cultural issues identified in the questionnaire survey data analysis. Case studies were
conducted through discussions with the senior executives and project managers and
the powerful SAP-LAP (Situation Actor Process – Learning Action Performance)
framework was used for analysis.
3.5.4.1 SAP-LAP Analysis Technique
SAP-LAP analysis methodology consists of two phases and provides a framework
that can be effectively applied to develop either generic or specific models of inquiry
(Sushil 2000). In SAP analysis, the system or the management context is studied
through three basic components i.e. situation, actor, and process as discussed below.
Context: Context defines the background and the environmental norms that impinge
upon the reality. The components operate it (Duggal et al. 2001).
Situation: The present status, potential for growth or decay, accelerating and
decelerating forces, present and future state of the art, etc. taken together define the
situation (Duggal et al. 2001). It primarily comprises the micro and macro
environments of the organization with respect to the problem of study. For the
discussed case studies, head offices and project site offices individually constitute the
microenvironments for the adoption of ICT and collectively these constitute the
macro environment that significantly affects the processes of ICT adoption for
building project management. The situation is affected by the external factors but has
no control on those external factors.

__________________________________________________________________________________ Page 96
Chapter 3: Research Methodology
Actors: The participants who influence the situation and alter it by their actions or
inaction are termed as actors (Duggal et al. 2001). An actor can be an individual, a
group, a department, or the whole organization. Actors can be internal or external.
Internal actors are the decision makers as well as day-to-day operations staff within
the organization. They control the internal processes and actions with their
knowledge, understanding and assumptions about the future (Majumdar and Gupta
2001). External Actors are the driving external agencies. Thus SAP-LAP analysis
incorporates multiple perspectives of various participating actors in the managerial
process offering learning and interpretive framework of inquiry. For the discussed
case studies, external actors are the clients, principal contractors and other such
external agencies, which are perceived to affect the adoption of ICT on building
projects managed by these organizations. Actors have the freedom of choice to some
extent.
Processes: These are the procedural steps taken by the actors with respect to the
problem of study. Any dynamic behavior that alters the situation has the potential of
being a process. Some processes are explicitly identifiable while some others will be
implicit (Majumdar and Gupta 2001). Processes are affected by cultural and human
factors.
Thus, within a system or a management context, a situation is to be dealt with by an
actor or a set of actors via a process or a set of processes (Sushil 2000). Any of the
three basic components can be the driving component. Depending upon the context,
the researcher has to study the situation, identify the relevant actors, study the
processes executed by them and identify the driving component. The three
components interact flexibly on multiple planes in the ambiguous reality and help us
in understanding the reality (Majumdar and Gupta 2001). Interplay could be due to
various reasons, for example, processes executed by a group of actors can be a
situation for the other group of actors. The freedom of choice provided by the
situation to the actors is termed as ‘external flexibility’, which varies between
different organizations. Based on the external flexibility, actors can resonate their
internal flexibility and create a rigid or a flexible process. A flexible process and
flexible actors can quickly respond and adapt to the changing situation (Ramaraj
1996).

__________________________________________________________________________________ Page 97
Chapter 3: Research Methodology
Study of the interplay of situation, actor, and process (SAP) leads to learning, action,
and performance (LAP) (Fig. 3.4) (Sushil 2000). Learning gained about the situation,
the actor and the processes would identify the possible actions to be taken by the
actors with respect to the impending situation, actors and processes and the expected
performance results of the system. The learning issues emphasize the typicality of the
situation as well as some features of its uniqueness (Duggal et al. 2001). The actions
would be influenced by the driving component.
The SAP-LAP paradigm synthesizes analytic as well as synthetic modes of the
system inquiry (Sushil 2000). As shown in Fig. 3.5, study of the context leads to the
analytical mode where the system is divided into three components and each
component, i.e. situation, actor and process is studied separately. It is synthesized in
Learning as the study of interplay between SAP and identification of the driving
component. Learning further synthesizes actions and the associated performances
with SAP.
Actions are expected to improve the performance by changing the system. Thus,
learning has to identify the areas having potential for change. Actions are to be
devised both for preparing for a cultural change and for initiating the structural
cha nge, so that ultimately the system remains ahead of the change rather than
becoming a follower of the change (Sushil 2000). With respect to the performance,
learning has to identify the performance indicators that will be changed and the
expected improveme nt or the setback faced as an effect of the new actions.
SAP-LAP analysis could be an ongoing enquiry within an organization, where actors
consistently evaluate situation, follow processes, take actions, learn from their
performances and depending on the results of performances either modify the
processes or follow the same processes (Majumdar and Gupta 2001). Such a dynamic
interplay of SAP and LAP will act as the basis of ongoing managerial inquiry. In
context of this research, this forms a component of the ‘BenchMonitoring’ stage of
improvement.

__________________________________________________________________________________ Page 98
Chapter 3: Research Methodology
SAP-LAP analysis methodology has been used extensively by researchers for the
case studies of different sectors. Majumdar and Gupta (2001) have used SAP-LAP
analysis to study initiatives of Indian car manufactures in deploying Internet and
Fig. 3.4: SAP-LAP Paradigm Sourced from (Sushil 2000)
Context
Learning
Action Performance
Synthetic
Mode
Situation Actor Processes Analytic
Mode
Fig. 3.5: SAP-LAP Paradigm Synthesizes Analytic as well as Synthetic Mode of Inquiry

__________________________________________________________________________________ Page 99
Chapter 3: Research Methodology
eBusiness technology, Duggal et al. (2001) have studied impact of the management
of IT on the issuance of driving license by a government agency. But, literature
review does not indicate the use of the methodology for the construction industry
research.
SAP-LAP analysis provides one of the most useful methodologies of analysis and
synthesis for the organizations, which are in the process of adaptation of a new and
complex technology (Majumdar and Gupta 2001). Also, SAP-LAP analysis is
systematic, innovative and has a holistic approach. Thus, in this research this
methodology is adopted for conducting the case studies for studying factors affecting
use of ICT for the building project management.
Case studies were conducted in three organizations in which semi-structured
interview survey was conducted. This helped in having continuity in the research
process. Discussions with the senior executives identified issues at the organization
level and discussions with project managers identified issues at the project level. The
analysis led to the formulation of social and cultural framework affecting ICT
adoption for the building project management.
Case study analysis is discussed in Chapter 7.
3.6 Data Analysis Results Synthesis Methodology and Framework for
Results Formulation
Summarization of the results includes statistical induction or statistical inference i.e.
drawing inferences for the population or the universe from the sample and gauging
the precision of the estimate (Kothari 2005). It was achieved by making quantitative
research qualitative, by converting it to cognitive research i.e. by adding knowledge
to it.
The framework for results formulation was defined by understanding Everett
Rogers’s ‘Diffusions of innovations theory’ and applying it to the research issue of
adoption of ‘ICT for building project management’.

__________________________________________________________________________________ Page 100
Chapter 3: Research Methodology
Rogers (1962) defines the diffusion process as a group process as it occurs within the
society; whereas, the adoption process pertains to an individual. He defines the
adoption process as the mental process through which an individual passes from first
hearing about an innovation to final adoption. In the context of this research,
adoption of ICT is at the level of organization and people, which further defines
diffusion of ICT at the industry level. It follows Rogers’s five stage model for
diffusion of an innovation (Fig. 3.6): ‘Knowledge’ i.e learning about the existence
and function of the innovation leading to ‘Persuasion’ or becoming convinced of the
value of the innovation. This helps in the ‘Decision’ of committing to the adoption of
the innovation and its ‘Implementation’. This leads to ‘Confirmation’ of its ultimate
acceptance or rejection.
This model leads to the formulation of components of ‘IT enhanced communication
protocols’ or the research parameters as initiatives for:
• Increasing ‘knowledge’ or awareness of SMEs and project managers
regarding IT tools and technologies for communication. Increasing
knowledge at the industry level for factors increasing ICT adoption at the
industry level.
• ‘Persuading’ or convincing people and organizations about benefits of ICT
over traditional methods of communication in the present scenario and
perceived increase in the value of the organizations after its adoption.
• Helping organizations take the ‘decision’ of adopting ICT and planning
required changes in the organization and ways of working.
• Helping organizations in the strategic ‘implementation’ of ICT adoption.
• Periodic evaluations of the systems for ‘confirmation’ of acceptance of ICT
adoption, upgradation of systems if required and dealing with the problems
or issues which are required to be considered.
Fig. 3.6: Rogers’s Five -Stage Model for Diffusion of Innovation
Sourced from http://eetd.lbl.gov/EA/Reports/40512/40512-3

__________________________________________________________________________________ Page 101
Chapter 3: Research Methodology
Rogers (1995) also defined six perceived features (STORCS) that determine
acceptance of a technology. These features would be a part of the above components.
The features are:
S - Simplicity vs. complexity of the innovation.
T - Trialability i.e. is there a chance to test the technology with the ability to reverse
the adoption?
O - Observability i.e. is there a chance to see how the innovation works for others
and observe the consequences?
R - Relative advantage i.e. is this innovation truly better than what it is replacing?
C - Compatibility i.e. does this innovation fit with values, beliefs and current needs?
S - Support.
Research analysis would lead to the defining of these features with respect to the
research problem.
3.6.1 Categorization of Organizations and People Based on ICT Adoption
As per Rogers’s ‘Diffusions of Innovations theory’, adopters of any new innovation,
technology or idea could be categorized as innovators (2.5%), early adopters
(13.5%), early majority (34%), late majority (34%) and laggards (16%). This
distribution has been shown in the form of a bell curve (Fig. 3.7). Each adopter's
willingness and ability to adopt an innovation would depend on his awareness,
interest, evaluation, trial, and adoption. This was derived from Rogers’s theory that
innovations would spread through a society in an S curve, as the early adopters select
the technology first, followed by the majority, until a technology or innovation is
common.

__________________________________________________________________________________ Page 102
Chapter 3: Research Methodology
Geofrey Moore (1991) has further modified this technology adoption curve (Fig. 3.8)
and discussed it in his book “Crossing the Chasm”. Grouping early majority and late
majority as pragmatists (P), Moore discusses that the most important time gap in
technology adoption is the time gap between technology adoption by early adopters
(EA) and by early majority pragmatists as many a time adoption of a technology
slows down after the early adopters stage. He has termed this time gap as ‘Chasm’
(C). As per his theory, Early adopters and Early majority are different not just
quantitatively but also qualitatively.
Application of the ‘Diffusions of Innovations theory’ to the research problem helped
in categorization of the organizations in the above discussed five groups and
Fig. 3.8: Geofrey Moore’s Modified Technology Adoption Curve Sourced from http://ist-socrates.berkeley.edu
Fig. 3.7: Rogers’s Technology Adoption Curve Sourced from www.valuebasedmanagement.net

__________________________________________________________________________________ Page 103
Chapter 3: Research Methodology
understanding the type of change required in these organizations for ICT adoption
(Table 3.2), which is derived from the categorization of changes in organizations as
discussed by Weippert and Kajewski (2004): “Anticipatory change i.e. when change
leaders look ahead and predict change in advance – typically most difficult to
implement yet most cost effective; Reactive change i.e. when change leaders react to
the obvious signs and signals that change is needed; and Crisis change i.e. when
signs and signals to change have multiplied and intensified to the point where the
change leaders no longer can deny them – generally the easiest to implement but at a
higher cost (Fig. 3.9)”.
The Construction industry is characterized by collaborative working and in such a
scenario, benefits are achieved through widespread adoption of the technologies. As
more organizations adopt them, the greater the potential benefits (Root and Thorpe
2001).
Research analysis has to develop a framework for industry-wide initiative for:
• Categorizing building project management organizations into early
adopters, early majority, late majority and technically averse categories with
respect to ICT adoption and providing guidelines for Industry-wide shift
from ‘late majority to early majority’ and ‘technically averse to late
majority’ categories.
• Educating organizations to go for anticipatory or reactive change and not
the ‘crisis’ change.
• Understanding the factors affecting the ‘Chasm’ period and the issues for
minimizing it as much as possible.
Fig. 3.9: Relation between Difficulties of Changing Versus Cost of Change Adapted from (Black J.S and Gregersen, H.B. 2002) in
(Weippert and Kajewski 2004)

__________________________________________________________________________________ Page 104
Chapter 3: Research Methodology
Table 3.2: Categorization of Organizations With Respect to Adoption of ICT and
the Type of Change Required in the Process Category Adoption attributes Change Required Innovators The enthusiasts which like technology for its own sake and pull the change
Early Adopters Individual visionary organizations which adopt an emerging technology with caution to gain a strategic advantage over their competitors
Attain the status of being industry leaders, but do not have the advantage of following established technologies.
Anticipatory Assess the new technology and adopt it. Organizations are partly ready before adoption of technology and partly get changed in the process of using the technology.
Early Majority Organizations that do not take risks of pioneering but are ready to see the advantages of tested technologies. They are the beginning of a mass market.
Follow the guidelines laid down by early adopters.
Reactive Assess use of technology on early projects. Prepare their organizations for its use and then adopt it.
Late Majority Organizations are skeptical, traditional and belong to lower socio-economic status. They dislike discontinuous innovations and believe in tradition rather than progress. They use high-technology reluctantly and will use it only when majority are using it.
Have the advantage of following established or de facto standards that have emerged by use of technology in early projects.
Reactive Assess use of technology on large number of projects. Prepare their organizations for its use and then adopt it.
Laggards/ Traditional/ Technically averse Organizations residing in the traditional areas of the industry and operating in markets where new practices are likely to be unwelcome, or where the sizes of the projects do not make high technology investment viable. They use a technology only when it has become mainstream or a tradition.
Follow the standards or guidelines most prevalent in the industry
Crisis Wait till majority of the projects would be using the technology and it becomes urgent to adopt it.
Line (1997) has applied similar theory for categorizing organizational staff with
respect to the use of new technology:
The early adapters and creative users: They are "self propelled", understand the
concepts and learn the tools on their own. They are an important resource both in the
initial phase of technology implementation and in the continuing development of the
technology. They need to be encouraged and credited for giving support. On the
other hand it is equally important that they understand that the other type of users do
__________________________________________________________________________________ Page 105
Chapter 3: Research Methodology
not need or want advanced options and that they do not use advanced techniques that
cause trouble.
The normal users: They understand when being told and after having some
exercise. They use the services straightforwardly but without curiosity, and they do
not "research" the new possibilities.
The late adapters: They need attention. Resistance may be caused by fear of not
being able to adapt (and thereby expose them by doing silly things), fear of their own
work position or maybe they do not agree that the company should use resources on
this new technology.
Research analysis has to develop an organizational level framework for increasing
effective adoption of ICT by:
• categorizing their staff or the people under the above discussed three groups
• understanding their specific requirements, and
• bringing maximum staff to the ‘early adapters and normal users’ category.
As per Rogers’s diffusion theory, the speed of technology adoption is determined by
two characteristics: p, which is the speed at which adoption takes off, and q , the
speed at which later growth occurs. A cost intensive technology like ICT could have
lesser p value, but once a threshhold level of organizations adopts it, the q value
would be more since this technology has a network effect, i.e. in a multi-enterprise
work like building pr ojects, adoption of ICT would lead to its adoption by other
organizations.
Research analysis would define factors that affect p and q value as these would be
the factors that would also help in minimising the ‘Chasm’ period.
3.7 Justification of the Methodology
Attempts were made to leverage opportunities available to make research practical
by blending quantitative and qualitative research. Quantitative data helped in
understanding the relationship among key research variables after empirical testing.

__________________________________________________________________________________ Page 106
Chapter 3: Research Methodology
Qualitative research was chosen to provide rich firsthand knowledge of the
implementation issues by substantiating the experience of the executives and is
expected to allow us to project present action with future results. Qualitative study
has also been used as a supplementary study to support the quantitative study by
filling up gaps of this study. Thus the methodology is rich in experiences and it is
complementary, considering that it has a Questionnaire Survey, a Semi-structured
interview survey, and Case studies. The methodology is supposed to provide
valuable practical insights and action ideas that can be used at all levels of industry,
organization and people in evolving and implementing strategies for enhancing
effective ICT adoption by SMEs for the building project management. The research
framework in detail is shown in Fig. 3.10. The synthesis of quantitative and
qualitative research studies was done by taking into consideration the differences and
the similarities of the conclusions of both the studies. This has helped in proposing
the validated conceptual framework for implementation.
3.8 Summary
This chapter discussed the plans and processes by which the research objectives are
achieved. It examines in detail the issues pertaining to the research design and
methodology, data collection and analysis approach, key research activities and
validation methods. Research hypotheses are formulated. Following the research
methodology, a framework for synthesis of data analysis components and results
formulation is discussed. Research methodology approach is based on the study of
issues at the levels of industry, organization and project or people. Data analysis
utilizes the ‘Principle of Triangulation’, where multiple techniques have been used
for data analysis to have a comprehensive view of the results. The implementation of
the research methodology and subsequent findings are discussed in later chapters.
Chapter 4 discusses interpretive analysis of perceived benefits conducted through
Interpretive Structural Modeling analysis.
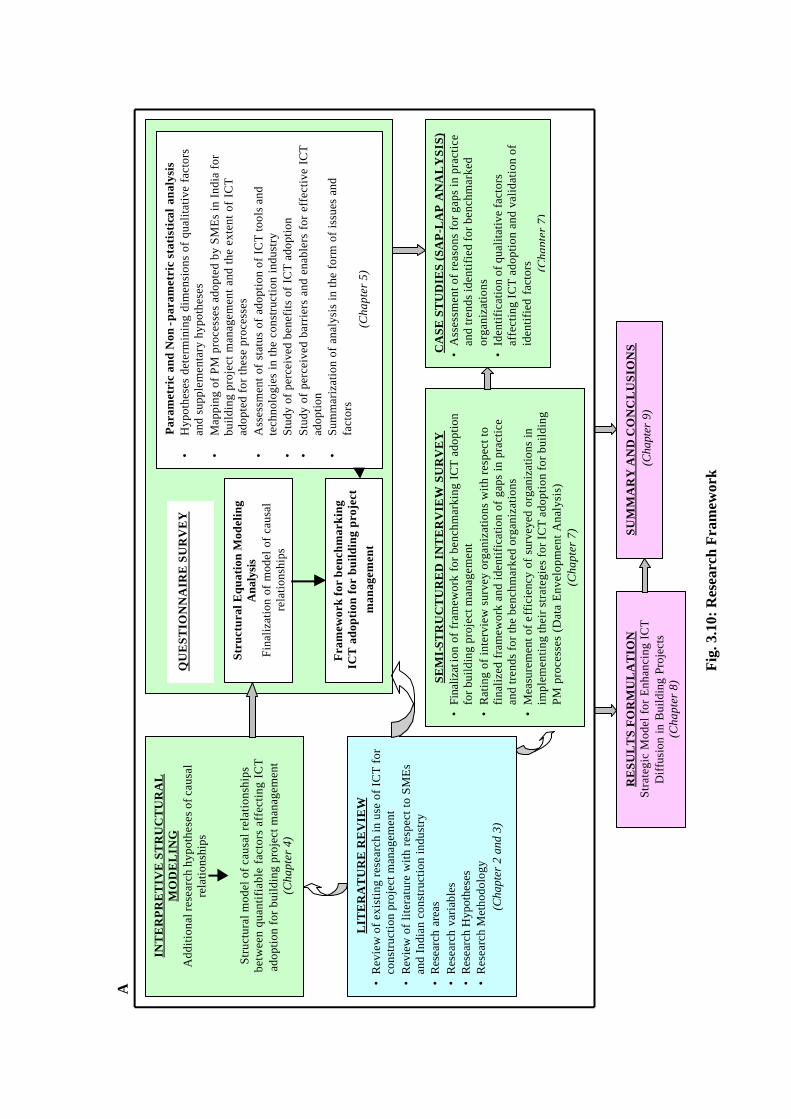
A
Fig
. 3.1
0: R
esea
rch
Fra
mew
ork
RE
SU
LT
S F
OR
MU
LA
TIO
N
Str
ateg
ic M
odel
for
Enh
anci
ng I
CT
D
iffu
sion
in
Bui
ldin
g P
roje
cts
(Cha
pter
8)
SU
MM
AR
Y A
ND
CO
NC
LU
SIO
NS
(
Cha
pter
9)
LIT
ER
AT
UR
E R
EV
IEW
•
Rev
iew
of
exis
ting
res
earc
h in
use
of
ICT
for
co
nstr
ucti
on p
roje
ct m
anag
emen
t •
Rev
iew
of
lite
ratu
re w
ith
resp
ect
to S
ME
s an
d In
dian
con
stru
ctio
n in
dust
ry
• R
esea
rch
area
s •
Res
earc
h va
riab
les
• R
esea
rch
Hyp
othe
ses
•
Res
earc
h M
etho
dolo
gy
(Cha
pter
2 a
nd 3
)
SE
MI-
STR
UC
TU
RE
D I
NT
ER
VIE
W S
UR
VE
Y
• Fi
naliz
atio
n of
fra
mew
ork
for
benc
hmar
king
IC
T a
dopt
ion
for
buil
ding
pro
ject
man
agem
ent
• R
atin
g of
int
ervi
ew s
urve
y or
gani
zati
ons
wit
h re
spec
t to
fi
nali
zed
fram
ewor
k an
d id
enti
fica
tion
of
gaps
in
prac
tice
an
d tr
ends
for
the
benc
hmar
ked
orga
niza
tion
s •
Mea
sure
men
t of
effi
cien
cy o
f su
rvey
ed o
rgan
izat
ions
in
impl
emen
ting
thei
r st
rate
gies
for
IC
T a
dopt
ion
for
buil
ding
P
M p
roce
sses
(D
ata
Env
elop
men
t A
naly
sis)
(C
hapt
er 7
)
CA
SE S
TU
DIE
S (S
AP
-LA
P A
NA
LY
SIS
) •
Ass
essm
ent
of r
easo
ns f
or g
aps
in p
ract
ice
and
tren
ds id
enti
fied
for
ben
chm
arke
d or
gani
zati
ons
• Id
enti
fica
tion
of
qual
itat
ive
fact
ors
affe
ctin
g IC
T a
dopt
ion
and
vali
dati
on o
f id
enti
fied
fac
tors
(C
hapt
er 7
)
INT
ER
PR
ET
IVE
ST
RU
CT
UR
AL
M
OD
EL
ING
A
ddit
iona
l res
earc
h hy
poth
eses
of
caus
al
rela
tion
ship
s
Str
uctu
ral m
odel
of
caus
al r
elat
ions
hips
be
twee
n qu
anti
fiab
le f
acto
rs a
ffec
ting
IC
T
adop
tion
for
bui
ldin
g pr
ojec
t m
anag
emen
t (C
hapt
er 4
)
P
aram
etri
c an
d N
on-p
aram
etri
c st
atis
tica
l an
alys
is
• H
ypot
hese
s de
term
inin
g di
men
sion
s of
qua
lita
tive
fac
tors
an
d su
pple
men
tary
hyp
othe
ses
•
Map
ping
of
PM
pro
cess
es a
dopt
ed b
y S
ME
s in
Ind
ia f
or
buil
ding
pro
ject
man
agem
ent
and
the
exte
nt o
f IC
T
adop
ted
for
thes
e pr
oces
ses
•
Ass
essm
ent
of s
tatu
s of
ado
ptio
n of
IC
T to
ols
and
tech
nolo
gies
in
the
cons
truc
tion
ind
ustr
y
• S
tudy
of
perc
eive
d be
nefi
ts o
f IC
T a
dopt
ion
•
Stu
dy o
f pe
rcei
ved
barr
iers
and
ena
bler
s fo
r ef
fect
ive
ICT
ad
opti
on
• S
umm
ariz
atio
n of
ana
lysi
s in
the
for
m o
f is
sues
and
fa
ctor
s
(Cha
pter
5)
Stru
ctur
al E
quat
ion
Mod
elin
g A
naly
sis
Fin
aliz
atio
n of
mod
el o
f ca
usal
re
lati
onsh
ips
(Cha
pter
6)
Fra
mew
ork
for
benc
hmar
king
IC
T a
dopt
ion
for
buil
ding
pro
ject
m
anag
emen
t
QU
ES
TIO
NN
AIR
E S
UR
VE
Y

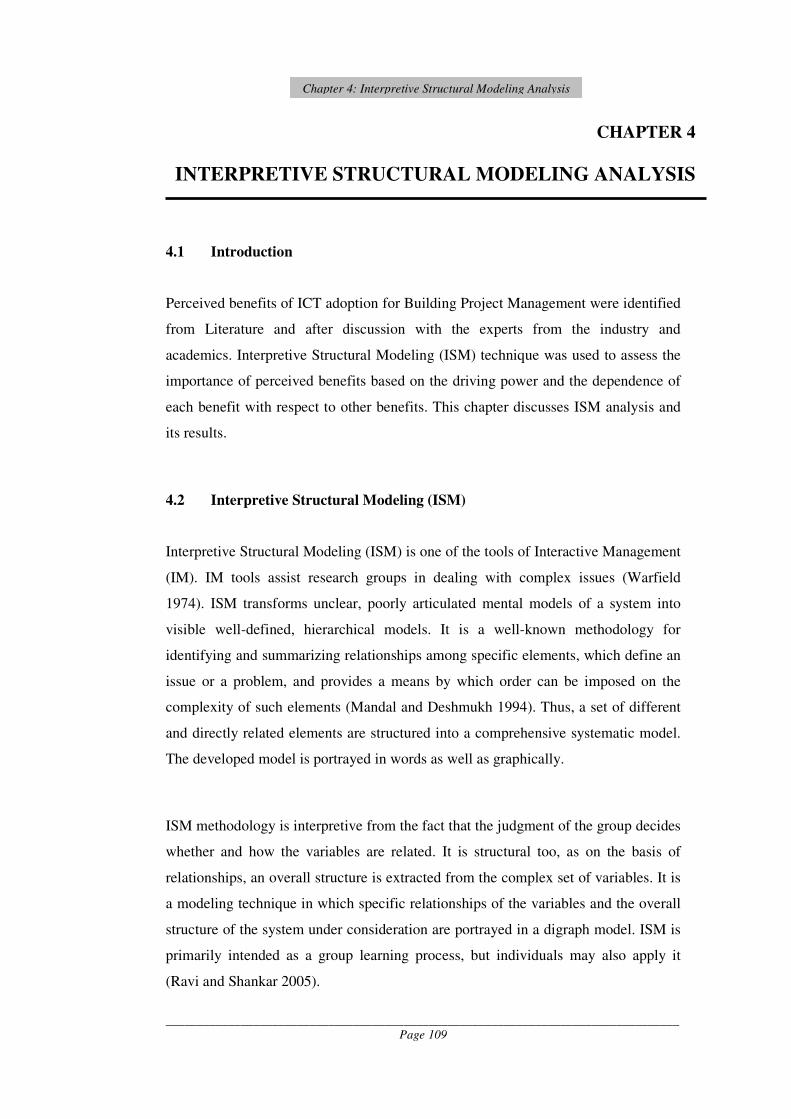
__________________________________________________________________________________
Page 109
Chapter 4: Interpretive Structural Modeling Analysis
CHAPTER 4
INTERPRETIVE STRUCTURAL MODELING ANALYSIS
4.1 Introduction
Perceived benefits of ICT adoption for Building Project Management were identified
from Literature and after discussion with the experts from the industry and
academics. Interpretive Structural Modeling (ISM) technique was used to assess the
importance of perceived benefits based on the driving power and the dependence of
each benefit with respect to other benefits. This chapter discusses ISM analysis and
its results.
4.2 Interpretive Structural Modeling (ISM)
Interpretive Structural Modeling (ISM) is one of the tools of Interactive Management
(IM). IM tools assist research groups in dealing with complex issues (Warfield
1974). ISM transforms unclear, poorly articulated mental models of a system into
visible well-defined, hierarchical models. It is a well-known methodology for
identifying and summarizing relationships among specific elements, which define an
issue or a problem, and provides a means by which order can be imposed on the
complexity of such elements (Mandal and Deshmukh 1994). Thus, a set of different
and directly related elements are structured into a comprehensive systematic model.
The developed model is portrayed in words as well as graphically.
ISM methodology is interpretive from the fact that the judgment of the group decides
whether and how the variables are related. It is structural too, as on the basis of
relationships, an overall structure is extracted from the complex set of variables. It is
a modeling technique in which specific relationships of the variables and the overall
structure of the system under consideration are portrayed in a digraph model. ISM is
primarily intended as a group learning process, but individuals may also apply it
(Ravi and Shankar 2005).

__________________________________________________________________________________
Page 110
Chapter 4: Interpretive Structural Modeling Analysis
ISM promotes the integration of contributions from individuals with diverse views,
backgrounds, and perspectives through a process that is structured, inclusive, and
collaborative. A group of participants who are knowledgeable about the situation are
engaged in (a) collectively developing a deep understanding of the current state of
affairs, (b) establishing a clear basis for thinking about the future, and (c) producing
a framework for effective action (Warfield 1974).
There are two concepts which underlie ISM and which are essential to understanding
the ISM process and product. One is the concept of reachability and the other is the
concept of transitive inference (Watson 1978). Both the concepts are discussed in
the later sections of the chapter. Through the use of these concepts in conjunction
with the book-keeping capabilities of the computer, the ISM system offers a formal
approach to structuring complex systems, which is claimed to be more efficient and
effective than the less formal unassisted approaches (Watson 1978).
The various steps involved in the ISM technique are as follows:
Step 1: Variables affecting the system under consideration are listed, which can be
Objectives, Actions and Individuals etc.
Step 2: A contextual relationship is established among variables with respect to
which pairs of variables would be examined.
Step 3: A Structural Self-Interaction Matrix (SSIM) is developed for variables,
which indicates pair wise relationships among variables of the system
under consideration.
Step 4: Reachability matrix is developed from the SSIM and the matrix is checked
for transitivity, leading to the development of ‘Final reachability matrix’.
The transitivity of the contextual relations is a basic assumption made in
ISM. It states that if a variable A is related to B and B is related to C, then
A is necessarily related to C.
Step 5: The ‘Final reachability matrix’ obtained in Step 4 is partitioned into
different levels. Final reachability matrix is developed in its Conical form
i.e. most zero (0) variables in the upper diagonal half of the matrix and
most unitary (1) variables in the lower half.

__________________________________________________________________________________
Page 111
Chapter 4: Interpretive Structural Modeling Analysis
Step 6: Based on the relationships given in the reachability matrix and the
determined levels for each variable, a directed graph is drawn and the
transitive links are removed.
Step 7: The resultant digraph is converted into an ISM by replacing variable nodes
with statements.
Step 8: The developed ISM model is reviewed to check for conceptual
inconsistency and necessary modifications are made.
4.3 Analysis
4.3.1 Research Variables
In this research study, variables are the identified perceived benefits categorized
under four groups. Benefits related to: measures of Project Success, effective Team
Management, effective use of Technology, and increased Organizational Efficiency.
The identified perceived benefits are shown in Table 4.1.
4.3.2 Structural Self-Interaction Matrix (SSIM)
ISM methodology suggests the use of the expert opinions based on various
management techniques such as brainstorming, nominal technique, etc., in
developing the contextual relationship among the variables (Ravi and Shankar 2005).
It can be used to develop several types of structure, including influence structures
(e.g., "supports," or "aggravates"), priority structures (e.g., "is more important than,"
or "should be learned before"), and categorizations of ideas (e.g., "belongs in the
same category with") (Warfield 1974).
After consultation and discussions with the experts from the industry and academics,
contextual relationships among the benefits were identified. For analysis, a
contextual relationship of ‘leads to’ type was chosen. This means that one variable
leads to another variable. Following four symbols were used to denote the direction
of relationship between the benefits (i and j):
V: Benefit i will help achieve Benefit j

__________________________________________________________________________________
Page 112
Chapter 4: Interpretive Structural Modeling Analysis
A: Benefit i will be achieved by Benefit j
X: Benefits i and j will help achieve each other
O: Benefits i and j are unrelated.
Table 4.1: Perceived Benefits of ICT Adoption for Building Project
Management Benefits related to measures of Project Success
1 Project completion as per the estimated time
2 Project completion as per the estimated budget
3 Project completion as per the specifications
4 Life cycle concept becomes a competitive factor
5 Project information obtained in real time
6 Richer information made available to managers
7 Less time spent in query and approval process
8 Effective change management
9 Reduced risk of errors and rework on projects
10 Effective concurrent construction management
11 A complete log of all communications maintained for tracking purposes
12 Effective material procurement and management
13 Effective contract management
14 “One-source” documentation archive maintained for clients
15 Client satisfaction
16 Reduced administrative costs of document handling and distribution to multiple parties
17 Project managers spend more time on managerial work
Benefits related to effective Team management
18 Effective collaboration and coordination between project team members
19 Effective communication management between project team members
20 Greater management control
21 Effective joint decision making
22 Motivation of the workforce
Benefits related to effective use of Technology
23 Increased information portability in the ICT environment
24 Reduced hard copy storage of documents/drawings
25 Flow of accurate information
26 Ease of retrieval of information
27 Improved capability of the system to cross reference to other correspondence
28 Multilocational availability of information
Benefits related to increased Organizational Efficiency
29 Increase in overall organizational efficiency
30 Better information assessment and management within the organization
31 Useful information compiled and disseminated to other projects
The following description explains the use of relationships V, A, X and O in the
SSIM (Table 4.2):
i. Benefit 11 helps achieve Benefit 27. This means that when ‘a complete log of
all communications is maintained for tracking purposes’ it ‘improves the
capability of the system to cross reference to other correspondence’. Thus the
relationship between Benefits 11 and 27 is denoted as ‘V’ in the SSIM.

__________________________________________________________________________________
Page 113
Chapter 4: Interpretive Structural Modeling Analysis
ii. Benefit 21 can be achieved by Benefit 23. This means ‘Increased information
portability in the ICT environment’ helps in ‘effective joint decision making’.
Thus the relationship between Benefits 21 and 23 is denoted as ‘A’ in the
SSIM.
iii. Benefits 20 and 21 help achieve each other. This means ‘greater management
control’ helps in achieving ‘joint decision making’ and vice-e-versa. Thus the
relationship between Benefits 20 and 21 is denoted as ‘X’ in the SSIM.
iv. Benefits 1 and 24 are not related. This means that there is no direct relation
between ‘Project completion as per the estimated time’ and ‘reduced hard
copy storage of documents/drawings’. Thus the relationship between Benefits
1 and 24 is denoted as ‘O’ in the SSIM.
Similarly relationships between all the benefits have been identified and denoted in
the SSIM.
4.3.3 Reachability Matrix
SSIM is transformed into a binary matrix, called the initial reachability matrix by
substituting V, A, X, O relationships by 1 and 0 as per the case. The rules for the
substitution of 1 and 0 are as follows:
1. If (i, j) entry in the SSIM is V, then (i, j) entry in the reachability matrix
becomes 1 and the (j, i) entry becomes 0.
2. If (i, j) entry in the SSIM is A, then (i, j) entry in the reachability matrix
becomes 0 and (j, i) entry becomes 1.
3. If (i, j) entry in the SSIM is X, then both (i, j) and (j, i) entries in the
reachability matrix become 1.
4. If (i, j) entry in the SSIM is O, then both (i, j) and (j, i) entries in the
reachability matrix become 0.
The final reachability matrix is obtained by checking for transitivities as explained in
the Step 4 above (Sec. 4.2). Table 4.3 shows the ‘Initial Reachability Matrix’ and
Table 4.4 shows the ‘Final Reachability Matrix’. In this table, the driving power and
dependence of each benefit are also shown. The driving power of a benefit is the

__________________________________________________________________________________
Page 114
Chapter 4: Interpretive Structural Modeling Analysis
total number of benefits, which it may help achieve including itself. The dependence
of a benefit is the total number of benefits that may help in achieving it.

__________________________________________________________________________________
Page 115
Chapter 4: Interpretive Structural Modeling Analysis

__________________________________________________________________________________
Page 116
Chapter 4: Interpretive Structural Modeling Analysis
4.3.4 Level Partitions
From the final reachability matrix, reachability and antecedent set (Warfield 1974)
for each benefit are found. The reachability set for a particular variable consists of
the variable itself and the variables it drives. The antecedent set consists of the
variable itself and the variables on which it depends. Subsequently, the intersection
of these sets is derived for all the benefits. The variable(s) for which the reachability
and the intersection sets are the same are given the top-level in the ISM hierarchy, as
they would not help achieve any other variable above their own level. After the
identification of the top-level variables, these are discarded from the other remaining
variables (Ravi and Shankar 2005). From Table 4.5, it is seen that ‘Project
completion as per the estimated time’ (Benefit 1), ‘Project completion as per the
estimated budget’ (Benefit 2), ‘Project completion as per the specifications’ (Benefit
3), ‘Effective contract management’ (Benefit 13), ‘Client satisfaction’ (Benefit 15)
and ‘Motivation of the workforce’ (Benefit 22) were found at Level I. Thus, these
benefits are positioned at the top of the ISM model. Table 4.6 shows the levels for
each benefit obtained after 11 iterations. Tables of iterations II to XI are shown in
Appendix B.

__________________________________________________________________________________
Page 117
Chapter 4: Interpretive Structural Modeling Analysis

__________________________________________________________________________________
Page 118
Chapter 4: Interpretive Structural Modeling Analysis
Table 4.6: Levels of Benefits Levels Benefits Types
1 Project completion as per the estimated time Projects Related
2 Project completion as per the estimated budget Projects Related
3 Project completion as per the specifications Projects Related
13 Effective contract management Projects Related
15 Client satisfaction Projects Related
I
22 Motivation of the workforce Team Management Related
4 Life cycle concept becomes a competitive factor Projects Related
10 Effective concurrent construction management Projects Related
II
16 Reduced administrative costs of document handling and
distribution to multiple parties
Projects Related
12 Effective material procurement and management Projects Related III
24 Reduced hard copy storage of documents/drawings Technology Related
8 Effective change management Projects Related
9 Reduced risk of errors and rework on projects Projects Related
18 Effective collaboration and coordination between project
team members
Team Management Related
20 Greater management control Team Management Related
21 Effective joint decision making Team Management Related
IV
17 Project managers spend more time on managerial work Projects Related
6 Richer information made available to managers Projects Related
30 Better information assessment and management within
the organization
Organization Related
V
31 Useful information compiled and disseminated to other
projects
Organization Related
5 Project information obtained in real time Projects Related VI
7 Less time spent in query and approval process Projects Related
25 Flow of accurate information Technology Related VII
27 Improved capability of the system to cross reference to
other correspondence
Technology Related
VIII 14 “One-source” documentation archive maintained for
clients
Projects Related
11 A complete log of all communications maintained for
tracking purposes
Projects Related IX
19 Effective communication management between project
team members
Team Management Related
28 Multilocational availability of information Technology Related X
29 Increase in overall organizational efficiency Organization Related
23 Increased information portability in the ICT
environment
Technology Related XI
26 Ease of retrieval of information Technology Related
4.3.5 Developing Conical Matrix
A conical matrix is developed by clustering benefits at the levels achieved, across
rows and columns in the final reachability matrix. Table 4.7 shows the final
reachability matrix in the conical form.
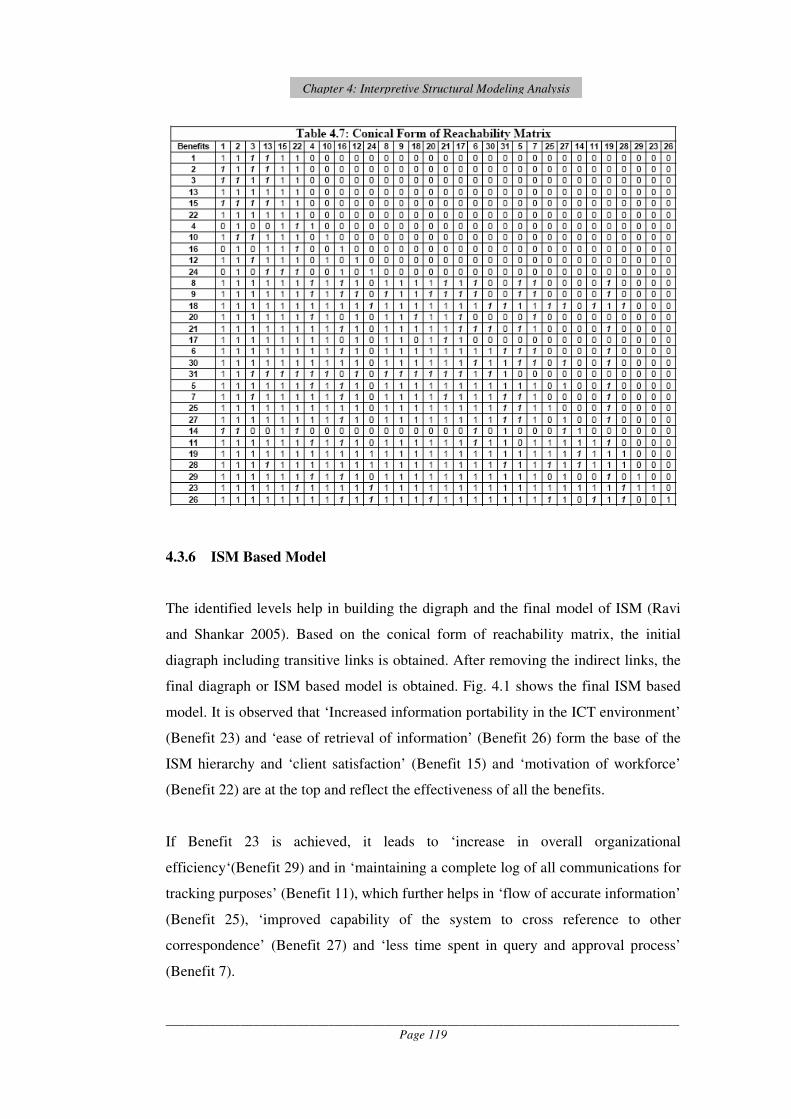
__________________________________________________________________________________
Page 119
Chapter 4: Interpretive Structural Modeling Analysis
4.3.6 ISM Based Model
The identified levels help in building the digraph and the final model of ISM (Ravi
and Shankar 2005). Based on the conical form of reachability matrix, the initial
diagraph including transitive links is obtained. After removing the indirect links, the
final diagraph or ISM based model is obtained. Fig. 4.1 shows the final ISM based
model. It is observed that ‘Increased information portability in the ICT environment’
(Benefit 23) and ‘ease of retrieval of information’ (Benefit 26) form the base of the
ISM hierarchy and ‘client satisfaction’ (Benefit 15) and ‘motivation of workforce’
(Benefit 22) are at the top and reflect the effectiveness of all the benefits.
If Benefit 23 is achieved, it leads to ‘increase in overall organizational
efficiency‘(Benefit 29) and in ‘maintaining a complete log of all communications for
tracking purposes’ (Benefit 11), which further helps in ‘flow of accurate information’
(Benefit 25), ‘improved capability of the system to cross reference to other
correspondence’ (Benefit 27) and ‘less time spent in query and approval process’
(Benefit 7).

__________________________________________________________________________________
Page 120
Chapter 4: Interpretive Structural Modeling Analysis
Benefit 23 and 26 help in achieving ‘effective communication management’ between
project team members (Benefit 19). ‘Effective communication management’ leads to
‘maintaining a complete log of all communications’, ‘improved capability of the
system to cross reference to other correspondence’ (Benefit 27) and ‘flow of accurate
information’ (Benefit 25). Multilocational availability of information (Benefit 28)
and Benefit 19 are interdependent and Benefit 28 also helps in ‘maintaining a

__________________________________________________________________________________
Page 121
Chapter 4: Interpretive Structural Modeling Analysis
complete log of all communications’ and ‘improved capability of the system to cross
reference to other correspondence’.
Benefit 11 helps in ‘providing clients with a complete one source documentation
archive’ (Benefit 14), which further helps in ‘compilation of useful information for
other projects’ (Benefit 31).
Benefit 25 and 27 are not dependent on each other, but collectively help in
‘providing richer information to managers for decision making’ (Benefit 6), which
helps in ‘improved information assessment and management within the organization’
(Benefit 30), which also helps in achieving Benefit 31 and this further leads to
Benefit 6 since information from previous similar projects always helps the managers
to plan the projects better.
‘Effective communication management’ helps the project team to ‘obtain the project
information quicker and in real time’ (Benefit 5) which further improves the ‘query
and approval process’ that is also affected by Benefit 25 and 27. Benefit 5 also
affects Benefit 27, but has gone up one level in the ISM model because ‘improved
query and approval process’ (Benefit 7) is affected by ‘improved capability of the
system to cross reference to other correspondence’ (Benefit 27) but does not affect it
even indirectly.
Benefit 5, 6, 7 and 19 are interdependent to ‘effective collaboration and coordination
between project team members’ (Benefit 18) and are at lower levels in the ISM
model because they also collectively help in achieving ‘better information
assessment and management within the organization’ (Benefit 30), which further
affects Benefit 18.
Benefit 6, 30 and other related benefits help the ‘managers to spend more time on
managerial work’ (Benefit 17), which further helps in ‘effective change
management’ (Benefit 8) leading to ‘reduced risk of errors and rework on the
projects’ (Benefit 9), which is a measure of ‘effective collaboration and coordination
between the project team members’ (Benefit 18), but is also helped by it. Benefit 18
and ‘effective joint decision making’ (Benefit 21) are interdependent and help in

__________________________________________________________________________________
Page 122
Chapter 4: Interpretive Structural Modeling Analysis
achieving ‘greater management control’ (Benefit 20). ‘Effective joint decision
making’ helps in improving the ‘query and approval process’ (Benefit 7), but is two
levels above it in the ISM model, because Benefit 7 affects Benefits 6 and 30 which
further help in achieving ‘effective joint decision making’.
‘Effective change management’, ‘greater management control’ and other benefits
help in ‘effective material procurement and management’ (Benefit 12), which further
helps to complete the project within the estimated time (Benefit 1) and cost (Benefit
2) and ‘effective contract management’ (Benefit 13), which further help in achieving
increased ‘client satisfaction’ (Benefit 15). ‘Effective communication management’
(Benefit 19) reduces the ‘hard copy filing/storage of documents/drawings’ (Benefit
24), which further helps in reducing the ‘administrative cost of document handling
and distribution to multiple parties’ (Benefit 16) and reducing the project cost
(Benefit 2). These two benefits help in achieving increased ‘client satisfaction’.
‘Effective collaboration and coordination’ and other benefits help in multiple design
alternatives to be assessed leading to ‘Life cycle concept becoming a competitive
factor’ (Benefit 4), which helps in completing the project in estimated cost (Benefit
2) and leads to ‘Client satisfaction’. ‘Effective change management’, ‘reduced risk of
errors’ and other benefits lead to application of ‘concurrent construction
management’, which further helps in completing the ‘project on time’, ‘effective
contract management’, ‘increased client satisfaction’ and also leads to ‘motivation of
the workforce’ (Benefit 22).
‘Effective change management’, ‘reduced risk of errors’ and other benefits also lead
to completing the project ‘as per the specifications’ (Benefit 3), which ‘satisfies the
client’ and ‘motivates the workforce’. Project completion on time also increases the
chances of ‘Project completion within the estimated cost’ and successful project
completion is an indication of ‘effective contract management’ and satisfies the
client and motivates the workforce for future projects.
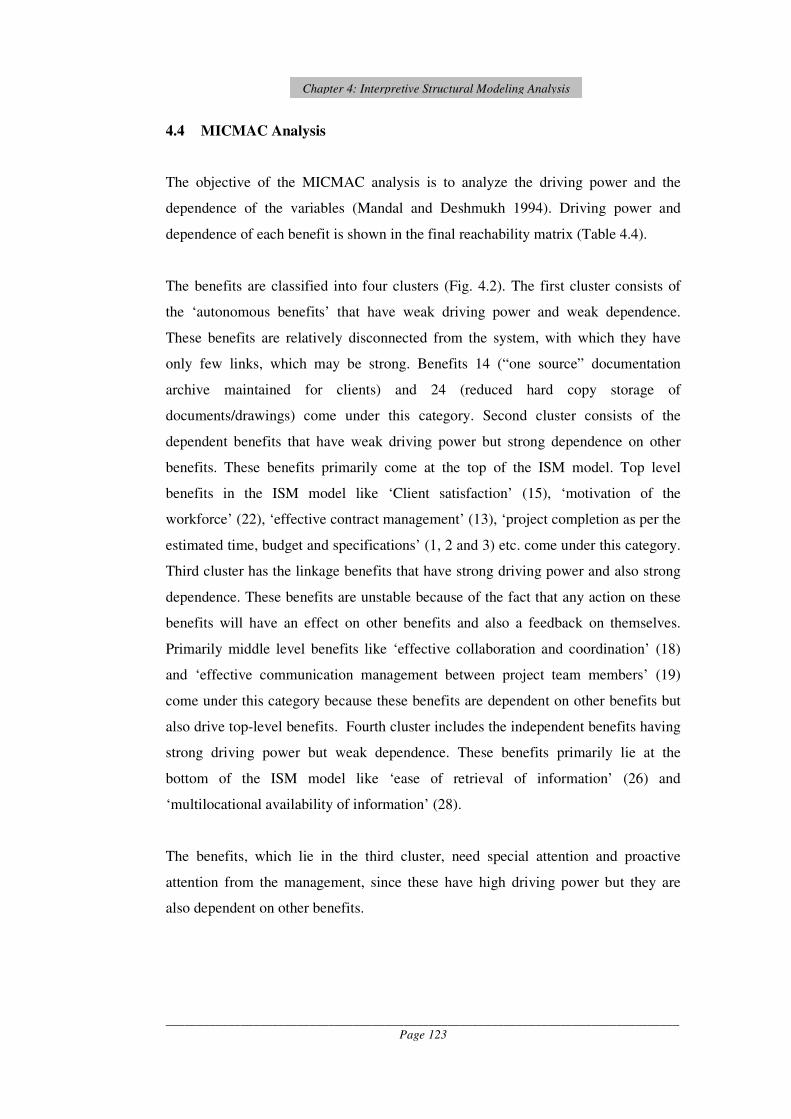
__________________________________________________________________________________
Page 123
Chapter 4: Interpretive Structural Modeling Analysis
4.4 MICMAC Analysis
The objective of the MICMAC analysis is to analyze the driving power and the
dependence of the variables (Mandal and Deshmukh 1994). Driving power and
dependence of each benefit is shown in the final reachability matrix (Table 4.4).
The benefits are classified into four clusters (Fig. 4.2). The first cluster consists of
the ‘autonomous benefits’ that have weak driving power and weak dependence.
These benefits are relatively disconnected from the system, with which they have
only few links, which may be strong. Benefits 14 (“one source” documentation
archive maintained for clients) and 24 (reduced hard copy storage of
documents/drawings) come under this category. Second cluster consists of the
dependent benefits that have weak driving power but strong dependence on other
benefits. These benefits primarily come at the top of the ISM model. Top level
benefits in the ISM model like ‘Client satisfaction’ (15), ‘motivation of the
workforce’ (22), ‘effective contract management’ (13), ‘project completion as per the
estimated time, budget and specifications’ (1, 2 and 3) etc. come under this category.
Third cluster has the linkage benefits that have strong driving power and also strong
dependence. These benefits are unstable because of the fact that any action on these
benefits will have an effect on other benefits and also a feedback on themselves.
Primarily middle level benefits like ‘effective collaboration and coordination’ (18)
and ‘effective communication management between project team members’ (19)
come under this category because these benefits are dependent on other benefits but
also drive top-level benefits. Fourth cluster includes the independent benefits having
strong driving power but weak dependence. These benefits primarily lie at the
bottom of the ISM model like ‘ease of retrieval of information’ (26) and
‘multilocational availability of information’ (28).
The benefits, which lie in the third cluster, need special attention and proactive
attention from the management, since these have high driving power but they are
also dependent on other benefits.

__________________________________________________________________________________
Page 124
Chapter 4: Interpretive Structural Modeling Analysis
4.5 Discussion and Hypotheses Formulation
The developed ISM model provides a structure to the complex issue of the
importance of perceived benefits of ICT adoption for building project management.
The ISM model shows that the project related benefits are primarily at the top of
hierarchy, team management related benefits are primarily in the middle and
technology and organization related benefits are primarily at the bottom of hierarchy.
But, organization and technology related benefits have high driving power and these
are ‘strategic benefits’ for the project team organizations. Thus organizations are
required to give more attention on strategically increasing these benefits from
application of ICT and if application of ICT for general administration in the
organization is matured, appropriate IT tools are included in the working framework
and team management issues are planned at the earlier stages of the project, then
project related benefits would be achieved by default. The four groups of benefits are
inter-related and cannot be achieved in isolation. This analysis provides a road map
to managers or project management organizations to decide that if they are planning

__________________________________________________________________________________
Page 125
Chapter 4: Interpretive Structural Modeling Analysis
ICT adoption for achieving certain benefits then what are the other driving benefits
that should be achieved prior to that and also what are the dependent benefits that
would be achieved by default.
The results are significant for SMEs because SMEs focus on short term benefits and
typically the senior management is caught up in a conflict of building up the
organization for future needs versus the current fulfillment of the contractual
obligations (Sreepuram and Rao 2006). Specifically in multiple enterprise
functioning of building project management, it is difficult to quantitatively evaluate
the benefits of ICT adoption. It requires qualitative analysis based on the perceptions
of the construction professionals. The road map provided by this analysis could form
an important component of the benefits management plan for the SMEs. The benefits
management plan comprises a range of management activities designed to ensure
that an organization realizes the benefits it plans to achieve from an investment
(Farbey et al. 1999 cited in Love et al. 2004).
Results of the ISM analysis led to the formulation of additional hypotheses of causal
relationships. Effect of ‘ICT adoption for general administration works’ on ‘ICT
adoption for building project management’ is tested through increased use of IT tools
or software for individual project management processes, thus, leading to
formulation of the following hypothesis:
HR6: Increased ICT adoption for general administration positively affects use of
advanced software for individual building project management processes.
The relations between the three factors- ‘geographical separation between project
team members’, ‘perceived benefits of ICT adoption’ and ‘perceived barriers for
effective ICT adoption’ - are also tested with ‘ICT adoption for general
administration works’. Thus, following three additional hypotheses are formulated.
HR7: Geographical separation between the project team members positively affects
ICT adoption by organizations for general administration works.
HR8: Perceived benefits of ICT adoption positively affect ICT adoption by
organizations for general administration works.

__________________________________________________________________________________
Page 126
Chapter 4: Interpretive Structural Modeling Analysis
HR9: Perceived barriers for effective ICT adoption negatively affect ICT adoption
by organizations for general administration works.
These results lead to the formulation of an additional supplementary hypothesis.
HS4: All the four groups of benefits are interrelated and cannot be achieved in
isolation.
4.6 Further Analysis
The above-developed ISM model as indicated in Fig.4.1 was based on the experts’
opinion and literature survey, as suggested in the ISM technique. It led to the
formulation of additional hypotheses of causal relationships. The structural model
generated through eight hypotheses of this group (HR2 – HR9) was tested and
finalized through ‘Structural Equation Modeling Technique’. Data for analysis was
the data collected through the questionnaire survey. The analysis is discussed in
Chapter 6. Hypothesis HS4 was tested and the results are discussed in Chapter 5.
4.7 Summary
This chapter discusses the driving power and dependence relationships between the
perceived benefits of ICT adoption for building project management. Though the
ISM model is developed on the basis of the perception of experts, it is generic and
provides a direction for strategically planning the adoption of ICT in project
management organizations. The analysis results led to the formulation of additional
hypotheses, which are tested in subsequent chapters.

Chapter 5: Questionnaire Survey Data Analysis
CHAPTER 5
QUESTIONNAIRE SURVEY DATA ANALYSIS 5.1 Introduction
In this chapter, data analysis of a questionnaire-based survey of SMEs in the Indian
construction industry is presented. The main objectives of this survey were to
examine the current practices of ICT adoption for building project management in
the Indian construction industry, test the hypotheses formulated in this research and
identify the issues that require further study. Key observations from this survey have
been reported and discussed.
Details of the questionnaire design, survey population, validation of the
questionnaire, pilot survey and survey administration are discussed in Chapter 3
(Sec. 3.5.2). The data has been analyzed with different perspectives and the relation
between the different analyses is also studied. In this chapter, office refers to the
head office of the surveyed organizations.
Levin and Rubin (1994, p.382) have indicated that there is no single standard or
universal level of significance for testing the hypotheses (Tone 2005). Level of
significance used for data analysis in this research is 0.05, which is the most common
level used, or the confidence level is 95% i.e. p< 0.05. The confidence level refers to
the expected percentage of times that the actual value will fall within the stated
precision limits (Kothari 2005, p.155).
5.2 Respondents’ Profile
Questionnaires were mailed to 372 organizations. 153 responses were received. 4
responses were partially incomplete and were considered as missing cases. Thus, 149
usable responses were received for a response rate of 40.05%. For postal surveys in
the construction industry, response rate above 30% is considered statistically viable
and satisfactory (Love and Smith 2003; Liberatore et al. 2001).
__________________________________________________________________________________ Page 127
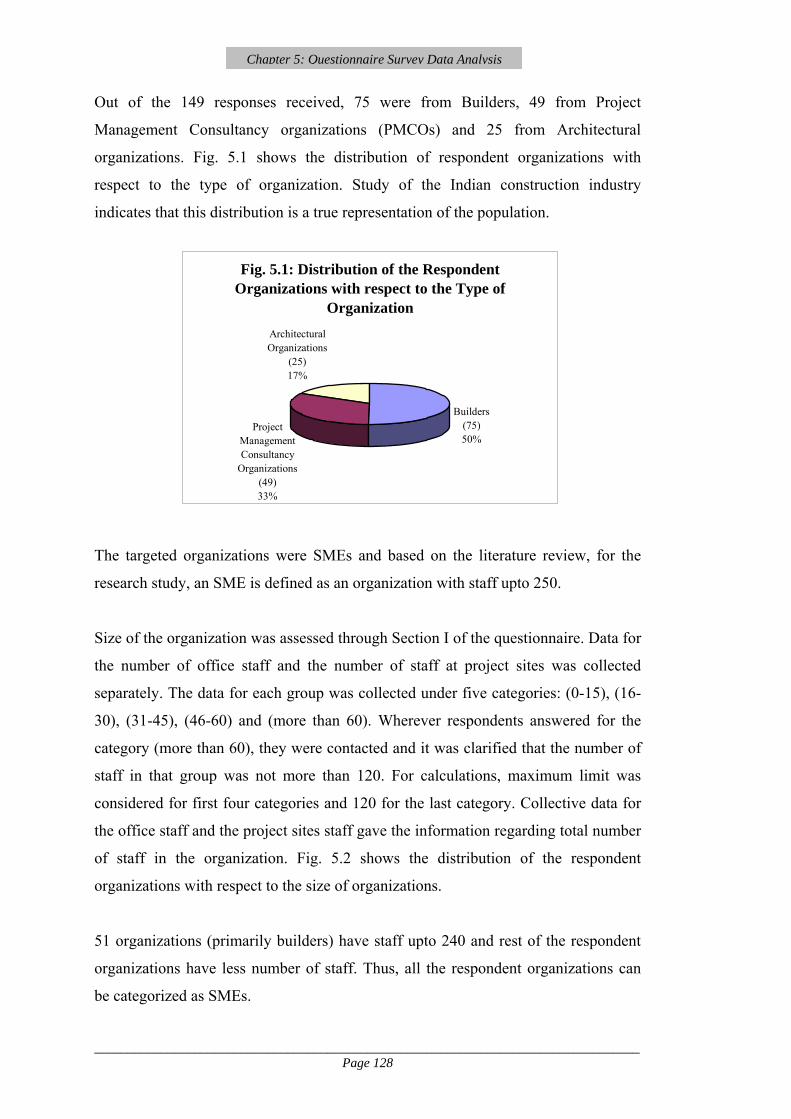
Chapter 5: Questionnaire Survey Data Analysis
Out of the 149 responses received, 75 were from Builders, 49 from Project
Management Consultancy organizations (PMCOs) and 25 from Architectural
organizations. Fig. 5.1 shows the distribution of respondent organizations with
respect to the type of organization. Study of the Indian construction industry
indicates that this distribution is a true representation of the population.
Fig. 5.1: Distribution of the Respondent Organizations with respect to the Type of
Organization
Builders (75)50%
Project Management Consultancy
Organizations (49)33%
Architectural Organizations
(25)17%
The targeted organizations were SMEs and based on the literature review, for the
research study, an SME is defined as an organization with staff upto 250.
Size of the organization was assessed through Section I of the questionnaire. Data for
the number of office staff and the number of staff at project sites was collected
separately. The data for each group was collected under five categories: (0-15), (16-
30), (31-45), (46-60) and (more than 60). Wherever respondents answered for the
category (more than 60), they were contacted and it was clarified that the number of
staff in that group was not more than 120. For calculations, maximum limit was
considered for first four categories and 120 for the last category. Collective data for
the office staff and the project sites staff gave the information regarding total number
of staff in the organization. Fig. 5.2 shows the distribution of the respondent
organizations with respect to the size of organizations.
51 organizations (primarily builders) have staff upto 240 and rest of the respondent
organizations have less number of staff. Thus, all the respondent organizations can
be categorized as SMEs.
__________________________________________________________________________________ Page 128

Chapter 5: Questionnaire Survey Data Analysis
Fig. 5.2: Distribution of the Respondent Organizations with Respect to the Size of Organizations
0102030405060
upto 30 upto 45 upto 60 upto 75 upto 90 upto105
upto135
upto150
upto165
upto180
upto240
No. of Staff
No.
of O
rgan
isat
ions
Section I of the questionnaire assessed the primary mode of project execution by the
respondent organizations. Data was collected regarding the number of projects
executed by the respondent organizations as the main agency and as a sub-
contracting agency in the last 5 years. Fig. 5.3 shows this data for the respondent
organizations.
Data analysis shows that the respondent organizations have primarily executed
projects as main agencies and not as sub-contracting agencies. This proves the
assumption discussed in Chapter 2 (Sec. 2.5.3) that in the construction industry,
SMEs also manage the building projects independently. Thus, it is important to study
the ICT maturity of SMEs in the construction industry, as it would determine their
extent of ICT adoption for building project management.
Fig. 5.3: Mode of Project Execution by the Respondent Organizations (in last 5 years)
020406080
100120
0-5 6-10 11-15 16-20 more than20
No. of building projects
No.
of o
rgan
isat
ions
Building Projects Executed asmain agencyBuilding projects executed assub-contracting agency
__________________________________________________________________________________ Page 129
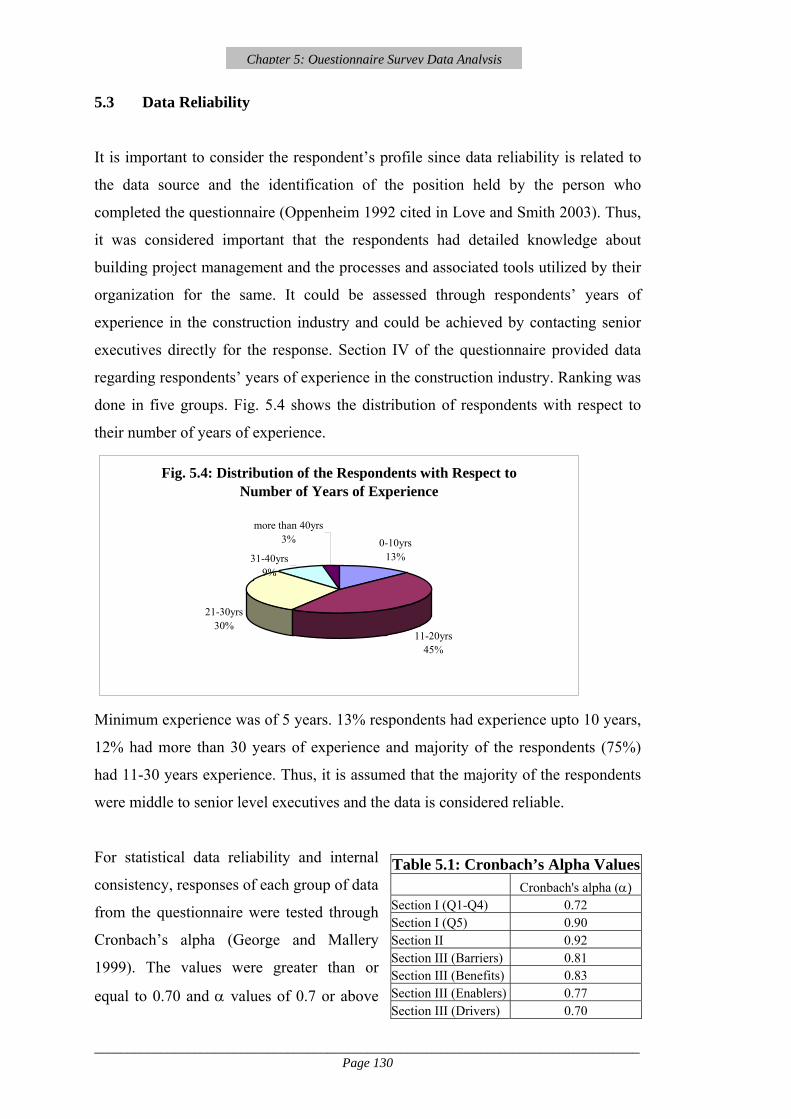
Chapter 5: Questionnaire Survey Data Analysis
5.3 Data Reliability
It is important to consider the respondent’s profile since data reliability is related to
the data source and the identification of the position held by the person who
completed the questionnaire (Oppenheim 1992 cited in Love and Smith 2003). Thus,
it was considered important that the respondents had detailed knowledge about
building project management and the processes and associated tools utilized by their
organization for the same. It could be assessed through respondents’ years of
experience in the construction industry and could be achieved by contacting senior
executives directly for the response. Section IV of the questionnaire provided data
regarding respondents’ years of experience in the construction industry. Ranking was
done in five groups. Fig. 5.4 shows the distribution of respondents with respect to
their number of years of experience.
Fig. 5.4: Distribution of the Respondents with Respect to Number of Years of Experience
0-10yrs13%
11-20yrs45%
21-30yrs30%
31-40yrs9%
more than 40yrs3%
Minimum experience was of 5 years. 13% respondents had experience upto 10 years,
12% had more than 30 years of experience and majority of the respondents (75%)
had 11-30 years experience. Thus, it is assumed that the majority of the respondents
were middle to senior level executives and the data is considered reliable.
For statistical data reliability and internal
consistency, responses of each group of data
from the questionnaire were tested through
Cronbach’s alpha (George and Mallery
1999). The values were greater than or
equal to 0.70 and α values of 0.7 or above
Table 5.1: Cronbach’s Alpha Values Cronbach's alpha (α) Section I (Q1-Q4) 0.72 Section I (Q5) 0.90 Section II 0.92 Section III (Barriers) 0.81 Section III (Benefits) 0.83 Section III (Enablers) 0.77 Section III (Drivers) 0.70
__________________________________________________________________________________ Page 130

Chapter 5: Questionnaire Survey Data Analysis
indicate a reliable measurement instrument or reliability coefficient (Carmines and
Zeller 1979 cited in Prahinski and Benton 2004; Nunnaly 1978 cited in Santos 1999)
even though lower thresholds are also sometimes used in the literature (Nunnaly
1978 cited in Santos 1999). α values for each group of data are presented in Table
5.1.
5.4 Hypothesis Testing
For a quick reference of the proposed hypotheses, each of the hypotheses is
presented before it is tested.
5.4.1 Hypotheses Determining Dimensions of Qualitative Factors
5.4.1.1 Hypothesis HD1
‘For building project management, collaborative use of ICT is not as prevalent as the
internal use of ICT within the organizations.’
Effective ICT adoption for project management requires collaborative use of ICT
between different organizations. Through Section II of the questionnaire, data was
collected for the communication methods utilized for each identified project
management process. Communication was categorized into four groups: within
office (ict_off), between office and site (ict_site), between office and clients or
consultants (ict_clnt), and between office and contractors or material suppliers
(ict_cont). Communication methods were categorized in three groups: (hard copy),
(hard copy and e-mail), and (only e-mail) with scores 1, 2 and 4 respectively.
Further, to represent the usage of the multiple communication methods for a process,
respondents could identify different communication methods utilized for different
percentages of projects, through a five point interval scale.
Use of ICT was found to be different for each category and the ranking was found
significant (p<0.001) through Non Parametric Freidman test (Table 5.2).
__________________________________________________________________________________ Page 131

Chapter 5: Questionnaire Survey Data Analysis
Table 5.2: Non Parametric Friedman Test for Ranking Extent of Use of ICT between Different
Groups Group Mean Rank Test Statistics
ict_off 3.68 N 149.00 ict_site 3.13 Chi-Square 328.21 ict_clnt 1.41 df 3.00 ict_cont 1.78 Asymp. Sig. 0.00
Further, results of the first two groups were summarized as ‘Internal use of ICT
within organizations (ict_int)’ and the results of the last two groups were
summarized as ‘External or collaborative use of ICT (ict_ext)’. It was found that
only in about 3% (4 no.) of the surveyed organizations, external or collaborative use
of ICT was more than the internal use of ICT. But, in rest 97% (145 no.) of the
organizations, internal use was significantly more. Through Wilcoxon signed ranks
test, this analysis was found significant (p<0.001) (Table 5.3).
Table 5.3: Wilcoxon Signed Ranks Test for Comparing Internal and External/collaborative use of ICT for Building Project Management
Ranks N Mean Rank Sum of Ranks
Test Statistics (Based on positive ranks)
Negative Ranks 145a 76.91 11152.00 ict_ext - ict_int Positive Ranks 4b 5.75 23.00 Z -10.55
Ties 0c Asymp. Sig.
(2-tailed) 0.00
ict_ext - ict_int
Total 149.00 a: ict_ext < ict_int b: ict_ext > ict_int c: ict_ext = ict_int
It proves hypothesis HD1 that for building project management, collaborative use of
ICT is not as prevalent as the internal use of ICT within the organizations.
5.4.1.2 Hypothesis HD2 and HD3
HD2: ‘It is perceived that education of users for ICT adoption and its benefits is
important for increasing effective ICT adoption in building projects.’
HD3: ‘It is perceived that more accessible and less costly ICT training for
executives is important for increasing effective ICT adoption in building
projects.’
Data for the above hypotheses was collected through Section III of the questionnaire
as perceived enablers for effective ICT adoption for building project management.
__________________________________________________________________________________ Page 132

Chapter 5: Questionnaire Survey Data Analysis
The respondents’ perception for each identified enabler was rated on a five-point
Likert scale. On this scale, 1 and 5 corresponded to ‘not important’ and ‘most
important’ respectively, whereas 3 corresponded to ‘moderately important’. The
hypotheses were tested through one-sample t-test (Table 5.5) and the results were
significant (p<0.001). Table 5.4 shows the mean and standard deviation of the test
variables and indicates that ‘education of users for effective use of ICT and its
benefits’ has been considered more important than ‘more accessible and less costly
ICT training’.
Table 5.4: Descriptive Statistics of Test Variables of Hypotheses HD2 and HD3
One-Sample Statistics MeanStd. Deviation Std. Error Mean
Education of users for effective use of ICT and its Benefits 4.23 0.89 0.07 ICT Training to be more accessible and less costly 4.02 1.19 0.10
Table 5.5: t-test results for Hypotheses HD2 and HD3 Test Value = 3
95% Confidence Interval of the
Difference t df
Sig. (2-tailed)
Mean Difference Lower Upper
Education of users for effective use of ICT and its benefits
16.97 148 0 1.235 1.09 1.38 ICT Training to be more accessible and less costly
10.43 148 0 1.02 0.83 1.21 It proves hypothesis HD2 and HD3 that ‘Education of users for effective use of ICT
and its benefits’ and ‘More accessible and less costly ICT training for executives’ are
important enablers for increasing effective ICT adoption for building project
management. However, more important is providing facilities for educating users for
effective use of ICT and its benefits.
5.4.1.3 Hypothesis HD4
‘Majority of SMEs does not have a communication management strategy within the
organization.’
__________________________________________________________________________________ Page 133

Chapter 5: Questionnaire Survey Data Analysis
Data for this hypothesis was collected through Section I of the questionnaire.
Respondents provided data in (Yes/No) format. Table 5.6 shows that about 58%
organizations do not have a communication management strategy within the
organization. Only about 42% organizations have a communication management
strategy within the organization.
Table 5.6: Organizations having Communication Management Strategy
within the Organization Frequency % Cumulative %
No 86.00 57.72 57.72 Yes 63.00 42.28 100.00
Total 149.00 100.00
It proves hypothesis HD 4 and this result is further validated through hypothesis
HD5.
5.4.1.4 Hypothesis HD5
‘Adoption of ICT by an SME is project specific and not organization specific.’
The data for this hypothesis was collected through Section I of the questionnaire.
Response to the question: ‘Extent of ICT adoption varies between different projects’
was provided in (Yes/No) format. Table 5.7 shows that in 79 (about 53%)
respondent organizations, ICT adoption is project specific as it varies between
different projects.
Table 5.7: Extent of ICT Adoption Varies between Different Projects Frequency % Cumulative %
No 70.00 46.98 46.98 Yes 79.00 53.02 100.00
Total 149.00 100.00
Further data was collected to understand that differential usage of ICT in projects
was due to ‘variable ICT capability of associating project team organizations’ or
__________________________________________________________________________________ Page 134

Chapter 5: Questionnaire Survey Data Analysis
‘variable requirement of clients for use of ICT on projects’. It was found that out of
the 79 organizations, in 45 (30% of total) organizations it was primarily due to the
variable requirement of clients for use of ICT on projects, in 11 (8% of total)
organizations it was primarily due to the variable ICT capability of associating
project team organizations and in 23 (15% of total) organizations both the factors
were equally dominant. Distribution of the organizations for variable use of ICT is
shown in Fig. 5.5. This result was found significant (p<0.001) through non-
parametric Wilcoxon Signed ranks test (Table 5.8).
Fig. 5.5: Distribution of organizations (in %) for variable ICT adoption on Building Projects
47%30%
8%
15%
53%
In 47% orgs. extent of ICTadoption is org. specificand remains primarily samefor all the projectsIn 30% orgs. it varies dueto variable requirement ofclients
In 8% orgs. it varies due tovariable ICT capability ofassociating project teamorgs.In 15% orgs. it variesbecause both the abovefactors have equal effect
The above analysis proves hypothesis HD5 that ‘adoption of ICT by an SME is
project specific and not organization specific’ and it validates hypothesis HD4 that
the majority of SMEs does not have a communication management strategy. It also
highlights the issue that the extent of use of ICT on the building projects is primarily
defined by the clients’ requirements. This factor is studied further in the subsequent
sections.
__________________________________________________________________________________ Page 135
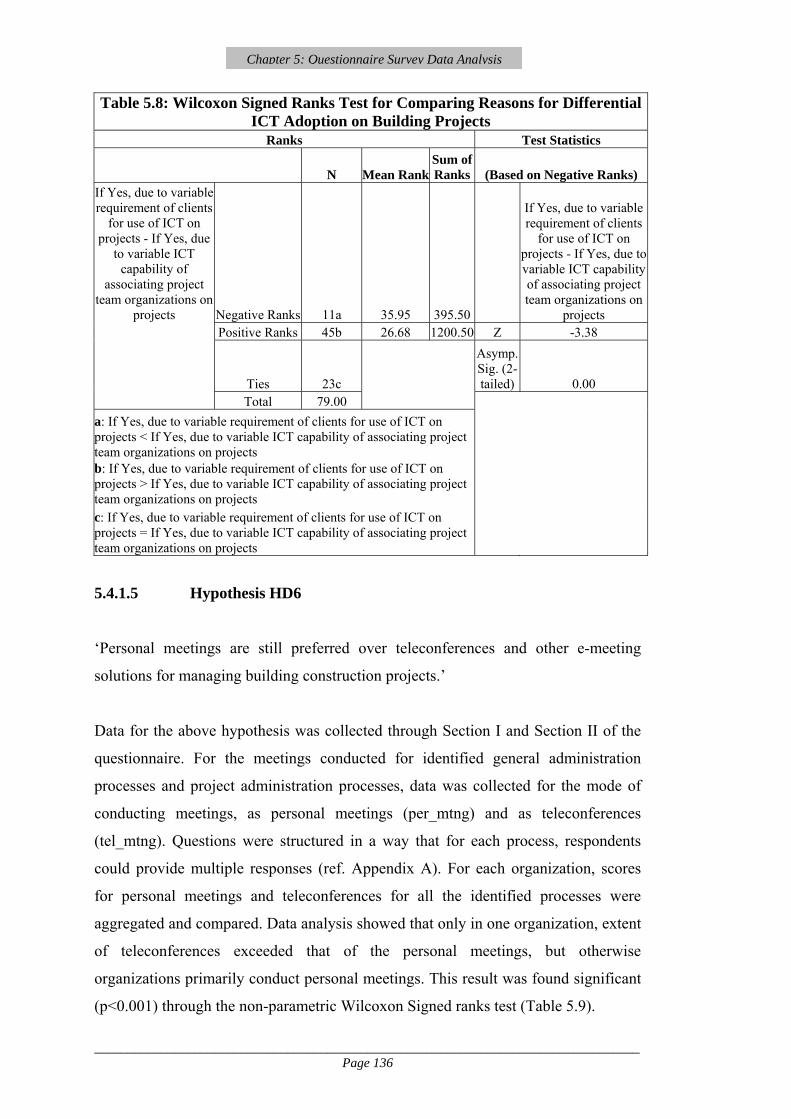
Chapter 5: Questionnaire Survey Data Analysis
Table 5.8: Wilcoxon Signed Ranks Test for Comparing Reasons for Differential ICT Adoption on Building Projects
Ranks Test Statistics N Mean Rank
Sum of Ranks (Based on Negative Ranks)
If Yes, due to variable requirement of clients
for use of ICT on projects - If Yes, due
to variable ICT capability of
associating project team organizations on
projects Negative Ranks 11a 35.95 395.50
If Yes, due to variable requirement of clients
for use of ICT on projects - If Yes, due to variable ICT capability of associating project team organizations on
projects Positive Ranks 45b 26.68 1200.50 Z -3.38
Ties 23c
Asymp. Sig. (2-tailed) 0.00
Total 79.00 a: If Yes, due to variable requirement of clients for use of ICT on projects < If Yes, due to variable ICT capability of associating project team organizations on projects b: If Yes, due to variable requirement of clients for use of ICT on projects > If Yes, due to variable ICT capability of associating project team organizations on projects c: If Yes, due to variable requirement of clients for use of ICT on projects = If Yes, due to variable ICT capability of associating project team organizations on projects
5.4.1.5 Hypothesis HD6
‘Personal meetings are still preferred over teleconferences and other e-meeting
solutions for managing building construction projects.’
Data for the above hypothesis was collected through Section I and Section II of the
questionnaire. For the meetings conducted for identified general administration
processes and project administration processes, data was collected for the mode of
conducting meetings, as personal meetings (per_mtng) and as teleconferences
(tel_mtng). Questions were structured in a way that for each process, respondents
could provide multiple responses (ref. Appendix A). For each organization, scores
for personal meetings and teleconferences for all the identified processes were
aggregated and compared. Data analysis showed that only in one organization, extent
of teleconferences exceeded that of the personal meetings, but otherwise
organizations primarily conduct personal meetings. This result was found significant
(p<0.001) through the non-parametric Wilcoxon Signed ranks test (Table 5.9).
__________________________________________________________________________________ Page 136

Chapter 5: Questionnaire Survey Data Analysis
Table 5.9: Wilcoxon Signed Ranks Test for Comparing scores of Personal Meetings and Teleconferences Ranks Test Statistics(b)
N Mean RankSum of Ranks (Based on Positive Ranks) tel_mtng - per_mtng Negative Ranks 148a 75.50 11174.00 tel_mtng - per_mtng
Positive Ranks 1b 1.00 1.00 Z -10.75
Ties 0c
Asymp. Sig. (2-tailed) 0.00
Total 149.00 a: tel_mtng < per_mtng b: tel_mtng > per_mtng c: tel_mtng = per_mtng
Data was also collected to assess whether respondent organizations were conducting
meetings through videoconferencing or not (Section I). Data analysis showed that
only 7% of the surveyed organizations had conducted meetings through
videoconferencing. After discussion it was found that each of these organizations
had conducted videoconferencing only for one or two projects and primarily for
discussions with overseas material suppliers since material procurement from
overseas has increased for the projects.
The above analysis proves hypothesis HD6 that personal meetings are still preferred
over teleconferences and other e-meeting solutions for managing building projects.
5.4.2 Hypotheses of Causal Relationships – Hypothesis HR1
Hypothesis HR1 stated below is tested in this section and other hypotheses of this
group are tested through Structural Equation Modeling analysis and discussed in
Chapter 6.
‘Organizations with higher turnover have higher adoption of ICT.’
Turnover of the organizations was assessed at a five-point interval scale, the lowest
being (INR 0-2 crores or approx. 0-0.45 million US $) and the highest being (more
than INR 8 crores or approx. 1.8 million US $). Mode of communication was
__________________________________________________________________________________ Page 137

Chapter 5: Questionnaire Survey Data Analysis
assessed as explained for Hypothesis HD1. Scores of the questions assessing
communication methods adopted for the identified general administration processes
and project management processes were aggregated under the research variable
(ict_comp). Higher aggregate indicated higher adoption of ICT. One-way ANOVA
test was conducted to assess the significance of ‘Change in level of use of ICT’ with
‘Change in turnover of the organizations’.
Study of data distribution for the turnover of the organizations (Fig. 5.6) showed that
maximum Architectural organizations are in the first category and their number
decreases in each subsequent higher category. PMCOs are distributed in all the
categories, but about 94% Builders are grouped in the last category. Thus, it was
analyzed that the turnover of different groups of organizations can not be
standardized at the same level and the test was conducted separately for each group
of sample organizations and also collectively for all the sample organizations.
In the analysis done for each group separately, it was found that for the Architectural
organizations and PMCOs, there is difference in the means of each category (Table
5.11), but the results are significant at the confidence level of 94% and not at 95%.
This limitation of statistical significance could be attributed to the small sample size,
as individually sample size of these groups is 25 and 49 respectively. For the results
of Builders, confidence level is further less. It could be attributed to the aggregation
of 94% organizations of this group in the last category leading to a skew in the data.
Results were found significant for the total sample (p<0.01) (Table 5.10).
Fig. 5.6: Distribution of Respondent Organizations as per the Turnover in Indian Rupees (INR)
0.0020.0040.0060.0080.00
100.00
upto 2crores
2-4crores
4-6crores
6-8crores
morethan 8crores
%
Architectural OrganisationsPMCOsBuilders
__________________________________________________________________________________ Page 138

Chapter 5: Questionnaire Survey Data Analysis
Table 5.10: Oneway ANOVA Test for Testing Relation between Turnover of the Organization and Extent of Use of ICT
ANOVA ict_comp Architectural Organizations Sum of Squares df Mean Square F Sig. Between Groups 84083.63 3.00 28027.88 2.97 0.055 Within Groups 197988.93 21.00 9428.04 Total 282072.56 24.00 PMCOs Sum of Squares df Mean Square F Sig. Between Groups 79582.73 4.00 19895.68 2.54 0.053 Within Groups 344117.68 44.00 7820.86 Total 423700.41 48.00 Builders Sum of Squares df Mean Square F Sig. Between Groups 23703.95 2.00 11851.97 1.07 0.349 Within Groups 797904.72 72.00 11082.01 Total 821608.67 74.00 Total Sample Organizations Sum of Squares df Mean Square F Sig. Between Groups 205009.29 4.00 51252.32 4.39 0.002 Within Groups 1680648.99 144.00 11671.17 Total 1885658.28 148.00
Thus, it is interpreted that the hypothesis can be considered valid separately for
Architectural organizations and PMCOs and collectively these two groups constitute
about 50% of the sample size. For Builders further analysis is required by having
more categories on the higher side for recording turnover of the organizations. For
the total sample, the hypothesis is valid that organizations with higher turnover have
higher adoption of ICT.
Thus, hypothesis HR1 is accepted and the data analysis indicates that rejecting the
hypothesis may lead to Type I error.
__________________________________________________________________________________ Page 139
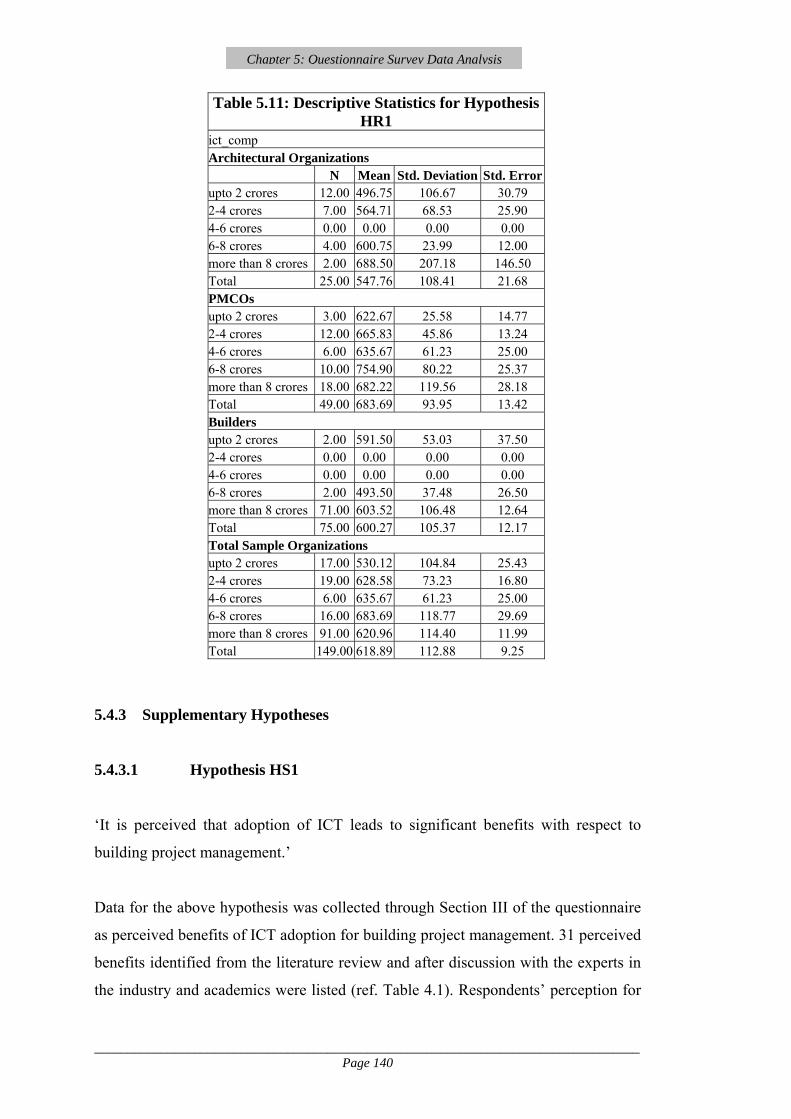
Chapter 5: Questionnaire Survey Data Analysis
Table 5.11: Descriptive Statistics for Hypothesis HR1
ict_comp Architectural Organizations N Mean Std. Deviation Std. Errorupto 2 crores 12.00 496.75 106.67 30.79 2-4 crores 7.00 564.71 68.53 25.90 4-6 crores 0.00 0.00 0.00 0.00 6-8 crores 4.00 600.75 23.99 12.00 more than 8 crores 2.00 688.50 207.18 146.50 Total 25.00 547.76 108.41 21.68 PMCOs upto 2 crores 3.00 622.67 25.58 14.77 2-4 crores 12.00 665.83 45.86 13.24 4-6 crores 6.00 635.67 61.23 25.00 6-8 crores 10.00 754.90 80.22 25.37 more than 8 crores 18.00 682.22 119.56 28.18 Total 49.00 683.69 93.95 13.42 Builders upto 2 crores 2.00 591.50 53.03 37.50 2-4 crores 0.00 0.00 0.00 0.00 4-6 crores 0.00 0.00 0.00 0.00 6-8 crores 2.00 493.50 37.48 26.50 more than 8 crores 71.00 603.52 106.48 12.64 Total 75.00 600.27 105.37 12.17 Total Sample Organizations upto 2 crores 17.00 530.12 104.84 25.43 2-4 crores 19.00 628.58 73.23 16.80 4-6 crores 6.00 635.67 61.23 25.00 6-8 crores 16.00 683.69 118.77 29.69 more than 8 crores 91.00 620.96 114.40 11.99 Total 149.00 618.89 112.88 9.25
5.4.3 Supplementary Hypotheses
5.4.3.1 Hypothesis HS1
‘It is perceived that adoption of ICT leads to significant benefits with respect to
building project management.’
Data for the above hypothesis was collected through Section III of the questionnaire
as perceived benefits of ICT adoption for building project management. 31 perceived
benefits identified from the literature review and after discussion with the experts in
the industry and academics were listed (ref. Table 4.1). Respondents’ perception for
__________________________________________________________________________________ Page 140

Chapter 5: Questionnaire Survey Data Analysis
each identified benefit was rated on a five-point Likert scale. On this scale, 1 and 5
corresponded to ‘not important’ and ‘most important’ respectively, whereas 3
corresponded to ‘moderately important’. For each organization, scores of all the 31
perceived benefits were aggregated (benefits) and significance of the variable was
tested through one-sample t-test (Table 5.13). The results were found significant
(p<0.001). Table 5.12 shows the mean and standard deviation of the test variable
‘benefits’. Descriptive statistics for each identified benefit are discussed later in the
chapter in Sec. 5.6.3.
Table 5.12: Descriptive Statistics of test variable 'benefits'
One-Sample Statistics N Mean Std. Deviation Std. Error Mean
benefits 149.00 126.40 15.15 1.24
Table 5.13: t-test Results for Perceived Importance of Benefits of use of ICT for Building Project Management
One-Sample Test Test Value = 93
95% Confidence Interval of the
Difference t df Sig. (2-tailed) Mean Difference Lower Upper benefits 26.91 148.00 0.00 33.40 30.94 35.85
The above analysis proves hypothesis HS1 that it is perceived that adoption of ICT
leads to significant benefits with respect to building project management.
5.4.3.2 Hypothesis HS2
‘It is perceived that increase in ICT adoption by SMEs for managing building
projects is driven by industry requirements.’
Data for the above hypothesis was collected through Section III of the questionnaire
as perceived industry drivers for increased ICT adoption for building project
management. 9 perceived industry drivers identified after discussion with the experts
in the industry were listed. Respondents’ perception for each identified industry
driver was rated on a five-point Likert scale. On this scale, 1 and 5 corresponded to
‘not important’ and ‘most important’ respectively, whereas 3 corresponded to
__________________________________________________________________________________ Page 141

Chapter 5: Questionnaire Survey Data Analysis
‘moderately important’. Table 5.14 shows the mean score, standard deviation and the
ranking of perceived industry drivers.
Table 5.14: Mean and Std. Deviation of the Perceived Industry Drivers Rank Industry Drivers Mean Std. Deviation
1 Increased requirement of clients for more project information resulting in increased use of ICT 4.25 0.77
2 Increased requirement of adoption of ICT by larger organizations when SMEs execute projects as subcontracting agencies of larger organizations 4.18 0.87
3 Increased involvement of geographically separated agencies and information centers in a Project 4.13 0.77
4 Increased construction activity in the country 4.11 0.95 5 Education of upcoming construction students towards ICT 4.10 0.98 6 Widespread availability of IT tools and technologies in the
country 4.08 0.81 7 Increased involvement of multiple agencies in construction
projects 4.01 0.80 8 Dynamic changes in information requirement during project
execution 3.97 0.93 9 Increased competition with overseas construction organizations
executing projects in the Indian construction industry 3.69 0.64
All the identified industry drivers have mean rank greater than 3 and have been
considered important.
The most important perceived drivers are ‘increased requirement of clients for more
project information resulting in increased use of ICT’ and ‘increased requirement of
adoption of ICT by larger organizations when SMEs execute projects as
subcontracting agencies of larger organizations’. In the second case also ICT
adoption is driven by clients’ requirements since in this situation larger organizations
act as clients for SMEs. This analysis validates Hypothesis HD5 that in majority of
the surveyed organizations, variable use of ICT in the projects is due to the ‘variable
requirement of clients’.
‘Increased involvement of multiple agencies’ is also an important driver with the
mean score of 4.01, but ‘increased geographical separation of these multiple
agencies’ is perceived as a more important driver. The middle level ranked drivers;
‘increased construction activity in the country’, ‘education of upcoming construction
students towards ICT’ and ‘widespread availability of IT tools and technologies in
the country’, show that the industry is getting prepared for the increased use of ICT.
__________________________________________________________________________________ Page 142

Chapter 5: Questionnaire Survey Data Analysis
‘Dynamic changes in information requirement during project execution’ is also an
important driver but is ranked low in comparison to the other drivers. The three
drivers have std. deviation greater than 0.9. It shows that for some respondents
‘increased construction activity in the country’, ‘education of upcoming students for
use of ICT’ and ‘dynamic changes in information requirement during project
execution’ are not important drivers, but for some respondents these are highly
important. After studying the responses it was found that the organizations having
higher use of ICT have communication management strategies drafted for their
organizations and do not consider these as important drivers, but these requirements
drive higher use of ICT in other organizations.
‘Increased competition with overseas construction organizations executing projects
in the Indian construction industry’ is also ranked low and has least std. deviation,
since primarily large size overseas organizations are entering the Indian construction
industry and majority of the SMEs are not directly in competition with these
organizations.
The overall impact of the industry drivers has been perceived as significantly
important. t-test was conducted to test the significance. For each organization, scores
of all the 9 perceived industry drivers were aggregated (drivers) and significance of
the variable ‘drivers’ was tested through one-sample t test (Table 5.16). The results
were found significant (p<0.001). Table 5.15 shows the mean and standard deviation
of the test variable ‘drivers’.
Table 5.15: Descriptive Statistics of Test Variable 'drivers'
One-Sample Statistics N Mean Std. Deviation Std. Error Mean
drivers 149.00 36.74 4.23 0.35
The above analysis proves hypothesis HS2 that increase in use of ICT by SMEs for
managing building projects is driven by the industry requirements.
__________________________________________________________________________________ Page 143

Chapter 5: Questionnaire Survey Data Analysis
Table 5.16: t-test Results for Perceived Industry Drivers for Increased Use of ICT for Building
Project Management One-Sample Test
Test Value = 27 95%
Confidence Interval of the
Difference t df
Sig. (2-tailed)
Mean Difference Lower Upper
drivers 28.09 148.00 0.00 9.74 9.06 10.43
5.4.3.3 Hypothesis HS3
‘Extent of use of ICT for building project management differs for three groups of
sample organizations i.e Project management consultancy organizations, Builders
and Architectural organizations.’
Data for the above hypothesis was collected through Section II of the questionnaire
as communication methods utilized for each identified project management process.
Project management processes were categorized as Time management, Cost
management and Project administration and resource management processes. The
format for data collection was same as explained for Hypothesis HD1. For each
organization, scores for all the processes were aggregated under the variable ‘pmict’.
Mean of the variable for each group was compared (Table 5.17). Results show that
the average use of ICT for building management processes is least in Architectural
Organizations and maximum in PMCOs.
Table 5.17: Descriptive Statistics for Hypothesis HS3 pmict N Mean Std. Deviation Std. ErrorArchitectural Organizations 25.00 470.28 99.99 20.00 Builders 75.00 519.25 97.03 11.20 PMCOs 49.00 592.18 91.95 13.14 Total 149.00 535.02 104.82 8.59
Difference of the mean value between the groups was also found significant
(p<0.001) through Oneway ANOVA test (Table 5.18).
__________________________________________________________________________________ Page 144

Chapter 5: Questionnaire Survey Data Analysis
Table 5.18: Oneway ANOVA Test for Difference in Use of ICT for Different Groups of Sample Organizations
ANOVA pmict Sum of Squares df Mean Square F Sig. Between Groups 283542.37 2.00 141771.18 15.42 0.00 Within Groups 1342460.57 146.00 9194.94 Total 1626002.94 148.00
The above analysis proves Hypothesis HS3 that the extent of use of ICT for building
project management differs for the three groups of respondent organizations.
5.4.3.4 Hypothesis HS4
‘All the four groups of benefits are interrelated and cannot be achieved in isolation.’
This hypothesis was formulated in Chapter 4 after ISM analysis. Data for the above
hypothesis was collected through Section III of the questionnaire as described for
hypotheses HS1. Perceived benefits were categorized under four groups: benefits
related to effective use of Technology, effective Team Management, measures of
Project Success, and increased Organizational Efficiency. The scores for each group
of benefits were aggregated and Pearson correlation was calculated between the four
groups of benefits (Table 5.19). Data analysis shows that there is significant
correlation between the four groups of benefits.
Table 5.19: Correlation between Four Groups of Benefits
Project Success
Team Management Technology Organization
Project Success 1.000 Team Management 0.540** 1.000 Technology 0.503** 0.707** 1.000 Organization 0.452** 0.637** 0.653** 1.000 ** Correlation is significant at p<0.01level (2-tailed).
This validates the result obtained from ISM analysis and proves Hypothesis HS4 that
all the four groups of benefits are interrelated and cannot be achieved in isolation.
__________________________________________________________________________________ Page 145

Chapter 5: Questionnaire Survey Data Analysis
5.5 Status of ICT Adoption in the Indian Construction Industry
The above analysis and further study of the data helped in summarizing the status of
ICT adoption in the Indian construction industry. IT infrastructure at site has been
perceived as an important enabler for effective ICT adoption for project
management. But, data analysis showed (Fig. 5.7) that even though in majority of the
surveyed organizations, more than 80% of the office staff have access to computers,
in only about 20% organizations more than 80% site staff have access to computers.
Fig. 5.7: Percentage of office and site staff with access to computers
0.0020.0040.0060.0080.00
100.00
0-20% 20%-40% 40%-60% 60%-80% more than80%
% o
rgan
isat
ions
% office staff% site staff
Study of above data distribution led to the study of relation between ‘percentage of
site staff with access to computers’ and ‘extent of use of ICT’. One-way ANOVA
test was conducted to assess the significance of ‘Change in level of use of ICT’ with
‘Change in percentage of site staff with access to computers’. The results were found
significant (p<0.001) as shown in Table 5.20. Table 5.21 shows descriptive statistics
for the test. This analysis further supports the perception that adequate IT
infrastructure at sites is an important enabler for effective ICT adoption for project
management.
Table 5.20: Oneway ANOVA Test for Testing Relation
Between 'Percentage of Site Staff with Access to Computers' and 'Extent of ICT Adoption'
ANOVA ict_comp Sum of Squares df Mean Square F Sig.Between Groups 471133.73 4.00 117783.43 11.99 0.00Within Groups 1414524.55 144.00 9823.09 Total 1885658.28 148.00
__________________________________________________________________________________ Page 146

Chapter 5: Questionnaire Survey Data Analysis
Table 5.21: Descriptive Statistics of 'Extent of ICT Adoption' for Distribution of 'Percentage
of Site Staff with Access to Computers' ict_comp N Mean Std. Deviation Std. Error0-20% 15.00 519.40 89.33 23.06 20%-40% 21.00 526.90 105.69 23.06 40%-60% 33.00 627.27 88.96 15.49 60%-80% 45.00 671.76 87.54 13.05 more than 80% 35.00 640.86 119.92 20.27 Total 149.00 618.89 112.88 9.25
IT based communication has increased considerably in the last 5 years (Fig. 5.8). But
still the majority of the SMEs do not have a communication management strategy
(Hypothesis HD4) and their ICT adoption for building project management has not
reached a high maturity level, since it is primarily project specific and not
organization specific (Hypothesis HD5). Data analysis also highlights that extent of
ICT adoption for a project is primarily defined by the clients’ requirements
(Hypothesis HD5 and HS2) and is also affected by the variable ICT capability of the
project team organizations (Hypothesis HD5). Thus increase in ICT adoption in the
construction industry is driven by the industry requirements (Hypothesis HS2).
Fig. 5.8: Distribution of Respondent Organizations for Rate of Increase of IT based Communication in last 5
years1%
6%
14%
36%
43%
0-20%20%-40%40%-60%60%-80%more than 80%
Effective ICT adoption for building project management requires collaborative use
of ICT between different organizations. But, it was found that collaborative use of
ICT is less as compared to the internal use of ICT within the organizations and varies
between different groups of project team organizations (Hypothesis HD1).
__________________________________________________________________________________ Page 147

Chapter 5: Questionnaire Survey Data Analysis
E-tendering is not a norm in the industry. Data for assessing this feature was
collected through Section II of the questionnaire as ‘method of receiving bids’ and
‘method of conducting tender meetings and negotiations’. For each process, the
respondents could give multiple responses in five categories as shown in Fig. 5.9.
Data analysis showed that 49 (33%) organizations receive bids only as hard copies
(in 80%-100% projects), 12 (8%) as hard copies as well as e-mails and 4 (3%) only
as e-mails. Multiple responses were received from the remaining 84 organizations,
out of which, 41 (28%) organizations primarily (in 60%-80% projects) receive bids
as hard copies, 4 (3%) as hard copies and e-mails and 39 (26%) as e-mails. Thus it
can be summarized that about 61% (33% + 28%) organizations are primarily
receiving bids as hard copies only and only 29% (3% + 26%) organizations are
primarily receiving bids as e-mails only.
All the organizations conduct tender meetings and negotiations through personal
meetings.
Fig. 5.9: Distribution of Organizations for theMethod of Receiving Bids
0 5 10 15 20 25 30 35 40 45 50 55
(0-20%)
(20%-40%)
(40%-60%)
(60%-80%)
(80%-100%)
No. of orgs.
e-mailHard copy and e-mailHard copy
It is perceived that ICT adoption for building project management leads to significant
benefits (Hypothesis HS1), but extent of ICT adoption for building project
management differs for the three groups of sample organizations i.e. PMCOs,
Builders and Architectural organizations (HS3). One of the reasons identified after
data analysis is the difference in the extent of formal project management processes
adopted by these groups of organizations.
__________________________________________________________________________________ Page 148

Chapter 5: Questionnaire Survey Data Analysis
Data for studying this feature was collected through Section II of the questionnaire,
where it was identified whether organizations execute the identified time and cost
management processes. Data was collected in (Yes/No) format. As shown in Fig.
5.10, all the surveyed PMCOs execute all the identified time and cost processes.
With respect to time management processes, all the organizations prepare ‘detailed
time schedule at construction stage’, but not all the builders and architectural
organizations prepare ‘master time schedule at design stage’ and ‘performance
reports and variance analysis reports’. With respect to the cost management
processes, cost estimates are prepared by all the organizations, detailed cash flow is
prepared by almost all and the cost variance reports are prepared by lesser number of
organizations.
It can be summarized that time and cost management processes are executed in
decreasing order by PMCOs, builders and architectural organizations.
Fig. 5.10: Distribution of Organizations for formal Time and Cost Management Processes Adoption
0 20 40 60 80 100 120
Cost variance reports
Detailed cash flow req for the project
cost estimates for the project
Variance analysis reports for time schedules
Project performance reports for time schedules
Updated construction stage time schedule
Detailed time schedule at construction stage
Master time schedule prepared at design stage
% of orgs.
PMCOsBuildersArchitectural Organisations
__________________________________________________________________________________ Page 149
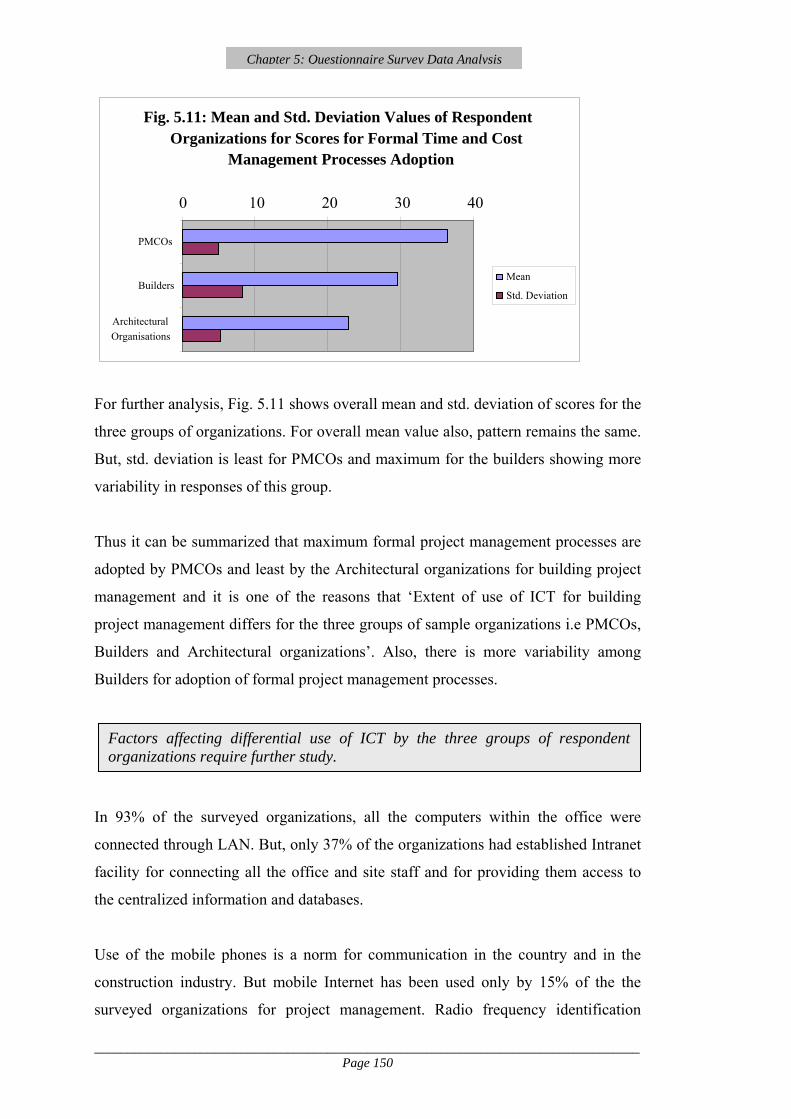
Chapter 5: Questionnaire Survey Data Analysis
Fig. 5.11: Mean and Std. Deviation Values of Respondent Organizations for Scores for Formal Time and Cost
Management Processes Adoption
0 10 20 30 40
PMCOs
MeanBuilders
Std. Deviation Architectural Organisations
For further analysis, Fig. 5.11 shows overall mean and std. deviation of scores for the
three groups of organizations. For overall mean value also, pattern remains the same.
But, std. deviation is least for PMCOs and maximum for the builders showing more
variability in responses of this group.
Thus it can be summarized that maximum formal project management processes are
adopted by PMCOs and least by the Architectural organizations for building project
management and it is one of the reasons that ‘Extent of use of ICT for building
project management differs for the three groups of sample organizations i.e PMCOs,
Builders and Architectural organizations’. Also, there is more variability among
Builders for adoption of formal project management processes.
Factors affecting differential use of ICT by the three groups of respondent organizations require further study.
In 93% of the surveyed organizations, all the computers within the office were
connected through LAN. But, only 37% of the organizations had established Intranet
facility for connecting all the office and site staff and for providing them access to
the centralized information and databases.
Use of the mobile phones is a norm for communication in the country and in the
construction industry. But mobile Internet has been used only by 15% of the the
surveyed organizations for project management. Radio frequency identification
__________________________________________________________________________________ Page 150

Chapter 5: Questionnaire Survey Data Analysis
devices (RFIDs) and bar coding have not been used by any of the surveyed
organizations for materials management. Also, no evidence of use of these
technologies was found through Literature Review and discussions with experts in
the industry. Internet enabled communication technology is in use in the industry, but
comprehensive web based project management solutions have not been adopted in
the industry. About 1% of the surveyed organizations have partially adopted web
based project management for one or two projects. After discussion with these
organizations it was found that this was primarily due to the clients’ requirements.
The method of communicating electronic information was assessed. Fig. 5.12 shows
results for the method of communicating electronic information within office and
with project sites. It was found that in 13% organizations, it is primarily through data
storage media like floppies/CDs etc., in 46% it is primarily through e-mails and in
41% both the methods are used. But, for communicating electronic information
between office and other project agencies (Fig. 5.13), only 4% organizations
primarily communicate through data storage media, 38% through internet/extranet
and 58% utilize both the methods. Thus, it cane be summarized that electronic
information is communicated not only through internet, but also through the data
storage media.
Fig. 5.12: Method of Communicating Electronic Information within Office and with Project Sites
13
4146
0
10
20
30
40
50
physical transfer offloppies/CDs ets.
via floppies/CDs andinternet/intranet
via internet/intranet
% O
rgan
isat
ions
__________________________________________________________________________________ Page 151

Chapter 5: Questionnaire Survey Data Analysis
Fig. 5.13: Method of Communicating Electronic Information between Office and other Project Agencies
4
58
38
010203040506070
physical transfer offloppies/CDs etc.
via floppies/CDs andinternet/extranet
via extranet/internet
% O
rgan
isat
ions
Majority of the respondent organizations utilize the standard software available.
Table 5.22 shows that primarily the international standard software are used in the
industry for general administration and project management processes. Only 19
organizations (about 13%) use customized software for ‘Bill of quantities
preparation, Comparative analysis of bids received, Tender preparation and Contract
management’.
Questions were included in the questionnaire to assess the perceptions of respondents
regarding importance of ‘availability of indigenously developed software
incorporating the specific construction industry requirements of the country’ and
‘availability of multilingual software and web portals’ as enablers for the increased
use of ICT for Project Management. Data analysis shows that respondents do not
consider these as important enablers (Sec. 5.6.2). Generalization of the above results
for the entire industry indicates that there is standardization in use of software within
industry and since primarily international software are used for the different
processes, technically work interface with national and international organizations
with respect to the use of software is not difficult.
__________________________________________________________________________________ Page 152
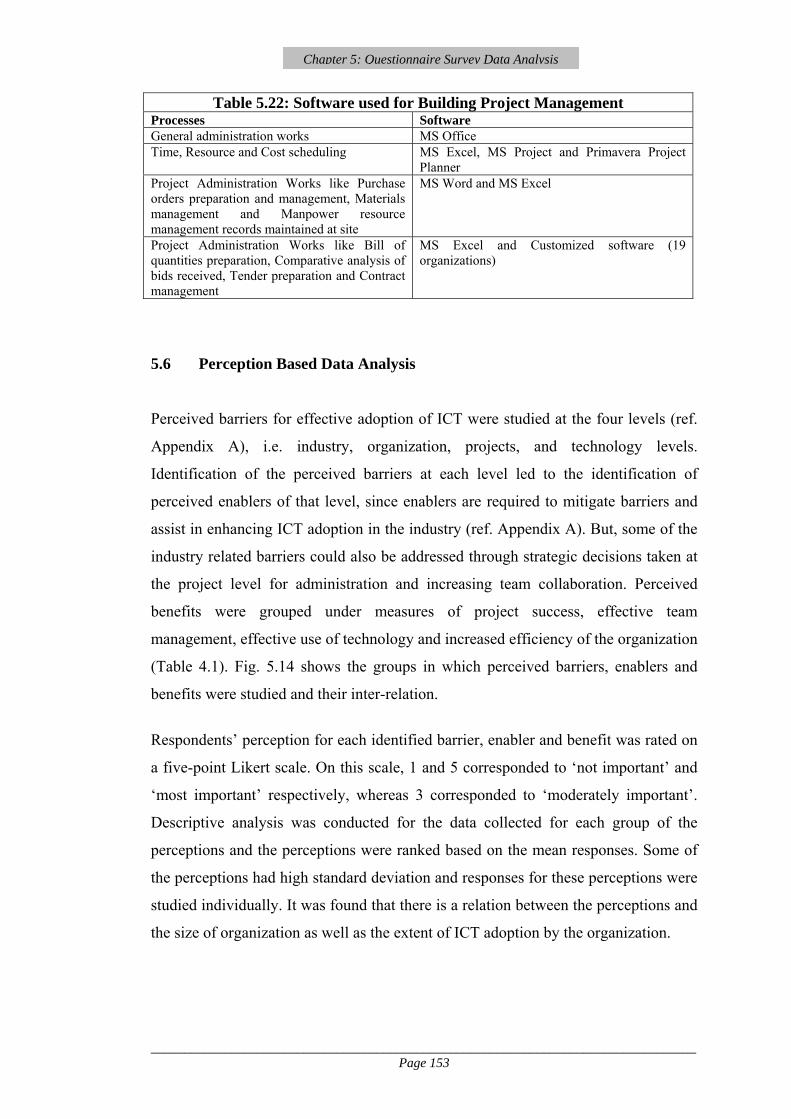
Chapter 5: Questionnaire Survey Data Analysis
Table 5.22: Software used for Building Project Management Processes Software General administration works MS Office Time, Resource and Cost scheduling MS Excel, MS Project and Primavera Project
Planner Project Administration Works like Purchase orders preparation and management, Materials management and Manpower resource management records maintained at site
MS Word and MS Excel
Project Administration Works like Bill of quantities preparation, Comparative analysis of bids received, Tender preparation and Contract management
MS Excel and Customized software (19 organizations)
5.6 Perception Based Data Analysis
Perceived barriers for effective adoption of ICT were studied at the four levels (ref.
Appendix A), i.e. industry, organization, projects, and technology levels.
Identification of the perceived barriers at each level led to the identification of
perceived enablers of that level, since enablers are required to mitigate barriers and
assist in enhancing ICT adoption in the industry (ref. Appendix A). But, some of the
industry related barriers could also be addressed through strategic decisions taken at
the project level for administration and increasing team collaboration. Perceived
benefits were grouped under measures of project success, effective team
management, effective use of technology and increased efficiency of the organization
(Table 4.1). Fig. 5.14 shows the groups in which perceived barriers, enablers and
benefits were studied and their inter-relation.
Respondents’ perception for each identified barrier, enabler and benefit was rated on
a five-point Likert scale. On this scale, 1 and 5 corresponded to ‘not important’ and
‘most important’ respectively, whereas 3 corresponded to ‘moderately important’.
Descriptive analysis was conducted for the data collected for each group of the
perceptions and the perceptions were ranked based on the mean responses. Some of
the perceptions had high standard deviation and responses for these perceptions were
studied individually. It was found that there is a relation between the perceptions and
the size of organization as well as the extent of ICT adoption by the organization.
__________________________________________________________________________________ Page 153

Chapter 5: Questionnaire Survey Data Analysis
5.6.1 Perceived Barriers
Table 5.23 shows the mean and standard deviation for perceived barriers. Study of
the ranking of the perceived barriers and enablers shows that Industry related barriers
are among the top 50% barriers. Organization related barriers are in the middle and
in lower levels. Technology related barriers are among the last 40% barriers. There is
only one project related barrier and it is in the middle.
Highest ranked barrier is ‘Poor supply-chain management of contractors, sub-
contractors, specialists and suppliers in the construction projects’. This barrier has
been considered as an Industry related barrier instead of Project related barrier,
because this issue needs to be strategically addressed at the industry level and would
provide benefits in the projects. Barriers related to basic structure of the construction
industry in terms of ‘fragmentation’, ‘lack of strategic direction’ and ‘separation of
the process of design, construction and operation and maintenance of buildings
works’ are also ranked high. ‘Initial cost’ and ‘cost of upgrading ICT infrastructure’
related barriers are the next. But, barriers related to ‘cost of training the staff or
hiring staff for new technology’ are below.
Fig. 5.14: Relation between the Groups in which the Perceptions are studied
Barriers
Industry
Projects
Technology
Organization
Enablers
Industry
Projects Administrative project issues
Team management
Technology
Organization
Construction Industry Study Levels
Benefits
Technology Industry
Organization Organization
Project Success People
Team management
__________________________________________________________________________________ Page 154

Chapter 5: Questionnaire Survey Data Analysis
Table 5.23: Descriptive Statistics – Perceived Barriers Rank Barriers Group Mean Std. Deviation
1 Poor supply-chain management of contractors, sub-contractors, specialists and suppliers in the construction projects
Industry
3.72 1.23 2 The separation of the process of design, construction and
operation and maintenance of buildings
Industry 3.70 1.23 3 Lack of strategic direction within the industry in terms of
standards and protocols that would inform any ICT investment decision
Industry
3.62 1.01 4 Fragmented construction industry having several different
organizations big and small, having different set of requirements and different level of ICT knowledge
Industry
3.59 1.14 5 Cost of keeping up to date with the technological
developments in hardware/software Organization
3.58 1.11 6 Initial cost of ICT infrastructure installation Organization 3.54 1.33 7 Non-availability of critical mass of organizations/projects
in the industry that adopt ICT Industry
3.47 1.10 8 The construction industry does not work on absolute
standards or is not dominated by one strong leader, as is the case like IBM in computers or Ford in automobiles.
Industry
3.46 1.07 9 Cost of training the staff for technological developments in
hardware/software or hiring new staff for the updated technology
Organization
3.44 1.19 10 Lack of technical standards for communication interface
between different software Technology
3.42 1.12 11 Security of data Technology 3.41 1.19 12 Senior construction professionals unwilling to adopt ICT Organization 3.19 1.51 13 Uniqueness of each construction project Projects 3.15 0.87 14 High staff turnover in construction organizations Organization 3.03 1.35 15 Non-dependability of IT Infrastructure Technology 2.87 1.18 16 Information overflow because of use of Internet as a
communication tool Technology
2.74 1.13 17 Uncertainty of benefit from use of IT based
communication Organization
2.52 1.36 This is so because, training of the staff is not prevalent in most of the construction
organizations and staff salaries in the construction industry are defined primarily by
the technical expertise of the staff and not by their ICT capability. Barrier related to
‘initial cost of ICT infrastructure’ has high standard deviation of 1.33, which
indicates that varied responses have been given by the organizations for this barrier.
After studying the responses it was found that for organizations with higher turnover
it is not an important barrier.
Barriers related to ‘non-availability of critical mass of organizations/projects in the
industry that adopt ICT’ and ‘not having an industry leader or defined industry
standards’ have middle level ranking. These barriers affect setting up or defining the
benchmark practices for ICT adoption in the industry. Technology related barriers,
__________________________________________________________________________________ Page 155
Chapter 5: Questionnaire Survey Data Analysis
such as: ‘lack of technical standards for communication interface between different
software’, ‘security of data’, ‘non dependability of ICT infrastructure’ and
‘Information overflow due to use of Internet’ are not perceived as very important
barriers, even though primarily standalone software are used for discrete
applications. The barrier related to ‘senior construction professionals unwilling to
adopt ICT’ is also low in ranking, and this fact in itself is an enabler. Mean ranks of
the barriers ‘high staff turnover in construction organizations’ and ‘uncertainty of
benefit from use of IT based communication’ are low. But, their standard deviation is
highest at 1.35 and 1.36 respectively, indicating varied perceptions for these barriers.
After studying the responses individually, it was found that the perception of these
barriers is influenced by the size of the organization. These barriers are not very
important for organizations with high turnover.
Analysis shows that available Technology in terms of ICT infrastructure is found
primarily adequate by the organizations, and high ranked barriers are Industry related
barriers or Organization related barriers. These require strategic initiatives at the
industry and organization levels.
5.6.2 Perceived Enablers
Table 5.24 shows the mean and standard deviation for the perceived enablers. Study
of the ranking of perceived enablers shows that Industry and Organization related
enablers are primarily in the top and middle levels. Technology related enablers are
in the middle and bottom ranks. Projects related enablers are distributed at all the
levels.
The project related administrative enabler of ‘planning information flow in
standardized formats’ is at the highest rank, but it has a high standard deviation of
3.43, which indicates varied perceptions. Very low importance has been given to this
enabler by the organizations that have low ICT adoption. Other project related
administrative enablers like ‘Improved IT support to construction sites’, ‘project
team members using same IT systems’, ‘each project to have a champion for
adoption of ICT and acting as the team leader’ etc. are ranked high.
__________________________________________________________________________________ Page 156

Chapter 5: Questionnaire Survey Data Analysis
Table 5.24: Descriptive Statistics – Perceived Enablers Rank Enablers Group Mean Std. Deviation
1 Information flow planned in standardized formats Projects 4.44 3.43 2 Improved IT support to construction site processes Projects 4.30 0.78 3 Development of a realistic and reliable electronic database
in the organization Organization
4.26 0.83 4 All project team members use the same IT systems for the
project Projects
4.25 0.87 5 Education of the users for effective use of ICT and its
Benefits Industry
4.23 0.89 6 Systems for better communication between office and
project sites Projects
4.23 0.87 7 Each project to have a champion for adoption of ICT and
acting as the team leader. It could be the Project Manager/owner’s project representative
Projects
4.19 0.90 8 Senior management should create an environment for
adoption of ICT within the organization Organization
4.17 0.90 9 Project scope requiring use of ICT Projects 4.16 0.94
10 Adequate and dependable conditional access systems to be provided for the automated system
Technology 4.14 0.81
11 Shared use of common databases by project team members Projects 4.13 0.88 12 Project information seamlessly transferred between all the
phases of a building project. Projects
4.13 0.84 13 Standardized drawing formats for presentation and content. Technology 4.12 0.93 14 Equal attention to be given to associated managerial issues
while conducting technical implementation Organization
4.11 0.81 15 ICT Training to be more accessible and less costly Industry 4.09 1.04 16 Increased use of 3D visualization techniques as a
communication tool Technology
4.08 1.12 17 Education of the users that ICT does not increase isolation
but enhances team working Industry
4.08 0.91 18 Widespread adoption of ICT in the construction industry Industry 4.08 0.93 19 Measuring benefits accrued by utilization of IT based
communication Organization
4.05 0.96 20 Collaboration between research and practice Industry 4.03 1.00 21 Better collaborative maturity or trust between team
members for sharing information Projects
3.97 0.88 22 Use of standardized information classification systems Technology 3.95 0.98 23 Periodicity and alternative methods of communication for
each process finalized at the start of the project Projects
3.95 0.80 24 Industry data and information bases maintained by
professional bodies and government agencies Industry
3.93 1.15 25 Software to be more user friendly and flexible Technology 3.93 0.95 26 IT communication systems developed within organizations
to be business driven Organization
3.90 1.00 27 Organization structures to be reengineered for use of ICT Organization 3.89 1.01 28 Use of common internet services by project team members Projects 3.88 1.08 29 Using web based systems also as a workspace Projects 3.84 4.22 30 Subcontractors and suppliers to be integrated formally into
communication and reporting structures Projects
3.83 1.02 31 Development of data communication and exchange
standards Technology
3.81 0.87 32 Time and cost scheduling software with increased Technology 3.74 1.07
__________________________________________________________________________________ Page 157

Chapter 5: Questionnaire Survey Data Analysis
Table 5.24 Continued capability for risk management
33 Development of interaction communication protocols, information policies, and meeting structures for online meetings.
Projects
3.65 1.13 34 Flexible/scalable systems that would help in meeting
changing demands Technology
3.64 0.99 35 Better interface between PM/scheduling software and
software utilized for other processes Technology
3.63 0.65 36 Availability of indigenously developed software
incorporating the specific construction industry requirements of the country
Technology
3.60 1.26 37 Availability of more multilingual software and web portals Technology 2.74 1.27
‘Project scope requiring use of ICT’ is at the middle level and team management
related enablers like ‘Better collaborative maturity or trust between team members
for sharing information’, ‘Shared use of common databases by project team
members’ etc. are at the middle and bottom levels. ‘Using web based systems also as
a workspace’ is a low ranked enabler but has a high standard deviation of 4.22 as
most of the respondents are not aware of the web based systems and hence do not
consider it important, but organizations with higher use of ICT consider it important.
Organization related enabler ‘Development of a realistic and reliable electronic
database in the organization’ is ranked high. Other organization related enablers are
related to strategic planning at the organization level by the senior management and
are ranked at the top and middle level. The organizations look at the professional
bodies, academicians and large organizations to take the initiatives and to educate the
users for effective use of ICT and its benefits. Other industry related enablers are
ranked at the middle level.
‘Security of data’ has been rated as a middle ranked barrier and ‘adequate and
dependable conditional access systems to be provided for the automated system’ has
been rated as a middle ranked technology related enabler. It indicates that data
security is an issue that needs consideration. Enablers related with ‘standardized
information systems’ and ‘increased use of 3D visualisation techniques’ are at the
middle level. Technology related enablers addressing requirement of ‘better interface
of different software’ and ‘indigenously developed software’ are at the bottom. This
is also assessed in the earlier sections as primarily international level standard
software are being utilized in the industry.
__________________________________________________________________________________ Page 158
Chapter 5: Questionnaire Survey Data Analysis
Analysis shows that it is important for the clients to include use of ICT in the project
scope. Some of the industry related barriers can be addressed while planning and
setting up systems at the project level. But, these systems need to be set up by a team
member who takes the lead in defining the adoption of ICT in a project. Such a
champion of adoption of ICT should also address the issues that improve team
management collaboration. All the project team organizations should develop
strategic plans aligning the adoption of ICT with their business plans and
maintaining a reliable electronic database in the organization. It is also important that
at the industry level, education and training are provided to the construction
professionals for adopting ICT.
5.6.3 Perceived Benefits
Table 5.25 shows the mean and standard deviation for the perceived benefits.
Descriptive statistics showed that all the groups of benefits have been considered
equally important and overall it is perceived that the adoption of ICT leads to
significant benefits. t-test of significance was conducted and the results were found
significant (Hypothesis HS1).
‘Effective communication management’ is considered as the most important benefit.
‘Project completion on time and as per the estimated budget’ are also high ranked
benefits, ‘project completion as per the specifications’ is ranked low, because it is
perceived that there are other factors also that drive this benefit. Benefits of adoption
of ICT also lead to ‘client satisfaction’. Benefits related to ‘greater management
control’, ‘effective joint decision-making’ and ‘change management’ are also
important. ‘Effective contract management’ benefit is medium ranked since adoption
of ICT partially drives this benefit. ‘Flow of accurate information’ is ranked in the
middle, but it has high standard deviation since some respondents were of the view,
that, even if ICT is adopted, accuracy of information cannot be achieved unless input
data is accurate, which further stresses the requirement of training and education.
__________________________________________________________________________________ Page 159

Chapter 5: Questionnaire Survey Data Analysis
Table 5.25: Descriptive Statistics – Perceived Benefits Rank Benefits Group Mean Std. Deviation
1 Effective communication management between project team members
Team management 4.54 0.61
2 Project completion as per the estimated time Projects 4.50 0.82 3 Project information obtained in real time Projects 4.45 0.83 4 Project completion as per the estimated budget Projects 4.35 0.82 5
Greater management control Team
management 4.29 0.78 6 Client satisfaction Projects 4.28 0.78 7 Improved capability of the system to cross reference to
other correspondence Technology
4.27 0.73 8 Effective collaboration and coordination between project
team members Team
management 4.26 0.70 9 Reduced risk of errors and rework on projects Projects 4.25 0.88
10 Multilocational availability of information Technology 4.23 0.91 11 “One-source” documentation archive maintained for
clients Projects
4.19 0.93 12 Useful information compiled and disseminated to other
projects Organization
4.17 0.75 13 Better information assessment and management within the
organization Organization
4.15 0.98 14 Richer information is made available to managers Projects 4.15 0.84 15 Effective concurrent construction management Projects 4.13 0.93 16 Increase in overall organizational efficiency Organization 4.05 0.96 17 Effective contract management Projects 4.01 1.00 18
Effective joint decision making Team
management 4.00 0.87 19 Effective change management Projects 3.99 0.97 20 A complete log of all communications maintained for
tracking purposes Projects
3.99 0.85 21 Ease of retrieval of information Technology 3.99 0.99 22 Project managers can spend more time on managerial work Projects 3.99 0.99 23 Flow of accurate information Technology 3.98 1.11 24 Less time spent in query and approval process Projects 3.91 0.95 25 Increased information portability in the ICT environment Technology 3.86 0.94 26 Effective material procurement and management Projects 3.85 0.94 27 Life cycle concept becomes a competitive factor Projects 3.83 0.89 28 Reduced hard copy filing/storage of documents/drawings Technology 3.81 1.21 29 Project completion as per the specifications Projects 3.70 1.08 30
Motivation of the workforce Team
management 3.66 1.25 31 Reduced administrative costs of document handling and
distribution to multiple parties Projects
3.56 1.33
The majority of the respondents perceive that adoption of ICT does not lead to
substantially ‘reduced hard copy filing/storage of documents/drawings for the
projects’ and ‘reduced administrative costs of document handling and distribution to
multiple parties’. This perception has also been validated by the data analysis shown
in Sec. 5.7. Almost all the surveyed organizations keep hard copy backup of
__________________________________________________________________________________ Page 160
Chapter 5: Questionnaire Survey Data Analysis
documents along with the electronic copy, and all good for construction documents
and drawings have to be sent as signed hard copies. But high standard deviations of
these benefits show that some organizations do perceive these benefits as important.
As discussed in the introduction to the research area, in the context of this research,
effective adoption of ICT can be defined by the extent to which ICT adoption
reduces human resources, time and cost for managing information for building
project management processes. As per the results discussed above, time of
communicating information is perceived to have reduced. But, since hard copy
storage of data has not reduced, human resources, cost and time related with
managing information have not reduced.
5.6.4 Scenario Building for the Industry
Each organization’s data was studied for the cumulative responses of perceived
barriers and benefits. Based on these cumulative responses, scenario building has
been done for the level of ICT adoption for building project management in the
industry with respect to the perceptions.
The study included 17 identified barriers and importance of each barrier is rated on a
5 point Likert scale with scores 1-5 (Sec. 5.6.1). Thus, cumulative score of the
barriers for any organization could range from 17-85. Considering equal range
grouping, cumulative scores of 17-39 are considered as low, 40-62 as medium and
63-85 as high. The study included 31 identified benefits (Sec. 5.6.3) and cumulative
scores of benefits for any organization could range from 31-155. Considering equal
range grouping, cumulative scores of 31-72 are considered as low, 73-113 as
medium and 114-155 as high. The matrix in Fig. 5.15 shows the distribution of the
surveyed organizations for low, medium and high perceptions of the barriers and the
benefits and results of the scenario building. The definition of high and low ICT
adoption is in reference to ICT adoption by SMEs in the Indian construction industry
where the questionnaire survey was conducted.
__________________________________________________________________________________ Page 161

Chapter 5: Questionnaire Survey Data Analysis
Hig
h ICT adoption – High level Future planning – Planning for higher adoption of ICT
(71) 47.65% ICT adoption – Medium level Future planning – Planning for higher adoption of ICT
(22) 14.76% ICT adoption – Medium level Future planning – Planning for higher adoption of ICT
Med
ium
(53) 35.57% ICT adoption – Medium level Future planning – Not planning for higher adoption of ICT
(3) 2.01% ICT adoption – Low level Future planning – Not planning for higher adoption of ICT
Ben
efits
Low
Low Medium High Barriers
Fig. 5.15: Matrix with the Distribution of Organizations for Different Levels of Perceptions of Barriers and Benefits and Results of Scenario Building
53 (35.57%) organizations perceive medium level barriers and benefits. Thus, if not
driven by the industry requirements, these organizations would be medium level
adopters of ICT. They would also not be planning for high level adoption of ICT, as
they perceive only medium level benefits. 3 (2.01%) organizations perceive high
barriers and medium benefits. By default, ICT adoption in these organizations would
be low. 71 (47.65%) organizations perceive high benefits and medium level barriers.
ICT adoption in these organizations would be in the middle level, but these
organizations would be planning for the further increased use as they perceive high
benefits. 22 (14.76%) organizations would like to increase the ICT adoption in their
organizations because they perceive high benefits, but perception of high barriers
would define their present use and future planning for ICT adoption.
There are no organizations in the survey that perceive low barriers or low benefits of
effective adoption of ICT for building project management. The scenario building
results can be summarized as given below.
An organization’s ICT adoption would be of high level, only if the senior
management perceives low barriers and high benefits.
__________________________________________________________________________________ Page 162

Chapter 5: Questionnaire Survey Data Analysis
5.7 Cultural Factors
Four cultural factors were identified after data analysis.
‘Non-dependability of IT infrastructure’ is not considered as an important barrier for
effective adoption of ICT. But:
Cultural Factor 1: Communication in which e-mail is followed by phone calls is
significant.
Cultural Factor 2: Hard copy storage of data and documents is substantial even if
electronic copies are also kept as a backup.
Cultural Factor 3: Most of the e-mails are followed by hard copies.
Data analysis for above identified factors was conducted in following four stages:
Stage 1
Section I of the questionnaire collected data for the percentage of e-mail
communication followed by phone calls for the identified general administration
processes. Information was collected at a five-point interval scale, with scores 1-5.
the aggregate score for each organization was calculated by the summation of scores
for all the processes and represented by the variable ‘emailpho’. t-test was conducted
and the variable was found significant (p<0.001) (Table 5.27).
Table 5.26: Mean and Std. Deviation for Test Variable ‘emailpho’
One-Sample Statistics N Mean Std. Deviation Std. Error Mean emailpho 149.000 14.886 4.890 0.401
Table 5.27: t-test Results for Communication in which e-mail is followed by Phone Call
One-Sample Test Test Value = 12
95% Confidence Interval of the
Difference t df Sig. (2-tailed) Mean Difference Lower Upper emailpho 7.204 148.000 0.000 2.886 2.094 3.678 The mean and standard deviation of the test variable are also shown in Table 5.26.
__________________________________________________________________________________ Page 163

Chapter 5: Questionnaire Survey Data Analysis
Stage II
Section II of the questionnaire assessed the mode of information storage separately
for the head office and the site offices. The methods of storing documents,
drawings/design details, time schedules and cost schedules at the head office and site
offices were assessed separately (ref. Appendix A). It was assessed at a three-point
scale of hard copy, hard copy and electronic copy, and electronic copy, scaled at 1, 2
and 4 scores respectively. Thus aggregate scores for each organization could range
from 4-16 for the head office as well as for the site offices. Table 5.28 shows the
descriptive statistics of aggregate scores for head offices and site offices.
Table 5.28: Mode of Information Storage
Min. Max. MeanStd.
Deviation Site offices 4 14 6.81 1.99 Head Offices 4 16 8.09 1.49 Total 8 30 14.90 2.90
The data analysis showed that at the head offices as well as at the sites, information
is primarily stored as hard copies as well as electronic copies. But, there are some
organizations, which keep only hard copy backups at head offices and at sites,
though more organizations keep only hard copy backups at sites. It is also indicated
by the difference in the mean values. Some organizations store information only as
electronic copies also at the head office.
Stage III
Section I of the questionnaire assessed the mode of communication for general
administration works and Section II assessed the mode of communication for the
building project management processes. During the pilot survey it was analyzed that
construction organizations use multiple IT tools for data analysis and multiple data
communication methodologies. Thus, questionnaire was designed for multiple data
collection.
Section I assessed communication methodology for 6 categories of general
administration information and for each category it was assessed how much
percentage of information was communicated through hard copies and e-mails. Data
__________________________________________________________________________________ Page 164
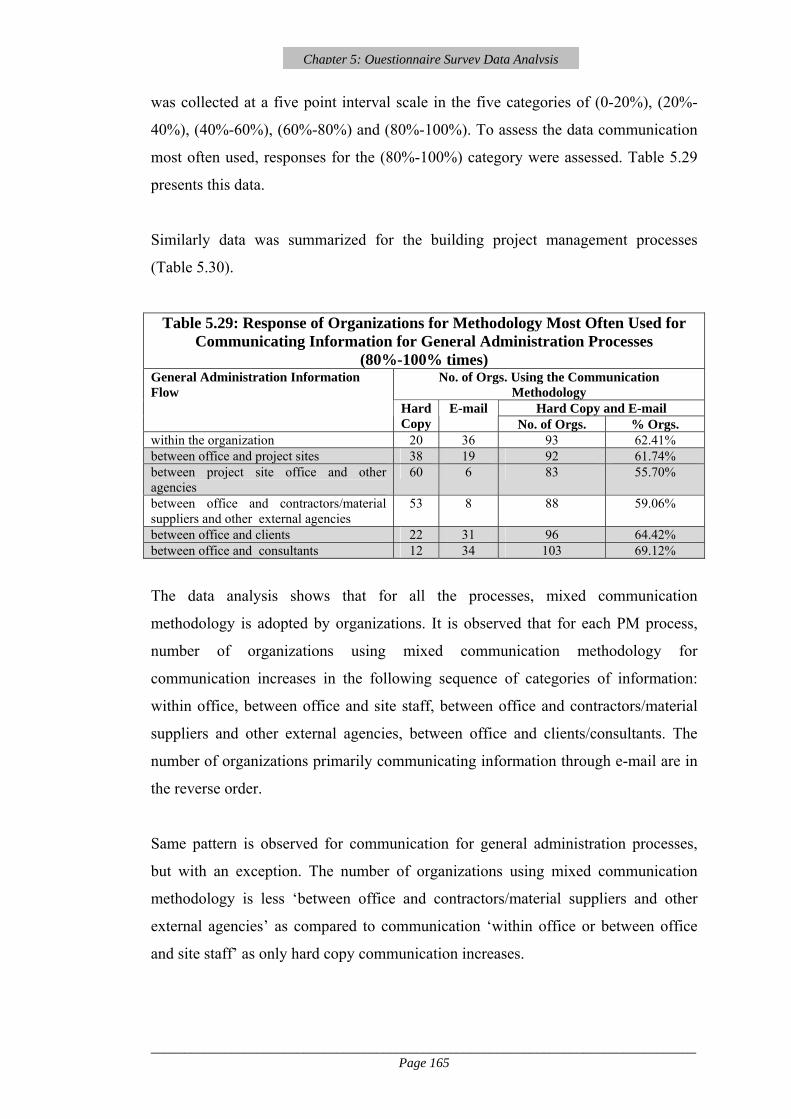
Chapter 5: Questionnaire Survey Data Analysis
was collected at a five point interval scale in the five categories of (0-20%), (20%-
40%), (40%-60%), (60%-80%) and (80%-100%). To assess the data communication
most often used, responses for the (80%-100%) category were assessed. Table 5.29
presents this data.
Similarly data was summarized for the building project management processes
(Table 5.30).
Table 5.29: Response of Organizations for Methodology Most Often Used for Communicating Information for General Administration Processes
(80%-100% times) No. of Orgs. Using the Communication
Methodology Hard Copy and E-mail
General Administration Information Flow
Hard Copy
E-mail No. of Orgs. % Orgs.
within the organization 20 36 93 62.41% between office and project sites 38 19 92 61.74% between project site office and other agencies
60 6 83 55.70%
between office and contractors/material suppliers and other external agencies
53 8 88 59.06%
between office and clients 22 31 96 64.42% between office and consultants 12 34 103 69.12%
The data analysis shows that for all the processes, mixed communication
methodology is adopted by organizations. It is observed that for each PM process,
number of organizations using mixed communication methodology for
communication increases in the following sequence of categories of information:
within office, between office and site staff, between office and contractors/material
suppliers and other external agencies, between office and clients/consultants. The
number of organizations primarily communicating information through e-mail are in
the reverse order.
Same pattern is observed for communication for general administration processes,
but with an exception. The number of organizations using mixed communication
methodology is less ‘between office and contractors/material suppliers and other
external agencies’ as compared to communication ‘within office or between office
and site staff’ as only hard copy communication increases.
__________________________________________________________________________________ Page 165

Chapter 5: Questionnaire Survey Data Analysis
Table 5.30: Response of Organizations for Methodology Most Often Used for Communicating Information for Building Project Management Processes
(80%-100% times) No. of Orgs. Using the Communication
Methodology Hard Copy and E-mail
Project Management Processes No. of Orgs.
Conducting the Process
Hard Copy
E-mail No. of Orgs.
% Orgs.
Master time schedule at design stage within office 8 75 41 33.06% between office and clients/consultants
124 35 9 80 64.51%
Detailed time schedule of works at construction stage within office 15 90 44 29.53% between office and site staff 32 54 63 42.28% between office and contractors/material suppliers and other external agencies
34 28 87 58.38%
between office and clients/consultants
149
38 5 106 71.14%
Updated construction stage time schedules within office 19 80 46 31.72% between office and site staff 40 49 56 38.62% between office and contractors/material suppliers and other external agencies
34 19 92 63.44%
between office and clients/consultants
145
41 4 140 96.55%
Project performance reports for time schedules within office 13 74 47 35.07% between office and site staff 28 52 54 40.29% between office and contractors/material suppliers and other external agencies
43 23 68 50.74%
between office and clients/consultants
134
36 8 90 67.16%
Variance analysis reports for time schedules within office 7 63 34 32.69% between office and site staff 14 49 41 39.42% between office and contractors/material suppliers and other external agencies
26 21 57 54.80%
between office and clients/consultants
104
22 2 80 76.92%
Cost estimates for the project within office 3 93 53 35.57% between office and clients/consultants
149 13 11 125 83.89%
Detailed Cost schedule/cash flow for the project within office 10 82 53 36.55% between office and site staff 24 75 46 31.72% between office and contractors/material suppliers and other external agencies
38 42 65 44.82%
between office and clients/consultants
145
25 8 112 77.24%
__________________________________________________________________________________ Page 166

Chapter 5: Questionnaire Survey Data Analysis
Table 5.30 Continued Cost variance reports within office 9 78 38 30.40% between office and site staff 16 61 48 38.40% between office and contractors/material suppliers and other external agencies
24 40 61 48.80%
between office and clients/consultants
125
15 11 99 79.20%
Design changes by different consultants communicated to consultants and clients
149 11 53 85 57.04%
Stage IV
The perceived barriers and benefits of effective adoption of ICT were identified from
the literature and after discussion with the experts in the industry. Section III of the
questionnaire assessed the importance of each identified perceived barrier and
benefit as described in Secs. 5.7.1 and 5.7.3. ‘Non-dependability of IT infrastructure’
is not perceived as an important barrier with the mean value of 2.87 and ‘Reduced
Hard copy filing/storage of documents/drawings for the projects’ is perceived as
moderately important benefit with the mean value 3.81 (Table 5.31). This validates
the Stage II analysis that information is still primarily stored as hard copy as well as
electronic copy.
Table 5.31: Descriptive Statistics for the Perceived Factors
Perceptions Mean Std.
Deviation
Non-dependability of IT Infrastructure 2.87 1.18 Reduced Hard copy filing/storage of documents/drawings for the projects 3.81 1.21
Above 4 stages of data analysis support that these are cultural factors which require
consideration: even though IT infrastructure is found dependable, most of the e-mails
are followed by phone calls for confirmation of receipt of e-mails and fast decision
making and the hard copy storage of documents at head offices is still substantial and
has not reduced even if the electronic data back up is maintained. At the site offices,
information is primarily stored as hard copies. Also, most of the e-mails are followed
by hard copies.
__________________________________________________________________________________ Page 167

Chapter 5: Questionnaire Survey Data Analysis
Cultural Factor 4: Personal meetings are still preferred over teleconferences and
other e-meeting solutions for managing building construction
projects.
This cultural factor has been found significant as Hypothesis HD6 and this cultural
factor of the Indian construction industry is a reflection of the Indian society.
Gudykunst (1991, p.51) suggests that members of low-context and individualistic
cultures tend to communicate in a direct fashion while members of the high-context
collectivistic cultures tend to communicate in an indirect fashion (Tone 2005). Indian
society falls in the second category and indirect communication could be understood
as communication substantially transmitting tacit information and achieved by
meeting personally. Thus, in the present scenario, with dependable IT infrastructure
available, substantial paper information is communicated through e-mail, but
personal meetings are still preferred over teleconferences and other e-meeting
solutions for managing building construction projects.
5.8 Issues Identified from the Open Ended Questions
The respondents were asked to list any capacity, functionality or performance issues
that are required to be addressed for the head office and the site office IT systems. It
was an open-ended question included in the Section I of the questionnaire to identify
more issues considered important by the respondents regarding ICT adoption. 30%
respondents identified issues for the head offices and 30% for the site offices. Table
5.32 shows the identified issues.
Study of the identified issues indicates that the managerial or strategic planning
issues as well as the technical issues require attention at the organization level for
effective adoption of IT infrastructure for communication as well as for other
functions.
__________________________________________________________________________________ Page 168

Chapter 5: Questionnaire Survey Data Analysis
Table 5.32: Identified Issues that are required to be Addressed At Head Office At Site Offices
Managerial Issues Systems should be periodically upgraded Systems should be periodically upgraded Software should be periodically upgraded Software should be periodically upgraded Key site staff should be more IT aware and
proficient Technical Issues
Latest virus scans required to counter the problem of viruses getting in the systems through Internet
Faulty telephone connection in far-off project sites
Data Security system should be adequate Connectivity through Internet is poor in remote project sites and downtimes are very high
Online access of large drawings requires attention
Data security issues need to be addressed
Frequent slowdown of server needs to be addressed
5.9 Findings of Data Analysis and Further Analysis Requirement
The questionnaire survey data analysis discussed in this chapter was quantitative data
analysis. It led to the following findings in conformity with the purposes of
conducting the questionnaire survey.
5.9.1 Identified Issues for Actions Required at the Level of Industry,
Organization or People
1. Use of ICT is primarily defined by the clients’ requirements.
All the surveyed organizations perceived that ICT adoption for building project
management leads to significant benefits and the rate of increase of ICT adoption for
project management in last 5 years has been found considerable. But SMEs’ ICT
adoption for project management has not reached a high maturity level, since
majority of the surveyed organizations do not have a communication management
strategy and their ICT adoption is primarily project specific and not organization
specific. Also, ICT adoption for projects is primarily defined by the clients’
requirements. Increase in ICT adoption in the construction industry is driven by the
industry requirements. Most important perceived driver is increased requirement of
the clients for more project information resulting in the increased adoption of ICT.
Action required: Industry level
__________________________________________________________________________________ Page 169
Chapter 5: Questionnaire Survey Data Analysis
2. Strategic initiatives are required to be taken by the professional bodies
and large organizations in the industry.
Study of data regarding perceived barriers and enablers shows that strategic
initiatives are required to be taken by the professional bodies and large organizations
in the industry: to address administrative and managerial issues; to provide training
and education to the construction students and executives; to create an atmosphere in
the industry for collaborative maturity or trust between the project team members for
sharing information; to prepare electronic databases which should be available for
the SMEs within the industry; to develop integrated systems for information sharing
in the industry; and to initiate standardization of data etc.
In this aspect, example of the Japanese construction industry is relevant. As reported
by Pena Mora and Tanaka (2002), during the Bubble Economy, an unprecedented
business boom of 1980s, general contractors in the country streamlined their work
processes and workforce to cope with the increased number of construction projects.
They also invested in the IT infrastructure and to make the most of it, they promoted
research and development (R&D) and experienced increase in productivity, which
further pushed the purchase of new technology and the need for more R&D, creating
a reinforcing loop. Consequently, the Bubble Economy provided Japanese general
contractors an opportunity to reinforce IT infrastructures. In addition, the Bubble
Economy provided Japanese general contractors a chance to apply appropriate IT
systems in order to utilize their infrastructures and resources. For example, Kajima
established the KI (Kajima Intelligent) network system as an information
infrastructure that allows high-speed digital data transfer inside Kajima. To
summarize, although the Japanese general contractors experienced financial
difficulties after the collapse of the Bubble Economy, the investments that the
contractors had made during the time provided a good foundation on which later IT
investments could flourish.
Similar industry level strategic initiatives are required to be taken in the Indian
construction industry.
Action required: Industry level
__________________________________________________________________________________ Page 170

Chapter 5: Questionnaire Survey Data Analysis
3. Large organizations and professional bodies are required to take a pro-
active approach and establish benchmark practices for ICT adoption for
building project management.
Study of Industry drivers shows that at present there is increased construction
activity in the country driving high ICT adoption and there is also increased
involvement of geographically separated agencies. As per data analysis, construction
executives perceive that Industry level initiatives are very important. This analysis
and literature review identifies that this is the scenario in which benchmark practices
for use of ICT should be established.
Action required: Industry level
4. Cost of IT infrastructure is perceived high by SMEs.
Majority of the organizations consider high cost of ICT infrastructure and the cost of
upgrading for latest software/hardware as an important barrier for effective adoption
of ICT. This affects collaborative work required for the construction projects. Thus,
cost of IT infrastructure should be made affordable for SMEs through incentives
Action required: Industry level
5. Connectivity through Internet is poor in remote project sites and
downtimes are very high.
National level bodies should set up forums for providing consultancy to SMEs for
adopting appropriate technological solutions for the remote project sites.
Action required: Industry level
6. Collaborative use of ICT is less as compared to internal use of ICT
within the organizations.
Building project management requires collaborative working and collaborative use of
ICT. But, data analysis shows that the collaborative use of ICT is significantly less as
compared to the internal use of ICT in the Indian construction industry.
Action required: Industry and organization level
7. For high-level ICT adoption, organizations or the people should perceive
high benefits and low barriers for effective adoption of ICT for building
project management.
__________________________________________________________________________________ Page 171

Chapter 5: Questionnaire Survey Data Analysis
Surveyed Organizations perceive medium to high-level barriers and benefits of ICT
adoption. Perceptions of the individuals for use of technology are defined by their
education/training and experience of using that technology.
Action required: Industry and organization level
8. Training and education of construction students and executives is
important.
‘Education of users for effective use of ICT and its benefits’ and ‘More accessible
and less costly ICT training for executives’ are important enablers for increasing
effective adoption of ICT for building project management. But the former enabler
has a higher ranking. It shows that there is paucity of avenues for training students
and executives and such avenues are required to be setup.
Action required: Industry and organization level
9. Use of higher technology is required.
Majority of the organizations have LAN connection, but very few have Intranet
facility. Personal meetings are still preferred over teleconferencing and
videoconferencing is still not a norm in the industry. Electronic information is
communicated not only through Internet, but also through the data storage media.
Mobile Internet is being used by few organizations and comprehensive web based
project management has also not been adopted in the industry. Use of higher
technologies like RFIDs and bar coding for materials management have not been
initiated in the construction industry, even though in India, in other industries like
manufacturing and retail industries it is a norm.
Action required: Industry and Organization level
10. Extent of use of ICT for building project management differs for three
groups of sample organizations i.e. PMCOs, Builders and Architectural
organizations and decreases in this order.
This issue was found valid in hypothesis HS3. Data analysis identified differential
adoption of formal project management processes in three groups of organizations as
one of the reasons leading to differential use of ICT for building project management
by three groups of organizations. More reasons and factors require further study.
Action required: Industry and Organization level
__________________________________________________________________________________ Page 172

Chapter 5: Questionnaire Survey Data Analysis
11. Organizations should have a communication management strategy for
the organization and for each project.
Organizations should strategically plan for the future use of ICT by their
organizations. The plans should be aligned with their business plans. Methodologies
should be developed for quantifying benefits of ICT adoption and senior
management should champion the cause of ICT adoption in their organizations. For
each building project, communication management plans should be developed,
defining formats and periodicity of the reports, meeting schedules and
communication methods to be used for each process.
Some respondents have identified managerial or strategic planning issues as well as
technical issues, which require attention at the organization level.
Action required: Organization level
12. IT infrastructure at the project sites and IT capability of the site staff is
an important factor and needs improvement in the Indian construction
industry.
IT infrastructure at the project sites and IT capability of the site staff is a factor that
needs consideration and it has been found that organizations with higher percentage
of site staff with access to computers have higher ICT adoption. But, data analysis
showed that even though in majority of the surveyed organizations, more than 80%
of the office staff has access to computers, in only about 20% organizations more
than 80% of the site staff has access to computers. This factor is also reflected in the
results that the collaborative use of ICT is less as compared to the internal use of ICT
within the organization as collaborative use would be more at the construction stage
and would involve the site office.
This factor is also supported by the analysis conducted to identify the cultural factors
(Sec. 5.7). Data analysis showed that at the head offices as well as at the sites,
information is primarily stored as hard copies as well as electronic copies. Some
organizations keep only hard copy backups at head offices and at sites, though more
organizations keep only hard copy backups at sites. Also, for each identified PM
process, number of organizations using mixed communication methodology (i.e hard
__________________________________________________________________________________ Page 173

Chapter 5: Questionnaire Survey Data Analysis
copy + e-mail) are more for communication ‘between office and site staff’ as
compared to the communication ‘within office’.
Action required: Organization level
13. E-tendering is not a norm in the industry.
Data analysis summarized that about 61% respondent organizations are primarily
receiving bids as hard copies only and only 29% organizations are primarily
receiving bids as e-mails only. All the organizations conduct tender meetings and
negotiations through personal meetings. This is an industry level trend, but requires
action at the organization level.
Action required: Organization level
5.9.2 Cultural Factors that are required to be considered.
Every regional area has distinct cultural factors that are required to be considered for
technology diffusion in an industry in that area. Following cultural factors have been
identified in data analysis.
C1: Communication in which e-mail is followed by phone calls is significant
C2: Hard copy storage of data and documents is substantial even if electronic copies
are also kept as a backup
C3: Most of the e-mails are followed by hard copies.
C4: Personal meetings are still preferred over teleconferences and other e-meeting
solutions for managing building construction projects.
Fig. 5.16 summarizes the identified issues and cultural factors at each level of study.
__________________________________________________________________________________ Page 174

Chapter 5: Questionnaire Survey Data Analysis
5.9.3 Issues that require Further Study
1. The extent of use of ICT for building project management differs for three
groups of sample organizations i.e PMCOs, Builders and Architectural
organizations and decreases in this order (Further discussed in Sec. 6.7.2).
2. Validation of the identified cultural factors and dimensions of other factors
that require qualitative assessment.
Data analysis results were found significant. Thus, based on the data analysis results
of the questionnaire, a benchmarking framework was developed for rating
construction organizations for ICT adoption for building management. It is discussed
in Chapter 7.
Fig. 5.16: Identified Issues and Cultural Factors
Issues that Require Action at the Industry Level 1. Use of ICT is primarily defined by clients’ requirements 2. Strategic initiatives are required to be taken by the professional bodies and large
organisations in the industry 3. Large organizations and professional bodies are required to take a pro-active approach and
establish benchmark practices for use of ICT for building project management 4. Cost of IT infrastructure is perceived high by SMEs 5. Connectivity through Internet is poor in remote project sites and downtimes are very high
Issues that Require Action at Industry and Organization Levels 6. Collaborative use of ICT is less as compared to internal use of ICT within the organizations 7. For high-level use of ICT, organizations or the people should perceive high benefits and
low barriers for effective use of ICT for building project management 8. Training and education of construction students and executives is important 9. Use of higher technology is required 10. Extent of use of ICT for building project management differs for three groups of sample
organizations i.e PMCOs, Builders and Architectural organizations and decreases in this order.
Issues that Require Action at the Organization Level 11. Organizations should have a communication management strategy for the organization and
for each project 12. IT infrastructure at project sites and IT capability of site staff is an important factor and
needs improvement in the Indian construction industry 13. E-tendering is not a norm in the industry
Cultural Factors to be considered at the Level of Organization and People C1. Communication in which e-mails sent by a construction professionals are followed by
phone calls are significant C2. Hard copy storage of data and documents in organizations is substantial even if electronic
copies are also kept as a backup C3. Most of the e-mails communicated from an organization are followed by hard copies C4. Personal meetings are still preferred by construction professionals over teleconferences and
other e-meeting solutions for managing building construction projects
__________________________________________________________________________________ Page 175

__________________________________________________________________________________ Page 176
Chapter 5: Questionnaire Survey Data Analysis
5.10 Summary
The questionnaire survey data analysis discussed in this chapter tested two groups of
hypotheses, and studied formal project management processes conducted in the
industry and ICT adoption for these processes. Data analysis also helped in:
determining the status of adoption of ICT tools and technologies in the industry;
identifying issues that need action at industry and organization levels; identifying
cultural factors; identifying importance of perceived benefits, barriers and enablers
for effective ICT adoption and issues that require further study. Significant data
analysis results led to the development of a benchmarking framework, which is
discussed in Chapter 7. Structural Equation Modeling Analysis on the questionnaire
survey data is discussed in Chapter 6.

__________________________________________________________________________________
Page 177
Chapter 6: SEM Analysis on Questionnaire Survey Data
CHAPTER 6
STRUCTURAL EQUATION MODELING ANALYSIS ON
QUESTIONNAIRE SURVEY DATA
6.1 Introduction
In this chapter, the Structural Equation Modeling (SEM) technique has been applied to
test the causal relationships between the identified factors affecting the extent of
adoption of ICT by SMEs for building project management. Analysis has been
conducted on the questionnaire survey data. Hypotheses testing the causal relationships
were formulated in Chapter 3 and 4 and the structural model derived from these
hypotheses is tested. Findings and observations from the analysis are reported.
6.2 Structural Model Derived from the Hypotheses of Causal Relationships
Structural model of causal relationships between quantifiable factors affecting ICT
adoption for building project management was derived from the ‘Hypotheses of causal
relationships’ formulated in Chapter 3 and 4. For a quick reference, these hypotheses are
presented below.
HR2: Increased use of advanced software for individual functions or processes
positively affects ICT adoption for communicating information with respect to
those processes.
HR3: Geographical separation of project team members positively affects ICT
adoption for building project management processes.
HR4: Perceived benefits of ICT adoption positively affect ICT adoption for building
project management processes.

__________________________________________________________________________________
Page 178
Chapter 6: SEM Analysis on Questionnaire Survey Data
HR5: Perceived barriers for effective ICT adoption negatively affect ICT adoption for
building project management processes.
HR6: Increased ICT adoption for general administration positively affects use of
advanced software for individual building project management processes.
HR7: Geographical separation between the project team members positively affects
ICT adoption by organizations for general administration works.
HR8: Perceived benefits of ICT adoption positively affect ICT adoption by
organizations for general administration works.
HR9: Perceived barriers for effective ICT adoption negatively affect ICT adoption by
organizations for general administration works.
Structural Model derived from these hypotheses is shown in Fig. 6.1. Nomenclature for
the macro variables or the factors is as shown in Chapter 3 (Table 3.1).
SEM has been utilized as a confirmatory analysis technique to test Hypotheses HR2 and
HR6, where the objective was to determine the strength and the significance of the
relationships among the specified factors. But, it has been used as an exploratory
technique to test Hypotheses HR3 - HR5 and HR7 - HR9 that leads to the final model
building. A systematic, iterative process was used to determine which paths and factors
should be eliminated from the hypothesized model. Item elimination was based on weak
loadings, path significance and theoretical determination.
6.3 Model Specification
The hypothesized model is a recursive model. Details of the model specifications are
shown in Table 6.1 and the hypothesized model is shown in Fig. 6.2. The measurement
of each of the factors was operationalised using a set of questions in the questionnaire.
Since the questionnaire was developed based on a detailed review and understanding of
the factors, it was ensured that the contents of the factors were adequately addressed.
The micro variables measuring the factors are as listed in Table 3.1. Factor OF5 is

__________________________________________________________________________________
Page 179
Chapter 6: SEM Analysis on Questionnaire Survey Data
measured directly by two questions of the questionnaire, while indicators of the other
five factors are composite variables presenting aggregate data of multiple questions from
the questionnaire. IT infrastructure maturity is measured in Factor OF3 as it is necessary
to support the use of ICT. Thus, it is a supportive investment and is required to be
measured.
Factors OF5, PF2 and PF3 are exogenous variables. Factors OF3, OF4 and the Final
factor are endogenous variables in the path model and have a disturbance (dn) attached
with each of them. The disturbances represent all causes of an endogenous variable that
are not explained by the presumed causes and are omitted from the model (Kline, 1998).
The indicators or the micro variables are attached with unique variances, i.e. the
indicator variances unexplained by the factors. Such variance is termed as measurement
error (en). Like disturbances in the path models, measurement errors are proxy variables
for all the sources of residual variance that are not explicitly represented in the model
(Kline 1998, p.58).
In the hypothesized model, 39 free parameters were estimated with 66 degrees of
freedom.
Fig. 6.1: Structural Model Derived from the Hypotheses of Causal Relationships
Factor OF4: Use of
advanced software for
individual PM processes
Factor OF3: Use of
ICT for general
administration
Factor OF5: Geographical
separation of project team
members
Final Factor: Use of ICT
for Building Project
Management
Factor PF2:
Perceived
Benefits
Factor PF3:
Perceived
Barriers
HR7 HR3 HR4
HR8
HR5 HR9
HR6 HR2

__________________________________________________________________________________
Page 180
Chapter 6: SEM Analysis on Questionnaire Survey Data
Table 6.1: Model Specification Micro variables/Indicators/Manifest variables Factors
Label Description
geo_sep1 Percentage of projects on which the
organization has interacted with
geographically separated agencies
within India in last 5 years
OF5: Geographical separation of project team
members
geo_sep2 Percentage of projects on which the
organization has interacted with
overseas agencies in last 5 years
ben_tete Benefits related to effective team
management and use of technology
PF2: Perceived benefits of ICT adoption for building
project management
ben_orgp Benefits related to increased
organizational efficiency and
measures of project success
bar_ind Industry related barriers PF3: Perceived barriers for effective ICT adoption
for building project management bar_teop Technology, organizations and
projects related barriers
ictgeni Infrastructure maturity for use of ICT
for general administration
OF3: Use of ICT for general administration
ictgenu Extent of use of ICT for general
administration
tim_too IT Tools utilized for Project Time
Management processes
cos_too IT Tools utilized for Project Cost
Management processes
OF4: Use of advanced software for individual
processes of Building Project Management
adm_too IT Tools utilized for Project
Administration and Resource
management processes
tim_ic Extent of ICT adoption for Project
Time Management processes
cos_ic Extent of ICT adoption for Project
Cost Management processes
Final Factor: Use of ICT for Building Project
Management
ad_c_ic Extent of ICT adoption for Project
Administration and Resource
management processes
Measurement Error Terms
e1 – e14 attached with the manifest variables or indicator variables
Disturbances
d1 – d3 attached with the endogenous variables
Covariances
Covariance between all the exogenous variables is shown through double arrow curved lines

__________________________________________________________________________________
Page 181
Chapter 6: SEM Analysis on Questionnaire Survey Data
6.4 Structural Equation Modeling (SEM)
The introduction to SEM analysis is given in Chapter 3 (Sec. 3.5.2.6). SEM can be
viewed more as a confirmatory rather than an exploratory technique (Kline 1998, p.9;
Kanungo and Savla 2005). But, some researchers have also used it as an exploratory
technique to build a model (Prahinski and Benton 2004, Yen and Gwinner 2003).
Fig. 6.2: Hypothesized Model to be tested
Final Factor
tim_ic cos_ic ad_c_ic
e10 e9 e8
d3 1
1 1 1
1
Factor OF5
geo_sep1 geo_sep2
e1 e2
1 1
1
Factor OF4
d2
tim_too cos_too adm_too
e3 e4 e5
1 1 1
1
1
Facto
r PF
2
ben
_tete
ben
_org
p
1
e11
1
e12
1
Factor OF3
ictgeni ictgenu
e7 e6
1 1
d1
1
1
Facto
r PF
3
bar_
teop
b
ar_in
d
e14
1
e13
1
1

__________________________________________________________________________________
Page 182
Chapter 6: SEM Analysis on Questionnaire Survey Data
Multiple regression is a part of the SEM technique. But regression analysis leads to
misleading results in purely observational studies in which all the variables are subject to
measurement error or an uncontrolled variation (Jöreskog et al. 2000 cited in Datta
2003). Maximum likelihood estimation is one of the techniques used in SEM analysis. It
is a combination of regression, path and factor analysis.
The basic statistic in SEM is covariance, even though the other types of data such as the
means can also be analyzed (Kline 1998, p.9). Covariance represents the association
between two variables X and Y and their variabilities. It is also referred to as an
unstandardised correlation because it has no bounds on its lower or upper values. A
covariance conveys more information as a single number statistic than a correlation
(Kline 1998, p.10).
SEM consists of two components, a measurement model and a structural model (Meyer
and Collier 2001). In the hypothesized model, the measurement model includes the
relationships between the factors and the questionnaire items (indicators) that
operationalize measurement of those factors. It assesses how well the observed variables
(indicators) reflect unobserved or latent variables (factors). The Structural model
statistically represents the hypothesized structure and testifies the causal relations
between latent variables (factors).
Every latent variable or a factor must have a scale and to achieve this, the loading of one
indicator per factor is fixed equal to 1.0, which gives the factor the same scale as that of
the indicator. Based on the same rationale, the residual path coefficient for the direct
effect of a measurement error term on its indicator in the measurement model and that of
the disturbance on the endogenous variables in the structural model is also fixed equal to
1.0 (Kline, 1998). Fig. 6.2 indicates the path coefficients fixed equal to 1.0.

__________________________________________________________________________________
Page 183
Chapter 6: SEM Analysis on Questionnaire Survey Data
6.5 Data Collection
Data for the analysis was collected through the Questionnaire Survey (Ref. Appendix
A). Details of the questionnaire design, survey population, validation of the
questionnaire, pilot survey and the survey administration have been discussed in Chapter
3 (Sec. 3.5.2). Section I of the questionnaire provided data for measuring Factors OF3
and OF5, Section II provided the data for Factor OF4 and the Final Factor, and Section
III provided the data for Factors PF2 and PF3.
Sample size must fulfill the requirements of efficiency, representativeness, reliability
and flexibility (Kothari 2005, p.55-68). SEM is a large sample size technique and the
preferred sample size in SEM is 5-10 times the number of free parameters in the causal
model (Kline 1998, p.111-112). In the hypothesized model, the number of free
parameters was 39 and the required sample size was 195 – 390. As discussed in Chapter
5 (Sec. 5.2), actual sample size was 149.
6.6 Analysis
The model was tested on AMOS 5.0, a software used for formulating, fitting and testing
structural equation models to observed data. The program can be used to calculate and
analyze linear structural relationships between latent constructs or factors contained in
recursive or non-recursive path models.
The input for structural equation model estimation was the data file compiled in SPSS
statistical estimation software and converted as a covariance matrix by AMOS for
analysis. Maximum likelihood estimation, the method employed by most researchers
and the default estimation method in most structural equation modeling software
packages including AMOS is used.

__________________________________________________________________________________
Page 184
Chapter 6: SEM Analysis on Questionnaire Survey Data
To make the absolute scores of composite indicator variables comparable,
standardization or normalization scoring technique was used. The standardized score for
each factor has been calculated using the following formula (Ajitabh 2003).
Standardised scoreij = (Averagej – Scorej)/Standard Deviationj
Where, Scorej = Score of organization i on criteria j
Averagej = Average of scores on criteria j
Standard Deviationj = Standard deviation of scores on criteria j
6.6.1 Data Validity
SEM analysis requires data to be tested for content validity, construct reliability,
multicollinearity, linearity and multivariate normality (Kline 1998, p.67-91).
Content validity was dealt with at the stage of designing the questionnaire (Chapter 3,
Sec. 3.5.2.3). Cronbach’s alpha (α) was calculated to determine construct reliability and
results have been shown in Table 5.1. Reliability comes to the forefront when variables
developed from the summated scales are used as predictor components in the objective
models (Santos, J.R.A, 1999). Multicollinearity occurs when intercorrelations among
some variables are so high that what appear to be separate variables actually measure the
same thing. This may prevent the estimation of the model (Kline 1998, p.77).
Multicollinearity is checked through Pearson correlation. Correlation between all the
indicator variables is less than 0.7 (Ref. Appendix C), where as 0.85 is the acceptable
limit (Kline 1998, p.78). Linearity of the variables is also established since correlation
between the variables is significantly different than 0. Multivariate normality of the
variables is checked through the calculation of multivariate kurtosis value. Its value for
the hypothesized model variables is 6.324, which is within the acceptable range.
6.6.2 Statistical Results and Analysis of the Hypothesized Model
Model estimation calculates the weights of the causal paths between the factors and also
calculates factor loadings between the factors and the indicator variables. Table 6.2

__________________________________________________________________________________
Page 185
Chapter 6: SEM Analysis on Questionnaire Survey Data
shows unstandardised regression weights or estimates for the path coefficients and factor
loadings for the hypothesized model. Path coefficients from Factor OF5 to the Final
factor, Factor PF2 to the Final factor, Factor PF3 to the Final factor, and Factor PF3 to
Factor OF3 are not significant. Also path coefficient from Factor OF5 to the Final factor
is negative, which is not acceptable.
Table 6.2: Regression Weights/Path Coefficients and Factor Loadings Hypothesized
model
Modified Model-
Step 1
Modified Model-
Step 2 Modified Model-Step 3
Unstandardised Unstandardised Unstandardised Unstandardised Standardised
F. OF3 <--- F. OF5 0.876*** 0.876*** 0.854*** 0.865*** 0.753
Final F. <--- F. OF5 -0.028(p=0.817)
F. OF3 <--- F. PF2 0.35*** 0.352*** 0.294*** 0.304*** 0.298
Final F. <--- F. PF2 0.042(p=0.604) 0.052 (p=0.467)
F. OF3 <--- F. PF3 -0.18(p=0.334) -0.186 (p=0.318)
Final F. <--- F. PF3 -0.225(p=0.124) -0.235 (p=0.096) -0.181(p=0.089)
F. OF4 <--- F. OF3 0.735*** 0.732*** 0.731*** 0.727*** 0.862
Final F. <--- F. OF4 0.692*** 0.662*** 0.677*** 0.633*** 0.865
geo_sep1 <--- F. OF5 1.553*** 1.549*** 1.569*** 1.581*** 0.886
geo_sep2 <--- F. OF5 1 1 1 1 0.736
ben_tete <--- F. PF2 1 1 1 1.045*** 0.897
ben_orgp <--- F. PF2 0.971*** 0.969*** 0.984*** 1 0.858
bar_ind <--- F. PF3 1.316*** 1.315*** 1.366***
bar_teop <--- F. PF3 1 1 1
ictgeni <--- F. OF3 0.913*** 0.912*** 0.917*** 0.911*** 0.798
ictgenu <--- F. OF3 1 1 1 1 0.875
tim_too <--- F. OF4 1 1 1 1 0.738
cos_too <--- F. OF4 0.906*** 0.908*** 0.910*** 0.911*** 0.671
adm_too <--- F. OF4 0.693*** 0.690*** 0.699*** 0.677*** 0.499
tim_ic <--- Final F. 1 1 1 1 0.54
cos_ic <--- Final F. 0.901*** 0.902*** 0.912*** 0.9*** 0.486
ad_c_ic <--- Final F. 1.456*** 1.456*** 1.477*** 1.482*** 0.8
***Significant at p<0.001 level (2-tailed)
Table 6.3 shows covariance between the exogenous variables. Covariance between
Factors PF2 and PF3 is significant. But, the other two covariance measurements are not
significant.
Table 6.4 shows the estimates for exogenous variables, Factors OF5, PF2 and PF3, and
the measurement errors and disturbances. The estimate for disturbance d3 is not

__________________________________________________________________________________
Page 186
Chapter 6: SEM Analysis on Questionnaire Survey Data
significant at p<0.05. Appendix C shows the hypothesized model with values of
significant unstandardised path coefficients, factor loadings, covariance and estimates.
Table 6.3: Covariance between Exogenous Variables Hypothesized
model
Modified Model-
Step 1
Modified Model-
Step 2
Modified Model-
Step 3
Unstandardised Unstandardised Unstandardised Unstandardised
F. OF5 <--> F. PF3 0.077(p=0.137) 0.078(p=0.130) 0.069(p=0.161)
F. OF5 <--> F. PF2 0.079(p=0.238) 0.079(p=0.239) 0.08(p=0.224) 0.09(p=0.166)
F. PF3 <--> F. PF2 0.262*** 0.262*** 0.247***
***Significant at p<0.001 level (2-tailed)
Model fit indices were calculated and are reported in Table 6.5. The root mean square
error of approximation (RMSEA) is a measure of model fit that is not dependent on the
sample size (Steiger 1990; Browne and Mels 1994; Hair et al. 1995 cited in Meyer and
Collier 2001). Many other fit measures (e.g. Chi-square, goodness of fit index) are
highly dependent on the sample size (Kline, 1998). The following guidelines are used to
determine the model fit using RMSEA: RMSEA<0.05, good model fit;
0.05<RMSEA<0.10, reasonable model fit; RMSEA>0.10, poor model fit (Browne and
Cudeck 1993; Browne and Mels 1994 cited in Meyer and Collier 2001). The RMSEA
value of 0.076 indicates a reasonable model fit.
The Chi-square test for the overall model fit has a value of 122.642 and is significant.
It’s a test of significance of the difference in the fit between the model and a just-
identified version of it. Jöreskog (1969) suggests dividing Chi-square by the degrees of
freedom in the model to calculate the normed Chi-square (Meyer and Collier 2001). For
this model, the normed Chi-square value is 1.858 (122.642/66) and indicates a
reasonable model fit. A normed Chi-square value of less than 1.0 indicates that a model
is overfitted, i.e. estimates too many paths (Jöreskog 1969), while a value greater than
3.0 indicates that a model does not adequately represent the observed data and may need
improvement (Carmines and McIver 1981 cited in Meyer and Collier 2001)
Other indices are also calculated. Indices that describe the overall proportion of the
explained variance, Jöreskog –Sörbom Goodness of Fit index (GFI), Bentler-Bonett
Normed fit index (NFI) and Comparative fit index (CFI), have values 0.888, 0.862 and

__________________________________________________________________________________
Page 187
Chapter 6: SEM Analysis on Questionnaire Survey Data
0.929 respectively. Values greater than 0.9 for these indexes indicate good model fit
(Kline 1998, P.131) and should range from zero (not fit at all) to 1.0 (perfect fit) (Meyer
and Collier 2001). So, for the hypothesized model, GFI and NFI values indicate
reasonable model fit whereas CFI indicates good model fit. Parsimony ratio of 0.725
indicates a reasonable model fit.
The model fit indices indicate a reasonable model fit. But, the regression weight or path
coefficient for the path from Factor OF5 to the Final factor is negative and is also not
significant. Thus, the model does not support Hypothesis HR3 and was modified based
on the above analysis results (Fig. 6.3). Refer to Fig. 6.1 for comparison.
6.6.3 Model Modification – Step 1
Based on the results discussed above, path from Factor OF5 to Final factor was deleted
from the model and further analysis was conducted. The modified model had 38 free
parameters with 67 degrees of freedom.
Analysis results for the modified model (Step 1) are reported in the relevant tables. As
seen from Table 6.2, paths from Factor PF2 to the Final factor and Factor PF3 to Factor
Fig. 6.3: Modified Structural Model – Step 1
Factor OF4: Use of
advanced software for
individual PM processes
Factor OF3: Use of
ICT for general
administration
Factor OF5: Geographical
separation of project team
members
Final Factor: Use of ICT
for Building Project
Management
Factor PF2:
Perceived
Benefits
Factor PF3:
Perceived
Barriers
HR7 HR4
HR8
HR5 HR9
HR6 HR2
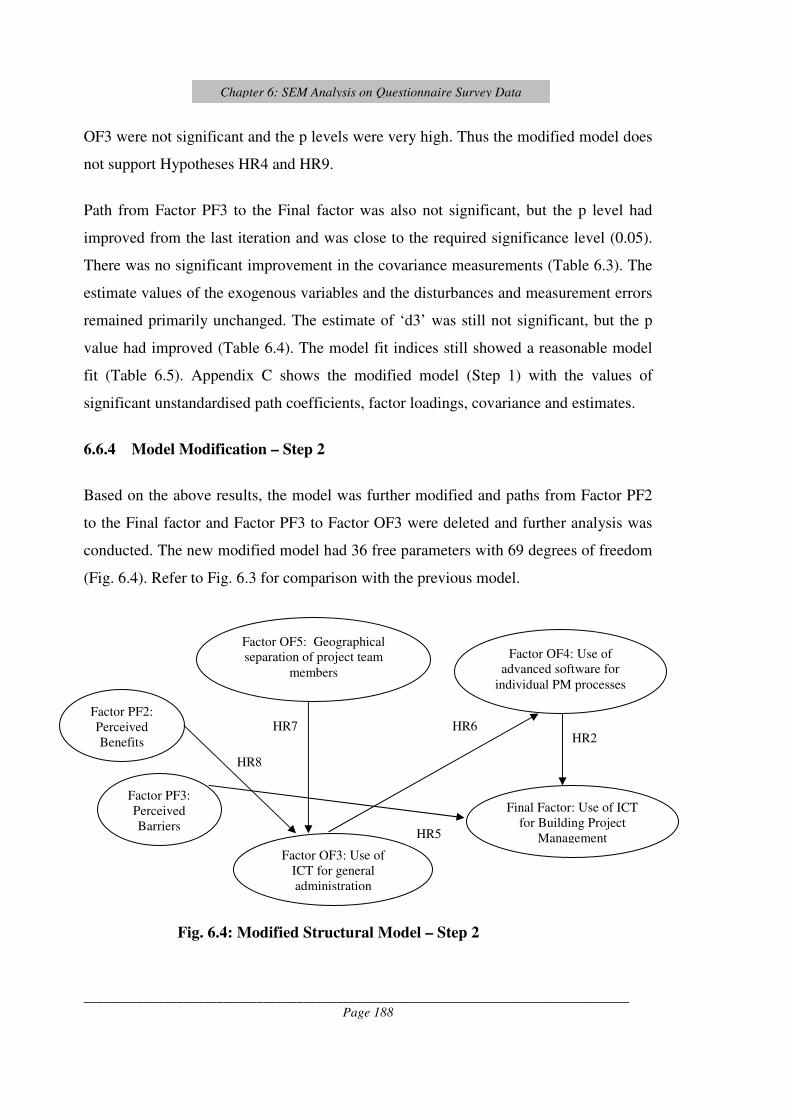
__________________________________________________________________________________
Page 188
Chapter 6: SEM Analysis on Questionnaire Survey Data
OF3 were not significant and the p levels were very high. Thus the modified model does
not support Hypotheses HR4 and HR9.
Path from Factor PF3 to the Final factor was also not significant, but the p level had
improved from the last iteration and was close to the required significance level (0.05).
There was no significant improvement in the covariance measurements (Table 6.3). The
estimate values of the exogenous variables and the disturbances and measurement errors
remained primarily unchanged. The estimate of ‘d3’ was still not significant, but the p
value had improved (Table 6.4). The model fit indices still showed a reasonable model
fit (Table 6.5). Appendix C shows the modified model (Step 1) with the values of
significant unstandardised path coefficients, factor loadings, covariance and estimates.
6.6.4 Model Modification – Step 2
Based on the above results, the model was further modified and paths from Factor PF2
to the Final factor and Factor PF3 to Factor OF3 were deleted and further analysis was
conducted. The new modified model had 36 free parameters with 69 degrees of freedom
(Fig. 6.4). Refer to Fig. 6.3 for comparison with the previous model.
Fig. 6.4: Modified Structural Model – Step 2
Factor OF4: Use of
advanced software for
individual PM processes
Factor OF3: Use of
ICT for general
administration
Factor OF5: Geographical
separation of project team
members
Final Factor: Use of ICT
for Building Project
Management
Factor PF2:
Perceived
Benefits
Factor PF3:
Perceived
Barriers
HR7
HR8
HR5
HR6 HR2

__________________________________________________________________________________
Page 189
Chapter 6: SEM Analysis on Questionnaire Survey Data
Analysis results for the modified model (Step 2) are reported in the relevant tables. As
seen in Table 6.2, the path from Factor PF3 to the Final factor was still not significant,
even though the p value had improved from the last iteration. There was no significant
improvement in the covariance measurements (Table 6.3). Estimate values of the
exogenous variables and the disturbances and measurement errors were primarily the
same. The estimate of ‘d3’ was still not significant, but the p value had improved (Table
6.4). The model fit indices still showed a reasonable model fit (Table 6.5).
Table 6.4: Estimates
Hypothesized
model
Modified
Model-Step 1
Modified
Model-Step 2
Modified
Model-Step 3
F. OF5 0.587*** 0.589*** 0.582*** 0.577***
F. PF2 0.788*** 0.789*** 0.778*** 0.732***
F. PF3 0.287** 0.287** 0.281**
d1 0.207*** 0.208*** 0.222*** 0.224***
d2 0.12* 0.125** 0.121** 0.139**
d3 0.055(p=0.148) 0.058(p=0.113) 0.059(p=0.101) 0.073*
e1 0.418*** 0.422*** 0.402*** 0.393**
e2 0.478*** 0.477*** 0.484*** 0.489***
e3 0.466*** 0.462*** 0.469*** 0.453***
e4 0.563*** 0.558*** 0.561*** 0.547***
e5 0.741*** 0.741*** 0.738*** 0.746***
e6 0.365*** 0.364*** 0.359*** 0.361***
e7 0.239*** 0.237*** 0.24*** 0.233***
e8 0.699*** 0.699*** 0.705*** 0.703***
e9 0.754*** 0.754*** 0.753*** 0.759***
e10 0.37*** 0.371*** 0.364*** 0.357***
e11 0.207* 0.206* 0.217* 0.195*
e12 0.251** 0.252** 0.24** 0.262**
e13 0.495*** 0.497*** 0.468**
e14 0.706*** 0.706*** 0.712***
* Significant at p<0.001 level (2-tailed)
** Significant at p<0.01 level (2-tailed)
*** Significant at p<0.05 level (2-tailed)

__________________________________________________________________________________
Page 190
Chapter 6: SEM Analysis on Questionnaire Survey Data
Appendix C shows the modified model (Step 2) with the values of significant
unstandardised path coefficients, factor loadings, covariance and estimates. As discussed
earlier, for SEM analysis required sample size is 5-10 times the number of free
parameters. So, for this model, with 36 free parameters, the required sample size was
180-360. But, the actual sample size was 149. So, it can be assumed that the effect of
Factor PF3 on the Final factor could be found significant, if the sample size was
increased. Since, in three iterations, not much improvement was observed in the path
coefficient estimates from Factor PF3 to the Final factor, Factor PF3 was dropped from
the model. Thus the modified model does not support Hypothesis HR5.
6.6.5 Model Modification – Step 3 (Final Model)
The model was modified as discussed above and further analysis was conducted. The
modified model had 29 free parameters with 49 degrees of freedom. Fig. 6.5 shows the
final model. Refer to Fig. 6.4 for comparison with the previous model.
Analysis results for the modified model (Step 3) are reported in the relevant tables. As
seen in Table 6.2, all paths were significant. Unstandardised and standardized regression
weights or estimates for the path coefficients and factor loadings are reported.
Unstandardised estimates cannot be directly compared across variables with different
scales (Kline 1998, p.18). So, standardized estimates also need to be reported.
Covariance between Factor OF5 and Factor PF2 was not significant, but the p value had
improved considerably from the last iteration (Table 6.3). Estimate values of all the
exogenous variables, the disturbances and the measurement errors were significant
Table 6.5: Model Fit Indices Overall Model Fit
Indices Hypothesized
model
Modified
Model-Step
1
Modified
Model-Step
2
Modified
Model-
Step 3
Chi-square 122.642*** 122.681*** 124.273*** 78.72**
Normed chi-square 1.858 1.831 1.801 1.607
RMSEA 0.076 0.075 0.074 0.064
GFI 0.888 0.888 0.887 0.912
NFI 0.862 0.862 0.860 0.901
CFI 0.929 0.930 0.931 0.959
Parsimony ratio 0.725 0.736 0.758 0.742
** Significant at p<0.01 level (2-tailed)
*** Significant at p<0.001 level (2-tailed)

__________________________________________________________________________________
Page 191
Chapter 6: SEM Analysis on Questionnaire Survey Data
(Table 6.4). Appendix C shows the Final model with the values of significant
unstandardised path coefficients, factor loadings, covariance and estimates. Values of
model fit indices had improved and showed a good model fit (Table 6.5). Multivariate
kurtosis had reduced as compared to the hypothesized model and was 5.704.
Of the 66-covariance matrix residuals, absolute values of about
90% residuals were less than 0.1. Overall, with the absolute values
of residuals averaging 0.047, the model explains the relationships
among the measured dimensions to within an average error of
0.047 (Hu and Bentler 1995 cited in Meyer and Collier 2001).
Distribution of the standardized residuals is symmetrical and
primarily centered around zero (Ref. Appendix C).
Table 6.6 shows that the value of squared multiple correlation (R2)
for all the indicator variables and endogenous factors is less than
0.9, which is the acceptable limit (Kline 1998, p.78-89). Squared
multiple correlation indicates the percent variance explained in that
variable.
The revised model provides acceptable fit to the data. But, with 29
free parameters, the required sample size was 145 – 290, while the actual sample size
was 149. Thus it can be assumed that if the sample size was increased, results would
have further improved.
Table 6.6:
Squared Multiple
Correlations
Variables R2
factor OF3 0.705
factor OF4 0.742
Final factor 0.748
geo_sep1 0.786
geo_sep2 0.541
be_tete 0.804
be_orgp 0.737
ictgeni 0.636
ictgenu 0.766
tim_too 0.544
cos_too 0.451
adm_too 0.249
tim_ic 0.292
cos_ic 0.236
ad_c_ic 0.641

__________________________________________________________________________________
Page 192
Chapter 6: SEM Analysis on Questionnaire Survey Data
6.7 Discussion and Findings
6.7.1 Discussion
The modified model is admissible. Standardized path coefficients with the absolute
values less than 0.10 may indicate a “small” effect; values around 0.30, a “medium”
effect and those greater than 0.50, a “large” effect (Kline 1998, p.118). In the model, all
the indicators specified to measure a common underlying factor have high factor
loadings on that factor, except the factor loading of indicator variable expressing ‘use of
IT tools for Project administration and resource management processes’ (adm_too) on
Fig. 6.5: Standardized Path Coefficients and Factor Loadings of Model
Modification - Step 3 (Final Model)
0.753
0.2
98
0.862 0.865
Factor OF4
d2
tim_too cos_too adm_too
e3 e4 e5
1 1 1
0.738
1
0.671 0.499
Factor OF5
geo_sep1 geo_sep2
e1 e2
1 1
0.736 0.886
Final Factor
tim_ic cos_ic ad_c_ic
e10 e9 e8
d3 1
1 1 1
0.54 0.486
0.80
Factor OF3
ictgeni ictgenu
e7 e6
1 1
d1
1
0.875 0.798
Facto
r PF
2
ben
_tete
ben
_org
p
0.8
97
0
.858
e11
1
e12
1

__________________________________________________________________________________
Page 193
Chapter 6: SEM Analysis on Questionnaire Survey Data
Factor OF4, which is 0.499 and the factor loading of indicator variable expressing ‘use
of ICT for Project cost management processes’ (cos_ic) on the Final factor, which is
0.486. But, these are also close to 0.5 and can be considered high. This determines
Convergent Validity of the model. Measurement errors and disturbances are very small.
All path coefficients are positive and of high magnitude, except the path coefficient
between Factor PF2 and Factor OF3 which is of medium magnitude. This implies that
they contribute significantly to the achievement of ‘use of ICT for Building Project
Management processes’.
The most important finding of this study is that the ‘geographical separation of project
team members’ and ‘perceived benefits of use of ICT for building project management’
do not independently increase ‘use of ICT for project management processes’ as
Hypotheses HR3 and HR4 are not supported by the model. They positively affect the use
of ICT for project management processes only if their effect is mediated by an increased
and matured use of ‘ICT for general administration works’ and ‘increased use of
advanced IT tools and software for individual PM processes’ as Hypotheses HR7 and
HR8 are supported by the model. This validates the Interpretive Structural Modeling
analysis results discussed in Chapter 4 and provides direction to the building project
managers for strategically adopting effective use of ICT within their organizations and
for building project management.
‘Perceived barriers’ do not affect adoption of ICT for general administration works by
project management organizations, as the model does not support Hypothesis HR9. But,
perceived barriers directly affect adoption of ICT for project management processes, as
organizations are not very sure of the benefits that can be accrued and whether all
project team organizations would be able to adopt the same level of ICT. But the effect
is not very significant and if the client requires ICT adoption for project management, it
is adopted. Thus the model does not significantly support Hypothesis HR5. The Final
Structural Model is shown in Fig. 6.6. Refer to Fig. 6.5 for comparison with the previous
model.

__________________________________________________________________________________
Page 194
Chapter 6: SEM Analysis on Questionnaire Survey Data
Covariance, which is an unexplained association between exogenous variables Factor
OF5 and Factor PF2 is not significant. But, the p level has improved with each iteration.
So, it can be assumed that if sample size is increased, this result would improve. Model
fit indices show a good model fit to the data and the value of chi-square is significantly
reduced in last two iterations.
Out of 15 endogenous and indicator variables, 4 variables have squared multiple
correlation (R2) values less than 0.5. It indicates that there are other factors, which affect
variance of these variables and have not been included in the model. Other factors have
been identified and discussed in earlier chapters, but some of these factors such as
turnover of the organization can not be compared across all the groups of respondent
organizations. The, effect of those factors has been studied in a separate analysis.
Fig. 6.6: Final Structural Model
Factor OF4: Use of
advanced software for
individual PM processes
Factor OF3: Use of
ICT for general
administration
Factor OF5: Geographical
separation between project
team members
Final Factor: Use of ICT
for Building Project
Management
Factor PF2:
Perceived
Benefits
HR7
HR8
HR6 HR2

__________________________________________________________________________________
Page 195
Chapter 6: SEM Analysis on Questionnaire Survey Data
6.7.2 Findings
SEM analysis leads to the following two findings discussed below:
1. Following four hypotheses were found significant.
HR2: Increased use of advanced software for individual functions or processes
positively affects ICT adoption for communicating information with respect to
those processes.
HR6: Increased ICT adoption for general administration positively affects use of
advanced software for individual building project management processes.
HR7: Geographical separation between the project team members positively affects
ICT adoption by organizations for general administration works.
HR8: Perceived benefits of ICT adoption positively affect ICT adoption by
organizations for general administration works.
Analysis of these causal relationships helps us in understanding that an increased
and matured use of ICT for general administration within the organization would
lead to an improved ICT infrastructure within the organization, development of
electronic databases and the staff that is confident of using IT tools. In such a
scenario, staff would use advanced software and IT technologies for project
management processes and that would lead to an increased adoption of ICT for
project management processes.
But, for general administration also, ICT adoption would be enhanced if the
organization is interacting more with geographically separated agencies and the
senior management perceives that significant benefits would accrue by adoption of
ICT. All the factors are inter-related and their effect can not be maximized in
isolation.

__________________________________________________________________________________
Page 196
Chapter 6: SEM Analysis on Questionnaire Survey Data
Summary of these results and the analysis results discussed in Chapter 5 led to the
development of the proposed benchmarking framework for rating organizations for ICT
adoption for building management. It is discussed in Chapter 7.
2. Hypothesis HR2 further validates hypothesis HS3 that ‘Extent of use of ICT
for building project management differs for three groups of sample
organizations i.e Builders, Project management consultancy organizations
and Architectural organizations’.
Hypothesis HS3 was found significant in Chapter 5 and one of the reasons identified for
the phenomenon was the difference in the extent of formal project management
processes adopted by these groups of organizations (Sec. 5.5). SEM analysis identified
another factor for further enquiry i.e ‘Increased used of software or advanced tools for
individual processes’.
Data for studying this feature was collected through Section II of the questionnaire,
where tools used for identified Time, Cost and Project Administrative and resource
management processes were identified. For each process the respondents could give
multiple responses in five categories. Fig. 6.7 shows aggregate scores for the three
groups of respondent organizations for all the identified processes.
For all Time and Cost management processes except ‘Cost estimates for the project’
scores of PMCOs, Builders and Architectural organizations are in decreasing order. For
some administrative processes also the pattern remains the same. To further analyze,
Fig. 6.8 shows overall mean and std. deviation of the scores for the three groups of
organizations. For overall mean value also the pattern remains the same. But, standard
deviation is least for PMCOs and maximum for Builders showing more variability in
responses of this group.

__________________________________________________________________________________
Page 197
Chapter 6: SEM Analysis on Questionnaire Survey Data
Fig. 6.7: Aggregate Scores of Respondent Organizations for Tools
used for Identified Project Management Processes
0 5 10 15 20 25
Master time schedule prepared
at design stageDetailed time schedule at
construction stage Updated construction stage
time schedule
Project performance reports
for t ime schedules Variance analysis reports for
time schedules
cost estimates for the project
Detailed cash flow req for the
project
Cost variance reports
Meetings for review of
design/information/documents
Bill of quantities preparation
Tender preparation
Comparative analysis of bids
received
Purchase orders preparation
and managementMaterials management records
maintained at siteManpower resource
management records
Aggregate Scores
PMCOs
Builders
Architectural organisations
Fig. 6.8: Mean and Std. Deviation of Respondent
Organizations for Scores for Tools used for Project
Management Processes
0 50 100 150 200 250
PMCOs
Builders
Architectural
Organisations
Std. Deviation
Mean

__________________________________________________________________________________
Page 198
Chapter 6: SEM Analysis on Questionnaire Survey Data
Thus it can be summarized that more advanced IT tools are used by PMCOs and least by
the Architectural organizations for building project management and it is one of the
reasons that ‘Extent of use of ICT for building project management differs for three
groups of sample organizations i.e PMCOs, Builders and Architectural organizations’.
Also, there is more variability among Builders for the use of advanced software or IT
tools.
6.8 Summary
Questionnaire data analysis discussed above, tested the structural model derived from
the hypotheses of causal relationships. SEM analysis was conducted as an exploratory
and confirmatory technique. Final model validates four hypotheses. Data analysis results
provide a framework for strategic adoption of ICT by project management
organizations. It further leads to the identification of an additional factor affecting
difference in ICT adoption for building project management in the three groups of
respondent organizations. Data analysis also contributes to the development of a
benchmarking framework for rating construction organizations for ICT adoption for
building project management. Chapter 7 discusses development and finalization of the
benchmarking framework.

__________________________________________________________________________________
Page 199
Chapter 7: Benchmarking Framework Development and Case Study Analysis
CHAPTER 7
BENCHMARKING FRAMEWORK DEVELOPMENT AND
CASE STUDY ANALYSIS
7.1 Introduction
The objective of the study discussed in this chapter is to provide construction
organizations with a generic framework to assess their extent of ICT adoption for
building project management processes and to measure their efficiency in implementing
their strategies for ICT adoption. The framework is also applicable at the industry level
for rating the construction organizations for ICT adoption and performance
measurement as discussed above. The chapter starts with the discussion on the
development of the benchmarking framework. Suggested benchmarking process has
four iterative stages of Benchmarking and BenchMeasurement, BenchLearning,
BenchAction and BenchMonitoring. The first two stages are discussed in detail and
administered on three organizations. A structure for the last two stages is presented.
BenchMeasurement employs Data Envelopment Analysis (DEA) technique. The
performance measurement system is complimented with performance management
system (BenchLearning) including case study analysis conducted through Situation-
Actor-Process (SAP) - Learning-Action-Performance (LAP) analysis technique. The
results and the findings are reported.
7.2 Benchmarking Framework Development
Effective ICT adoption for building project management at the national level can be
assessed by the extent to which ICT tools and technologies replace manual methods in
the information systems supporting building project management processes at the
industry level.

__________________________________________________________________________________
Page 200
Chapter 7: Benchmarking Framework Development and Case Study Analysis
In the construction industry, successful project management depends on effective inter-
organizational communication. Thus, improvement in the effective ICT adoption for
building project management at national or industry level requires improvement in ICT
adoption by all the organizations.
Measurement is one of the first steps in any improvement process (Lee et al., 2005) and
an important role of performance measurement is to enable an organization to do
benchmarking (Costa et al. 2006). As per Bendell et al. (1998), all management and
service areas are candidates for benchmarking. Thus, a consistent ICT evaluation
framework would allow benchmarking ICT adoption for building project management.
Benchmarking is defined in Chapter 2 (Sec. 2.7.2.1) and attributes of a benchmarking
framework and its administration are discussed in the introduction of the methodology in
Chapter 3 (Sec. 3.5.3).
7.2.1 Objectives of the Required Benchmarking Framework
In the context of this research, a generic ‘Benchmarking Framework’ is required to be
established to measure the extent of ICT adoption for building project management by
SMEs in the Indian Construction Industry. It should fulfill the following objectives:
• As per Bendell et al. (1998), as well as a strategy for benchmarking, at the
organization and at the national level, there is also a requirement for the
benchmarking of strategy. Thus, it should facilitate benchmarking of present
strategies and long-term strategic goals of the organization with respect to ICT
adoption for building project management processes and other processes having
causal relationship with these processes.
• The benchmarking framework should also be a performance measurement tool,
which measures efficiency of the organizations in implementing their strategies
for ICT adoption for building project management.
• It should facilitate ‘competitive benchmarking’ within SMEs in the Indian
construction industry by having a generic structure. There is a potential to learn

__________________________________________________________________________________
Page 201
Chapter 7: Benchmarking Framework Development and Case Study Analysis
and improve practices of an organization by comparing their practices with those
of the other organizations.
• Administration of the framework has to be an industry level initiative taken up
by the national level agencies in the Indian construction industry as it is indicated
in the literature that benchmarking carried out by a third party agency is
successful. This would help in conducting collaborative benchmarking, leading
to more number of organizations participating in the process. This would lead to
an improvement in ICT adoption at the industry level by creating a learning
atmosphere.
• The research is in the context of ICT adoption of SMEs of the construction
industry. As per the literature review, ICT adoption of the construction industry
is lagging with respect to other agencies. Thus, SMEs in the construction
industry can learn from the best practice primarily defined by the large
organizations of the construction industry and it would not be relevant to
compare their ICT adoption with the best practice from a parallel industry. Thus,
the benchmarking framework should facilitate establishing a ‘best-practice
benchmark’ from the construction industry.
• The benchmarking framework should be modular in structure, to accommodate
inclusion and deletion of the factors or measurement indicators as per the
changing pattern of usage of ICT in the construction industry.
7.2.2 Benchmarking Framework Development, Structure and Measurement
System
The research is in context of SMEs and with respect to SMEs it is important to
understand processes, their indicators and measures in the local context. Thus, the
benchmarking framework was derived from the questionnaire survey conducted in the
Indian Construction industry and discussed in previous chapters. Suggested
benchmarking framework is shown in detail in Appendix D.

__________________________________________________________________________________
Page 202
Chapter 7: Benchmarking Framework Development and Case Study Analysis
8 critical success factors or the performance/measurement indicators were established
after questionnaire survey data analysis discussed in Chapters 5 and 6 and ongoing
literature survey. Each indicator is measured by one or more performance measures
derived from the questionnaire as questionnaire survey data analysis provides validity,
relevance and significance of these performance measures. The measures have their own
metrics, data sources and minimum and maximum limits relevant to the industry
standards and established after questionnaire data analysis. The measures reflect the
‘Best Practice’ in the Indian Construction industry. The goal was to develop generic
measures that would be meaningful to both, the participating organizations and the
industry as a whole and would be repeatable to simplify the process of recalibration.
The measurement indicators (MIs) or the critical success factors included in the
benchmarking framework are discussed below:
Strategic use of ICT indicator (MI1) focuses on present strategic use and long-term
strategic goals of the organization with respect to ICT adoption in the organization. It is
also representative of the management’s ability to instill the necessary change to
embrace new technology with the help of training of employees, as old employees are
the key users who have vital information about the organizational processes and
systems. Employees with the ability to adapt to an ever-changing work environment will
be more receptive to new ICT applications. This indicator is measured by 7 performance
measures.
Strategic project communication indicator (MI2) measures strategic planning for use of
ICT and communication methodologies for the projects. This indicator is measured by 4
performance measures.
Measuring benefits of use of ICT indicator (MI3) is also a strategic indicator as it studies
ICT implementation benefits evaluation initiatives within the organization. The tangible
benefits in the framework include benefits related to the measures of project success
with respect to time and cost savings and can be evaluated quantitatively. The intangible

__________________________________________________________________________________
Page 203
Chapter 7: Benchmarking Framework Development and Case Study Analysis
benefits are more difficult to measure and typically include non-monetary elements
(Serafeimedis and Smithson 2000 cited in Stewart and Mohamed 2001), which are
included in the framework as benefits related to effective team management, effective
use of technology and increased organizational efficiency. These benefits can be
evaluated subjectively or qualitatively. This indicator has the greatest potential in the
information era (Stewart and Mohamed, 2001). This indicator is measured by 7
performance measures structured in a lead on format.
ICT infrastructure indicator (MI4) measures ICT infrastructure maturity at an
organization’s head office and project sites. This indicator is measured by 15
performance measures.
ICT for general administration indicator (MI5) measures extent of ICT adoption for
general administration within office and with external agencies. This indicator is
measured by 12 performance measures.
ICT for time management (MI6), ICT for cost management (MI7) and ICT for project
administration and resource management (MI8) indicators measure extent of ICT
adoption for time management, cost management and project administration and
resource management processes at different stages of the projects. These indicators are
measured by 13, 6 and 11 performance measures respectively.
Majority of the questions or the performance measures in the benchmarking framework
are included from the questionnaire administered for the questionnaire survey. Only a
few questions in the Strategic indicators MI1 and MI3 were new.
Structural Equation Modeling (SEM) analysis (Chapter 6, Sec. 6.7.2) established that
there is a causal relationship between all the suggested indicators and thus all are
required to be considered to assess extent of ICT adoption for building project
management by an organization.

__________________________________________________________________________________
Page 204
Chapter 7: Benchmarking Framework Development and Case Study Analysis
Following three hypotheses were tested and found significant after SEM analysis:
HR8: Perceived benefits of ICT adoption positively affect ICT adoption by
organizations for general administration works.
HR6: Increased ICT adoption for general administration positively affects use of
advanced software for individual building project management processes.
HR2: Increased use of advanced software for individual functions or processes
positively affects ICT adoption for communicating information with respect to
those processes.
Also in the analysis of the perceived enablers (Chapter 5, Sec. 5.6.2), components of
strategic planning for ICT adoption within an organization and for the projects have
been found as most important perceived enablers.
The above analysis helped in establishing the relationship between performance
indicators of the benchmarking framework and also defined their relative importance
leading to the establishment of weights for indicator variables (Fig. 7.1).
STRATEGIC INDICATORS MI1: Strategic use of ICT
MI2: Strategic project communication
MI3: Measuring benefits of use of ICT
USE OF ICT FOR GENERAL
ADMINISTRATION WORKS
INDICATORS
MI4: ICT infrastructure
MI5: ICT for general administration
USE OF ICT FOR BUILDING PROJECT
MANAGEMENT PROCESSES
INDICATORS
MI6: ICT for time management
MI7: ICT for cost management
MI8: ICT for project administration and
resource management
Fig. 7.1: Relationship between
Performance/Measurement
Indicators

__________________________________________________________________________________
Page 205
Chapter 7: Benchmarking Framework Development and Case Study Analysis
Above figure leads to the establishment of weights for different groups of indicators and
the formula for calculating the rating of building project management organizations as
per the benchmarking framework.
RATING VALUE= 3 (MI1 + MI2 + MI3) + 2(MI4 + MI5) + MI6 +MI7 + MI8
The detailed method of rating is shown in Appendix D. As shown in Appendix D, the
rating of an organization can range from (75-285). Divided into three equal ranges,
organizations can be rated at the following three levels:
Low rating: (75-144)
Middle rating: (145-215)
High rating: (216-285)
References in literature indicate researchers establishing such equal range levels for
benchmarking (Hamilton and Gibson Jr. 1995)
7.2.3 Benchmarking Framework and the Organization Management Information
Systems
With respect to the decision-making and management information systems, researchers
have divided an organization into a pyramid structure of three levels (Marakas 2003,
p.7-9); strategic, tactical and operational or in four levels (David and Olson 1984. p.6-9)
where tactical level is further divided into two levels. At the top of the pyramid are the
senior most executives of the organization involved in strategic planning and policy
making, second level consists of the senior managers involved in tactical planning and
implementation of the decisions taken at the strategic level, third level consists of the
middle managers involved in operational planning, decision making and control, and the
foundation of the pyramid consists of the operational level employees taking decisions
regarding day to day activities. The middle and operational level employees are involved
in regular interaction with the external agencies.

__________________________________________________________________________________
Page 206
Chapter 7: Benchmarking Framework Development and Case Study Analysis
After study of the construction industry, pyramid structure is further modified for the
construction organizations (Fig. 7.2). The lower two levels of the pyramid are further
divided as some of the employees of these levels would be at sites. At head office also
some employees of this level would be dedicated to projects coordination and some
would be conducting general administration works. All the groups of employees in the
pyramid manage information with respect to the projects and are linked with the critical
success factors. Thus the benchmarking framework indicators span all the levels of the
organization as indicated in Fig. 7.3.
Fig. 7.2: Construction Project Management Organization Structure with Respect
to Decision Making and Information Management
STRATEGIC LEVEL
TACTICAL
PLANNING LEVEL
OPERATONAL
PLANNING AND
CONTROL LEVEL
OPERATIONAL
LEVEL
SITES
SITES
OFFICE
OFFICE
PR
OJE
CT
CO
OR
DIN
AT
ION
-
OF
FIC
E
GE
NE
RA
L
AD
MIN
IST
RA
TIO
N -
OF
FIC
E

__________________________________________________________________________________
Page 207
Chapter 7: Benchmarking Framework Development and Case Study Analysis
7.2.4 Benchmarking Framework Attributes
Attributes of the developed framework are discussed below:
• The suggested benchmarking framework is developed around a generic model of
ICT adoption for building project management and was designed after mapping
of the building project management processes adopted by SMEs in the Indian
construction industry. Thus, the framework provides a common basis for
comparison between SMEs of the industry.
• The framework is stakeholder driven, as it measures extent of ICT adoption for
communicating within the organization and with external project team
organizations including the clients, consultants, contractors, material suppliers
and other external agencies.
• The framework includes leading as well as lagging indicators. as discussed in the
analysis (Sec. 7.4.2).
• The framework is forward looking as the strategic indicators assess long term
strategic goals of the organization for use of new ICT tools and technologies and
MI1
MI1, MI2
MI3, MI4
MI4, MI5,
MI6, MI7,
MI8
MI5, MI6,
MI7, MI8
MI4, MI5
MI5
MI6, MI7,
MI8
MI6, MI7, MI8
Fig. 7.3: Benchmarking Framework Indicators spanning all the
Levels of the Organizations
__________________________________________________________________________________
Page 208
Chapter 7: Benchmarking Framework Development and Case Study Analysis
maximum measurable limit of each performance measure signifies best practice
in the industry established after questionnaire survey data analysis.
• Performance measures are derived from the questionnaire and non-response bias
with respect to the questions was not experienced in the questionnaire survey.
Thus, it can be established that the measurement structure is simple and
unambiguous. Also, the suggested method of comprehending the whole
measurement structure and rating the organizations is simple and can also be
carried out by organizations as a self-analysis exercise.
• Each MI in the benchmarking framework is completely defined. Thus the
complete framework is a whole comprising of completely defined part and
organizations’ use of ICT can also be measured for each of the three components
individually.
7.3 Benchmarking Process
The suggested Benchmarking process is derived from the benchmarking frameworks
described by Fong et al. (1998) and Love and Smith (2003) and discussed in detail in the
Chapter 3 (Sec. 3.5.3.2). The suggested benchmarking process is divided into four
phases of:
• Benchmarking and BenchMeasurement
• BenchLearning
• BenchAction
• BenchMonitoring
The suggested benchmarking process is shown in Fig. 7.18 and discussed in detail in the
following sections.
Benchmarking and BenchMeasurement phase comprises of two components:
• Benchmarking to measure the extent of ICT adoption for building project
management by SMEs in the Indian Construction Industry. This would help in
rating the organizations into three levels of low, medium and high.
__________________________________________________________________________________
Page 209
Chapter 7: Benchmarking Framework Development and Case Study Analysis
• BenchMeasurement to measure the efficiency of organizations in implementing
their strategies for ICT adoption for building project management.
7.4 Benchmarking Framework Administration and Finalization
7.4.1 Benchmarked Organizations
One organization from each group of the surveyed organizations i.e Builders, Project
Management Consultancy Organizations and Architectural Organizations was selected
for benchmarking framework administration and finalization. The criterion for selection
of organizations was their extent of ICT adoption as assessed from their responses.
Organizations with higher ICT adoption were selected and approached. A semi-
structured interview was conducted with the following objectives:
Discussion of the benchmarking framework and rating of organizations as per the
suggested framework. This resulted in framework finalization, benchmarking or
measurement of ICT adoption by these organizations for building project management
processes and measurement of the efficiency of the organizations for implementing their
strategies for ICT adoption.
The senior executives who had responded for the questionnaire survey were contacted
for the semi-structured interviews. They were contacted personally and after receiving
consent from them, the interviews were conducted at a convenient time. They were
already aware of the objectives of the research study. Thus, selecting organizations from
the previous respondents helped in providing continuity to the research. Introduction of
the three organizations is given below. But, their names are not disclosed for the purpose
of confidentiality.

__________________________________________________________________________________
Page 210
Chapter 7: Benchmarking Framework Development and Case Study Analysis
Builders (BO)
Location:
The studied Builders are based in New Delhi with a branch office in Kolkata, another
metropolitan city of India.
Year of establishment:
It was setup in 1971 as a contracting organization executing soil testing and piling
works. In 1978, the organization started building construction and in 1984 the real estate
division of the organization was started.
Expertise:
Organization’s expertise is in construction and development of residential projects.
Recently it has also started construction of commercial buildings.
Organization structure:
It is headed by a chairman, two managing directors and its staff strength including the
administrative staff is upto 240. The staff strength has recently increased due to the
boom in the construction activity in the country. An in-house project management group
manages projects. Architectural services and most of the construction work are
outsourced.
Certification:
It is an ISO certified organization and regular audits are conducted with respect to this
certification.
Turnover and Value of the executed projects:
The value of each project executed by the organization ranges between INR 100 crores
to INR 300 crores (approx. 22.2 million US $ to 66.6 million US$) and turnover of the
organization is about INR 8 crores (approx. 1.8 million US $).
Project Management Consultancy Organization (PMCO)
Location:
The studied Building Project Management Consultancy organization is based in New
Delhi.

__________________________________________________________________________________
Page 211
Chapter 7: Benchmarking Framework Development and Case Study Analysis
Year of establishment:
It was setup in 1995.
Expertise:
The organization has managed a vast range of projects: from institutional buildings,
commercial building to townships.
Organization structure:
It is headed by a managing director and has around 75 technical staff including the staff
at project sites. A trained cadre of administrative staff supports the administrative work.
The organization is planning to expand and it is envisaged that by 2008 the technical
staff strength would be doubled. Specialized works are outsourced to consultants. But,
for maintaining the quality and timely completion of work, maximum work is done
within the organization.
Certification:
It has been awarded ISO certification for ‘construction project management’ and regular
audits are conducted with respect to this certification.
Turnover and Value of the executed projects:
The value of each project executed by the organization ranges between INR 50 crores to
INR 100 crores (approx. 11.1 million US $ to 22.2 million US$) and turnover of the
organization is between INR 2 crores to INR 4 crores (approx. 0.45 million US$ to 0.9
million US $).
Architectural Organization (AO)
Location:
The studied Architectural organization studied is based in New Delhi with a branch
office in Bangalore, another metropolitan city of India.
Year of establishment:
It was set up in 1987.

__________________________________________________________________________________
Page 212
Chapter 7: Benchmarking Framework Development and Case Study Analysis
Expertise:
The organization specializes in designing and managing institutional buildings, cultural
centers and commercial interiors. It also executes commercial interiors as a turnkey
agency.
Organization structure:
The staff in each branch office includes 2 principals, a project architect, 2 draughtsmen,
a site engineer and the administrative staff. A site engineer is also posted at each project
site. Most of the specialized work is outsourced to consultants. The organization
collaborates with a regular team of consultants, but sometimes new consultants are also
included in the project team at clients’ reference.
Turnover and Value of the executed projects:
The value of each project executed by the organization ranges between INR 4 crores to
INR 50 crores (approx. 0.9 million US $ to 11.1 million US$) and turnover of the
organization is upto INR 2 crores (approx. 0.45 million US$).
7.4.2 Benchmarking of Organizations and Analysis
All the three organizations were rated for all 8 MIs. Results are shown in Appendix D.
Final rating values of the organizations are as given below:
BO: 197
PMCO: 207
AO: 170
All the three organizations are in the middle level rating (145-215). BO is at higher
middle level and PMCO is almost near the upper range of the middle level. Comparison
of performance measurement values of the three organizations for all the MIs helped in
the identification of gaps in practices.

__________________________________________________________________________________
Page 213
Chapter 7: Benchmarking Framework Development and Case Study Analysis
MI1 - Strategic use of ICT
Fig. 7.4 indicates that all the three organizations except AO have a strategy for use of
ICT within the organization (MI1-1) and all the three organizations have a disaster
recovery plan in case of breakdown of IT infrastructure (MI1-2). With respect to
strategic planning for adopting higher technology: all the three organizations either plan
to adopt intranet within next 0-5 years (MI1-3) or already have it installed; BO and
PMCO plan to utilize project web sites for project management (MI1-4) in next 0-5
years, but AO has no plan for adopting this technology; all the three organizations feel
that within next 5-10 years it would be viable and imperative to adopt videoconferencing
(MI1-5). Only BO and PMCO provide training to their employees for updated IT
infrastructure and use of ICT (MI1-6) and all the three organizations either have an in-
house IT department or take services of IT consultants for planning, implementing and
maintaining IT systems (MI1-7).
Fig. 7.4: Comparison of Performance Measures Values
of MI1
0 1 2 3
MI1-1
MI1-2
MI1-3
MI1-4
MI1-5
MI1-6
MI1-7
Values
Best Practice Value
BO
PMCO
AO

__________________________________________________________________________________
Page 214
Chapter 7: Benchmarking Framework Development and Case Study Analysis
MI2 - Strategic project communication
Fig. 7.5: Comparison of Performance Measures Values
of MI2
0 1
MI2-4
MI2-3
MI2-2
MI2-1
Values
Best Practice Value
BO
PMCO
AO
Fig. 7.5 indicates that all the three organizations strategically plan for project
communications in terms of report formats (MI2-1), periodicity of reports (MI2-2) and
periodicity of meetings (MI2-3) to be conducted during the project. But, only PMCO
implements required and uniform ICT adoption by project agencies through project
scope (MI2-4).
MI3 - Measuring benefits of use of ICT
Fig. 7.6 indicates that all the three organizations measure benefits of use of ICT (MI3-1).
But, it is subjective or qualitative measurement (MI3-7) and not quantitative
measurement (MI3-6). All the three organizations assess benefits with respect to project
success (MI3-2), only PMCO assesses benefits with respect to effective team
management (MI3-3), AO assesses benefits of effective use of technology (MI3-4) and
all the three organizations assess benefits with respect to increased organizational
With respect to the MI ‘Strategic project communication’ PMCO reflects best
practice for the industry.

__________________________________________________________________________________
Page 215
Chapter 7: Benchmarking Framework Development and Case Study Analysis
efficiency (MI3-5). Thus, project success and increased organizational efficiency are
considered as important areas by all the three organizations.
Fig. 7.6: Comparison of Performance Measures Values
of MI3
0 1
MI3-7
MI3-5
MI3-3
MI3-1
Values
Best Practice Value
BO
PMCO
AO
MI4 - ICT infrastructure
Fig. 7.7 indicates that in all the three organizations more than 90% office staff has access
to computers (MI4-1), but only in AO more than 90% site staff has access to computers
(MI4-2). In BO and PMCO 45%-90% of site staff has access to computers. The
difference could be because of the fact that AO has only one engineer at each site, but
BO and PMCO have more staff including site supervisors. As indicated earlier also in
MI1, none of the organizations utilizes project web sites for project management (MI4-
3). AO does not have a centralized database (MI4-4) and only BO has intranet facility in
the organization (MI4-5). All the organizations have Internet connection at project sites
(MI4-6), LAN connection in office (MI4-7), use of MS Office for general administration
works at office and at sites (MI4-8, MI4-10) and adobe acrobat reader installed in office
computers (MI4-9). Only BO has adobe acrobat reader installed in computers at project
sites. In all the three organizations, majority of e-information communication between
head office and project sites is via physical transfer of data storage media like CDs etc.
and internet/intranet (MI4-12), but for communication between head office and other

__________________________________________________________________________________
Page 216
Chapter 7: Benchmarking Framework Development and Case Study Analysis
agencies in BO it is primarily through internet (MI4-13). BO and PMCO keep backup of
electronic data in storage disks as well as external/internal hard disk (MI4-14), but AO
keeps it only in storage disks. In all the three organizations, portable communication
technology being utilized is only mobile phone (MI4-15).
Fig. 7.7: Comparison of Performance Measures Values
of MI4
0 1 2 3
MI4-15
MI4-14
MI4-13
MI4-12
MI4-11
MI4-10
MI4-9
MI4-8
MI4-7
MI4-6
MI4-5
MI4-4
MI4-3
MI4-2
MI4-1
Values
Best Practice Value
BO
PMCO
AO
Issues of project web sites and intranet facility have been included in MI1 as well as
MI4 because both the indicators need reference to these issues for complete definition.
Thus, such a framework would allow the participants to evaluate their organizations for
individual indicators also.

__________________________________________________________________________________
Page 217
Chapter 7: Benchmarking Framework Development and Case Study Analysis
MI5 - ICT for general administration
Fig. 7.8 indicates that in all the three organizations majority of the information flows
within the office (MI5-1) and between office and project sites (MI5-2) for general
administration is through e-mail and hard copies. With respect to communication
between the head office and clients (MI5-3), BO primarily communicates through hard
copies, PMCO primarily communicates through e-mails and AO primarily uses a
combination of the two methods. With respect to communication between head office
and consultants (MI5-4), PMCO again primarily communicates through e-mails, and BO
and AO primarily use a combination of the two methods.
Fig. 7.8: Comparison of Performance Measures Values
of MI5
0 1 2 3
MI5-12
MI5-11
MI5-10
MI5-9
MI5-8
MI5-7
MI5-6
MI5-5
MI5-4
MI5-3
MI5-2
MI5-1
Values
Best Practice Value
BO
PMCO
AO

__________________________________________________________________________________
Page 218
Chapter 7: Benchmarking Framework Development and Case Study Analysis
In all the three organizations communication between head office and
contractors/material suppliers and other external agencies (MI5-5) flows as a
combination of e-mails and hard copies. In BO and AO, information from the project
sites to other agencies (MI5-6) primarily flows through hard copies, but in PMCO it is
through a combination of the above discussed methods. In B, meetings between head
office and site staff (MI5-7), between head office and clients (MI5-10) and joint
meetings between all the agencies (MI5-11) are primarily conducted as teleconferences.
But in PMCO and AO these are primarily conducted as personal meetings. In all the
three organizations meetings between head office and clients (MI5-8) and consultants
(MI5-9) are primarily conducted as personal meetings. AO accesses majority of external
information (MI5-12) as hard copies, though other two organizations access it through e-
sources.
MI6 - ICT for time management
Fig. 7.9 indicates that in BO, time schedules of all the project stages and between all the
agencies are primarily communicated as e-mails and hard copies. In PMCO trend is the
same only for communicating time schedules between head office and clients or
consultants (MI6-1,3,6). With respect to the communication between head office and
project sites (MI6-2,5,8) or contractors/material suppliers (MI6-4,7,10) it is primarily
through e-mails. In AO also trend is the same as in BO except for some time schedule
reports that are communicated primarily as hard copies. Variance analysis reports (MI6-
11,12,13) are primarily communicated as hard copies and e-mails.

__________________________________________________________________________________
Page 219
Chapter 7: Benchmarking Framework Development and Case Study Analysis
Fig. 7.9: Comparison of Performance Measures Values
of MI6
0 1 2 3
MI6-13
MI6-12
MI6-11
MI6-10
MI6-9
MI6-8
MI6-7
MI6-6
MI6-5
MI6-4
MI6-3
MI6-2
MI6-1
Values
Best Practice Value
BO
PMCO
AO
MI7 - ICT for cost management
Fig. 7.10 indicates that in BO, cost management reports at all the project stages and
between all the agencies are primarily communicated as e-mails and hard copies. In
PMCO also trend is primarily the same except for the detailed cash flow report to
contractors/material suppliers (MI7-4) and cost variance reports (MI7-6) to clients or
consultants. In AO more communication flows through hard copies only.
The gaps in this indicator are not significant, thus further investigation is not considered.

__________________________________________________________________________________
Page 220
Chapter 7: Benchmarking Framework Development and Case Study Analysis
Fig. 7.10: Comparison of Performance Measures Values
of MI7
0 1 2 3
MI7-6
MI7-5
MI7-4
MI7-3
MI7-2
MI7-1
Values
Best Practice Value
BO
PMCO
AO
MI8 - ICT for project administration and resource management
Fig. 7.11 indicates that in all the organizations majority of the bids for the project work
(MI8-1) are received as hard copies, tender meetings and negotiations are primarily
conducted as personal meetings (MI8-2), and interviews for hiring project staff (MI8-3)
and majority of design review meetings (MI8-4) are conducted as personal meetings. In
PMCO and AO design changes are primarily communicated (MI8-5) as e-mails, but in
BO these are communicated both as e-mails and hard copies. In PMCO, information
regarding materials (MI8-6) is primarily accessed through e-sources, but in BO and AO
as hard copies. In all the organizations, meetings with the material suppliers (MI8-7) are
primarily conducted as personal meetings and materials management records at sites
(MI8-8) are primarily prepared in MS Excel or customized software. For manpower
resource management records (MI8-9), trend is the same for BO and PMCO, but in AO
these are primarily prepared in MS Word even though MS Excel has more features for
analysis of data. In all the three organizations, project documents are primarily stored as
hard copies and electronic copies at offices (MI8-10). At project sites (MI8-11), trend
remains the same for BO and PMCO, but in AO these are primarily stored as hard
copies.

__________________________________________________________________________________
Page 221
Chapter 7: Benchmarking Framework Development and Case Study Analysis
Fig. 7.11: Comparison of Performance Measures Values
of MI8
0 1 2 3
MI8-11
MI8-10
MI8-9
MI8-8
MI8-7
MI8-6
MI8-5
MI8-4
MI8-3
MI8-2
MI8-1
Values
Best Practice Value
BO
PMCO
AO
Overall Comparison
Comparison of the three organizations with respect to total MI values (Fig. 7.12) shows
that for strategic planning indicators (MI1, MI2, MI3), PMCO has the highest value and
AO has the lowest. PMCO reflects best practice for ‘Strategic project communication’
(MI2). BO is a relatively larger organization as compared to other two organizations but
benefit assessment values of BO (MI3) are less as compared to the other two
organizations and AO lags in ‘Strategic planning for use of ICT’ (MI1).

__________________________________________________________________________________
Page 222
Chapter 7: Benchmarking Framework Development and Case Study Analysis
Rating values of three organizations for Strategic indicators (MI1+ MI2+ MI3) could
range from (3-24). Their calculated values are as given below (Ref. Appendix D):
BO: 19, PMCO: 21, AO: 16.
The strategic indicators are leading indicators for PMCO and BO. But, they are lagging
indicators for AO.
Fig. 7.12: Comparison of Measurement Indicator Values
for Three Organizations
0 10 20 30 40
MI1
MI2
MI3
MI4
MI5
MI6
MI7
MI8
MI Values
Best Practice Value
BO
PMCO
AO
In indicators measuring use of ICT for general administration works (MI4, MI5), AO is
lagging in both, BO has better IT infrastructure as compared to other two organizations,
but PMCO’s use of ICT for general administration works is highest. In indicators
measuring use of ICT for project management processes, PMCO has the highest values
and BO has values a little higher than those of AO.

__________________________________________________________________________________
Page 223
Chapter 7: Benchmarking Framework Development and Case Study Analysis
Rating values of three organizations for two groups of indicators are as given below
(Ref. Appendix D):
(MI4+MI5) (MI6+MI7+MI8)
Range: 18-62 Range: 30-69
BO: 42 BO: 56
PMCO:40 PMCO:64
AO: 35 AO: 52
The analysis shows that organizations’ strategic planning for use of ICT is high, but gap
between their use of ICT and the best practice is more. With respect to the best practice,
indicators MI4 to MI5 are lagging indicators for all the three organizations and MI6-
MI8 are leading indicators for PMCO.
Above analysis identified trends, which indicate the reasons for less values of use of
ICT. Identified trends and gaps in practice of the individual organizations are listed in
Table 7.1. 17 gaps and 10 trends are identified. Gaps G10 and G12 of BO and AO are
also listed as trends because values of PMCO are also not very high for these measures.
These trends were also identified in questionnaire data analysis in Chapter 5. Table 7.2
categorizes the identified trends as already identified issues, hypotheses or new
identified issues.
Table 7.1: Identified Gaps in Practice and Trends Performance
Measure
Gap in
Practice
Industry
Trend
Issue Organization(s)
MI1-1 G1 Organization does not have a strategy for
use of ICT within the organization
AO
MI1-4 G2 Organization has no plans for utilizing
project web sites for project management
AO
MI1-5 T1 Videoconferencing is not planned to be
adopted in next 0-5 years.
BO/PMCO/AO
MI1-6 G3 Training of employees not conducted AO
MI2-4 G4 Project scope does not require use of ICT
by project team agencies
BO/AO
MI3-3 G5 Benefits with respect to effective team
management not assessed
BO/AO
MI3-4 G6 Benefits with respect to effective use of
technology not assessed
BO/PMCO
MI3-6 T2 Quantitative measurement of benefits not
conducted
BO/PMCO/AO

__________________________________________________________________________________
Page 224
Chapter 7: Benchmarking Framework Development and Case Study Analysis
Table 7.1 Continued
MI4-2 G7 Only 45%-90% site staff has access to
computers
BO/PMCO
MI4-4 G8 Centralized database is not maintained in
the organization
AO
MI4-5 G9 Intranet facility is not installed in the
organization
PMCO/AO
MI4-12 T3 Majority of e-information communicated
between head office and project sites is
not only through internet
BO/PMCO/AO
MI4-13 G10 Majority of e-information communicated
between head office and other agencies is
not only through internet
PMCO/AO
MI4-15 T4 Mobile phone is the only portable
communication technology being utilized
BO/PMCO/AO
MI5-1,2,3,4,5 G11 T5 Majority of general administration
information from head office primarily
gets communicated as hard copies and e-
mails
BO/AO
MI5-6 G12 Majority of information from site offices
primarily gets communicated as hard
copies
BO/AO
MI5-
7,8,9,10,11
T6 Majority of the meetings for general
administration are conducted as personal
meetings
BO/PMCO/AO
MI6, MI7 G13 T7 Majority of project time and cost
management processes information from
head office primarily gets communicated
as hard copies and e-mails
BO/AO
MI6 G14 Time schedules to clients and consultants
are communicated primarily as hard
copies and e-mails, but to project sites
and contractors/material suppliers, time
schedules are primarily communicated as
e-mails
PMCO
MI8-1 T8 Project bids are received as hard copies BO/PMCO/AO
MI8-2,3,4,7 T9 Project administration meetings are
primarily conducted as personal meetings
BO/PMCO/AO
MI8-6 G15 Information regarding materials is
primarily referred through hard copies
BO/AO
MI8-9 G16 Manpower resource management records
at sites are primarily prepared in MS
Word and not in MS Excel
AO
MI8-10 T10 Project records at offices are primarily
stored as hard copies as well as electronic
copies
BO/PMCO/AO
MI8-11 G17 Project documents at sites are primarily
stored as hard copies
AO

__________________________________________________________________________________
Page 225
Chapter 7: Benchmarking Framework Development and Case Study Analysis
Table 7.2: Categorization of Identified Trends Trend Hypothesis Identified Issue
(Chapter 5)
New Issue Identified
T1 9
T2 √
T3 9
T4 9
T5 C3
T6 HD6 C4
T7 C3
T8 13
T9 HD6 C4
T10 C2
The reasons for these gaps in practice and trends require qualitative study that
constitutes ‘Bench learning’ conducted through case study analysis.
7.4.3 Benchmarking Framework Validation and Finalization
While conducting the semi-structured interviews, the benchmarking framework was
discussed with senior executives of the organizations for its validity and for any
modifications required. No modification was suggested and all the interviewees
considered the suggested benchmarking framework as a pragmatic approach and as
providing basis for measuring extent of ICT adoption for building project management
by an individual organization and comparing organizations within the industry.
But, considering the nature of the construction industry and the targeted organizations
being SMEs with limited resources, interviewees suggested having a workable
benchmarking framework administration plan resulting in successful implementation of
the framework in the industry.
Also, in the data analysis, except for one new trend, all other identified trends match
with the issues identified during questionnaire data analysis.
Thus, the suggested benchmarking framework was validated and finalized.
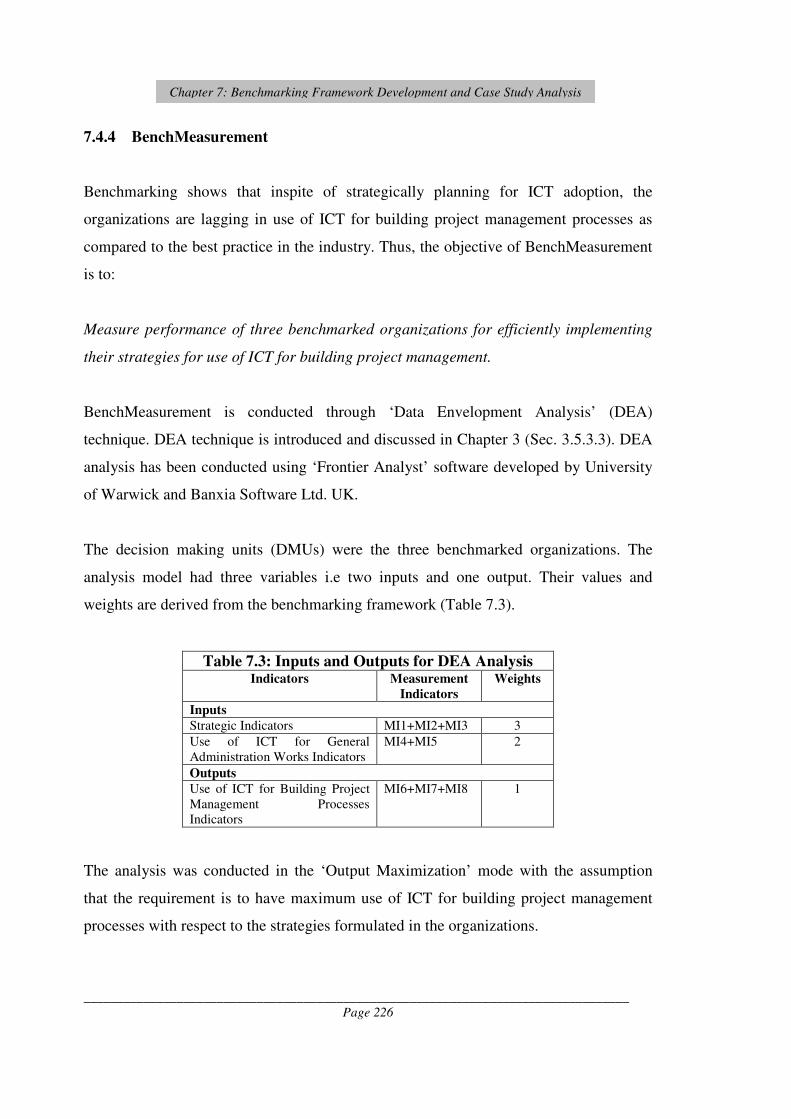
__________________________________________________________________________________
Page 226
Chapter 7: Benchmarking Framework Development and Case Study Analysis
7.4.4 BenchMeasurement
Benchmarking shows that inspite of strategically planning for ICT adoption, the
organizations are lagging in use of ICT for building project management processes as
compared to the best practice in the industry. Thus, the objective of BenchMeasurement
is to:
Measure performance of three benchmarked organizations for efficiently implementing
their strategies for use of ICT for building project management.
BenchMeasurement is conducted through ‘Data Envelopment Analysis’ (DEA)
technique. DEA technique is introduced and discussed in Chapter 3 (Sec. 3.5.3.3). DEA
analysis has been conducted using ‘Frontier Analyst’ software developed by University
of Warwick and Banxia Software Ltd. UK.
The decision making units (DMUs) were the three benchmarked organizations. The
analysis model had three variables i.e two inputs and one output. Their values and
weights are derived from the benchmarking framework (Table 7.3).
The analysis was conducted in the ‘Output Maximization’ mode with the assumption
that the requirement is to have maximum use of ICT for building project management
processes with respect to the strategies formulated in the organizations.
Table 7.3: Inputs and Outputs for DEA Analysis Indicators Measurement
Indicators
Weights
Inputs
Strategic Indicators MI1+MI2+MI3 3
Use of ICT for General
Administration Works Indicators
MI4+MI5 2
Outputs
Use of ICT for Building Project
Management Processes
Indicators
MI6+MI7+MI8 1

__________________________________________________________________________________
Page 227
Chapter 7: Benchmarking Framework Development and Case Study Analysis
The analysis was conducted in the ‘Variable Returns Scale’ mode with the assumption
that changing all the inputs i.e. strategies formulated for use of ICT and use of ICT for
general administration works’ by the same proportion changes the output i.e. ‘use of ICT
for building project management processes’ by a greater extent than the proportional
value. This assumption is derived from the results of SEM analysis discussed in Chapter
6 (Sec. 6.7)
Final weighted values of the inputs and outputs for each organization are as shown in
Table 7.4.
Table 7.4: Data Values for Three Analyzed Organizations Organization Strategic Indicators
(Input)
Use of ICT for
General Admin.
Works Indicators
(Input)
Use of ICT for
Building PM
Processes Indicators
(Output)
Value Weighted
Value
Value Weighted
Value
Value Weighted
Value
Builders (BO) 19 57 42 84 56 56
Project Management
Consultancy
Organization (PMCO)
21 63 40 80 64 64
Architectural
Organization (AO)
16 48 35 70 52 52
Analysis results show that based on the data available, PMCO and AO are the best
performing DMUs or the organizations with 100% efficiency scores and BO has 89.65%
efficiency score (Table 7.5). Information is also shown graphically in Appendix E. It
signifies that PMCO and AO are able to efficiently implement their strategies for use of
ICT, but BO is lagging in it.
Table 7.5: Efficiency Scores for Analyzed Organizations Organization Efficiency Score
Builders (BO) 89.65%
Project Management Consultancy Organization
(PMCO)
100%
Architectural Organization (AO) 100%

__________________________________________________________________________________
Page 228
Chapter 7: Benchmarking Framework Development and Case Study Analysis
With respect to the data values, ‘Reference comparison’ values are calculated. These
values show performance of the DMU being studied in comparison to 100% efficient
DMUs or ‘reference units’. The values of the DMU under study are scaled to 100% in
the graph, with comparison values also scaled accordingly to make the relationship more
obvious. Fig. 7.13 and Fig. 7.14 show comparison of data values of PMCO and AO with
respect to the data values of BO, where data values of BO are scaled to 100%. It shows
that the values of two indicators of PMCO are higher than those of BO. Values of input
indicators of AO are very less in comparison with those of BO, but the value of output
indicator is only 92% of that of BO.
Fig. 7.13: Reference Comparison Values of PMCO with respect
to BO

__________________________________________________________________________________
Page 229
Chapter 7: Benchmarking Framework Development and Case Study Analysis
For BO to be 100% efficient, with the same level of ‘strategic planning’, ‘use of ICT for
general administration works’ can reduce by 11.6 points (approx. 14%) and ‘use of ICT
for building PM processes’ should increase by 11.55 points (approx. 21%) (Table 7.6).
Graphical representation of the data is shown in Appendix E.
Table 7.6: Potential Improvement Required in BO Input/Output Actual Target Potential
Improvement
Strategic Indicators 57 57 0
Use of ICT for General
Administration Works
Indicators
84 74.26 -11.6
Use of ICT for Building
Project Management
Processes Indicators
56 62.47 11.55
‘Reference contribution’ displays the extent to which each reference unit or the efficient
unit has contributed in determining the efficiency of an inefficient unit. It is displayed as
a percentage. It provides information about the members of a unit’s reference set that
Fig. 7.14: Reference Comparison Values of AO with respect to BO

__________________________________________________________________________________
Page 230
Chapter 7: Benchmarking Framework Development and Case Study Analysis
have had the most influence in setting its targets for potential improvements. So, the
organization under study identifies the key units to compare its performance against.
Fig. 7.15 shows that the performance of BO has been primarily compared with PMCO
and minimally with AO i.e. performance targets of BO for two inputs and one output are
primarily defined by the efficiency values of PMCO. It is so because PMCO has high
rating values for inputs as well as outputs.
7.4.5 Benchmarking and BenchMeasurement Discussion
Above analysis shows that PMCO has the highest benchmarking ranking amongst the
three organizations and is also efficient in implementing its strategies. BO has the
middle ranking but is not efficient in implementing its strategies. AO is lowest in the
ranking but it is efficient in implementing its strategies, because its strategic use of ICT
is also less. Relation between rating and efficiency of analyzed organizations is shown in
Fig. 7.15: Reference Contribution Values of PMCO and AO for
Determining Potential Improvement Values of B

__________________________________________________________________________________
Page 231
Chapter 7: Benchmarking Framework Development and Case Study Analysis
Fig. 7.16. Best Practice Organization in the industry would have ‘High’ Benchmarking
rating and 100% BenchMeasurement efficiency.
The reasons for these results require qualitative study incorporating study of gaps in
practices and trends identified at Benchmarking stage. This study is a component of
‘Bench learning’ conducted through ‘Case Study Analysis’.
7.5 BenchLearning - Case Study Analysis
Case study analysis forms the qualitative analysis part of the research and was conducted
with the following objectives:
• To identify and validate the identified cultural, social, human and other
qualitative factors that are required to be considered for increasing effective ICT
adoption for Building Project Management by Small and Medium Enterprises
(SMEs).
• To assess the reasons for gaps in practice for ICT adoption for building project
management in the benchmarked organizations. Thus, complimenting
performance measurement or benchmarking with performance management or
bench-learning component.
Fig. 7.17 shows the relation between the three data analysis components of research.
High Best Practice
Organization
Medium BO PMCO, AO
Low
Ben
chm
ark
ing
Ra
tin
g
<100% 100%
BenchMeasurement Efficiency
Fig. 7.16: Relation between Rating and Efficiency of
Analyzed Organizations

__________________________________________________________________________________
Page 232
Chapter 7: Benchmarking Framework Development and Case Study Analysis
Case study organizations are the three benchmarked organizations.
The mode of conducting case studies was having discussions with a senior executive and
a project manager of each organization. Exploratory discussions are conducted in
qualitative research not only to reveal and understand the ‘what’ and ‘how’ but also to
place more emphasis on exploring the ‘why’ (Saunders et al. 2000, p.242-270). The
discussions were an extension of the semi-structured interviews conducted for suggested
benchmarking framework administration and finalization. Thus, the executives were
already aware of the objectives of the study.
Case studies have been conducted by studying the data collected from primary and
secondary sources. The primary data was collected from ‘Questionnaire survey data
analysis’ and ‘Benchmarking and BechMeasurement’ analysis. The secondary data was
collected through discussions conducted within the organizations.
Fig. 7.17: Relation between all Data Analysis Components
149 Organizations
Questionnaire Survey
Quantitative Data Analysis To identify and validate
identified cultural, social,
human and other
qualitative factors that
require consideration for
increasing effective use of
ICT for Building Project
Management by SMEs
3 Organizations
Case Study Analysis
Discussions - Qualitative
Analysis
(SAP-LAP Analysis)
Benchmarking Framework
Administration and
Finalization
Semi-structured Interviews -
Quantitative/Qualitative
Analysis
To assess the reasons for
gaps in practice for use of
ICT for building project
management identified for
benchmarked organizations

__________________________________________________________________________________
Page 233
Chapter 7: Benchmarking Framework Development and Case Study Analysis
Case study analysis utilizes SAP (situation-actor-processes) – LAP (learning-action-
performance) framework for research enquiry. Sushil (2000) has recommended SAP-
LAP as a systematic and formal analysis methodology for critically examining a case
study.
SAP-LAP analysis technique is introduced and discussed in Chapter 3 (Sec. 3.5.4.1).
The context for each case study organization includes: introduction of the organization;
discussion on the situation, actors and processes for ICT adoption in the organization
with respect to strategic issues for ICT adoption in the organization; extent of ICT
adoption within the organization; and factors perceived as affecting ICT adoption for
Building Project Management. Through SAP-LAP analysis, implicit issues of strategic
ICT adoption for building project management are identified. While learning issues
derived out of a particular case are applicable to similar other cases, this application
should be preceded by proper consideration (Duggal et al. 2001).
Basic introduction of the case study organizations with respect to their location, year of
establishment, expertise, organization structure, certifications, turnover and value of
executed projects is already discussed in Sec. 7.4.1 above. Description of each
organization with respect to use of ICT, Situation, Actors, Processes, Learning, Action
required and expected change in performance is discussed below for each organization.
Categories of Actors and Processes are the same for all the three organizations and are
discussed first. Tables 7.7, 7.8 and 7.9 identify the reasons for gaps in practice identified
for each case study organizations. These reasons include the social, cultural and Table
7.10 identifies the actions required to increase ICT adoption for building project
management in all the studied organizations and expected performance changes.

__________________________________________________________________________________
Page 234
Chapter 7: Benchmarking Framework Development and Case Study Analysis
7.5.1 Actors
The actors with respect to ICT adoption for building project management can be
categorized as internal and external actors as shown below. All these actors have
freedom of choice to some extent to use ICT for project management.
Internal actors: Senior managers of the organization
Office technical staff
Project site staff
External actors: Clients
Associating project team organizations
7.5.2 Processes
The processes using ICT for building project management are as listed below:
• General administration processes
• Time management processes
• Cost management processes
• Project administration and Resource management processes
7.5.3 Case Study 1: Builders (BO)
7.5.3.1 Introduction
The organization is itself the client for its projects and the buyers and financiers of their
projects are the indirect clients. Thus, their business objective is to provide high quality
service to their indirect clients in terms of the projects completed in time, within the
estimated budget and as per the specifications and also to integrate building project
management information with property management information.
IT was introduced in the office working by late 1980s and by 1994 it was also
introduced at the project sites. Initially it was a problem to have reliable IT infrastructure
at remote sites, but now it is not considered an issue. At present all work is IT enabled
and the prevalent international software are utilized for individual functions. The

__________________________________________________________________________________
Page 235
Chapter 7: Benchmarking Framework Development and Case Study Analysis
organization has its web site, but till now it is only designed for posting information
about the organization. It is planned to make it a functional web site for communicating
with external agencies. As per the strategy of the senior management, ERP
implementation within the organization was initiated in the year 2000 and the work was
awarded to an IT consultancy firm. Implementation was not successful and it was
analyzed that any such initiative requires in-house monitoring. Consequently in 2003, an
IT department was initiated within the organization. This department plans and
implements use of IT within the organization as per the strategies formulated by the
senior management. In the process of ERP implementation, IT infrastructure within the
organization was enhanced and it is a view within the organization that even though
ERP implementation was not successful, staff got the chance to work more on the
computers, thus increasing their IT capability. Annual Maintenance Contract (AMC) for
maintaining IT infrastructure is outsourced to external agencies.
Periodically in-house training of the old staff is conducted for upgradation of their IT
skills or they are provided assistance for getting training from outside. The new
technical staff that is hired has training of IT tools and technologies. There is a practice
of hiring staff directly at senior levels also and some of these managers are not IT
trained and also find it difficult to adopt use of IT. Turnover of the staff is an issue, but it
has been resolved to some extent as the organization has entered into an agreement with
their competitors in the city for not hiring staff from each other’s organization.
As per the benchmarking framework discussed above, the organization has a middle
level rating for ICT adoption for building project management. But, it is at the higher
end of middle level rating. It’s efficiency score for implementing its strategies for use of
ICT is 89.6%.

__________________________________________________________________________________
Page 236
Chapter 7: Benchmarking Framework Development and Case Study Analysis
7.5.3.2 ICT Adoption for Building Project Management – Strategic Issues
The senior management has formulated a strategy for use of IT within the organization
and it is focused on financial management, materials management and project
implementation. It is aligned with their business objectives and market requirements. It
is regularly updated. The organization functions on maintaining working relationship
with their associating agencies. Most of the contractors and other associating agencies
have been working with them for a long time and a working methodology has developed
between these agencies and the organization under study. Thus, even though use of ICT
for their projects is not defined through relevant contract clauses, the contractors and
other external agencies primarily use ICT on the projects as per the strategy of the
organization.
The senior management in the organization subjectively evaluates benefits of use of ICT
for increased organizational efficiency and for specific projects with respect to the
measures of project success.
For majority of the projects, communication management planning with respect to the
report formats, periodicity of reports and meetings is done at the start of the project. At
office and at project sites, majority of the documents are stored as hard copies and
electronic copies. The organization has a disaster recovery plan for the breakdown of IT
infrastructure in the form of electronic backup of data and IT consultants who have
AMC for their IT infrastructure.
7.5.3.3 Extent of CT Adoption for Building Project Management
Majority of the office and project site staff have access to computers. Data is stored in a
centralized database. All the project sites have Internet connection and all the staff
including that of the contractors and other agencies interacts through mobile phones.
But, mobile Internet is not being used. Electronic information from head office to sites
and to the other agencies is communicated through e-mail or sometimes physically
through data storage media like floppies/CDs/USB drives. Also, some e-mails are

__________________________________________________________________________________
Page 237
Chapter 7: Benchmarking Framework Development and Case Study Analysis
followed by hard copies sent for record purpose. From the project sites, majority of the
e-mails are followed by hard copies. All the meetings conducted during the course of the
design and execution stage of the projects are conducted as personal meetings. External
information is primarily referred from e-sources. The organization has Intranet installed,
but advanced ICT tools like project web sites are not being utilized for building project
management and videoconferencing is also not used as a tool for conducting meetings.
These tools would be adopted as per the requirement of market forces, which they
foresee as a timeframe of (0-5) years for project web sites and (5-10) years for
videoconferencing.
Time and cost management documents are primarily communicated as e-mails and hard
copies. E-tendering has not been adopted as bids are received as hard copies and
negotiations are also done through personal meetings. On their projects, design changes
are primarily communicated as e-mails and hard copies. Material management as well as
manpower resource management records are maintained in Excel documents. Legality of
e-documents is an issue. But, there is a change in the scenario as responses to RFIs are
accepted as e-mails, even though major works at sites are executed only when hard copy
information and approval is delivered at site.
7.5.3.4 Perceptions of the Senior Managers and Project Managers
The senior managers have a pro-active approach towards use of ICT in the organization
and consider ICT as an integral part of the strategy for providing high quality services to
their clients, which is their business objective.
50%-60% of the senior management staff are ICT savvy and are able to handle their ICT
requirements. This is in fact an enabler, as these managers are able to communicate
directly within the organization from any location. Others require secretarial help for
day-to-day functions. But, majority of the senior staff is not aware of the features of
advanced ICT tools like web based project management or videoconferencing. Thus,
these tools are not a part of their strategy.

__________________________________________________________________________________
Page 238
Chapter 7: Benchmarking Framework Development and Case Study Analysis
Project managers are provided training for updated IT tools and are aware of the
advantages of using ICT for project management. They support the strategies of the
senior management, but are not a part of the team formulating the strategy.
7.5.3.5 Factors Perceived as affecting ICT Adoption for Building Project
Management
The senior manager and the project manager considered following factors defining ICT
adoption for building project management:
• At the organizational level as well as at the project level, perspective of the
senior managers towards effectiveness of use of ICT is important, as they are
required to drive use of ICT in the organization and in the projects.
• Successful implementation of IT initiatives requires in-house monitoring and
expertise.
• At the project level, a close working relationship between associating team
agencies for successive projects is considered as an important factor.
• Cost of ICT infrastructure, cost of hiring IT trained staff and cost of providing
training are not considered as affecting factors, because these are considered as
integral part of the cost to be borne by the organization for providing high
quality services and an important component of their business objectives.
• Day-to-day IT help/support both at the office and at sites is perceived as
important.
7.5.3.6 Situation
The situation in the organization with respect to ICT adoption for building project
management can be summarized as:
• Extent of ICT adoption on the projects is primarily defined by the organization’s
strategy for use of ICT. But, its efficiency score for implementing its strategies is
89.6%.

__________________________________________________________________________________
Page 239
Chapter 7: Benchmarking Framework Development and Case Study Analysis
• Perceptions of the senior managers of the organization are considered as important
factors affecting use of ICT in the organization and on the projects.
• Benefits of use of ICT are subjectively evaluated for increased organizational
efficiency and measures of project success.
• All work in the organization is IT enabled and prevalent international software are
utilized for individual functions.
• Organization has a centralized database.
• As a part of the disaster recovery plan and day-to-day IT help/support, IT
infrastructure at office and project sites is maintained through AMC awarded to an
external IT consultant. Software are regularly upgraded.
• The organization is utilizing ICT for building project management. But, the rating as
per the developed benchmarking tool is at the higher end of middle level rating.
• Adequate IT infrastructure is maintained at office and project sites.
• The organization has Intranet installed.
• IT trained staff is hired or training is provided to the old staff for upgradation of their
skills. In-house training is conducted or staff is provided assistance for training from
outside.
• Project communication management planning with respect to the reports and
meetings is done at the start of the project.
• E-mail is used extensively for project management. But, advanced ICT tools like
project web sites, videoconferencing and mobile Internet are not used.
• Meetings are primarily conducted as personal meetings.
• E-tendering has not been adopted.
• External information is primarily referred through electronic sources, but
information regarding materials is referred primarily through hard copies.
• E-mails of project management documents from office as well as from project sites
are primarily followed by hard copies for record purposes.

__________________________________________________________________________________
Page 240
Chapter 7: Benchmarking Framework Development and Case Study Analysis
7.5.3.7 Learning
The organization has a strategy for use of ICT in the organization and for the projects,
which defines the methodologies for its implementation. The strategy is defined and
driven by the market forces and requirements. But the strategy is not an initiative to be
the market leaders in use of ICT as advanced ICT tools are not used and as per the
benchmarking framework discussed above, the organization is at the higher end of
middle level rating for use of ICT for building project management. Also, strategies are
not being efficiently implemented in the organization. Senior managers of the
organization view ICT as an important tool for providing high quality services.
The study shows that following supply chain and HR issues define increased use of ICT
in the organization:
• At the organization level, reduced turnover of staff achieved by having an
agreement with the competitors in the city for not hiring staff from each other’s
organization
• At the project level, a close working relationship and a working methodology
developed between associating team agencies. It is achieved due to a long term
working relationship with the agencies.
• Staff is provided training for use of advanced IT tools and technologies.
The benchmarking framework administration identified gaps in practice for the
organization. Table 7.7 identifies the reasons for the gaps in practice.
Internal actors are proactive and ICT trained. External actors define use of ICT in the
organization through the market requirement or the ‘situation’. Data generated and
analyzed for the processes can be communicated through use of ICT. Thus ‘Situation’
is the dominant component in BO.

__________________________________________________________________________________
Page 241
Chapter 7: Benchmarking Framework Development and Case Study Analysis
Table 7.7: Gaps in Practice and the Identified Reasons (B) Gap in Practice Issue Reason
G4 Project scope does not require use of ICT by
project team agencies
Not perceived as important due
to working methodology
developed between associating
project team agencies.
G5 Benefits with respect to effective team
management not assessed
G6 Benefits with respect to effective use of
technology not assessed
It is perceived that these benefits
are being achieved. Thus formal
assessment not conducted.
G7 Only 45%-90% site staff has access to
computers
Majority of the site supervisors
do not have IT training as their
technical expertise is considered
important.
G11 Majority of general administration information
from head office primarily gets communicated
as hard copies and e-mails
This is also a trend in the
industry.
G12 Majority of information from site offices
primarily gets communicated as hard copies • All site staff do not have ICT
training.
• Some of the external agencies
like sub-contractors do not
communicate through e-mails.
G13 Majority of project time and cost management
processes information from head office
primarily gets communicated as hard copies and
e-mails
This is also a trend in the
industry.
G15 Information regarding materials is primarily
referred through hard copies
A system developed due to staff
structure in the organization, as
all the senior managers are not
ICT savvy.
7.5.4 Case Study 2: Project Management Consultancy Organization (PMCO)
7.5.4.1 Introduction
Since the inception of the organization, IT was introduced in the organization working.
At present all the work is IT enabled and the prevalent international software are utilized
for individual functions. The organization has its web site, but till now it is used only for
posting information about the organization. They plan to make it a functional web site
for communicating with external agencies. An IT consultancy firm is awarded the
Annual Maintenance Contract (AMC) for maintaining IT infrastructure and software
being used are regularly updated.

__________________________________________________________________________________
Page 242
Chapter 7: Benchmarking Framework Development and Case Study Analysis
Periodically, training of the old staff is conducted for upgradation of their IT skills. The
new technical staff that is hired has training of IT tools and technologies. The staff hired
directly at senior levels is also required to adopt ICT as defined in the organization. Due
to its pro-active HR policies, organization has been able to retain their staff and consider
them as their strength. Thus, staff turnover is not an issue in the organization.
As per the benchmarking framework discussed above, the organization has a middle
level rating for use of ICT for building project management, but it is at the higher end of
middle level rating. It has also been assessed as efficient in implementing its strategies
for use of ICT.
7.5.4.2 ICT Adoption for Building Project Management – Strategic Issues
The organization has a strategy for use of ICT within the organization and for building
project management. It is aligned with their business objectives and is regularly updated.
Thus, extent of use of ICT on their projects is aligned with their ICT strategy after
consultation with their clients. Contractors’ and other agencies’ use of ICT is also
defined accordingly with the help of relevant contract clauses.
The senior management in the organization subjectively evaluates benefits of use of ICT
for increased organizational efficiency and for specific projects with respect to the
measures of project success and effective team management, since team working is an
important issue in the projects of the scale being managed by them. The organization has
drafted detailed manuals for executing project management processes with respect to the
nine knowledge areas as defined in PMI’s PMBOK and communication management is
one of the knowledge areas. The manual related to communication management defines
methodologies of using ICT for different categories of building projects. These manuals
are periodically upgraded.
For majority of the projects, communication management planning with respect to the
report formats, periodicity of reports and meetings is done at the start of the project. At

__________________________________________________________________________________
Page 243
Chapter 7: Benchmarking Framework Development and Case Study Analysis
the office and at project sites, majority of the documents are stored as hard copies and
electronic copies. The organization has a disaster recovery plan for breakdown of IT
infrastructure in the form of electronic backup of data and IT consultants who have
AMC for their IT infrastructure.
7.5.4.3 Extent of ICT Adoption for Building Project Management
All the office staff and majority of the project site staff have access to computers. Data is
stored in a centralized database. All the project sites have Internet connection and all the
staff including that of the contractors and other agencies interact through mobile phones.
But, mobile Internet is not being used. Electronic information from head office to the
sites and to other agencies is communicated through e-mail or sometimes physically
through data storage media like floppies/CDs/USB drives. Also, some e-mails are
followed by hard copies sent for record purpose. From the project sites, majority of the
e-mails are followed by hard copies. All the meetings conducted during the course of the
design and execution stage of projects are conducted as personal meetings. External
information is primarily referred from e-sources. The organization has LAN at office but
does not have an Intranet, and plans to install it within a year. Advanced ICT tools like
project web sites are not being utilized for building project management and
videoconferencing is also not used as a tool for conducting meetings. They plan to
initiate project management through project web sites within a year, but they do not have
an immediate plan for adopting videoconferencing unless required by the clients and the
market forces.
The time and cost management documents are primarily communicated as e-mails and
sometimes these are followed by hard copies also. E-tendering has not been adopted as
bids are received as hard copies and negotiations are also done through personal
meetings. Design changes are primarily communicated as e-mails. Earlier drawings were
e-mailed in ‘dwg’ format, but in view of data security, now these are mailed in ‘pdf’
format. Material management as well as manpower resource management records are
maintained in MS Excel documents. Legality of e-documents is an issue. But, there is a
__________________________________________________________________________________
Page 244
Chapter 7: Benchmarking Framework Development and Case Study Analysis
change in scenario and responses to RFIs are accepted as e-mails as well as message
through mobile phones, but signed hard copies for these responses are required for
record purposes.
7.5.4.4 Perceptions of the Senior Managers and Project Managers
The senior managers have a pro-active approach towards use of ICT in the organization
and consider ICT as an integral part of the strategy for providing high quality services to
their clients and a part of their business objectives.
Majority of the senior staff is ICT savvy and are able to handle their ICT requirements.
They are also aware of the features of advanced ICT tools like web based project
management or videoconferencing. But, at present they are not convinced about their
requirement and benefits if used in the Indian construction industry.
Project managers are provided training for updated IT tools and are aware of the
advantages of using ICT for project management. They support the strategies of the
senior management and also contribute in the formulation of strategy for use of ICT
because of their knowledge of logistics of implementing the strategy.
7.5.4.5 Factors Perceived as affecting ICT Adoption for Building Project
Management
The senior manager and the project manager considered following factors defining ICT
adoption for building project management:
• At the organizational level, perspective of the senior managers towards
effectiveness of use of ICT is important, as they are required to drive use of ICT
in the organization.
• At the project level also there is a requirement to have a champion for use of
ICT. With respect to this organization, it acts as the champion and defines use of

__________________________________________________________________________________
Page 245
Chapter 7: Benchmarking Framework Development and Case Study Analysis
ICT on its projects. Thus, it does not consider client’s or principal contractors’
perception as important factors.
• The cost of ICT infrastructure, cost of hiring IT trained staff and cost of
providing training are not considered as affecting factors, because these are
considered as integral part of the cost to be borne by the organization for
providing high quality services and an important component of their business
objectives.
• Size, cost and criticality of the project are considered as important factors. In
large size and high cost projects, normally upto the last level of sub-contractors
in the supply chain are relatively bigger organizations, leading to more effective
use of ICT. In critical and fast track projects, higher use of ICT is an important
component of the strategic planning for that project.
• Day-to-day IT help/support is available both at office and at sites. The
organization has regular IT support at office in the form of AMC and endeavors
to provide similar support at their project sites. But, sometimes it is a problem at
the project sites.
7.5.4.6 Situation
The situation in the organization with respect to use of ICT for building project
management can be summarized as:
• Extent of ICT adoption on the projects is primarily defined by the organization’s
strategy for use of ICT and the organization is assessed to be efficiently
implementing its strategies.
• Benefits of ICT adoption are subjectively evaluated for increased organizational
efficiency, measures of project success and effective team management.
• All work in the organization is IT enabled and prevalent international software are
utilized for individual functions.
• The organization maintains a centralized database.
• The organization has not installed Intranet.
__________________________________________________________________________________
Page 246
Chapter 7: Benchmarking Framework Development and Case Study Analysis
• The organization is utilizing ICT for building project management. But, the rating as
per the developed benchmarking tool is at the higher end of middle level rating.
• Adequate IT infrastructure is maintained at office and project sites.
• As a part of the disaster recovery plan and day-to-day IT help/support, IT
infrastructure at office and project sites is maintained through AMC awarded to an
external IT consultant. Software are regularly upgraded.
• IT trained staff is hired or training is provided to old staff for upgradation of their
skills. In-house training is conducted. Proactive HR policies of the organization
including that of training the staff help in retaining their staff.
• Project communication management planning with respect to the reports and
meetings is done at the start of the project.
• E-mail is used extensively for project management. But, advanced IT tools like
project web sites, videoconferencing and mobile Internet are not used.
• Meetings are primarily conducted as personal meetings.
• E-tendering has not been adopted.
• External information is primarily referred through electronic sources.
• E-mails of the project management documents from office as well as from the
project sites are partially followed by hard copies for record purposes.
• Perceptions of the senior managers of the organization are considered as important
factors affecting use of ICT in the organization and on projects. Perceptions of the
clients and principal contractors are not considered as important factors because
extent of use of ICT on the projects is primarily defined by the organization’s
strategy of use of ICT, which is further defined by the perceptions of the senior
managers of the organization.
• Size, cost and criticality of the project are considered as important factors affecting
use of ICT on projects.
7.5.4.7 Learning
The organization has a strategy for use of ICT in the organization and for the projects,
which defines the methodologies for its implementation. But, advanced ICT tools are not
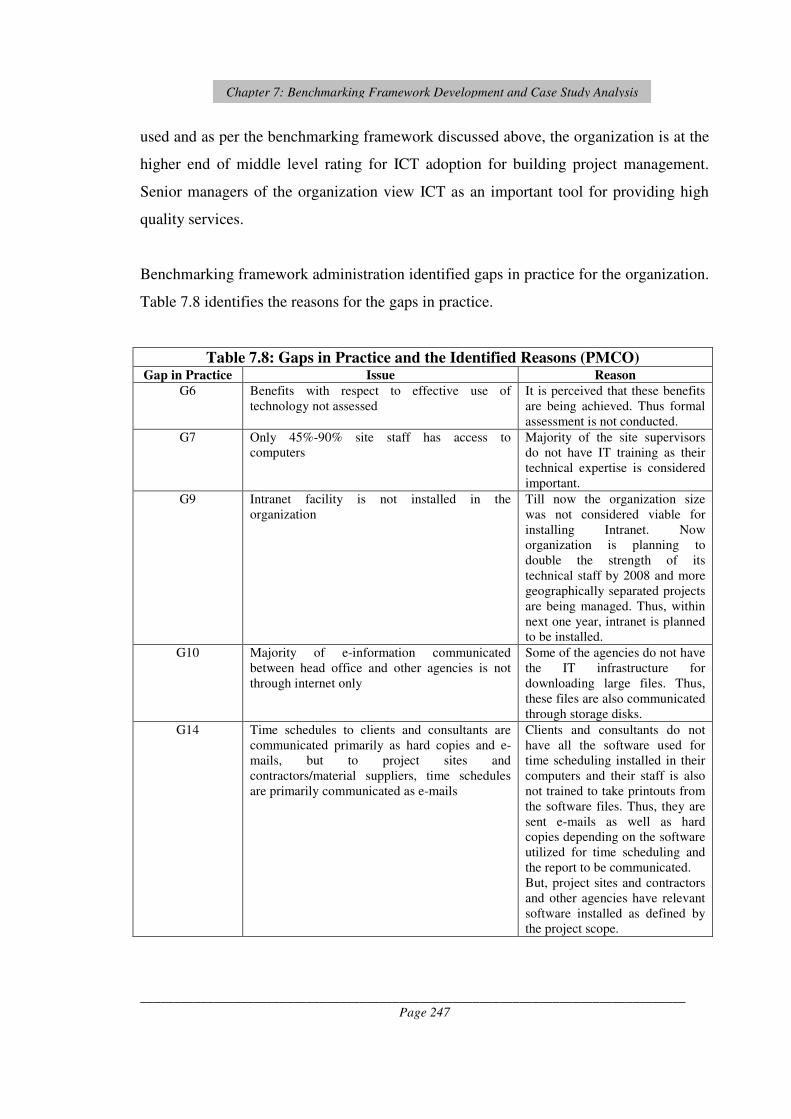
__________________________________________________________________________________
Page 247
Chapter 7: Benchmarking Framework Development and Case Study Analysis
used and as per the benchmarking framework discussed above, the organization is at the
higher end of middle level rating for ICT adoption for building project management.
Senior managers of the organization view ICT as an important tool for providing high
quality services.
Benchmarking framework administration identified gaps in practice for the organization.
Table 7.8 identifies the reasons for the gaps in practice.
Table 7.8: Gaps in Practice and the Identified Reasons (PMCO) Gap in Practice Issue Reason
G6 Benefits with respect to effective use of
technology not assessed
It is perceived that these benefits
are being achieved. Thus formal
assessment is not conducted.
G7 Only 45%-90% site staff has access to
computers
Majority of the site supervisors
do not have IT training as their
technical expertise is considered
important.
G9 Intranet facility is not installed in the
organization
Till now the organization size
was not considered viable for
installing Intranet. Now
organization is planning to
double the strength of its
technical staff by 2008 and more
geographically separated projects
are being managed. Thus, within
next one year, intranet is planned
to be installed.
G10 Majority of e-information communicated
between head office and other agencies is not
through internet only
Some of the agencies do not have
the IT infrastructure for
downloading large files. Thus,
these files are also communicated
through storage disks.
G14 Time schedules to clients and consultants are
communicated primarily as hard copies and e-
mails, but to project sites and
contractors/material suppliers, time schedules
are primarily communicated as e-mails
Clients and consultants do not
have all the software used for
time scheduling installed in their
computers and their staff is also
not trained to take printouts from
the software files. Thus, they are
sent e-mails as well as hard
copies depending on the software
utilized for time scheduling and
the report to be communicated.
But, project sites and contractors
and other agencies have relevant
software installed as defined by
the project scope.

__________________________________________________________________________________
Page 248
Chapter 7: Benchmarking Framework Development and Case Study Analysis
The internal actors are proactive and ICT trained. Amongst external actors, project team
agencies’ use of ICT is defined by the contract clauses and clients do not define use of
ICT extensively for the projects as the organization has a well-defined strategy for the
same. Data generated and analyzed for the processes can be communicated through use
of ICT. The strategy for use of ICT by the organization is defined by the market
requirements or the ‘situation’. Thus ‘Situation’ is the dominant component in
PMCO.
7.5.5 Case Study 3 – Architectural Organization (AO)
7.5.5.1 Introduction
IT was introduced in the organization working by 1996. At present, all work is IT
enabled and prevalent international software are utilized for individual functions. The
organization does not have its web site, but plans to have a web site within a year. An IT
consultancy firm is awarded the Annual Maintenance Contract (AMC) for maintaining
IT infrastructure and software being used are regularly updated.
The organization plans to expand and hire more staff. But, being a small organization, it
becomes difficult for them to retain the technical staff or hire experienced and trained
technical staff. So, the technical staff primarily gets training while working i.e. on the
job and joins bigger organizations after some time. Thus, indirectly the organization is
training the staff as per the requirement, but high staff turnover affects continuity of use
of ICT. They are able to retain the administrative staff.
As per the benchmarking framework discussed above, the organization has a middle
level rating for use of ICT for building project management and is able to efficiently
implement its strategies.

__________________________________________________________________________________
Page 249
Chapter 7: Benchmarking Framework Development and Case Study Analysis
7.5.5.2 ICT Adoption for Building Project Management – Strategic Issues
The organization does not have a strategy for use of ICT and extent of use of ICT on a
project is defined by the client’s requirements. It is due to the following two reasons:
• The organization manages most of its building projects as default project
managers and some of its projects are managed by PMCOs. Since they are the
default project managers on their projects, they are not able to define use of ICT
as the scope of work for contractors and other agencies.
• The clients’ requirements and market forces define the extent of use of ICT.
The principals in the organization subjectively evaluate benefits of use of ICT for
increased organizational efficiency and for specific projects with respect to measures of
project success and effective use of technology. At present quantitative evaluation of
these benefits is not done and methodologies are being formulated for conducting
quantitative assessment.
For majority of the projects, communication management planning is done with respect
to report formats, periodicity of reports and meetings at the start of the project. At office,
majority of the documents are stored as hard copies and electronic copies, but at the
project sites, documents are primarily stored as hard copies. Organization has a disaster
recovery plan for breakdown of IT infrastructure in the form of electronic backup of data
and IT consultants who have AMC for their IT infrastructure.
7.5.5.3 Extent of ICT Adoption for Building Project Management
All the office and project site staff have access to computers. Data is not stored in a
centralized database, but is stored in different computers wherever it is generated. All
the project sites have Internet connection and all the staff including those of contractors
and other agencies interact through mobile phones. But, mobile Internet is not being
used. Electronic information from head office to sites and to other agencies is
communicated through e-mail or sometimes physically through data storage media like
floppies/CDs/USB drives. Also, majority of the e-mails are followed by hard copies sent

__________________________________________________________________________________
Page 250
Chapter 7: Benchmarking Framework Development and Case Study Analysis
for record purpose. From the project sites, information is primarily communicated as
hard copies. It is primarily due to two reasons: IT infrastructure at project sites is
inadequate and not upgraded or maintained regularly; Project site staff are not IT trained
as it is considered that project site staff should primarily have construction technology
expertise. All the meetings conducted during the course of the design and execution
stages of the projects are conducted as personal meetings. External information is
primarily referred through hard copies. Organization has LAN at office but does not
have an Intranet, and plans to install it within a year. Advanced ICT tools like project
web sites are not being utilized for building project management and videoconferencing
is also not used as a tool for conducting meetings. They don’t have a plan for adopting
these tools unless required by the clients and the market forces. Web cameras are used in
some outstation projects for posting site photographs to the clients and to the
organization head office.
The time and cost management documents are primarily communicated as e-mails
followed by hard copies or sometimes as hard copies. E-tendering has not been adopted
as bids are received as hard copies and negotiations are also done through personal
meetings. The design changes are primarily communicated as e-mails. Earlier drawings
were e-mailed in ‘dwg’ format, but in view of data security now these are mailed in
‘pdf’ format. Material management records are maintained in MS Excel documents, but
manpower resource management records are maintained in MS Word documents.
Legality of e-documents is an issue. But, there is a change in the scenario and responses
to RFIs are accepted as e-mails as well as messages through mobile phones.
7.5.5.4 Perceptions of the Senior Managers and Project Managers
The senior managers consider ICT as a secondary supporting tool for their work
functions. They are able to handle their day-to-day ICT requirements. They are not
aware of the features of advanced ICT tools like web based project management or
videoconferencing, but use the accompanied tools like web cameras on projects if
required by the client. The middle level staff uses ICT extensively and drives its use in

__________________________________________________________________________________
Page 251
Chapter 7: Benchmarking Framework Development and Case Study Analysis
the organization, as they are more aware of the working and implementation issues of
the advanced tools.
Site engineers do not have IT training and are also not aware of the benefits of use of
ICT. But, they can communicate through e-mails.
7.5.5.5 Factors Perceived as affecting ICT Adoption for Building Project
Management
The senior manager and the project manager considered following factors defining use
of ICT for building project management:
• At the organizational level, perspective of the senior managers towards
effectiveness of use of ICT is important, as they are required to drive use of ICT
in the organization.
• At the project level also there is a requirement to have a champion for use of
ICT. With respect to this organization, the champion has to be from the clients’
office, since they are primarily default project managers on their projects. Thus,
clients’ perception or clients’ past experience of use of ICT on the projects is
considered an important factor.
• The principal contractors’ perception or past experience of use of ICT on the
projects is also considered an important factor, unless use of ICT is defined by
the contract clauses.
• The cost of ICT infrastructure is not considered as a major factor, but the cost of
hiring IT trained staff or providing on-job training is considered a major factor
affecting use of ICT on projects.
• Day-to-day IT help/support both at office and at sites is considered an important
factor.

__________________________________________________________________________________
Page 252
Chapter 7: Benchmarking Framework Development and Case Study Analysis
7.5.5.6 Situation
The situation in the organization with respect to use of ICT for building project
management can be summarized as:
• Organization does not have a best practice strategy and extent of use of ICT on the
projects is primarily defined by the client’s requirements. But, it is efficiently
implementing the strategies formulated.
• Benefits of use of ICT are subjectively evaluated for increased organizational
efficiency, measures of project success and effective use of technology.
• Turnover of the staff is high and the organization finds it difficult to hire IT trained
staff leading to on the job training of the staff.
• Organization does not have a centralized database.
• All work in the organization is IT enabled and the prevalent international software
are utilized for individual functions.
• The organization is utilizing ICT for building project management. But, the rating as
per the developed benchmarking tool is at middle level.
• Adequate IT infrastructure is maintained at office and at project sites.
• As a part of the disaster recovery plan and day-to-day IT help/support, IT
infrastructure at office is maintained through AMC awarded to an external IT
consultant. But, sometimes it is a problem at project sites. Software are regularly
upgraded.
• Project communication management planning with respect to reports and meetings is
done at the start of the project.
• E-mail is used extensively for project management. But, advanced ICT tools like
project web sites, videoconferencing and mobile Internet are not used.
• The organization has not installed Intranet.
• Meetings are primarily conducted as personal meetings.
• E-tendering has not been adopted.
• External information is primarily referred through hard copies.

__________________________________________________________________________________
Page 253
Chapter 7: Benchmarking Framework Development and Case Study Analysis
• Majority of the e-mails of project management documents are followed by hard
copies. From the project sites, information is primarily communicated as hard
copies.
• Perceptions of the senior managers of the organization, clients and principal
architects are considered as important factors affecting use of ICT in the
organization and on projects.
• The cost of hiring IT trained staff or providing on-job training is considered an
important factor that affects use of ICT on projects.
7.5.5.7 Learning
The organization needs to have a higher level strategic use of ICT in the organization
and for the projects. The strategy should address the situation, the actors and the
processes. Senior managers of the organization view ICT as one of the secondary
supporting tools. But, in the present scenario, use of ICT is one of the major supporting
tools, which can enhance the services provided by the organizations and improve their
market position. The strategy should be formulated with this perspective.
Benchmarking administration identified gaps in practice for the organization. Table 7.9
identifies the reasons for the gaps in practice and Table 7.10 identifies the actions
required for overcoming these gaps.Turnover of the technical staff is very high in the
organization resulting in loss of trained staff. It does not have a strategy for use of ICT
and extent of use of ICT on the projects is defined by the clients’ requirements. Data
generated and analyzed for the processes can be communicated through use of ICT.
Thus ‘Actors’ are the dominant component in AO.
7.5.6 Action and Performance
Table 7.10 lists actions required to increase ICT adoption for Building Project
Management in the studied organizations and also lists the expected performance
changes.

__________________________________________________________________________________
Page 254
Chapter 7: Benchmarking Framework Development and Case Study Analysis
Table 7.9: Gaps in Practice and the Identified Reasons (AO) Gap in Practice Issue Reason
G1 Organization does not have a strategy for use of
ICT within the organization
Senior managers consider ICT as
a secondary supporting tool and
are not able to hire IT trained
staff.
G2 Organization has no plans for utilizing project
web sites for project management
The clients define extent of use
of ICT on its projects. Thus,
whenever required web based
project management would be
adopted, but would not be
initiated by the organization.
G3 Training of employees not conducted Due to high turnover of staff,
employees get on-job training.
G4 Project scope does not require use of ICT by
project team agencies
The organization manages
projects as default project
managers.
G5 Benefits with respect to effective team
management not assessed
It is perceived that these benefits
are being achieved. Thus formal
assessment is not conducted.
G8 Centralized database is not there in the
organization
Due to LAN facility and office
being small, it is not considered
important.
G9 Intranet facility is not installed in the
organization.
The organization size is not
considered viable for installing
Intranet.
G10 Majority of e-information communicated
between head office and other agencies is not
through internet only
Some of the agencies do not have
the IT infrastructure for
downloading large files. Thus,
these files are also communicated
through storage disks.
G11 Majority of general administration information
from head office primarily gets communicated
as hard copies and e-mails
This is also a trend in the
industry.
G12 Majority of information from site offices
primarily gets communicated as hard copies
Majority of the site engineers do
not have IT training as their
technical expertise is considered
important.
G13 Majority of project time and cost management
processes information from head office
primarily gets communicated as hard copies and
e-mails
This is also a trend in the
industry.
G15 Information regarding materials is primarily
referred through hard copies
This is a practice in the
organization and change has not
been considered as required.
G16 Manpower resource management records at sites
are primarily prepared in MS Word and not MS
Excel
Majority of the site engineers are
not conversant with working on
MS Excel.
G17 Project documents at sites are primarily stored
as hard copies
Site staff is more comfortable
storing and referring information
only in hard copy formats
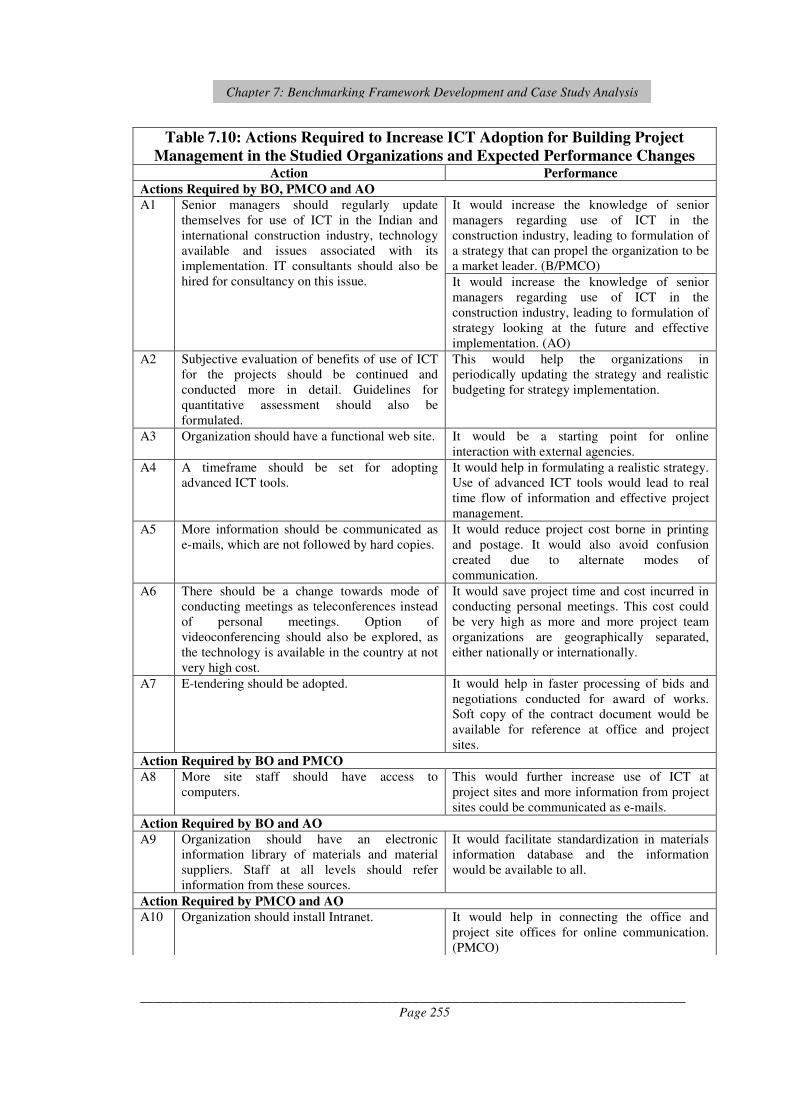
__________________________________________________________________________________
Page 255
Chapter 7: Benchmarking Framework Development and Case Study Analysis
Table 7.10: Actions Required to Increase ICT Adoption for Building Project
Management in the Studied Organizations and Expected Performance Changes Action Performance
Actions Required by BO, PMCO and AO
It would increase the knowledge of senior
managers regarding use of ICT in the
construction industry, leading to formulation of
a strategy that can propel the organization to be
a market leader. (B/PMCO)
A1 Senior managers should regularly update
themselves for use of ICT in the Indian and
international construction industry, technology
available and issues associated with its
implementation. IT consultants should also be
hired for consultancy on this issue. It would increase the knowledge of senior
managers regarding use of ICT in the
construction industry, leading to formulation of
strategy looking at the future and effective
implementation. (AO)
A2 Subjective evaluation of benefits of use of ICT
for the projects should be continued and
conducted more in detail. Guidelines for
quantitative assessment should also be
formulated.
This would help the organizations in
periodically updating the strategy and realistic
budgeting for strategy implementation.
A3 Organization should have a functional web site. It would be a starting point for online
interaction with external agencies.
A4 A timeframe should be set for adopting
advanced ICT tools.
It would help in formulating a realistic strategy.
Use of advanced ICT tools would lead to real
time flow of information and effective project
management.
A5 More information should be communicated as
e-mails, which are not followed by hard copies.
It would reduce project cost borne in printing
and postage. It would also avoid confusion
created due to alternate modes of
communication.
A6 There should be a change towards mode of
conducting meetings as teleconferences instead
of personal meetings. Option of
videoconferencing should also be explored, as
the technology is available in the country at not
very high cost.
It would save project time and cost incurred in
conducting personal meetings. This cost could
be very high as more and more project team
organizations are geographically separated,
either nationally or internationally.
A7 E-tendering should be adopted.
It would help in faster processing of bids and
negotiations conducted for award of works.
Soft copy of the contract document would be
available for reference at office and project
sites.
Action Required by BO and PMCO
A8 More site staff should have access to
computers.
This would further increase use of ICT at
project sites and more information from project
sites could be communicated as e-mails.
Action Required by BO and AO
A9 Organization should have an electronic
information library of materials and material
suppliers. Staff at all levels should refer
information from these sources.
It would facilitate standardization in materials
information database and the information
would be available to all.
Action Required by PMCO and AO
A10 Organization should install Intranet. It would help in connecting the office and
project site offices for online communication.
(PMCO)

__________________________________________________________________________________
Page 256
Chapter 7: Benchmarking Framework Development and Case Study Analysis
Table 7.10 Continued
It would help in connecting the two branch
offices and project site offices for online
communication. (AO)
Actions Required by BO
A11 Subjective evaluation of benefits with respect to
effective use of technology and effective team
management should also be conducted. It
should not remain perception based.
This would help in improved strategy
formulation for use of ICT at organization as
well as at project level.
A12 Extent of use of ICT in the projects should be
formalized by making it a part of the project
scope.
This would help the new associating team
agencies to prepare their organizations for
required use of ICT and the old associating
agencies would not feel obliged to use ICT due
to long term working relationship.
Action Required by PMCO
A13 Subjective evaluation of benefits with respect to
effective use of technology should also be
conducted. It should not remain perception
based.
This would help in improved strategy
formulation for use of ICT at organization as
well as at project level.
Actions Required by AO
A14 Organization should have a strategy for use of
ICT and it should be aligned with business
objectives of the organization and should plan
for the future.
It would provide synergy between the growth
of the organization and increased use of ICT by
the organization. It would also lead to planned
budget allocation for future IT infrastructure
upgradation and cost of hiring IT trained staff.
A15 After formulating a strategy for the
organization, clients should be motivated and
convinced for planned and increased use of ICT
for the projects. It has to be supported by the
results of concerted evaluation of benefits of
use of ICT for the projects.
This would help the organization in including
use of ICT in the project scope and formulating
relevant clauses in the tender
documents/agreements of contractors,
consultants and other external agencies. Thus,
change in perceptions of senior managers
would lead to reduced effect of perceptions of
clients and principal contractors.
A16 Subjective evaluation of benefits with respect to
effective team management should also be
conducted. It should not remain perception
based.
This would help in improved strategy
formulation for use of ICT at project level, as
team management is an important component
of project management.
A17 Organization should have centralized database. It would help in having a systematic archive of
information, as due to high turnover of staff, the
knowledge about the location of information is
also lost.
This would reduce loss of knowledge from the
organization, as historical information
regarding implementation and effectiveness of
ICT tools on previous projects is important.
A18 Organization should devise ways of retaining
the technical staff.
It would also reduce the indirect cost of training
the staff being borne by the organization, as the
staff is getting trained on the job.
A19 Project documents at sites should also be stored
as electronic copies.
This would further increase use of ICT at sites
for referring historical information and
communicating it.
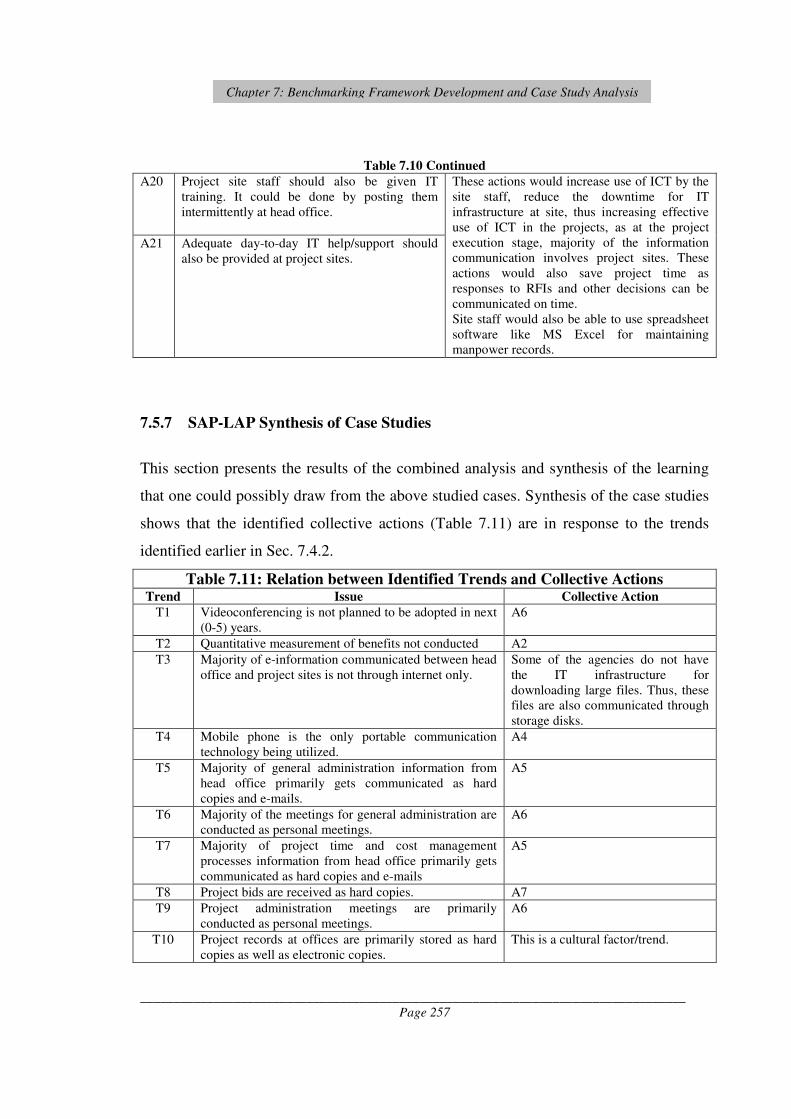
__________________________________________________________________________________
Page 257
Chapter 7: Benchmarking Framework Development and Case Study Analysis
Table 7.10 Continued
A20 Project site staff should also be given IT
training. It could be done by posting them
intermittently at head office.
A21 Adequate day-to-day IT help/support should
also be provided at project sites.
These actions would increase use of ICT by the
site staff, reduce the downtime for IT
infrastructure at site, thus increasing effective
use of ICT in the projects, as at the project
execution stage, majority of the information
communication involves project sites. These
actions would also save project time as
responses to RFIs and other decisions can be
communicated on time.
Site staff would also be able to use spreadsheet
software like MS Excel for maintaining
manpower records.
7.5.7 SAP-LAP Synthesis of Case Studies
This section presents the results of the combined analysis and synthesis of the learning
that one could possibly draw from the above studied cases. Synthesis of the case studies
shows that the identified collective actions (Table 7.11) are in response to the trends
identified earlier in Sec. 7.4.2.
Table 7.11: Relation between Identified Trends and Collective Actions Trend Issue Collective Action
T1 Videoconferencing is not planned to be adopted in next
(0-5) years.
A6
T2 Quantitative measurement of benefits not conducted A2
T3 Majority of e-information communicated between head
office and project sites is not through internet only.
Some of the agencies do not have
the IT infrastructure for
downloading large files. Thus, these
files are also communicated through
storage disks.
T4 Mobile phone is the only portable communication
technology being utilized.
A4
T5 Majority of general administration information from
head office primarily gets communicated as hard
copies and e-mails.
A5
T6 Majority of the meetings for general administration are
conducted as personal meetings.
A6
T7 Majority of project time and cost management
processes information from head office primarily gets
communicated as hard copies and e-mails
A5
T8 Project bids are received as hard copies. A7
T9 Project administration meetings are primarily
conducted as personal meetings.
A6
T10 Project records at offices are primarily stored as hard
copies as well as electronic copies.
This is a cultural factor/trend.

__________________________________________________________________________________
Page 258
Chapter 7: Benchmarking Framework Development and Case Study Analysis
The study of the actions and expected performance changes highlights some important
issues.
• In all the three studied organizations, the senior managers as well as the project
managers shared the perception that use of ICT is beneficial and important for
successful projects and also conduct subjective assessment of benefits with
different perspectives. But their strategy or extent of use of ICT is dependent on
various factors including market demand, clients’ requirements, ICT capability
of the organization staff and ICT capability of the associating project team
agencies. Adequate technology is available and is not considered as an issue.
This highlights the importance of the industry level initiatives required to prepare
the industry for the increased and effective ICT adoption for building project
management.
• The senior management as well as the project managers, who are at the middle
level, are aware of the changes in the market with respect to the requirement of
using ICT, but the knowledge of features and possibilities of implementing use
of ICT differs. In BO and PMCO, project managers are supportive of the
strategy formulated by the seniors, but in PMCO they are also a part of the team
formulating the strategy. In AO, strategic use of ICT is less, but seniors initiate
the use of new ICT tools and middle level staff drives their implementation, due
to their technical knowledge about it. Also, in all the organizations, the
perception of seniors for benefits of use of ICT has been considered as an
important factor.
Thus, senior managers initiate use of ICT tools in their organization and their
knowledge upgradation is important. The middle level managers or the project
managers drive the implementation of the strategy at the project level and their
Thus use of ICT in Indian construction industry seems to be having demand pull
strategy. But, it needs to be pushed by the Industry readiness or ICT capability of
the construction professionals and organizations.

__________________________________________________________________________________
Page 259
Chapter 7: Benchmarking Framework Development and Case Study Analysis
training for the technical and implementation aspects is important. The
operational level staff would be using the technology on day-to-day basis. Thus,
their training for use of technology is important.
• BO is a bigger organization with respect to AO in terms of staff strength and
turnover of the organization, but both the organizations refer information
regarding materials through hard copies and do not have an electronic library of
the information on materials. This is due to their working methodology and
average ICT capability of all the staff in the organization.
• None of the three organizations has a functional web site, which is important for
online communication with external agencies. But, the senior managers of the
organization have not considered it as important till now as they did not perceive
market demand for it.
• Legality of e-documents is an issue. But, there is a change in the scenario as
responses to RFIs are accepted as e-mails or even as messages from the mobile
phones, even though for major works at sites hard copy approvals are required.
Also, organizations have started using data security technology like mailing
documents in ‘pdf’ format.
• Turnover of the staff is an issue. If organizations are able to retain the staff, their
training becomes viable.
• The study shows that supply chain issues of having close and long working
relationship with associating team agencies is an important issue as it helps in
developing a working methodology with these agencies.
• AO manages building projects by default. Thus, they are not able to include use
of ICT in the project scope.
This highlights the importance of training with a top down approach.
Thus, to increase use of ICT for building project management, it is important to
increase formal project management of buildings.

__________________________________________________________________________________
Page 260
Chapter 7: Benchmarking Framework Development and Case Study Analysis
• E-tendering has not been adopted by all the studied organizations. This is a trend
identified in earlier sections also. Thus, it requires pro-active action at the
organization level.
• Mode of conducting meetings in all the three organizations is primarily personal
meetings. This trend has also been identified in earlier sections. It requires
change in the working methodology at industry and organization level.
• Day to day IT help and support, both at the offices and at project sites is
considered important by all the organizations.
• Processes are not the driving component as adequate technology is available for
communicating information of the processes through ICT. For the organizations
with high strategic use of ICT, ‘Situation’ is the driving component as the
strategy has to be aligned with the situation. But, in AO that does not have a high
strategic use of ICT, ‘Actors’ are the dominant component.
7.6 Synthesis of the Case Study Analysis Results and Framework for
BenchAction and BenchMonitoring
Benchmarking of the three organizations calculated their ratings and identified ‘Trends
and Gaps in practice’ for the three organizations. BenchMeasurement conducted through
DEA analysis identified performance efficiency of the three organizations in
implementing their strategies of use of ICT. To compliment performance measurement
with performance management, reasons for the identified trends and gaps in practice
were ascertained in BenchLearning stage. It included indepth study of the three
organizations and was conducted through SAP-LAP analysis technique. Study of the
situation, actors and processes in each organization helped in learning the organizational,
cultural, social and human factors affecting use of ICT in each organization. Thus,
Industry readiness or the ICT capability of construction professionals has to be
enhanced so that ‘Situation’ remains the dominant component not constrained by
the ‘Actors’.

__________________________________________________________________________________
Page 261
Chapter 7: Benchmarking Framework Development and Case Study Analysis
actions were suggested to overcome the trends, gaps in practice and other identified
issues and formed a component of the ‘Bench Action’ stage.
Table 7.12 studies relation between identified trends, gaps in practice and suggested
actions. As identified in Chapter 5, most of the trends require action at industry and
organization levels. But, as shown in the table, organization level actions are not
suggested for trends T3 and T10 as these issues require industry level initiative. Gap G3
was identified for AO as formal training of staff is not conducted in the organization.
But, the staff gets on-job training and since turnover of the staff is high, formal training
is not considered viable. Gaps G10 and G14 also require industry level initiatives.
Actions A1, A3, A18 and A19 are in response to the other issues identified in SAP-LAP
analysis.
The suggested actions form a component of the ‘BenchAction’ stage and it is assumed
that the implementation of the following actions at the industry and organization levels
would increase effective ICT adoption for building project management in the industry.
Also, the benchmarking rating of the organizations would improve.
Communication at industry and organization levels is important for successful
implementation of the process and forms an integral component of ‘BenchAction’.
• At industry level, national bodies should create awareness about the process
through forums like seminars and conferences and communicate its importance
to the organizations. As discussed in the introduction of the benchmarking
process discussed in Chapter 3 (Sec. 3.5.3.2), benchmarking clubs should be
initiated for interaction between the different organizations. A formal rating
system like ISO certification should be initiated in the industry to increase
participation by the organizations.
• At the organization level, communication of the benchmarking process results
and suggested actions to operational as well as middle level managers is very
important for successful implementation of suggested actions in the organization.

__________________________________________________________________________________
Page 262
Chapter 7: Benchmarking Framework Development and Case Study Analysis
Table 7.12: Relation between Identified Trends, Gaps in Practice and Suggested
Actions Actions in Response to Identified Trends and Gaps in Practice Trends Gaps in
Practice BO PMCO AO
T1 A6
T2 A2
T3 This is an issue of disparity between organizations in ICT capability and can be
dealt at industry level by uniformly increasing IT capability within the industry.
T4 A4
T5 A5
T6 A6
T7 A5
T8 A7
T9 A6
T10
This is a cultural factor/trend. Construction professionals are more comfortable
referring information in hard copy formats.
G1 A14
G2 A4
G3 Due to high turnover of
staff, employees get on-
job training.
G4 A12 A15
G5 A11 A16
G6 A11 A13
G7 A8 A8
G8 A17
G9 A10 A10
G10 This is an issue of disparity between organizations in
IT capability and can be dealt at industry level by
uniformly increasing ICT capability within the
industry
G11 A5 A5
G12 A8 A20, A21
G13 A5 A5
G14 An action cannot be
formulated for this gap
as it would be difficult
for a PMCO to define
this requirement for
clients
G15 A9 A9
G16 A20
G17 A20, A21
Actions in Response to Other Issues Identified Through Case Study Analysis
A1
A3
A18
A19

__________________________________________________________________________________
Page 263
Chapter 7: Benchmarking Framework Development and Case Study Analysis
In practical terms, any performance measurement should be iterative, so that the
strategic relevance of performance measurement is consistently maintained (Costa et al.
2006). Accordingly ‘BenchMonitoring’ stage includes periodic Benchmarking and
BenchMeasurement exercise conducted in the organizations followed by BenchLearning
and BenchAction. After each Benchmarking and BenchMeasurement, it should be
identified whether existing framework is applicable or not. If it is applicable, directly
BenchLearning can be conducted. If it is not applicable, remapping of the project
management processes and adopted communication technologies should lead to
recalibration of the Benchmarking framework (Fig. 7.18).
Benchmarking and
BenchMeasurement
• Rating of Organizations
• Performance measurement
• Identification of trends and gaps
in practice
BenchLearning
(SAP-LAP Analysis)
• Study of cultural, social and
human factors affecting use of
ICT
• Identifying reasons for trends
and gaps in practice
• Suggesting actions in response to
identified factors and reasons
BenchAction
• Implementation of suggested
actions at organization level
• Implementation of suggested
actions at Industry level
Mapping of the building project
management processes adopted in the
industry and communication technology
used for the processes
Benchmarking
Framework
applicable
If Yes
If No
Recalibration of
Benchmarking
Framework
Bench
Monitoring
Fig. 7.18: Suggested Benchmarking Process
__________________________________________________________________________________
Page 264
Chapter 7: Benchmarking Framework Development and Case Study Analysis
7.7 Discussion
The suggested Benchmarking Process provides a framework for objective competitive
analysis of the organizations in the Indian construction industry with respect to ICT
adoption for building project management. It can be utilized at the industry level to map
the stratification of construction industry for ICT adoption for building project
management and also at the organization level by construction organizations for self-
analysis and identification of improvement opportunities. The measurement system is a
generic system providing a common basis for comparing use of ICT between different
organizations. The development of the benchmarking framework and benchmarking
process was done after detailed literature review. The critical success factors or the
performance indicators and the associated measurement metrics are established based on
the questionnaire survey data analysis and the semi-structured interviews conducted in
the three benchmarked organizations. Each MI in the benchmarking framework is
completely defined. Thus the complete framework is a whole comprising completely
defined parts and organizations’ use of ICT can also be measured for each of the three
components individually. The performance measurement system of ‘Benchmarking and
BenchMeasurement’ is complimented with performance management system by
including phases of ‘BenchLearning’ and ‘BenchAction’. It is conduced by SAP-LAP
analysis technique, a systematic approach of enquiry. BenchMonitoring signifies process
of continuous learning, adaptation and improvement in the organizations and in the
industry. Performance indicators identify actions for the structural changes required in
the organizations for embracing continuous improvement.
Following features would facilitate successful implementation of the framework:
• MIs measure technical or general management processes and do not require
information about the commercially sensitive information.
• Implementation of this framework by the National level bodies in the Indian
construction industry suggests benchmarking process implementation in a
collaborative atmosphere.

__________________________________________________________________________________
Page 265
Chapter 7: Benchmarking Framework Development and Case Study Analysis
• The framework includes leading as well as lagging indicators, thus its focus is on
initiating a learning atmosphere and helping organizations and the industry to
identify the strengths as well as the weaknesses.
Some important analysis results are shown below:
• Use of ICT in Indian construction industry seems to be having demand pull
strategy. But, it needs to be pushed by Industry readiness or ICT capability of
construction professionals.
• Along with having a higher Benchmarking rating, organizations should be
efficient in implementing their strategies for use of ICT.
• Industry readiness or the ICT capability of construction professionals has to be
enhanced so that the ‘Situation’ remains the dominant component not
constrained by the ‘Actors’.
• Supply chain issue of a close working relationship and a working methodology
developed between project team agencies as well as reducing the turnover of
staff in the organizations are important factors. The latter factor enhances
training of the staff by the organizations.
• Training of the staff with a top down approach is an important factor.
• To increase use of ICT for building project management, it is important to
increase formal project management of buildings.
• With respect to ‘Strategically planning project communication management’
PMCO reflects best practice for the industry.
• Benefits of use of ICT in terms of ‘project success’ and ‘increased organizational
efficiency’ are considered as important areas by all the three organizations and
subjective evaluation of these benefits is conducted.
The proposed framework is applicable for the Indian construction industry in the current
environment. Periodic review of the framework is suggested. It is required to make
suitable changes as well as to introduce the new relevant MIs and omit the MIs that are
not relevant leading to recalibration of the framework. Comparative analysis of the MIs
in the three organizations leads to the generalization of the utility of the framework and
__________________________________________________________________________________
Page 266
Chapter 7: Benchmarking Framework Development and Case Study Analysis
supplementing it with case study analysis helps in formulation of strategies for effective
ICT adoption for building project management in the Indian construction industry.
7.8 Suggested Benchmarking Framework with Reference to the Existing
Benchmarking Studies
The concept of benchmarking has received application in the construction industry as a
technique for identifying ways to improve organizational and project performance (Love
and Smith 2003). As reported by Costa et al. (2006), in recent years, benchmarking
programs for construction industries have been established in countries such as
Australia, Brazil (Costa et al. 2004), Chile (CDT report 2002), Denmark (Byggeriets
Evaluerings Center 2002), the United Kingdom (Constructing Excellence 2004), the
United States (CII report 2000), Hong Kong, Singapore, and the Netherlands (Bakens et
al. 2005). Benchmarking areas primarily include project cost, occupational health and
safety, labor productivity and customer service/satisfaction (Morehead et al. 1997 cited
in Love and Smith 2003). As reported in Chapter 2 (Sec. 2.7.2) some benchmarking
studies with respect to the use of IT/ICT in the construction industry have also been
conducted.
The unique features of the suggested benchmarking framework are:
• The suggested benchmarking framework has been developed with special focus
on ICT adoption for building project management by SMEs.
• It spans information management components of all the levels in a building
project management organization. It also includes communication management
with external agencies.
• It integrates building project management with other administrative activities of
the construction organizations and considers causal relationships between all the
processes, established after empirical data analysis.

__________________________________________________________________________________
Page 267
Chapter 7: Benchmarking Framework Development and Case Study Analysis
• Benchmarking levels are with reference to the Indian construction industry as the
minimum and maximum limits of performance measures were established after
the questionnaire survey data analysis.
• The suggested Benchmarking implementation system combines quantitative and
qualitative study and it incorporates a relation between ‘Benchmarking rating’
and ‘BenchMeasurement efficiency ‘of the organizations.
7.9 Summary
This chapter discussed finalization of the Benchmarking framework for assessing the
extent of ICT adoption for building project management by construction organizations in
the Indian construction industry. The benchmarking process is an iterative process
divided into four stages of Benchmarking and BenchMeasurement, BenchLearning,
BenchAction and BenchMonitoring. BenchLearning includes an in-depth study of the
cultural, social and human factors conducted through case study analysis using SAP-
LAP analysis technique. The benchmarking framework is used to analyze three
organizations leading to the finalization of the framework. Implementation structure of
the benchmarking process is presented. Benchmarking framework development and
administration discussed in this chapter provides guidelines for formulation of results.
Chapter 8 integrates the findings of all the data analysis components and discusses the
results.


__________________________________________________________________________________
Page 269
Chapter 8: Interpretation of Data Analysis and Discussions
CHAPTER 8
INTERPRETATION OF DATA ANALYSIS AND
DISCUSSIONS
8.1 Introduction
The research reported in this thesis concerns the investigation of issues related to
effective ICT adoption for building project management by Small and Medium
Enterprises (SMEs) in the Indian construction industry. Research was carried out with
the objectives specified in Chapter 1 and as per the research plan specified in Chapter 3.
The research process included series of studies conducted for achieving the objectives.
This chapter synthesizes the results of these research studies leading to the formulation
of a generic framework of a ‘Model of IT enhanced communication protocols for
building project management’.
8.2 Synthesis of the Study
Synthesis of the study serves to cover the learning derived from all studies and proposes
‘IT Enhanced Communication Protocols for Building Project Management’ to
accomplish the research aim. The protocols are proposed as a ‘Strategic Model for
Enhancing ICT Diffusion in Building Projects’ that takes learning from all the sources as
inputs. A strategy which draws its strength from a synthesized reservoir of knowledge
and insight is not only the most appropriate strategy in the given situation, it can also
create the most outstanding effect (if implemented) in terms of performance. These
considerations led to the conceptualization of the proposed model. The focus is on
deriving the strategic model from inputs, which are the learnings gathered from the
following important sources – literature study, Interpretive Structural Modeling (ISM)
analysis, questionnaire survey data analysis including Structural Equation Modeling

__________________________________________________________________________________
Page 270
Chapter 8: Interpretation of Data Analysis and Discussions
(SEM) analysis, benchmarking framework analysis including Data Envelopment
Analysis (DEA) and case studies (SAP-LAP Analysis). These research studies are
neither standalone nor exclusive as there are informational linkages across the studies.
8.2.1 Status of ICT Adoption for Building Project Management
It was prepositioned and also observed statistically that in the construction industry
majority of the SMEs also manage the building projects independently (Ref. Chapter 2,
Sec. 2.5.3 and Chapter 5, Sec. 5.2). Thus, it is important to study ICT adoption by SMEs
as they determine the extent of ICT adoption for building project management in the
industry.
Data analysis shows that ICT adoption by SMEs in the Indian construction industry has
considerably increased in the last 5 years, but still the majority of SMEs do not have a
communication management strategy and their use of ICT for building project
management has not reached a high maturity level, since it is primarily project specific
and not organization specific. It also highlights that the extent of ICT adoption for a
project is primarily determined by the clients’ requirements and is also affected by the
variable ICT capabilities of the project team organizations. It was also observed
statistically that the increase in use of ICT by SMEs for managing building projects is
driven by the industry requirements i.e. the situation. For building project management,
collaborative use of ICT is not as prevalent as the internal use of ICT within
organizations. One of the reasons identified for this trend is the disparity between the
organizations in their ICT capabilities and can be dealt with strategically at the industry
level by uniformly increasing ICT capability within the industry.
Data analysis shows that for all the processes, mixed communication methodology is
adopted by the organizations (Ref.Chapter 5, Sec. 5.7). It is observed that for each PM
process, number of organizations using mixed communication methodology for
communication increases in the following sequence of categories of information: within
office, between office and site staff, between office and contractors/material suppliers

__________________________________________________________________________________
Page 271
Chapter 8: Interpretation of Data Analysis and Discussions
and other external agencies, between office and clients/consultants. The number of
organizations primarily communicating information through e-mail is in the reverse
order.
It is a cultural factor, but it is identified in the case study analysis (Table 7.8) that it is
also because clients and consultants do not have all the software used for PM processes
and their staff is also not trained to take printouts from these software files. Thus, they
are sent e-mails as well as hard copies depending on the software utilized for project
management and the report to be communicated.
Thus, industry level initiatives are required for knowledge upgradation of the
construction clients for use of ICT for project management and for developing
uniform ICT capability of the construction organizations.
IT infrastructure at site has been perceived as an important enabler for effective adoption
of ICT for project management. Data analysis showed (Fig. 5.7) that even though in
majority of the surveyed organizations, more than 80% of the office staff has access to
computers, in only about 20% organizations more than 80% site staff has access to
computers. Also, it has been identified by the respondents of the survey that connectivity
through Internet is poor in the remote project sites and downtimes are very high.
Industry level initiatives are required for providing consultancy to the
organizations for adopting appropriate technological solutions for the remote
project sites. Organization level initiatives are required to strategically provide
adequate IT infrastructure at site.
High turnover of staff especially in the smaller organizations is an important barrier
affecting adoption of ICT (Ref. Chapter 5, Sec. 5.6.1). Case study analysis identified that
this is an important issue for AO. PMCO and BO have dealt this issue through proactive
HR policies. Case study analysis showed that the studied BO functions on maintaining a
working relationship with their associating agencies. Most of the contractors and other

__________________________________________________________________________________
Page 272
Chapter 8: Interpretation of Data Analysis and Discussions
associating agencies have been working with it for a long time and a working
methodology has developed between these agencies and the organization under study.
Thus, even though the use of ICT for its projects is not defined through the relevant
contract clauses, the contractors and other external agencies primarily use ICT on most
of the projects as per the strategy of the organization. Thus, organization level
initiatives are required to adopt proactive HR policies in order to retain their old
staff and resolve other supply chain measures.
E-tendering is not a norm in this industry. It is due to a combination of factors like:
perception of data security, variable ICT capabilities of associating project team
organizations and cultural factor of conducting personal meetings. This requires
organization level initiatives to adopt e-tendering and industry level initiatives to
provide education and training to the construction organizations to strategically
adopt e-tendering.
Questionnaire survey data analysis showed that ICT adoption for building project
management is maximum by PMCOs and minimum by the Architectural organizations.
Identified reasons for this issue are the extent of formal project management processes
conducted by the organizations and their use of advanced IT tools for building project
management processes. Study showed that the Builders use more advanced IT tools as
compared to Architectural organizations but they have maximum standard deviation for
this factor (Ref. Chapter 6, Sec. 6.7.2). Thus, strategic initiative at the industry level
is required for organizing training programs for SMEs for familiarizing their staff
with formal project management processes and for use of advanced IT tools for
building project management processes.
8.2.2 Perceived Barriers, Benefits and Enablers for Effective ICT Adoption
The factors affecting ICT adoption are studied at three levels: Industry, Organization,
and People who manage the projects and define the use of ICT in the organizations. For
the study of perception based factors, people level factors get translated to projects and

__________________________________________________________________________________
Page 273
Chapter 8: Interpretation of Data Analysis and Discussions
technology level factors. Study of the perceived barriers shows that the industry related
barriers are among the top 50% barriers, organization related barriers are in the middle
and lower levels, technology related barriers are among the last 40% barriers and the
identified project related barrier is in the middle. Organizations perceive that the
available technology in terms of ICT infrastructure is primarily adequate. Highest
ranked barriers are the industry related barriers related to the supply chain issues,
separation of project stages, fragmented construction industry with organizations having
different ICT capabilities and lack of strategic direction within the industry. These
barriers lead to the next important barriers of non-availability of critical mass of projects
requiring use of ICT and non-standardization within the industry. Mitigation of these
barriers requires strategic initiatives at the industry level. Next are the organization
related barriers related to the high cost, which also require initiatives at the industry level
for providing incentives to SMEs by subsidizing the cost of ICT tools. Unwillingness of
senior executives to adopt ICT is also an important barrier.
Study of the perceived enablers for mitigation of the barriers shows that the industry and
organization related enablers are primarily in the top and middle levels, technology
related enablers are in the middle and bottom levels and projects related enablers are
distributed at all the levels with the most important enablers being improved IT support
to sites and planning of information flow in the standardized formats. This analysis
shows that to reduce the effect of people level factors, strategic initiatives are
required at the industry and organization levels: to educate and train people or
construction professionals for effective ICT adoption and its benefits, to study
factors affecting supply chain issues, to provide required technology in terms of
ICT infrastructure, to customize the infrastructure for use of common or shared
systems, and to champion the cause of the use of ICT at the industry, organization
and project levels.
SMEs perceive that the use of ICT leads to significant benefits in terms of measures of
project success, team management issues, effective use of technology and increased

__________________________________________________________________________________
Page 274
Chapter 8: Interpretation of Data Analysis and Discussions
organizational efficiency. Interpretive Structural Modeling (ISM) analysis provided a
structure to the complex issue of importance of perceived benefits of ICT. In the
developed ISM model, project related benefits are primarily at the top of hierarchy, team
management related benefits are primarily in the middle and technology and
organization related benefits are primarily at the bottom of the hierarchy. It shows that
the organization and technology related benefits have high driving power and these are
‘strategic benefits’ for the project team organizations. Thus organizations are required to
give more attention to strategically increasing these benefits from the use of ICT, and if
use of ICT for general administration in the organization is matured, appropriate IT tools
are included in the working framework and team management issues are planned at the
earlier stages of the project, then project related benefits will be achieved by default.
This indicates that the four groups of benefits are inter-related and cannot be achieved in
isolation. It was also observed statistically in the questionnaire data analysis that the four
groups of perceived benefits are interrelated (Ref. Chapter 5, Sec. 5.4.3.4). This analysis
provides a road map for the managers or project management organizations to decide
that if they are strategically planning use of ICT for achieving certain benefits then what
are the other driving benefits that should be achieved prior to that and also what are the
dependent benefits that will be achieved by default. The road map provided by this
analysis could form an important component of the benefits management plan for SMEs.
Case study analysis indicates that quantitative assessment of these benefits is not
conducted and subjective analysis is also conducted by each organization for only
specific groups of benefits and not for all the benefits.
The cumulative responses of the surveyed organizations showed that 35.57% surveyed
organizations perceived medium level barriers and benefits, 2.01% organizations
perceived high level barriers and medium level benefits, 47.65% organizations perceived
high level benefits and medium level barriers and 14.76% organizations perceived high
level benefits and barriers. Low level benefits and barriers were not perceived by any
organization. Scenario building for the adoption of ICT by the organizations with respect
to the perceived benefits and barriers indicates that an organization’s use of ICT would

__________________________________________________________________________________
Page 275
Chapter 8: Interpretation of Data Analysis and Discussions
be of high level, only if it perceives low level barriers and high level benefits. This is
validated in the study of the benchmarking framework analysis. The cumulative scores
for the identified perceived benefits and barriers for the three studied organizations are
as given below (Table 8.1). Levels for the cumulative scores of the perceived benefits
and barriers are explained in Chapter 5 (Sec. 5.6.4) and levels for Benchmarking Rating
are explained in Appendix D.
Table 8.1: Relation between the Suggested Scenario Building framework and the
Benchmarking Framework Cumulative Scores and Level Organization
Benefits Barriers
Extent of use of ICT
as per Suggested
Scenario Building
Framework
Extent of use of
ICT as per
Benchmarking
Rating
BO 146 High 62 Medium Medium Level Middle Level
PMCO 147 High 61 Medium Medium Level Middle Level
AO 140 High 62 Medium Medium Level Middle Level
Thus, it is validated that an organization that perceives high level benefits and medium
level barriers for effective use of ICT for building project management would have
medium level of use of ICT. Further case study analysis highlights that these
organizations are planning and taking proactive measures for further increased use of
ICT.
Thus, industry level initiative is required to modify the perceptions of the
construction professionals through education, training and show-case projects.
Organization level initiative is also required to provide proactive atmosphere in the
organization to modify the perceptions of people.
8.2.3 Causal Relationships between Factors
Questionnaire data analysis shows that organizations with higher turnover have higher
ICT adoption. Thus, the larger organizations in terms of turnover should define the use
of ICT as the scope of work for associating project team organizations and in the process
increase ICT capability of the smaller organizations.

__________________________________________________________________________________
Page 276
Chapter 8: Interpretation of Data Analysis and Discussions
Structural Equation Modeling (SEM) analysis proved that there is a causal relationship
between the factors affecting ICT adoption for building project management. Analysis
of these causal relationships validates ISM analysis results and helps in the
understanding that an increased and matured use of ICT for general administration
within the organization would lead to an improved ICT infrastructure within the
organization, development of electronic databases and the staff that is confident of using
IT tools. In such a scenario, staff would use advanced software and IT technologies for
the project management processes and that would lead to increased adoption of ICT for
project management processes. This factor was also highlighted in the case study
analysis. In the studied BO, ERP implementation was initiated in year 2000, but it was
not successful. In the process of ERP implementation, IT infrastructure within the
organization was enhanced and it is a view within the organization that even though
ERP implementation was not successful, staff got the chance to work more on
computers, thus increasing their IT capability, which helped in their increased adoption
of ICT for project management. But, for general administration also, ICT usage would
be enhanced if the organization is interacting more with geographically separated
agencies and senior management perceives that significant benefits would be accrued by
adopting ICT. All the factors are inter-related and their effect cannot be maximized in
isolation.
8.2.4 Cultural Factors
The following Cultural factors are identified that are required to be considered while
formulating the model.
C1: Communication in which e-mail is followed by phone call is significant.
C2: Hard copy storage of data and documents is substantial even if electronic copies are
also kept as a backup.
C3: Most of the e-mails are followed by hard copies.
C4: Personal or face to face meetings are still preferred over teleconferences and other e-
meeting solutions for managing building construction projects.

__________________________________________________________________________________
Page 277
Chapter 8: Interpretation of Data Analysis and Discussions
Gudykunst (1991, p.51) suggests that the members of low-context and individualistic
cultures tend to communicate in a direct fashion while members of high-context
collectivistic cultures tend to communicate in an indirect fashion (Tone 2005). Indian
society falls under the second category where communication of tacit knowledge forms
a very important component of communication. This factor contributes to the preference
of personal or face to face meetings over teleconferences and other e-meeting solutions
and e-mails followed by phone calls. It is also perceived that contacting people
personally after sending e-mail leads to faster decision making.
Most of the e-mails are followed by hard copies, as official records are primarily stored
as hard copies even if the electronic copies are kept as back-up and for important
decisions, signed hard copy documents are required. Also, the majority of the
construction professionals specially senior executives and the site staff are more
comfortable in referring archival information in hard copy documents.
These are people and organization level cultural factors, which also reflect the national
industry level cultural factors since these are identified as trends in the industry. These
are a combination of the national culture as well as the professional culture i.e. the
culture of the construction industry in India where majority of the organizations are
SMEs. National cultures refer to profound beliefs, values and practices that are shared
by the vast majority of people belonging to a certain nation. Professional beliefs,
meanings and symbols constitute a stand-alone system in a national culture making it a
possibility that not all the members of a national culture will understand and interact in a
professional culture without proper training or practice (Tone 2005).
An organization can lose competitive advantage, if outdated cultural attitudes are
retained. While this can happen in a single organization, it can also be true of a whole
industry, where outdated cultural attitudes are retained. This may occur where personnel
transfer from organization to organization within an industry, with few people
transferring in from other sectors (Sturges and Bates 2001).

__________________________________________________________________________________
Page 278
Chapter 8: Interpretation of Data Analysis and Discussions
Thus, strategic initiative at the industry level is required to minimize the effect of
these factors by educating and training people. It would help in modifying work
processes and increasing inter-sectoral interaction of professionals with other
sectors or industries having similar work practices.
8.2.5 Benchmarking Framework Analysis
Peter Drucker wrote ‘‘What gets measured gets managed.’’ (Duff 2000 cited in Fang et
al. 2004) and to increase ICT adoption for building project management, we need a
system to periodically measure the extent of ICT adoption for building project
management within each organization and collectively within the industry. In response
to this identified requirement, a benchmarking framework has been formulated. The
suggested framework offers organizations in one of the India’s largest and most vital
industries a system for benchmarking that is customized for the industry. The suggested
benchmarking process comprises the four iterative stages of Benchmarking and
BenchMeasurement, BenchLearning, BenchAction, and BenchMonitoring.
Salient features of the suggested Benchmarking framework are shown in Fig. 8.1.

__________________________________________________________________________________
Page 279
Chapter 8: Interpretation of Data Analysis and Discussions
BenchMeasurement measures efficiency of benchmarked organizations in implementing
their strategies for ICT adoption for building project management. The analysis is
conducted through Data Envelopment Analysis technique (DEA).
Benchmarking Framework Structure
Benchmarking Framework Attributes
Benchmarking Framework Administration
Strategic Indicators: MI1+MI2+MI3
Use of ICT for General Administration-Works Indicators: MI4+MI5
Use of ICT for Building Project Management-Processes Indicators: MI6+MI7+MI8
Rating Value = 3(MI1+MI2+MI3) + 2(MI4+MI5) + MI6+MI7+MI8
Rating Levels: Low. Medium, High
• It is a generic framework, includes leading as well as lagging indicators.
• Measurement indicators (MIs) measure ICT adoption at all the management levels
of a construction organization.
• Each MI is completely defined and the complete framework is a whole comprising
completely defined parts. Thus ICT adoption for each of the three groups of MIs
can also be measured separately.
• Such a framework is specially suitable for SMEs as they are expected to focus
more on short-term rather than long-term benefits.
• The framework should be administered at the industry level through a joint effort
of national level bodies, construction clients, individual building construction
organizations and research institutions.
• The suggested framework can be implemented at the industry level to map the
stratification of construction industry for ICT adoption for building project
management and also at the organization level for self-analysis and identification
of the improvement opportunities.
Fig. 8.1: Salient features of the Suggested Benchmarking Framework
__________________________________________________________________________________
Page 280
Chapter 8: Interpretation of Data Analysis and Discussions
The suggested framework compliments performance measurement system with the
performance management system by including phases of ‘BenchLearning’ and
‘BenchAction’. Supporting qualitative study in the BenchLearning stage conducted
through SAP-LAP analysis of benchmarked organizations identifies sources of
performance problems or gaps in practice with respect to the best practice and
establishes critical links to the research based tools essential for addressing these
problems.
Following features will facilitate successful implementation of the framework:
• MIs measure technical or general management processes and do not require
information about commercially sensitive issues.
• Benchmarking process implementation is suggested by national level bodies in
the Indian construction industry in a collaborative atmosphere.
• The framework includes leading as well as lagging indicators, thus its focus is on
initiating a learning atmosphere and helping organizations and the industry to
identify the strengths as well as weaknesses.
Study of the Indian construction industry shows that till now no major study has been
conducted to measure ICT adoption in the Indian construction industry. It reflects that
there is no external demand in the industry at the moment or there is no perceived
requirement of such a system. However, data analysis shows that increased collaboration
between research and practice is a perceived middle level enabler (Ref. Chapter 5, Sec.
5.6.2), which requires action at the Industry level. Thus, strategic initiative at the
industry level is required to educate the people and the organizations about the
requirement of such a measurement or benchmarking system and for periodically
conducting studies and surveys to realistically recalibrate the framework.
The benchmarking framework was administered by benchmarking one organization each
from the three groups of organizations studied i.e Builders (BO), Project management
consultancy organizations (PMCO) and Architectural organizations (AO). Gaps in
practice for each organization were identified and trends i.e. gaps common for all the

__________________________________________________________________________________
Page 281
Chapter 8: Interpretation of Data Analysis and Discussions
three organizations were also identified. Benchmarking framework analysis identified
that the values of strategic planning indicators (MI1, MI2, MI3) are higher for PMCO
and BO but low for AO and PMCO reflects the best practice for ‘Strategic project
communication’ (MI2). But, indicators MI4 to MI8 reflecting ICT infrastructure
maturity of the organizations and use of ICT for general administration and for project
management processes have medium level values for the three organizations, highest for
PMCO and lowest for AO. DEA shows that even though AO has the lowest
benchmarking rating in the three organizations, it is 100% efficient in implementing its
strategies for ICT adoption. PMCO has also been rated as 100% efficient as its values
for indicators MI4-MI8 are comparable with its values for strategic indicators (MI1-
MI3). But, BO’s efficiency value for implementing its strategies is 89.6%, even though
its benchmarking rating is higher than that of AO. Analysis also identified 17 gaps in
practice amongst the three studied organizations and 10 trends that were common to all
the three organizations. Out of these, 9 trends were also identified statistically in the
questionnaire data analysis and categorized as issues that require action. Thus, these are
the trends of SMEs in the Indian construction industry.
SAP-LAP analysis studied reasons for the identified gaps and trends. It also identified
that in the study of situation-actor-processes, ‘Processes’ are not the driving component
in ICT adoption by the studied organizations, as adequate technology is available for
communicating information of the processes through ICT. For the organizations, which
have higher strategic use of ICT, ‘Situation’ is the driving component as the strategy has
to be aligned with the situation. But, in AO, which has low strategic use of ICT, ‘Actors’
are the dominant component. Thus Industry readiness or the ICT capability of the
construction professionals has to be enhanced so that the ‘Situation’ remains the
dominant component not constrained by the ‘Actors’.
The identified trends reflect that advanced tools of ICT like intranet, interactive
organization websites, videoconferencing, and web-based project management are not
being used. Case study analysis shows that the organization level strategies for BO and
PMCO include these tools perceiving the market demand, and AO is also using tools

__________________________________________________________________________________
Page 282
Chapter 8: Interpretation of Data Analysis and Discussions
like web cameras at site as per the clients’ requirements. But none of the three
organizations plans to be market leaders for higher technology adoption. The identified
reasons are lack of awareness of these tools and lack of perceived industry demand.
The following reasons are identified for the above discussed trends or issues:
• Cultural factors with respect to the industry
• Variable ICT capabilities of organizations in the industry
• Unrealistic strategy formulation
• Unsuccessful implementation of the strategy
As discussed above, to mitigate the effect of the first two reasons strategic action is
required at the industry level and for the last two reasons strategic action is
required at the organization level.
As discussed in Chapter 3 (Sec. 3.6.1), with respect to Roger’s ‘Diffusion of Innovations
Theory’, construction organizations can be categorized under the following five groups
for their use or adoption of ICT for building project management:
• Innovators
• Early adopters
• Early majority
• Late majority
• Laggards/Traditional/Technically averse
Rating of the organizations by suggested benchmarking framework leads to the
categorization of organizations under these five groups. It is also shown schematically in
Fig. 8.2.
• Innovators are the organizations, which have high level strategy for ICT
adoption and are able to implement the strategy due to the readiness and high
ICT capability within the organization. These organizations would also be able to
include use of ICT as a scope of work for their projects.

__________________________________________________________________________________
Page 283
Chapter 8: Interpretation of Data Analysis and Discussions
• Early Adopters are the organizations, which have low or medium level of
strategy, but their use of ICT would be high. Thus, these organizations are partly
ready before adopting new ICT technologies and partly get changed in the
process of using the technology. It reflects that these organizations have high
ICT capability and readiness.
• Early Majority organizations have medium or high level strategy for ICT
adoption. They would have studied its use in the industry and on their earlier
projects and would want to increase ICT adoption for their projects. But, their
use of ICT is of medium level as the ICT capability and readiness within the
organization is not of high level and ICT capability of their associating team
members would also not be high.
• Late Majority organizations have medium to high level strategy for ICT
adoption, but low level use of ICT or they have low level strategy and medium
level use of ICT. This reflects that these organizations want to increase their ICT
adoption, but are not able to plan it and their strategy is not aligned with their use
of ICT. Such organizations would be incurring high cost in use of ICT as they
would not be able to use ICT effectively.
• Laggards or Technically Averse organizations have low strategy and low use
of ICT. These organizations would adopt any technology only when it becomes
urgent to adopt it. These organizations’ would have very low ICT capability and
readiness and would be hiring ICT trained staff only as per the requirement of
each specific project.
Diffusion of a technology in the society happens when it is adopted by the early majority
organizations. Moore (1991) discusses that most important time gap in technology
adoption is the time gap between technology adoption by early adopters and early
majority organizations as many a time adoption of a technology slows down after early
adopters stage. He has termed this time gap as ‘Chasm’ period.

__________________________________________________________________________________
Page 284
Chapter 8: Interpretation of Data Analysis and Discussions
Hig
h
Late Majority
BO, PMCO
Early Majority
Innovators
Med
ium
Late Majority
AO
Early Majority
Early Adopters
Str
ateg
y f
or
Use
of
ICT
(M
I1-M
I3)
Lo
w
Laggards/
Technically
Averse
Late Majority
Early Adopters
Low Medium High
ICT Infrastructure Maturity and Use of ICT (MI4-
MI8)
Fig. 8.2: Categorization of Building Project
Management Organizations for ICT adoption as
derived from the Benchmarking Framework
analysis
BO, PMCO and AO can be categorized as Early Majority organizations (Fig. 8.2). The
factors affecting ICT adoption in these organizations and the factors perceived by these
organizations as important are identified in the SAP-LAP analysis. These are the factors
affecting the ‘chasm’ period and are discussed in detail in Chapter 7.
Building construction is a multi enterprise work and to increase effective ICT adoption
for building project management in the industry, ICT capability and readiness of all the
organizations in the industry is required to be improved or an industry level shift is
required (Fig. 8.2). An industry level initiative is required to help the organizations
in their upgradation from Laggards to Late majority, Late majority to Early
majority, Early majority to Early adopters and Early adopters to Innovators.

__________________________________________________________________________________
Page 285
Chapter 8: Interpretation of Data Analysis and Discussions
8.3 Model of IT Enhanced Communication Protocols for Building Project
Management
Communication protocols define the accepted method of generating, coding, storing and
communicating information. In a building project, information is generated, stored and
communicated at all the stages of the project and by all the supply chain members or the
associating project team organizations. So, to have effective communication, all the
agencies are required to follow the accepted methods or the communication protocols.
At any time, each construction organization is involved in more than one project and is a
part of more than one supply chain. This unique nature of the construction industry
necessitates that the communication protocols are adopted by the industry as a whole
and do not remain project specific. As discussed in Chapter 1 (Sec. 1.1.3), with the
advent of ‘IT enhanced communication’ or ICT, communication protocols that support
the effective adoption of ICT by the whole industry are required. These protocols are
required to address technical, managerial, social and cultural issues and are to be
implemented at the levels of industry, organization and projects or people.
Strategic ICT adoption by majority of the organizations or SMEs for majority of the
building projects would lead to its diffusion in the industry. Thus, the communication
protocols should facilitate diffusion of ICT for building project management. Diffusion
of a technology occurs when the chasm period is crossed and it is adopted by the Early
majority organizations.
Research has been conducted with respect to Indian construction industry and the model
of diffusion of ICT for building project management in the Indian construction industry
is based on Everett Roger’s ‘Diffusions of innovations theory’. It is formulated with the
following concept derived after analysis and given in Chapter 7:

__________________________________________________________________________________
Page 286
Chapter 8: Interpretation of Data Analysis and Discussions
Use of ICT in the Indian construction industry seems to be having a demand pull
strategy. But, it needs to be pushed by the Industry readiness or ICT capability of
the construction professionals and organizations.
The model is formulated at the three levels of study i.e. industry, organization, and
people and is discussed as a generic framework of five stages of Roger’s ‘Diffusions of
innovations theory’ i.e. Knowledge, Persuasion, Decision, Implementation, and
Confirmation (Ref. Chapter 3, Sec. 3.6). As per Roger’s theory, it’s a sequential process
with each stage leading to the next. The suggested model is a modification of the theory
as data analysis and literature study have identified that it will be a cyclic process with
‘confirmation’ leading back to further ‘knowledge’ upgradation.
8.3.1 Industry Level Framework for Planning, Designing and Implementing
‘Strategic Model for Enhancing ICT Diffusion in Building Projects’
The data analysis and literature study have led to the formulation of an industry level
framework for planning, designing and implementing ‘Strategic Model for Enhancing
ICT Diffusion in Building Projects’. Fig. 8.3 summarizes the framework in five stages.
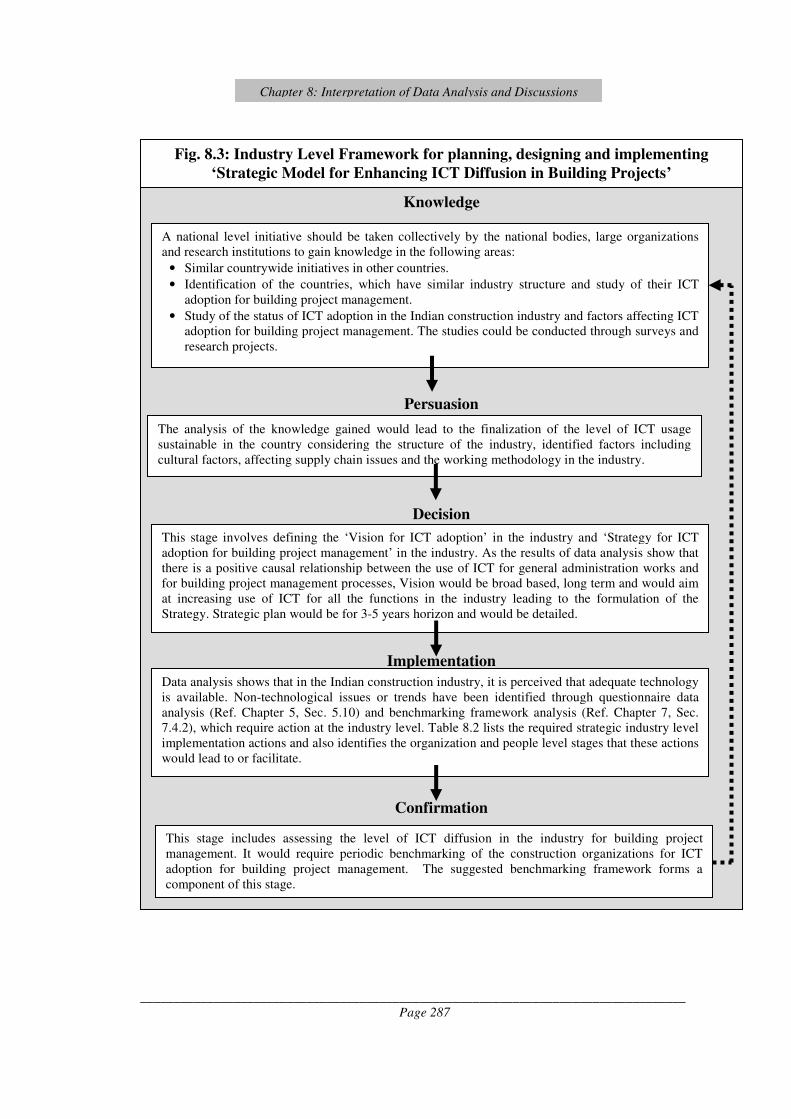
__________________________________________________________________________________
Page 287
Chapter 8: Interpretation of Data Analysis and Discussions
Fig. 8.3: Industry Level Framework for planning, designing and implementing
‘Strategic Model for Enhancing ICT Diffusion in Building Projects’
Knowledge
Persuasion
Decision
Implementation
Confirmation
A national level initiative should be taken collectively by the national bodies, large organizations
and research institutions to gain knowledge in the following areas:
• Similar countrywide initiatives in other countries.
• Identification of the countries, which have similar industry structure and study of their ICT
adoption for building project management.
• Study of the status of ICT adoption in the Indian construction industry and factors affecting ICT
adoption for building project management. The studies could be conducted through surveys and
research projects.
The analysis of the knowledge gained would lead to the finalization of the level of ICT usage
sustainable in the country considering the structure of the industry, identified factors including
cultural factors, affecting supply chain issues and the working methodology in the industry.
This stage involves defining the ‘Vision for ICT adoption’ in the industry and ‘Strategy for ICT
adoption for building project management’ in the industry. As the results of data analysis show that
there is a positive causal relationship between the use of ICT for general administration works and
for building project management processes, Vision would be broad based, long term and would aim
at increasing use of ICT for all the functions in the industry leading to the formulation of the
Strategy. Strategic plan would be for 3-5 years horizon and would be detailed.
Data analysis shows that in the Indian construction industry, it is perceived that adequate technology
is available. Non-technological issues or trends have been identified through questionnaire data
analysis (Ref. Chapter 5, Sec. 5.10) and benchmarking framework analysis (Ref. Chapter 7, Sec.
7.4.2), which require action at the industry level. Table 8.2 lists the required strategic industry level
implementation actions and also identifies the organization and people level stages that these actions
would lead to or facilitate.
This stage includes assessing the level of ICT diffusion in the industry for building project
management. It would require periodic benchmarking of the construction organizations for ICT
adoption for building project management. The suggested benchmarking framework forms a
component of this stage.

__________________________________________________________________________________
Page 288
Chapter 8: Interpretation of Data Analysis and Discussions
Table 8.2: Required Strategic Industry Level Implementation Actions No. Issue Action required Leading to
Issues that require action at Industry level
1.
Use of ICT is primarily defined by
clients’ requirements
Increase awareness of construction
clients for use of ICT through
media/conferences/seminars
3. Large organizations and professional
bodies are required to take a pro-
active approach and establish
benchmark practices for use of ICT
for building project management
• Establish benchmarks for use of ICT
for building project management in
the Indian construction industry
• Identify an industry in India with
similar work practices for parallel
industry benchmarking
• Establish a benchmarking framework
for rating organizations for use of
ICT for building project management
• Evolve a system and atmosphere of
conducting collaborative
benchmarking leading to more
organizations participating in the
process and improvement in use of
ICT at industry level by creating a
learning atmosphere
• Identify countries, which have
similar industry structure for global
benchmarking
4. Cost of IT infrastructure is perceived
high by SMEs
Cost of IT infrastructure should be
made affordable for SMEs through
incentives and other such initiatives
Persuasion
Organization
level
5. Connectivity through Internet is poor
in remote project sites and
downtimes are very high
Educate construction organizations
about the appropriate technology to be
used at project sites
Knowledge
Organization
level
6. Collaborative use of ICT is less as
compared to internal use of ICT
within the organizations
• Establish framework for increasing
ICT capability of organizations
across the industry through training
programs
• Identify supply chain issues affecting
collaborative use of ICT
• Educate construction organizations
for increasing collaborative use of
ICT for construction projects and
resolving the identified supply chain
issues
Knowledge
Organization
level
Persuasion
Organization
level
7. For high-level use of ICT,
organizations or the people should
perceive high benefits and low
barriers for effective use of ICT for
building project management
Modify perceptions of construction
professionals through:
• conferences/seminars
• training
• showcasing examples of projects
using ICT successfully
Knowledge
Organisation
level
People level
8. Training and education of
construction students and executives
is important
9. Use of higher technology is required
Include following subjects in the
curriculum of construction students and
organize accessible and affordable
training programs for executives for
Knowledge
Organization
Level
People level

__________________________________________________________________________________
Page 289
Chapter 8: Interpretation of Data Analysis and Discussions
10. Extent of use of ICT for building
project management differs for three
groups of sample organizations i.e
PMCOs, Builders and Architectural
organizations and decreases in this
order.
T2 Quantitative measurement of
benefits not conducted
following areas:
• formal project management
processes
• computerized project management
• use of ICT for building project
management
• knowledge about use of higher
technology ICT tools
• Evaluation of ICT systems through
subjective and quantitative
measurement of benefits
Issues that require action at Organization level
11. Organizations should have a
communication management
strategy for the organization and for
each project
12. IT infrastructure at project sites and
IT capability of site staff is an
important factor and needs
improvement in the Indian
construction industry
13. E-tendering is not a norm in the
industry
C2 Hard copy storage of data and
documents in organizations is
substantial even if electronic copies
are also kept as a backup
C3 Most of the e-mails communicated
from an organization are followed by
hard copies
• ‘Persuade’ or convince organizations
with benefits of ICT over traditional
methods of communication in
present scenario and perceived
increase in value of the organizations
after its adoption.
• Assist organizations in ‘decision
making’ for planning and
implementing strategic use of ICT in
the organization and for building
project management and planning
required changes in the organization
and work methodology
Persuasion
Decision
Organization
level
Cultural issues that require action at People level
C1 Communication in which e-mails
sent by a construction professionals
are followed by phone calls are
significant
C4 Personal meetings are still preferred
by construction professionals over
teleconferences and other e-meeting
solutions for managing building
construction projects
• ‘Persuade’ or convince people with
benefits of ICT over traditional
methods of communication in
present scenario
• Provide ‘knowledge’ to people for
effective use of ICT and change in
work methodologies required for
effective use of ICT
Persuasion
Knowledge
People level
The knowledge has to be gained by generating an interface between the industry and
academics and complimenting practical knowledge with the research tools and
inferences. This will augment the knowledge of all concerned. This will lead to
persuasion of the national level bodies in terms of finalization of the level of ICT usage
sustainable in the industry. Defining the Vision at the decision stage will create a
common objective and approach across the industry and will lead to defining the
strategy for implementation of the vision. Implementation of the framework requires

__________________________________________________________________________________
Page 290
Chapter 8: Interpretation of Data Analysis and Discussions
equal consideration of the associated technological and non-technological aspects. Also,
available technology should be suitable for the processes and its implementation should
consider the cultural factors. Thus, adoption of the new technology requires
consideration of the culture in the industry and modification or reengineering of the way
of working if required, so that the technology can be used effectively and the system
should be sustainable. Periodic benchmarking at the confirmation stage will:
• help in rating the organizations in three levels: high, medium and low.
• help in measuring efficiency of the organizations in implementing their strategies
for ICT adoption.
• identify the structure or stratification of the industry with respect to the above
rating and efficiency levels.
• help in categorizing the organizations under five categories of innovators, early
adopters, early majority, late majority and laggards. It will also identify the
structure or stratification of the industry with respect to the above five categories.
• identify gaps in practice and issues affecting the chasm period for adoption of
new ICT tools and technologies by early majority organizations.
• identify requirement of recalibration of the benchmarking framework, i.e.
requirement of fresh studies to upgrade the ‘knowledge’ of national bodies taking
industry level initiatives leading to recalibration of the framework.
Thus ‘confirmation’ stage leads back to the ‘knowledge’ stage, resulting in a cyclic
process.
8.3.2 Organization Level Framework for Planning, Designing and Implementing
‘Strategic Model for Enhancing ICT Diffusion in Building Projects’
The data analysis and literature study led to formulation of an organization level
framework for planning, designing and implementing ‘Strategic Model for Enhancing
ICT Diffusion in Building Projects’. Fig. 8.4 summarizes the model in five stages. For
the detailed discussion, the five stage model is further divided into 8 steps.

__________________________________________________________________________________
Page 291
Chapter 8: Interpretation of Data Analysis and Discussions
Step 8: Post Implementation System Monitoring
• System maintenance
• Periodic evaluation of the system for measures of
success, achieved benefits and associated barriers
Co
nfi
rma
tio
n
Fig. 8.4: Organization Level Framework for Planning, Designing and Implementing
Strategic Model for Enhancing ICT Diffusion in Building Projects
Step 1: Knowledge, Persuasion and Decision
• Assessment of organization’s business objectives, industry’s
adoption of ICT and projected usage
• Persuasion of the senior management in the organization for
Strategic ICT adoption for building project management
• Formulation of the Vision and Strategy
Cy
clic
pro
cess
of:
• V
isio
n a
nd
str
ateg
y u
pd
atio
n
• S
yst
em m
od
ific
atio
n a
nd
red
esig
n
• P
lan
nin
g a
nd
im
ple
men
tati
on
of
upd
ated
sy
stem
des
ign
Step 5: Familiarizing associating project team
organizations with the designed system
Step 6: Pilot Implementation
Step 7: System Implementation
Step 3: System Planning (Collective Planning) Planning for system design and implementation in
terms of time, resources and cost
Step 4: System Design and preparation of
the organization for the new system
Step 4b: Technology
Group Works
Step 4a: Management
Group Works
Imp
lem
enta
tio
n
Step 2a: Management Group Works
Step 2b: Technology Group Works
Step 2: Finalization and Implementation of the Strategy
for ICT adoption for Building Project Management Finalization of system specifications by equal consideration of
the non-technological and technological aspects
Step 2c: Collective Works

__________________________________________________________________________________
Page 292
Chapter 8: Interpretation of Data Analysis and Discussions
Step 1 includes the stages of Knowledge, Persuasion and Decision, Step 2-7 form the
Implementation stage and Step 8 includes the Confirmation stage leading to the stages of
periodic Knowledge upgradation, Persuasion and Decision.
8.3.2.1 Step 1: Knowledge, Persuasion and Decision
An organization adopting ICT strategically for building project management should first
gain knowledge about use of ICT tools and technologies, status of ICT adoption in the
industry and the projected usage.
This will be followed by the assessment of its area of expertise, services provided,
organization and management structure, associating organizations on the projects or
supply chain partners, position in the industry and planning for the future, status of use
of ICT in the organization and ICT capability of its staff. This assessment is required to
identify and evaluate organization’s needs, problems, objectives and persuasion of the
senior management for strategic ICT adoption for building project management.
This will lead to the decision about defining the ‘Vision for ICT adoption’ in the
organization and ‘Strategy for ICT adoption for building project management’. It is
important for the senior management in the organization to be involved in the strategic
planning process and to understand the strategic and value-adding opportunities that ICT
can provide. It can only happen if they have knowledge about the usage of ICT tools and
technologies. As organizations formulate their Vision, they should definitely consider
the possibility of being Innovators in the industry. But, as per Retik and Langford (2001,
p.137), Porter and Miller (1985) have suggested that any organization which has a vision
to be a frontrunner or a leader in the industry for adoption of technology, should
consider answering the following questions: Is the technological lead sustainable, what
are their first-mover advantages and what disadvantages are there in being the first
mover? Accordingly strategy needs to be defined. It was identified in the questionnaire
survey data analysis, that only about 1% of the surveyed organizations had partially
adopted web based project management for one or two projects. But, it was found that a

__________________________________________________________________________________
Page 293
Chapter 8: Interpretation of Data Analysis and Discussions
medium sized architectural organization had done a study of the construction industry
and had assessed that there was a rise in the construction activity in the country,
overseas organizations had increased their operations in the country and in next 3-4
years, it will be imperative to adopt web enabled communication and project
management for sustaining the competitive advantage. This organization wanted to take
the technological lead in the industry and had developed a strategy for implementation
of web based project management for their projects.
The perceived barriers for effective adoption of ICT for building project management
and associated enablers identified in the data analysis require consideration while
defining the strategy. Subjective and quantitative assessment of the perceived benefits
for ICT should be conducted for strategy formulation.
SMEs may perceive that having a strategic management and process analysis department
may not be sustainable for their organization. But, articulating their vision for the
organization and formulating a set of objectives and a plan for achieving them will be a
useful exercise. National level bodies in the construction industry should take initiatives
to provide consultancy to SMEs to define strategies for the organization using emerging
techniques and should develop and maintain data and information bases for the
organizations.
These stages of ‘Knowledge’, ‘Persuasion’ and ‘Decision’ require training of the
senior executives of the organization and their knowledge enhancement through
conferences/seminars conducted at national and international level.
8.3.2.2 Step 2: Finalization and Implementation of the Strategy for ICT
Adoption for Building Project Management
Strategy implementation should be managed like a project. Users or the organization
staff at all the levels and at all the project sites and IT specialists should work together to
integrate all activities, work processes and levels in the organization. A very transparent
process of defining change by adopting strategic ICT adoption and assuring people of its

__________________________________________________________________________________
Page 294
Chapter 8: Interpretation of Data Analysis and Discussions
requirement is to be followed. Such a system could be achieved if the project team is
cross-functional and divided into a management group and a technology group for equal
consideration of the non-technological and technological aspects.
A detailed time schedule should be prepared for the finalization and implementation of
the solution. Both the groups will be required to adhere to this time schedule and study
the following aspects:
Step 2a: Management Group Works
Management group works can be summarized as under:
• Assessment of the organization structure.
• Evaluation of the existing support infrastructure in the organization.
• Assessment of the capabilities, concerns and limitations of the users.
• Assessment of the culture within the organization and within the associating
project team organizations.
• Education of the users regarding vision and strategy.
• Incorporation of users’ views.
• Education of the users about capabilities and limitations of the technology.
• Assessment of the expected benefits of ICT investment.
• Selection of the project team for coordinating, monitoring and implementation of
the system.
• Selection of the post implementation monitoring team.
• Study of the associated legal issues.
Step 2b: Technology Group Works
Technology group works can be summarized as under:
• Mapping of project management and associated general administration processes
executed within the organization. It should take into account the intra and inter
departmental as well as inter organization processes.
• Assessment of the present use of IT applications and communication
methodology for their effectiveness.

__________________________________________________________________________________
Page 295
Chapter 8: Interpretation of Data Analysis and Discussions
• Planning for use of advanced ICT tools and technologies.
• Formulation of specifications for the integrated use of ICT in the information
systems.
• Standardization of technologies, information and data within the organization
and if possible with associating organizations.
• Decision about the technical parameters for the system.
• Assessment of the likely maintenance requirement and the system for
upgradation of the hardware and software.
Step 2c: Collective Works of Management Group and Technology Group
Collective works of the management group and the technology group can be
summarized as under:
• Modeling improved processes while adopting ICT strategically.
• Defining and detailing out the alternative system solutions including associated
technical and non-technical aspects.
• Prioritization of the alternative solutions and finalization of the solution.
• Preparation of the budget and cost-benefit analysis.
• Implementation method finalization.
• Finalization of the training requirements of the users and the requirement to hire
new staff.
At each organization level, staff can be categorized in three groups for their
use of ICT: Early adapters or creative users, Normal users, and Late
adapters. Accordingly the training requirements need to be finalized (Ref.
Chapter 3, Sec. 3.6.1). Training objective will be to create a shift in the
organization staff from late adapters towards early adapters as early adapters
will play a crucial role in strategy formulation and normal users will define
effective use of ICT within the organization.

__________________________________________________________________________________
Page 296
Chapter 8: Interpretation of Data Analysis and Discussions
8.3.2.3 Step 3: Planning
Management Group and Technology Group should collectively prepare a time schedule
for design and implementation of the system.
8.3.2.4 Step 4: System Design and Preparation of the Organization for the New
System
Step 4a: Technology Group Works
Technology group works can be summarized as under:
• System design including finalization of the hardware and software specifications.
Important points that are required to be considered while doing system design
are: Adequate flexibility to be provided in the system; System agility to respond
to changes in the size and workload of the organization and to developments in
technology; Hardware and software compatibility; consideration of users’ exact
requirements; user friendly system.
• Data and documents conversion, as data and document records maintained in the
old system are required to be converted for reference and use in the new system.
• Hardware procurement.
• Software procurement or design.
Step 4b: Management Group Works
Management group works can be summarized as under:
• Training and education of staff for the new system.
• Hiring new staff.
8.3.2.5 Step 5: Familiarizing Associating Organizations with the System
Adopted
Associating project team organizations are required to be informed about the new
system to be adopted in the organization. An effort should be made to standardize data

__________________________________________________________________________________
Page 297
Chapter 8: Interpretation of Data Analysis and Discussions
and information transferred between the organizations and to have compatible
technology. Common information databases could be shared between the organizations.
If standardization cannot be achieved between the organizations, contingencies need to
be built up into the system.
8.3.2.6 Step 6: Pilot Implementation
‘Piloting’ is defined as the implementation of a system in a part of an organization or
single project to allow its full impact and benefit to be evaluated before its
implementation across the whole organization and in all the projects. After the pilot
implementation and its assessment, the system design should be modified if required.
8.3.2.7 Step 7: System Implementation
Implementation will include introducing contract clauses defining ICT adoption as scope
of work of the projects and managing building projects utilizing the new system.
8.3.2.8 Step 8: Post Implementation System Monitoring
Post implementation works are summarized as under:
• System maintenance.
• Periodic evaluation of the system for measures of success, achieved benefits and
associated barriers.
This will identify requirement of further knowledge upgradation, persuasion and
decision making and will lead to:
• Vision and strategy updation
• System modification and redesign
Thus, it is a cyclic process and should be supported by users’ feedback, changing
requirements, new technological innovations and the changing stratification of the
organization staff with respect to the three categories of early adapters, normal users and

__________________________________________________________________________________
Page 298
Chapter 8: Interpretation of Data Analysis and Discussions
late adapters. Durations, resource requirements and cost of each stage should be
calculated by the planners in the organization and network analysis of the project will
provide the time, resource and cost schedules for the process.
8.3.3 Framework at the Level of Construction Professionals or People
Increased ICT capability of the construction professionals or people leads to the
increased ICT capability of the industry. Thus, ‘knowledge’ of the construction
professionals for ICT adoption for building project management is required to be
enhanced. As discussed, this will be facilitated by the training initiatives at the Industry
and Organization levels.
Data analysis shows that if people perceive high benefits and low barriers of use of ICT
for project management, it will increase effective adoption of ICT for project
management. As discussed, training, education and examples of showcase projects and
proactive atmosphere in the organization are required to modify perceptions of people
and to ‘persuade’ them to increase ICT adoption for building project management. It
will lead to effective implementation of the organization level strategy. This will also be
facilitated by the training initiatives at the industry and organization levels.
But, ‘decision’ of ICT adoption for project management is taken at the organization
level. Senior managers are involved in decision making in the organization, but middle
and operational level staff are not involved in decision making and have to adopt ICT as
per the strategy of the organization. ‘Implementation’ and ‘Confirmation’ stages also do
not apply at the level of people and organization is the lowest unit on which these stages
will be applied.

__________________________________________________________________________________
Page 299
Chapter 8: Interpretation of Data Analysis and Discussions
8.3.4 Discussion
The above discussion is summarized schematically in Fig. 8.5 and discussed below:
Knowledge
Persuasion
People Level Industry Level
Confirmation
Knowledge
Persuasion
Decision
Implementation
Confirmation
Knowledge
Persuasion
Decision
Implementation
Organization Level
Fig. 8.3: Schematic Diagram of Model for Strategic Diffusion of ICT in
the Indian Construction Industry for Building Project Management
Effective use of
ICT by people
Successful
implementation of
strategy at
Organization level
Successful
implementation of
strategy at Industry
level
If Strategic use of ICT is implemented at the Industry level and the Organization
level, it will lead to effective ICT adoption by the people in the project teams. This
will lead to successful implementation of Organization level strategies, further
leading to successful implementation of the Industry level strategy. Thus, it is a
cyclic process, which in totality will lead to the strategic diffusion of ICT for
building project management.

__________________________________________________________________________________
Page 300
Chapter 8: Interpretation of Data Analysis and Discussions
As per Roger’s diffusion theory, the speed of technology adoption is determined by two
characteristics; p, which is the speed at which adoption takes off, and q, the speed at
which the later growth occurs (Chapter 3, Sec. 3.6.1).
In this research study, with respect to adoption of new ICT tools and technologies, p is
associated with their adoption by Innovators and Early adopter organizations and q is
associated with their adoption by Early majority organizations. p and q both are
important as adoption of ICT by Innovators and Early adopters helps Early majority
organizations in assessing use of technology on early projects and preparing their
organizations for its use and its adoption. This further signifies diffusion of technology
in the industry and its use on majority of the projects.
Innovators and Early adopters have high ICT capability and readiness. But as identified
in this research, Early majority organizations require Industry level support for adoption
of new ICT tools and technologies. Thus, implementation of the model discussed above
will define q.
8.4 Summary
The ‘Strategic model for enhancing ICT diffusion in building projects’ discussed above
synthesizes the results of the literature review and data analysis conducted in this
research study. In the construction industry with multi enterprise work, a communication
system will become a protocol if it is adopted by the majority of the industry i.e. the
system and the associated technology is diffused in the industry. Thus, the model is
based on Everett Roger’s ‘Diffusions of innovations theory’. The model reflects that the
diffusion of technology in a society or industry not only includes adopting the
technology, but also includes training the people and preparing the organizations for its
effective adoption. Chapter 9 summarizes the research study.

__________________________________________________________________________________
Page 301
Chapter 9: Summary and Conclusions
CHAPTER 9
SUMMARY AND CONCLUSIONS
9.1 Introduction
This chapter summarizes and draws conclusions from the study with respect to the
research objectives identified in Chapter 1. The research study comprises study of
related literature (Chapter 2), detailed discussion of research hypotheses and research
methodology (Chapters 3, 4), empirical analysis of data (Chapters 5, 6), discussion and
finalization of the suggested ‘Benchmarking Framework’ for measuring ICT adoption
for building project management in the Indian construction industry including
methodology for measuring efficiency of organizations in implementing their strategies
and case study analysis (Chapter 7), and discussion and interpretation of quantitative and
qualitative data analysis leading to the formulation of a model for strategically
enhancing ICT diffusion for building project management (Chapter 8). This chapter
highlights the significant research contributions this study makes to the field of building
project management. Implications of the study are discussed at the levels of industry,
organization and people. Limitations of the research study are identified and the future
research scope emerging from the research study is also discussed.
9.2 Summary of Research Findings
9.2.1 Summary of Research Process
Introduction to the research topic discussed that people, who are a part of different
project team organizations, manage projects and the project team organizations are a part
of the construction industry. In an organization, top management primarily initiates
adoption of ICT, but effective adoption of ICT is still dependent on project managers

__________________________________________________________________________________
Page 302
Chapter 9: Summary and Conclusions
who have the main responsibility for managing the construction projects. IT enhanced
communication protocols have to address technical, managerial, social and cultural
issues and are required to be implemented at the levels of industry, organization and
project or people.
Thus, the factors affecting ICT adoption for building project management or the research
variables were identified and analyzed at the three discussed levels. A hybrid
methodology utilizing the symbiotic relationship between quantitative and qualitative
studies was utilized. Saunders et al. (2000) have suggested that it is often beneficial to
use a mixed methods approach by combining quantitative and qualitative methods and to
use primary and secondary data in the same study, as it helps in using different methods
for different purposes in the study and enables triangulation to take place at the results
formulation stage.
The research focused on collecting and analyzing both quantitative and qualitative data
in the study in a sequential manner (sequential mixed methods). The research was
divided into four phases: Interpretive analysis of perceived benefits of effective ICT
adoption for building project management, conducted by ISM analysis; Questionnaire
survey data collection and empirical analysis of data including SEM analysis
(quantitative method); Semi-structured interview survey data collection and analysis
including DEA analysis (quantitative and qualitative method); and Case Studies analysis
conducted by SAP-LAP analysis (qualitative method) leading to the synthesis of the
results of the four phases. The purpose of this four-phase, sequential mixed methods
study was to start with pragmatic assumptions; obtain statistical, quantitative results
from a broad sample of organizations to analyze or study research variables at industry
and organization levels and then to follow up with selected organizations and projects to
study the research variables at the levels of organization and people. Fig. 9.1
summarizes the data collection and analysis techniques and depicts the sequential
mixed-methods approach followed in the research study.
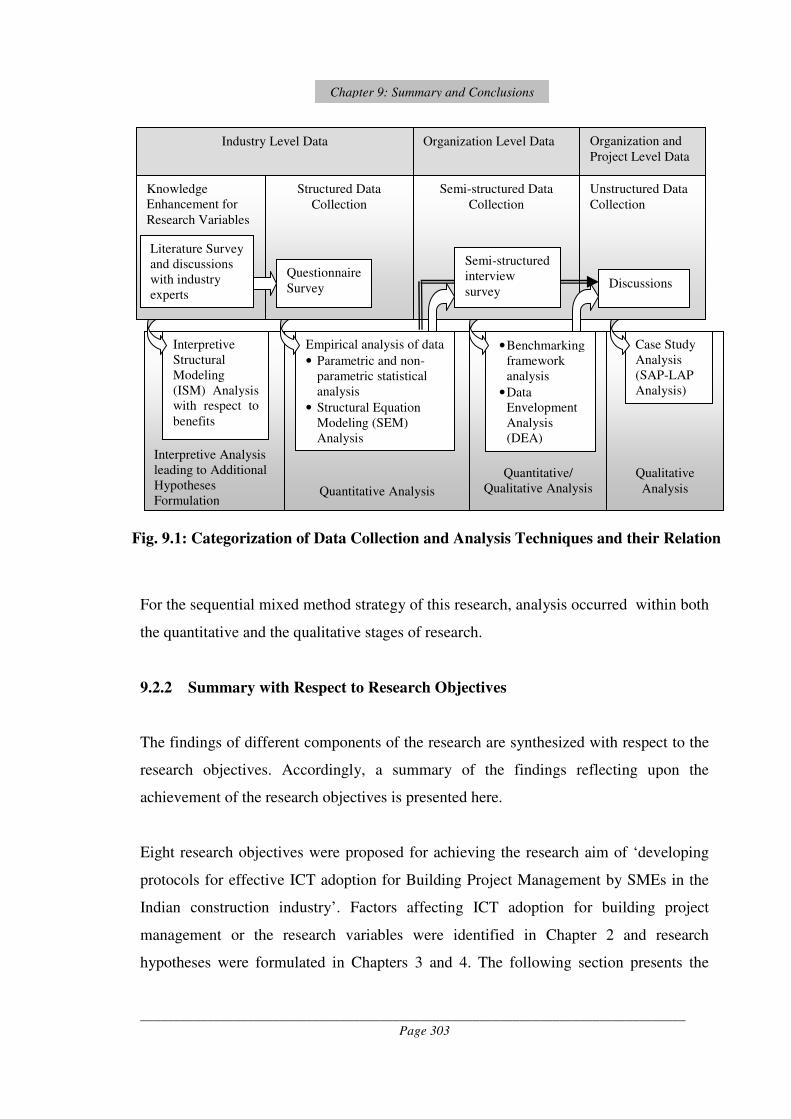
__________________________________________________________________________________
Page 303
Chapter 9: Summary and Conclusions
For the sequential mixed method strategy of this research, analysis occurred within both
the quantitative and the qualitative stages of research.
9.2.2 Summary with Respect to Research Objectives
The findings of different components of the research are synthesized with respect to the
research objectives. Accordingly, a summary of the findings reflecting upon the
achievement of the research objectives is presented here.
Eight research objectives were proposed for achieving the research aim of ‘developing
protocols for effective ICT adoption for Building Project Management by SMEs in the
Indian construction industry’. Factors affecting ICT adoption for building project
management or the research variables were identified in Chapter 2 and research
hypotheses were formulated in Chapters 3 and 4. The following section presents the
Fig. 9.1: Categorization of Data Collection and Analysis Techniques and their Relation
Quantitative/
Qualitative Analysis
Quantitative Analysis
Qualitative
Analysis
Interpretive Analysis
leading to Additional
Hypotheses
Formulation
Empirical analysis of data
• Parametric and non-
parametric statistical
analysis
• Structural Equation
Modeling (SEM)
Analysis
• Benchmarking
framework
analysis
• Data
Envelopment
Analysis
(DEA)
Case Study
Analysis
(SAP-LAP
Analysis)
Interpretive
Structural
Modeling
(ISM) Analysis
with respect to
benefits
Unstructured Data
Collection
Semi-structured Data
Collection
Structured Data
Collection
Discussions
Knowledge
Enhancement for
Research Variables
Semi-structured
interview
survey
Questionnaire
Survey
Literature Survey
and discussions
with industry
experts
Industry Level Data Organization Level Data Organization and
Project Level Data

__________________________________________________________________________________
Page 304
Chapter 9: Summary and Conclusions
research objectives for reference and discusses the research study with respect to these
research objectives.
Questionnaire survey data collection and empirical analysis of data (Chapters 5 and 6)
were conducted to test the hypotheses and to study the identified factors with respect to
the research objectives. Unit of analysis for the questionnaire survey was ‘an
organization managing building projects’ and to have the true representation of the
population, those organizations were included in the sample, which were either
managing building projects after being appointed as the Project Managers or had the
authority to manage their projects if a Project Manager was not appointed formally.
Therefore three groups of organizations were included in the sample: builders including
contractors who construct and manage their projects; project management consultancy
organizations (PMCOs) which are formally appointed as project managers on building
projects; and architectural organizations which manage their own small to medium size
building projects since on many such projects, project managers are not formally
appointed. The survey was conducted across the country. Thus, data analysis studied
research variables at the organization level and could be generalized for the industry.
9.2.2.1 Research objectives (i, ii)
• To identify generic project management processes adopted by SMEs in India for
building project management.
• To identify the extent of Information Communication Technologies (ICT)
adopted by SMEs for building project management.
Questionnaire survey data analysis led to the mapping of project management processes
adopted by the three groups of surveyed organizations and the extent of ICT adopted by
these organizations. Data analysis shows that all the surveyed PMCOs execute all the
identified time and cost processes. With respect to the time management processes, all
the organizations prepare ‘detailed time schedule at construction stage’, but not all the
builders and the architectural organizations prepare ‘master time schedule at design

__________________________________________________________________________________
Page 305
Chapter 9: Summary and Conclusions
stage’ and ‘performance reports and variance analysis reports’. With respect to the cost
management processes, cost estimates are prepared by all the organizations, detailed
cash flow is prepared by almost all and the cost variance reports are prepared by lesser
number of organizations. It can be summarized that the maximum formal project
management processes are adopted by PMCOs and the least by the architectural
organizations. Also, there is more variability among builders for the adoption of formal
project management processes.
Data analysis showed that the extent of adoption of ICT for building project
management differs for the three groups of sample organizations i.e PMCOs, builders
and architectural organizations and decreases in this order. Reasons identified for the
phenomenon were the difference in the extent of formal project management processes
adopted by these groups of organizations and the difference in the use of software or
advanced tools for the individual processes. Thus, it was inferred that an organization
which adopts more formal project management processes and utilizes more advanced
software for individual processes, would have higher ICT adoption for building project
management processes.
9.2.2.2 Research Objectives (iii-v)
• To identify perceived barriers and associated enablers for IT enhanced
communication management by SMEs and to develop a model for establishing
structural relationships amongst them.
• To assess perceived industry requirements driving adoption of ICT by SMEs.
• To identify perceived benefits of ICT adoption.
Perception based data analysis was conducted for the perceived benefits, barriers,
enablers and industry drivers affecting ICT adoption for building project management.
Perceived benefits were grouped under measures of project success, effective team
management, effective use of technology and increased efficiency of the organization.
Interpretive analysis of perceived benefits conducted by ISM analysis (Chapter 4)

__________________________________________________________________________________
Page 306
Chapter 9: Summary and Conclusions
showed that if use of ICT for general administration in the organization is matured,
appropriate IT tools are included in the working framework and team management
issues are planned at the earlier stages of the project, then project related benefits will be
achieved by default. Descriptive analysis (Chapter 5) showed that all the groups of
benefits are considered equally important and are interrelated. It validated results of ISM
analysis that all groups of benefits are interrelated and cannot be achieved in isolation.
Perceived barriers were studied at four levels i.e. industry, organization, projects and
technology. Identification of the perceived barriers at each level led to the identification
of perceived enablers of that level, since enablers are required to mitigate barriers and
assist in upgradation of the extent of ICT adoption (Chapter 5). Study of the relation
between groups of barriers and enablers showed that some of the industry related
barriers could also be addressed through strategic decisions taken at the project level for
administration and increasing team collaboration. Descriptive analysis of the perceived
barriers shows that available technology in terms of ICT infrastructure is found to be
primarily adequate by the organizations. But, high ranked barriers are industry related
barriers or organization related barriers and require strategic initiatives at the industry
and organization levels. Descriptive analysis of the perceived enablers shows that it is
important for the clients to include adoption of ICT in the project scope. Some of the
industry related barriers could be addressed while planning and setting up systems at the
project level. These systems are required to be set up by a team member who takes the
lead in defining the use of ICT in a project. Such a champion of the use of ICT should
also address the issues that improve team management collaboration. All project team
organizations should develop strategic plans aligning the use of ICT with their business
plans and maintaining a reliable electronic database in the organization. It is also
important that at the industry level, education and training is provided to the
construction professionals for adopting ICT.
Study of the relation between benefits and barriers led to this preposition that in any
organization adoption of ICT would be of a high level, only if low barriers and high
benefits are perceived.

__________________________________________________________________________________
Page 307
Chapter 9: Summary and Conclusions
Study of the perceived industry drivers shows that increase in adoption of ICT in the
industry is significantly affected by the industry drivers (Chapter 5). Most important is
‘increased requirement of clients for more project information resulting in increased use
of ICT’. Thus, result of the study of perceived enablers is validated that it is important
for the clients to include adoption of ICT in the project scope.
9.2.2.3 Research objective (vi)
• To identify factors other than perceived enablers, barriers, benefits and industry
drivers affecting adoption of ICT.
Questionnaire survey data analysis led to the identification of 13 issues and 4 cultural
factors affecting ICT adoption for building project management by SMEs in the Indian
construction industry (Chapter 5). Benchmarking framework analysis led to the
identification of an additional trend (Chapter 7). These actions require attention at the
levels of industry, organization and people. The issues are technical, managerial and
strategic.
9.2.2.4 Research Objective (vii)
• To study the causal relationships between all the identified factors.
SEM analysis was conducted to study causal relationships between the quantifiable
research variables or factors (Chapter 6). Analysis of these causal relationships helps us
in understanding that an increased and matured use of ICT for general administration
within the organization would lead to an improved ICT infrastructure within the
organization, development of electronic databases and the staff that is confident of using
IT tools. In such a scenario, the staff would use advanced software and IT technologies
for project management processes and that would lead to increased use of ICT for
project management processes. For general administration also, ICT usage would be
enhanced if the organization is interacting more with geographically separated agencies

__________________________________________________________________________________
Page 308
Chapter 9: Summary and Conclusions
and the senior management perceives that significant benefits would accrue by adoption
of ICT by the organization. All the factors are inter-related and their effect cannot be
maximized in isolation.
Mixed methods analysis approach adopted in this research study helped in establishing
causal relationships between other factors.
9.2.2.5 Research objective (viii)
• To provide a framework for increasing effective ICT adoption for Building
Project Management and suggest method of validation of the framework.
The following two frameworks have been formulated:
1. A Benchmarking framework to measure the extent of ICT adoption for building
project management (Chapter 7).
2. A model for strategic enhancement of ICT diffusion for building project
management (Chapter 8).
The benchmarking framework is a component of the strategic model and can be
administered at the levels of industry and organization. The strategic model is
formulated for implementation at the three levels of study i.e. industry, organization and
people.
Benchmarking Framework
Questionnaire survey data analysis led to the formulation of the ‘Benchmarking
framework’ and the suggested ‘Benchmarking process’. The Benchmarking process has
four iterative stages of Benchmarking and BenchMeasurement, BenchLearning,
BenchAction, and BenchMonitoring. The first two stages were discussed in detail and
administered on three organizations. A structure for the last two stages was presented in
Chapter 7.

__________________________________________________________________________________
Page 309
Chapter 9: Summary and Conclusions
Semi-structured interviews were conducted in three organizations, one from each group
of the surveyed organizations. These organizations had responded for the questionnaire
survey and were high users of ICT. Interviews were conducted for the validation and
finalization of the proposed benchmarking framework and for rating the three
organizations for the extent of ICT adoption for building project management.
Benchmarking framework consists of three groups of performance or measurement
indicators and provides a framework for rating organizations at three levels: Low,
Medium and High. It also identifies gaps in practice with respect to the identified best
practice. BenchMeasurement utilizes ‘Data Envelopment Analysis’ technique for
measuring performance of the benchmarked organizations for efficiently implementing
their strategies for ICT adoption for building project management. BenchLearning
includes case study analysis conducted through SAP-LAP analysis. It identifies reasons
for gaps in practice and assesses other subjective issues. This stage also identifies
actions in response to the identified issues. These actions form a part of BenchAction.
Structure for BenchAction and BenchMonitoring was also suggested.
Benchmarking framework provided a structure for categorizing organizations as
Innovators, Early adopters, Early majority, Late majority and Laggards with respect to
the adoption of ICT for building project management.
Strategic model for enhancement of ICT diffusion for building project
management
Synthesis of the knowledge enhancement from the ongoing literature survey, and data
analysis results and their interpretation led to the proposed ‘Strategic model for
enhancement of ICT diffusion for building project management’ (Chapter 8). The model
is based on Everett Roger’s ‘Diffusions of innovations theory’. The model is discussed
as a generic framework of the five stages of Roger’s ‘Diffusions of innovations theory’
i.e Knowledge, Persuasion, Decision, Implementation and Confirmation. All five stages

__________________________________________________________________________________
Page 310
Chapter 9: Summary and Conclusions
are discussed for the framework at industry and organization levels. Only two stages of
Knowledge and Persuasion are discussed for the framework at the level of construction
professionals or people. It is so because people can be provided knowledge about the use
of ICT tools and technologies. They can also be persuaded to adopt ICT through
training, education, and examples of showcase projects and through proactive
atmosphere in the organization. But, the decision about adopting ICT in construction
projects is taken at the organization level.
As per Roger’s theory, it’s a sequential process with each stage leading to the next. The
suggested model is a modification of the theory as data analysis and literature study have
identified that it would be a cyclic process with ‘confirmation’ leading to further
‘knowledge’ upgradation. It is discussed in detail in chapter 8.
The ‘Benchmarking Framework’ is a component of the final framework. It has been
validated, thus the final framework is also partially validated. The other components of
the framework are also derived from research analysis results. There is ‘inter-validation’
of results for various research components leading to ‘within-method’ triangulation.
Thus, the other components of the framework are also validated within the research
analysis. Sec. 8.3.4 also provides the method of validation of the complete framework
as: ‘If Strategic use of ICT is implemented at the Industry level and the Organization
level, it will lead to effective ICT adoption by the people in the project teams. This will
lead to successful implementation of Organization level strategies, further leading to
successful implementation of the Industry level strategy.’
9.2.3 Summary of Data Analysis
The above discussion shows that quantitative and qualitative methods of analysis were
used in conjunction to highlight their strengths and counter their weaknesses in the study
and to achieve validation of the results within the study. It included ‘within-method’
triangulation, which is aimed at checking the internal consistency of the results and

__________________________________________________________________________________
Page 311
Chapter 9: Summary and Conclusions
‘across-method’ triangulation, which checks the external validity of research (Srivastava
and Teo 2006).
Fig. 9.2 shows the research process in terms of the input research constructs and the
output analysis results at each stage of the study.
Summary of the data analysis components provides a framework for measuring ICT
adoption for building project management by construction organizations. The
framework has four parameters as shown in Fig. 9.3 and discussed below.
LITERATURE REVIEW
Outputs
Benefits Management Plan
13 Issues and 4 Cultural
Factors
• 5 Industry level Issues
• 5 industry and organization
level issues
• 3 organization level issues
• 2 organization level cultural
factors
• 2 people level cultural
factors
Proposed Benchmarking
framework
(Chapter 4,5,6)
Final Benchmarking
Framework and
‘Benchmarking Process’ of
four stages
17 Gaps in Practice and 10
Trends
• 17 Gaps in Practice at
Organization Level
• 9 trends at Organization and
People level reflecting already
identified issues
• 1 additional trend at
Organizational level
Methodology for Measuring
Performance Efficiency of
Organizations for
Implementing their Strategies
(Chapter 7)
21 Actions in
response to
identified Gaps and
Trends identified at
the levels of
Organization and
People (Chapter 7)
STRATEGIC MODEL FOR ENHANCEMENT OF ICT DIFFUSION FOR BUILDING
PROJECT MANAGEMENT
(Chapter 8)
• Factors Affecting ICT
adoption for Building
Project Management
• Research Hypotheses
(Chapter 2,3,4)
Proposed
Benchmarking
Framework
17 Gaps in Practice
and 10 Trends
Fig. 9.2: Input Research Constructs and Output analysis Results at Each Stage
of Study

__________________________________________________________________________________
Page 312
Chapter 9: Summary and Conclusions
• Perceived benefits and barriers: Organization’s ICT adoption would be of a
high level, only if low barriers and high benefits are perceived (Ref. Chapter 5,
Sec. 5.6.4).
• Benchmarking Rating: Benchmarking framework facilitates rating of
organizations for high, medium or low level of ICT adoption for building project
management (Ref. Chapter 7, Sec. 7.2.2).
• Data Envelopment Analysis Efficiency Score: The analysis would identify
efficiency of organizations for implementing their strategies of ICT adoption.
Most efficient organizations would have 100% efficiency score. Inputs and
outputs for the analysis are derived from the Benchmarking framework (Ref.
Chapter 7, Sec. 7.4.4).
• Categorization of Organizations for ICT adoption: Rating of organizations by
the suggested benchmarking framework leads to the categorization of
organizations under five groups of Innovators, Early Adopters, Early Majority,
Late Majority and Laggards or technically averse. This categorization is derived
from the relation between the scores of ‘Strategy for use of ICT’ indicators (MI1-
Measuring ICT
adoption for
Building Project
Management by
Construction
Organizations
Data Envelopment Analysis
Efficiency Score
100%
<100%
Perceived Benefits
and Barriers
Low
Medium
High
Benchmarking
Rating
Low
Medium
High
Categorization of
Organizations for use of ICT
Innovators
Early Adopters
Early Majority
Late Majority
Laggards/Technically Averse
Fig. 9.3: Proposed Parameters for Measuring ICT Adoption for
Building Project Management by Construction Organizations

__________________________________________________________________________________
Page 313
Chapter 9: Summary and Conclusions
MI3) and the cumulative scores of ‘ICT Infrastructure Maturity and Use of ICT’
indicators (MI4-MI8) (Ref. Chapter 8, Sec. 8.2.5).
9.3 Significant Research Contributions
Bellenger and Greenberg (1978) have qualified good research as: systematic; logical i.e.
it follows a logical process of induction and deduction; empirical; and replicable i.e. the
research process can be replicated for verification, thereby building a sound basis for
decisions (Kothari 2005, p.20). The author believes that this research followed the
recommended approach and has made following significant contributions:
• As per the literature survey findings, till now such a study and survey has not
been conducted with reference to the Indian construction industry. Thus, this
study provides a direction for research in use of ICT in the Indian construction
industry.
• Interpretive Structural Modeling analysis provides a roadmap for the project
managers for benefits management plan with respect to ICT adoption i.e. a
roadmap to decide that if they are planning ICT adoption for achieving certain
benefits then what are the other driving benefits that should be achieved prior to
that and also what are the dependent benefits that would be achieved by default.
• Questionnaire survey data analysis provides a mapping of Indian construction
industry for the use of formal project management processes, of IT tools for
these processes, and of ICT for communicating information for these processes.
It also provides mapping of the perceptions of senior construction executives for
benefits, barriers, enablers and industry drivers for effective ICT adoption for
building project management.
• Structural Equation Modeling analysis of causal relationships between factors
affecting ICT adoption for building project management provides a macro level
perspective to the analysis in place of a micro-level one. It also shows that the
perception based factors are as important as quantitative factors.
• The suggested Benchmarking process provides a system for measuring the extent
of ICT adoption for building project management by SMEs in the Indian

__________________________________________________________________________________
Page 314
Chapter 9: Summary and Conclusions
construction industry. It can be utilized at the industry level to map the
stratification of construction industry for ICT adoption for building project
management and also at the organization level by construction organizations for
self-analysis and identification of improvement opportunities. It is a generic
process and can be customized for other countries with due considerations.
• Data Envelopment Analysis shows that strategy formulation is as important as
effective implementation of strategies.
• Results or the ‘Strategic model for enhancement of ICT diffusion for building
project management’ suggested at the levels of Industry, Organization and
People is a generic model and can be adopted for other countries.
• Multiple analysis techniques provide triangulation of the analysis results, leading
to the validation of results, thus, providing credence to the results.
• Research study establishes the relevance of using statistical techniques for
construction industry research.
• This research provides parameters for recalibration of the benchmarking
framework and recalibration of results.
• While the research was conducted in an Indian context, the research outcome is
envisaged to be widely applicable in other countries. Factors affecting ICT
adoption for building project management or the research variables were
identified after extensive literature survey. Thus, these research variables could
be generalized for other countries with due considerations, specifically for
countries where the construction industry is similar to Indian construction
industry in terms of working methodologies, and social and cultural factors or for
large countries like Australia. Data collection instruments like questionnaire
survey and proposed benchmarking framework have a generic structure and can
be customized for other countries. Similarly the proposed benchmarking
framework and the results have a generic structure. Thus, even though the
research has been conducted for Indian construction industry, it can be
generalized and applied for other countries with due considerations.

__________________________________________________________________________________
Page 315
Chapter 9: Summary and Conclusions
9.4 Implications and Relevant Research Audience
Research identified factors affecting ICT adoption for building project management at
the levels of Industry, Organization and People. The study of these factors and study of
the causal relationships between these factors identified that the results are also required
to be formulated at these three levels. Thus, implications of this research are also
discussed at these three levels.
9.4.1 Implications for National level bodies and Academic Institutions
The research provides a reference study to the national level bodies in the Indian
construction industry for conducting more such surveys and studies across the country
for increasing ICT adoption in the industry. Suggested Benchmarking process is a tool
that can be administered by the national level bodies for rating construction
organizations for ICT adoption for building project management. BenchMeasurement
and BenchLearning stages would further help in identifying reasons for low ICT
adoption and for suggesting methods or actions for improvement. Parallel industry
benchmarking conducted with an industry having similar work practices would bring
innovation in use of ICT in the construction industry.
Results or the ‘Strategic model for enhancing ICT diffusion‘ discussed at the industry
level incorporates the suggested benchmarking process and provides step-by-step
approach to the national bodies for formulating and implementing strategies for
increasing ICT adoption in the industry.
This research study has been conducted as a part of the academic research and provides
results that can be applied in the industry. Thus, it implies that academic institutions and
national level bodies should work in tandem and not in an isolated manner. Practical
requirements of the industry should be studied and analyzed through the academic
research projects so as to benefit from the theoretical knowledge base of the
academicians with respect to the technical industry requirements and relevant statistical

__________________________________________________________________________________
Page 316
Chapter 9: Summary and Conclusions
analysis tools. This research provides a framework to academic institutions to study ICT
adoption in the construction industry and to apply results in the industry.
9.4.2 Implications for Construction Organizations
Interpretive Structural Modeling analysis provides a roadmap for the project managers
for benefits management plan with respect to ICT adoption i.e. a roadmap to decide that
if they are planning use of ICT for achieving certain benefits then what are the other
driving benefits that should be achieved prior to that and also what are the dependent
benefits that would be achieved by default.
Also, the suggested Benchmarking framework is a tool that can be used by organizations
for rating themselves for ICT adoption for building project management. Results
formulated at the organization level provide a framework for organizations to achieve
strategic ICT adoption. It incorporates technical, managerial as well as human resource
or people related issues.
The results show that an organization is an important unit of construction industry and
strategies at the organization level can determine the level of ICT adoption by their
people or staff. Two important issues highlighted at this level are the top down approach
of training executives for the use of ICT and the proactive approach at the organizations
so that their executives perceive maximum benefits and minimum barriers for effective
ICT adoption.
9.4.3 Implications for People or Project Managers
Results at the level of people indicate that knowledge upgradation or training of the
executives is an important factor and people should always strive for training for higher
ICT tools and should try to overcome the people level cultural factors identified in the
data analysis.

__________________________________________________________________________________
Page 317
Chapter 9: Summary and Conclusions
9.4.4 Implications at International Level
The research has been conducted with respect to the Indian construction industry. But,
the identified research issues are applicable globally. Also, as per the literature review,
globally, majority of the construction organizations are SMEs. Thus, the research results
can be generalized for other countries after due considerations as discussed above (Sec.
9.3).
9.5 Limitations of the Research Study
9.5.1 Limitations with respect to the Questionnaire Survey and Data Analysis
Following limitations were faced during the study:
• India is a large country with a lot of diversity in terms of working methodologies,
and social and cultural issues. A bigger sample size covering all the parts of the
country would have brought more insight into the issues covered in the present
research, had this been feasible for this specific approach.
• Sample size of the survey could have been larger. But, the concept of secrecy
seems to be sacrosanct to the construction organizations in the country so much
so that it proves to be an impermeable barrier to researchers. The survey did not
require any financial or commercial information, but many organizations did not
respond, as they did not want to divulge any information about the organization.
9.5.2 Limitations with respect to the Benchmarking Framework Analysis
In the Benchmarking framework analysis, following limitations were felt due to the
research time limitations and deserve further investigation in future research:
• Implementation of the Benchmarking framework for a larger number of
organizations has not been conducted.
__________________________________________________________________________________
Page 318
Chapter 9: Summary and Conclusions
• Parallel industry benchmarking has been defined in the research study. But, an
industry with similar work practices has not been identified for parallel industry
benchmarking.
9.6 Recommendations for Future Research
• Surveys should be conducted in all regions of India, including smaller townships
where at present many construction activities are happening. This would bring
further insights to the research problem.
• The study should be combined with the study of behavioral sciences in use of
ICT. This would help in further study of cultural and social factors.
• The study should be combined with the study of procurement issues. This would
help in identifying required contract clauses and other contractual issues required
for incorporating use of ICT in project scope.
• Further research should identify an industry with similar work methodologies
and project management processes for comparison between ICT adoption by
SMEs of both the industries. It would facilitate ‘parallel industry or generic
benchmarking’ and would further facilitate innovation in ICT adoption by SMEs
in the construction industry.
• The research framework used can apply for research in the construction
industries of other countries, specifically for countries where the construction
industry is similar to the Indian construction industry in terms of working
methodologies, and social and cultural factors or for large countries like
Australia. It would lead to further application of the research knowledge gained
in this research.

__________________________________________________________________________________
Page 319
Chapter 9: Summary and Conclusions
9.7 Summary
The aim of this research was to identify IT enhanced communication protocols for
adoption of ICT for building project management by SMEs in the Indian construction
industry. The research work has enabled the examination of causal relationships between
research variables. Multiple analysis techniques provide triangulation of analysis results,
leading to validation of results. This chapter summarizes the major findings leading to a
discussion of the significant research contributions, the implication of research for
industry practitioners as well as for academicians, and the limitations of research. Areas
for further research are suggested to close the gaps and to keep enriching the research.


__________________________________________________________________________________
Page 321
References
REFERENCES
Acharya, S.S., 2006. Rating the Driver to SME Growth, SME World, Feb-April, pp.39-
42.
A Data Envelopment Analysis (DEA) Homepage, 1996. (online information) Available
from: http://www.etm.pdx.edu/dea/ (cited in January 2007).
Ahuja. V. and Yang, J., 2005. Towards ‘IT’ Enabled Supply Chain Communication In
Construction Project Management, In Ribeiro, F.L., Love, P.E.D., Davidson, C.H.,
Egbu, C.O. and Dimitrijevic, B. Ed. Proceedings of CIB Conference on
Information and Knowledge Management in Global Economy, Lisbon, Portugal,
May 2005, 1, pp.289-302.
Ajitabh, 2003. Competitiveness of Software Firms in India: An Empirical Study,
Unpublished PhD Thesis, Indian Institute of Technology, Delhi, New Delhi, India.
Akinci, B., Kiziltas, S., Ergen, E., Karaesmen, I.Z. and Keceli, F., 2006. Modeling and
Analyzing the Impact of Technology on Data Capture and Transfer Processes at
Construction Sites: A Case Study, Journal of Construction Engineering and
Management, 132(11), pp.1148-1157.
Al-Jibouri, S.H. and Mawdesley, M.J., 2002. A Knowledge Based System for Linking
Information to Support Decision Makign in Construction, ITcon, 7, pp.83-100.
Alshawi, M. and Ingirige, B., 2002. Web-Based Project Management, Available from:
www.construct-it.org.uk (cited in Dec’2002).
Alshawi, M. and Ingirige, B., 2003. Web-enabled Project Management: An Emerging
Paradigm in Construction, Automation in Construction, 12, pp.349-364.
An Analysis of the Australian Building and Construction Industries (Competitive
Australia), Department of Industry, Science and Resources (DISR) Commonwealth
of Australia, Canberra, Australia, 1999.
Anderson, K., and McAdam, R., 2004. A Critique of Benchmarking and Performance
Measurement: Lead or Lag?, Benchmark, 11(5), pp.465–483.
Anderson, R.I., Fok, R., Zumpano, L.V. and Elder, H.W., 1998. The Efficiency of
Franchising in the Residential Real Estate Brokerage Market, Journal of Consumer
Marketing, 15(4), pp.386-396.
Andresen, J.L., Christensen, K. and Howard, R.W., 2003. Project Management with a
Project Web, ITcon, 8, pp.29-41,

__________________________________________________________________________________
Page 322
References
Andrews, A., Rankin, J.H. and Waugh, L.M., 2006. A Framework to Identify
Opportunities for ICT Support When Implementing Sustainable Design Standards,
ITcon, 11, pp.17-33.
Angelo, W., 1995. Construction One: The Infobahn, Engineering News Rec., 234(15),
pp.34-36.
Apparao T.V.S.R. and Narasaiah V.L., 2003. Methods and Techniques for Integrating
Computer and Information Technology Applications Towards Computer
Integrated Construction, Structural Engineering Research Center Report (SERC),
Chennai, India.
ASEAN Small and Medium Enterprises, 1997. Singapore Productivity and Standards
Board, (ASEAN Report).
Awasthi, A. and Varman, R., 2003. Investigating the Influence of Information
Technology on Decision Making, Journal of advances in Management Research,
1(1), pp.74-87.
Back, W.E. and Bell, L.C., 1995. Quantifying Process Benefits Of Electronic Data
Management Technologies, Journal of Construction Engineering and
Management, 121(4), pp.415-421.
Back, W.E. and Moreau, K.A., 2000. Cost and Schedule Impacts of Information
Management on EPC Process, Journal of Management in Engineering, 16(2),
pp.59-70.
Bagozzi, R.P. and Heatherton, T.F., 1994. A General Approach to Representing
Multifaceted Personality Constructs: Application to State Self-esteem, Structural
Equation Modeling, 1(1), pp.35–67.
Bakens, W., Viries, O. and Courtney, P., 2005. International Review of Benchmarking
in Construction, Research Report, PSIBOUW, Amsterdam, The Netherlands.
Balsubramanian, N., 2006. SME Top Attention Seeker in the Times to Come, SME
World, Feb-April, pp.37-38.
Baldwin, A.N., Thorpe, A. and Carter, C., 1999. The use of Electronic Information
Exchange on Construction Alliance Projects, Automation in Construction, 8(6),
pp.651-662.
Banker, R.D., Charnes, A. and Cooper, W.W., 1984. Some Models for Estimating
Technical and Scale Efficiencies in Data Envelopment Analysis, Management
Science, 30(9), pp.1078-1092.
__________________________________________________________________________________
Page 323
References
Barber, E., 2004. Benchmarking the Management of Projects: A Review of Current
Thinking, International Journal of Project Management, 22, pp.301-307.
Bawden, D. and Blakeman, K., 1990. IT Strategies for Information Management,
London: Butterworth Scientific.
Beatham, S., Anumba, C., Thorpe, T. and Hedges, I, 2004. KPIs: A Critical Appraisal of
their Use in Construction, Benchmark, 11(1), pp.93–117.
Bellenger, D.N. and Greenberg, B.A., 1978. Marketing Research – A Management
Information Approach, Homewood, Illinois: Richard, D. Irwin, Inc.
Benbasat, I., Goldstein, D.K. and Mead, M., 1987. The Case Research Strategy in
Studies of Information Systems. MIS Quarterly, 11(3), pp.369-386.
Benchmarking Best Practice Report: Cost and Change Management, 1998. Construct IT
Initiative Report, Salford: Construct IT Center of Excellence.
Bendell, T., Boulter, L. and Goodstadt, P., 1998. Benchmarking for Competitive
Advantage, 2nd
Ed. London: Pitman Publishing.
Betts, M. ed., 1999. Strategic Management of IT in Construction, Malden, MA:
Blackwell Science Ltd.
Bhattacharya, A.K., 2004. Role of Information Technology in Construction Industry,
Journal of the Institution of Permanent Way Engineers (India), 4(1), pp.22-26.
Bogan, C. and English, M.J., 1994. Benchmarking for Best Practices: Winning through
Innovative Adaptation, New York, NY: McGraw-Hill.
Bolaños, R. and Nenclares, A., 2005. Using Interpretive Structural Modeling in Strategic
Decision-making Groups, Management Decision, 43(6), pp.877-895.
Bollen, K.A., 1989. Structural Equations with Latent Variables, New York: John Wiley
& Sons.
Bourque, L.B. and Fielder, E.P., 1995. How to Conduct Self-Administered and Mail
Surveys, California: SAGE Publication, Inc.
Brandon, P. and Betts, M. ed., 1995. Integrated Construction Information, London: E &
F.N. Spon Ltd.
Brewer, G., Gajendran, T., McCann, J. and Chen, S. E, 2006. Creating a Benchmarking
Service to Measure ICT Uptake for the Australian Construction Industry, CRC CI
Report, Austraila. Available from: www.construction-innovation.info/ (cited in
Aug’2006).

__________________________________________________________________________________
Page 324
References
Brilakis, I. And Soibelman, L., 2005. Content-Based Search Engines for Construction
Image Databases, Automation in Construction, 14(4), pp.537-550.
Browne, M.W. and Cudeck, R., 1993. Alternative Ways of Assessing Model Fit. In:
Bollen, K.A. and Long, J.S. (Eds.), Testing Structural Equation Models, Newbury
Park, CA: SAGE Publications, pp. 136–162.
Browne, M.W. and Mels, G., 1994. RAMONA User’s Guide, Department of
Psychology, The Ohio State University, Columbus, OH.
Broyd, T., 1999. What Impact can IT Rrealistically have on Construction? Proceedings
of Berkeley-Stanford CE&M Workshop – Defining A Research Agenda, University
of Stanford and University of California, Stanford, Berkeley, USA.
Budget for an IT Strategy, 2000. UK: Construct IT for Business Report. Available from:
www.construct-it.org.uk (cited in Dec’2002)
Bunyan, N., Betts, M., Carter, C., Thorpe, T., Bowmor, B., Dixon, P., Ludlow, P.,
Blanch, T., Hague, J, Blundell, D. and Underwood, J., 2002. How to Achieve
Benefits from IT Projects, UK: Construct IT for Business. Available from:
www.construct-it.org.uk (cited in Dec’2002)
Byggeriets Evaluerings Center Report, 2002. (online information), Available from:
http://www.byggeevaluering.dk (cited on March 16, 2004).
Cabrera, A., Cabrera, E.F. and Barajas S., 2001. The Key Role of Organizational Culture
in a Multi-System View of Technology-Driven Change, International Journal of
Information Management, 21(3), pp. 245-261.
Camp, R.C., 1989a. Benchmarking: The Search for Best Practices that Lead to Superior
Performance. Part III. Why benchmark?, Quality Progress, March, pp.76-82.
Camp, R.C., 1989b. Benchmarking: The Search for Industry Best Practices that Lead to
Superior Performance, Milwaukee, WI: ASQC Quality Press.
Camp, R. C., 1995. Business Process Benchmarking: Finding and Implementing Best
Practices, Wis.: ASQC Quality Press.
Carmines, E.G. and McIver, J., 1981. Analyzing Models with Unobserved Variables:
Analysis of Covariance Structures, In: Bohrnstedt, G. and Borgatta, E. (Eds.),
Social Measurement: Current Issues, Beverly Hills, CA: SAGE Publications.
Carmines, E.G. and Zeller, R.A., 1979. Reliability and Validity Assessment, Beverly
Hills, CA: Sage Publications.

__________________________________________________________________________________
Page 325
References
Carter, C., Hassan, T., Merz, M. and White, E., 2001. The Elegal Project: Specifying
Legal Terms of Contract in ICT Environment, ITcon, 6, pp.163-174.
Charnes, A., Cooper, W.W. and Rhodes, E., 1978. Measuring the Efficiency of Decision
Making Units, European Journal of Operations Research, 2, pp.429-44.
Chau, K.W., Anson, M. and Zhang, J.P., 2005. 4D Dynamic Construction Management
and Visualization Software: 1. Development, Automation in Construction, 14(4),
pp.512-524.
Cheng, E.W.L. and Li, H., 2004. Exploring Quantitative Methods for Project Location
Selection, Building and Environment, 39, pp.1467–76.
Chen, Y., 2003. A Non-radial Malmquist Productivity Index with An Illustrative
Application to Chinese Major Industries, International Journal of Production
Economics, 83, pp.27-35.
Chiang, Y.H., Cheng, E.W.L. and Tang, B.S., 2006. Examining Repercussions of
Consumptions and Inputs Placed on the Construction Sector by Use of I–O Tables
and DEA, Building and Environment, 41, pp.1-11.
Chiang, Y.H., Tang, B.S. and Leung, W.Y., 2001. Market Structure of the Construction
Industry in Hong Kong, Construction Management and Economics, 19(7), pp.675–
87.
Chinowsky, P.S. and Rojas, E.M., 2003. Virtual Teams: Guide to Successful
Implementation, Journal of Management in Engineering, 19(3), pp 98-106.
Chitkara, K.K., 2001. Construction Project Management, Planning Scheduling and
Controlling, India: Tata McGraw Hill Publishing Co. Ltd.
CII Benchmarking and Metrics Data Report, 2000. Construction Industry Institute (CII),
Tex.
Clark, A.M., Atkin, B.L., Betts, M.P. and Smith, D.A., 1999. Benchmarking the Use of
IT to Support Supplier Management in Construction, ITcon, 4, pp.1-16.
Cleland, D. I. and Ireland, L.R., 2002. Project Management: Strategic design and
implementation, New York: McGraw-Hill.
Constructing Excellence, 2004. (online information), Available from:
http://www.constructingexcellence.org.uk (cited on March 16, 2004).
Construct IT: Bridging the Gap, Report and Management Summary, 1995. (DOE
Report). London: HMSO.

__________________________________________________________________________________
Page 326
References
Cooper, W.W., Park, K.S. and Pastor, J.T., 1999. RAM: A Range Adjusted Measure of
Inefficiency for Use with Additive Models, and Relations to Other Models and
Measures in DEA, Journal of Productivity Analysis, 11, pp.5–42.
Cooper, W.W., Seiford, L.M. and Tone, K., 2000. Data Envelopment Analysis: A
Comprehensive Text with Models, Applications, References and DEA-Solver
Software, Boston, USA: Kluwer Academic Publishers.
Corporación de Desarrollo Tecnológico (CDT), 2002. National benchmarking System
for the Construction Industry. Report, 1st ed., CDT, Santiago, Chile (in Spanish).
Costa, D.B., Formoso, C.T., Kagioglou, M., Alarcon, L.F. and Caldas, C.H., 2006.
Benchmarking Initiatives in the Construction Industry: Lessons Learned and
Improvement Opportunities, Journal of Management in Engineering, 22(4),
pp.158-167.
Costa, D. B., Formoso, C. T., and Lima, H. M. R., 2004. Procedures for Performance
Measurement for Benchmarking in the Construction Industry: SISIND-NET
Project, UFRGS/PPGEC/NORIE, Porto Alegre, Brazil (in Portuguese).
Cox, J.R.W., Mann, L. and Samson, D., 1997. Benchmarking as a Mixed Metaphor:
Disentangling Assumptions of Competition and Collaboration, Journal of
Management Studies, 34(2), pp.285-314.
Creswell, J. W., 2003. Research Design: Qualitative, Quantitative, and Mixed Methods
Approaches, Thousand Oaks: California: Sage Publications, Inc.
Dainty, A.R.J., Briscoe, G.H. and Millett, S.J., 2001. New Perspectives on Construction
Supply Chain Integration, Supply Chain Management: An International Journal,
6(4), pp.163-173.
Dane, F.C., 1990. Research Method, Pacific Grove, California: Brooks/ Cole.
Davidson, C., 2001. Information and Knowledge Management for a Changing Building
Industry, Report on Third joint CIB W102-UICB meeting Melbourne, 26th
-27th
March 2001 and Auckland, 30th
March 2001, Available from: www.cibworld.nl (cited in 2003).
Data Envelopment Analysis (DEA) Notes, (online information) Available from:
http://people.brunel.ac.uk/~mastjjb/jeb/or/dea.html (cited in January 2007).
Datta, B., 2003. Select Studies in Service Quality Management: Conceptualisation,
Assessment and Modeling, Unpublished PhD Thesis, Indian Institute of
Technology, Delhi, New Delhi, India.

__________________________________________________________________________________
Page 327
References
Davenport T.H. and Short J.E., 1990. The New Industrial Engineering: Information
Technology and Business Process Redesign. Sloan Management Review, Summer.
Davis, G.B. and Olson, M.H., 1984. Management Information Systems: Conceptual
Foundations, Structure, and Development, 2nd
ed., Singapore: McGraw-Hill Book
Co.
Deng, Z. M., Li, H., Tam, C. M., Shen, Q. P. and Love, P. E. D., 2001. An application of
the Internet-based project management system, Automation in construction, 10(2),
pp.239-246.
Desai, V., 1999. Information Technology in Construction – The Barbour Report,
NICMAR Journal, 14(4), pp.347-353.
Developing a Vision of nD – Enabled Construction, 2003. Construct IT Initiative Report,
Salford: Construct IT Centre of Excellence.
Dhargalkar, U. and Joshi, R., 2003. ProMonitor: A Management Information System for
Monitoring Construction Projects, Proceedings of 6th
National Conference on
Construction: Global Challenges in Project Design and Construction
Management, New Delhi, India, November 2003, pp.98-107.
Dillman, D.A., 2000. Mail and Telephone Surveys: The Total Design Method, New
York: John Wiley & Sons, Inc.
Duff, A. R., 2000. Behavior Measurement for Continuous Improvement in Construction
Safety and Quality, The Management of Construction Safety and Health,
Rotterdam, The Netherlands: Balkema, pp.1–18.
Duggal, S.M., Gupta, M.P., Chakravorty, B.N. and Taneja, R., 2001. A Case Study of
Smart Card Usage in Driving License, Proceedings of International Conference of
Association of Computer Information Systems, Vancouver, October 4-6, pp.71-77.
Earl, M., Fenny, D., Lockett, M. and Runge, D., 1988. Competitive Advantage through
Information Technology, Eight Maxims for Senior Managers, Multinational
Business, Summer, pp.15-21.
Egbu, C., Gaskell, C. and Howes, J., 2001. The Role of Organizational Culture and
Motivation in the Effective Utilization of Information Technology for
Teamworking in Construction, In Akintoye, A. Ed. Proceedings of ARCOM 17th
Annual Conference, University of Salford, UK, September 2001, 1, pp.91-100.
Egbu, C., Gaskell, C. and Howes, J., 2002. The Improvement of Teamworking through
the Exploitation of IT: Lessons from the Construction, Manufacturing and Finance
Sectors, In Greenwood, D. Ed. Proceedings of ARCOM 18th
Annual Conference,
University of Northumbria, UK, September 2002, 2, pp.523-533.

__________________________________________________________________________________
Page 328
References
Fang, D.P., Huang, X.Y. and Hinze, J., 2004. Benchmarking Studies on Construction
Safety Management in China, Journal of Construction Engineering and
Management, 130(3), pp.424-432.
Farbey, B., Land, F. and Targett, D., 1999. The Moving Staircase: Problems of
Appraisal and Evaluation in a Turbulent Environment, Information Technology
and People, 12(3), pp.238– 252.
Farbey, B., Targett, D. and Land, F., 1995. Evaluating Business Information Systems:
Reflections On an Empirical Study, Information Systems Journal, 5, pp.235– 252.
Farrel, M.J., 1957. The Measurement of Productive Efficiency, Journal of Royal
Statistical Society (A), 120, pp.253-281.
Fellows, R. and Liu, A., 2003. Research Methods for Construction, 2nd
ed. Carlton,
Victoria: Black Well Science Ltd.
Finne, C., 2003. How the Internet is Changing the Role of Construction Information
Middlemen: The Case of Construction Information Services, ITcon, 8, pp.397-411.
Fischer, M. and Froese, T., 1996. Examples and Characteristics of Shared Project
Models, Journal of Computing In Civil Engineering, 10(3), pp.174-182.
Fisher, N. and Li Yin, S., 1992. Information Management in a Contractor, A Model of
the Flow of Project Data, London: Thomas Telford.
Fong, S.W., Cheng, E.W.L. and Ho, D.C.K., 1998. Benchmarking: A General Reading
for Management Practitioners, Management Decision, 36(6), pp.407-418.
Forza, C., 2002. Survey Research in Operations Management: a process based
perspective, International Journal of Operations and Production Management, 22,
pp.152-194.
Fowler, A. and Walsh, M., 1999. Conflicting Perceptions of Success in an Information
Systems Project, International Journal of Project Management, 7(1), pp.1-10.
Frey, J.H. and Oshi, S.M., 1995. How to Conduct Interviews by Telephone and in
Person, USA: SAGE Publications, Inc.
Froese, T., 1996. Models of Construction Process Information, Journal of Computing In
Civil Engineering, 10(3), pp.183-193.
Froese, T., 2002. Vera – Information Networking in the Construction Process, Final
Programme Evaluation Report, Tekes, Finland.

__________________________________________________________________________________
Page 329
References
Ganesan, S., Hall, H. and Chiang, Y.H., 1996. Construction in Hong Kong: Issues in
Labour Supply and Technology Transfer, Aldershot: Avebury.
Garvin, D. A., 1993. Building a Learning Organization, Harvard Business Review, July–
August, pp.78–91.
George, D. and Mallery, P., 1999. SPSS for Windows Step by Step: A Simple Guide and
Reference, Boston, MA: Allyn and Bacon.
Goodman, R.E. and Chinowsky, P.S., 2000. Taxonomy of Knowledge Requirements for
Construction Executives, Journal of Management in Engineering, 16(1), pp 80-89.
Green, F. B., 2001. Managing the Unmanageable: Integrating the Supply Chain With
New Developments in Software, Supply Chain Management: An International
Journal, 6(5), pp.208-211.
Gudykunst, W. B., 1991. Bridging Differences: Effective Intergroup Communication,
Newbury Park: Sage Publications.
Hair, J.F., Anderson, R.E., Tatham, R.L. and Black, W.C., 1995. Multivariate Data
Analysis, 4th
ed., Upper Saddle River, NJ: Prentice Hall.
Halpin, D.W. and Woodhead, R.W., 1987. Construction Management, New York:
Wiley.
Hamilton, M.R. and Gibson Jr., G.E., 1996. Benchmarking Preproject Planning Effort,
Journal of Management in Engineering, 12(2), pp.25-33.
Han, C. S., Kunz, J. C. and Law, K. H., 1998. Client/Server Framework for On-Line
Building Code Checking, Journal of Computing in Civil Engineering, 12(4),
pp.181-194.
Haniff, A.P. and Kaka, A.P., 2001. A framework for Development of a Knowledge
Database for Use Within the Construction Industry, In Akintoye, A. Ed.
Proceedings of ARCOM 17th
Annual Conference, University of Salford, UK,
September 2001, pp.189-198.
Hatcher, L., 1994. A Step-by-Step Approach to Using the SAS(R) System for Factor
Analysis and Structural Equation Modeling. Cary, NC: SAS Institute.
Haugan, G.T., 2002. Project Planning and Scheduling, Virginia, USA: Management
Concepts Inc.
Hawthorne, R.W. and Sage, A.P., 1975. On Applications of Interpretive Structural
Modeling to Higher Education Program Planning, Socio-Economic Planning
Sciences, 9(1), pp.31-43.

__________________________________________________________________________________
Page 330
References
Hegazy, T. and Ersahin, T., 2001. Simplified Spreadsheet Solutions I - Subcontractor
Information System, Journal of Construction Engineering and Management,
127(6), pp.461-468.
Hegazy, T., Zaneldin, E. and Grierson, D., 2001. Improving Design Coordination For
Building Projects. I: Information Model, Journal of Construction Engineering and
Management, 127(4), pp. 322-329.
Henderson, L., 2002. Paths to Collaboration, Architecture Week, 22nd
May, pp.T1.1-
T1.2, Available from: www.architectureweek.com (cited in Feb’2004)
Hinton, M., Francis, G., and Holloway, J., 2000. Best Practice Benchmarking in the UK,
Benchmark, 7(1), pp.52–61.
Howard, R., Kiviniemi, A. and Samuelson, O., 1998. Surveys of IT in the Construction
Industry and Experience of the IT Barometer in Scandinavia, ITcon, 3, pp.45-56.
How to Develop an Information Strategy Plan, 2000a. UK: Construct IT for Business
Report. Available from: www.construct-it.org.uk (cited in Dec’2002)
How to Get Started in e-Business, 2000b. UK: Construct IT for Business Report.
Available from: www.construct-it.org.uk (cited in Dec’2002)
How to Manage e-project Information, 2003. UK: Construct IT for Business Report.
Available from: www.construct-it.org.uk (cited in Dec’2003)
Hsueh, S.L., Perng, Y.H., Yan, M.R. and Lee, J.R., 2007. On-line Multi-criterion Risk
Assessment Model for Construction Joint Ventures in China, Automation in
Construction, 16(5), pp.607-619.
Hua, G.B., 2005. IT Barometer 2003: Survey of the Singapore Construction Industry and
a Comparison of Results, Itcon, 10, pp.1-13.
Huang, C., Fisher, N. and Broyd, T., 2002. Development of a Triangular TPC Model to
Support Adoption of Construction Integrated System, In Greenwood, D. Ed.
Proceedings of ARCOM 18th
Annual Conference, University of Northumbria, UK,
September 2002, 2, pp.427-438.
Huff, S.L., 1992. Reengineering the Business, Business Quarterly, 56(3), pp.38-42.
Huin, S.F., 2004. Managing Deployment of ERP Systems in SMEs using Multi-Agents,
International Journal of Project Management, 22, pp.511-517.
Hu, L. and Bentler, P.M., 1995. Evaluating Model Fit, In: Hoyle, R.H. (Ed.), Structural
Equation Modeling. Thousand Oaks, CA: SAGE Publications.

__________________________________________________________________________________
Page 331
References
Hussey, J. and Hussey, R., 1997. Business Research: A Practical Guide for
Undergraduate and Postgraduate Studies, London: Macmillan Press Ltd.
Information Technology in the Building and Construction Industry: Current Status and
Future Directions, 1998. (Fujitsu Center), A Report for the National Building and
Construction Committee Department of Industry, Science and Resources,
Australian Graduate School of Management and Building Research Center,
Faculty of the Built Environment, University of New South Wales.
Ingirige, B. and Sexton, M., 2007. Intranets in Large Construction Organizations:
Exploring Advancements, Capabilities and Barriers, ITcon, 12, pp.409-427.
Irani, Z. and Love, P.E.D., 2001. The Propagation of Technology Management
Taxonomies for Evaluating Information Systems, Journal of Management
Information Systems, 17(3), pp.161– 177.
Jaafari, A. and Manivong, K., 1998. Towards A Smart Project Management Information
System, International Journal of Project Management, 16(4), pp.249-265.
Jöreskog, K.G., 1969. A General Approach to Confirmatory Maximum Likelihood
Factor Analysis, Psychometrika, 34(2), pp.183–202.
Jöreskog, K.G., Sorborn, D., Du Toit, S. and Du Toit, M., 2000. LISEREL 8: New
Statistical Features, (2nd
print with revisions), Chicago: Scientific Software
International.
Kajewski, S. and Weippert, A., 2004. E-Tendering: Benefits, Challenges and
Recommendations for Practice. In Proceedings of CRC CI International
Conference: Clients Driving innovation, Surfers Paradise, Australia.
Kajewski, S., Weippert, A, Remmers, T. and McFallan, S., 2004. ICT in the Australian
Construction industry: Status, training and Perspectives, In Proceedings of CRC CI
International Conference: Clients Driving innovation, Surfers Paradise, Australia.
Kang, J.H., Anderson, S.D. and Clayton, M.J., 2007. Empirical Study on the Merit of
Web-based 4D Visualization in Collaborative Construction Planning and
Scheduling, Journal of Construction Engineering and Management, 133(6),
pp.447-461.
Kanungo, S. and Savla, A., 2005. Relating Information Technology investment and
organisational productivity: an empirical study, Journal of Advances in
Management Research, 2(1), pp.7-20.

__________________________________________________________________________________
Page 332
References
Katranuschkov, P., Scherer, R.J. and Turk, Z., 2001. Intelligent Services and Tools for
Concurrent Engineering – An Approach Towards the Next Generation of
Collaboration Platforms, ITcon, 6, pp.111-128.
Kerlinger, F., 1973. Foundations of Behavioral Research, New York: Holt Reinhardt
and Winston.
Kervin, J.B., 1992. Methods for Business Research, New York: Harper Collins.
Kimoto, K., Endo, K., Iwashita, S. and Fujiwara, M., 2005. The Application of PDA As
Mobile Computing System on Construction Management, Automation in
Construction, 14, pp.500-511.
Kishore, R., Harika, T.C., Anoosha, B.V. and Mahalaxmi, M.S., 2006. Potential Benefits
of Information Technology in Construction Industry, In Swarup, P.R. and Kumar,
B. Ed. Proceedings of the World Conference for Design and Construction,
INCITE/ITCSED 2006, New Delhi, India, November 2006, 4, pp.33-41.
Kiviniemi, A., 2001. Vera Report, Tekes, Finland, Available from
http://akseli.tekes.fi/Resource.phx/rapu/vera/en/index.htx (cited in Jan’2002).
Kline, B.R., 1998. Principles and Practice of Structural Equation Modeling, New York:
The Guilford Press.
Koh, I., Underwood, J., Shellbourn, M. and Abbott, C., 2002. How to Get Started in
Virtual Reality, UK: Construct IT for Business Report. Available from:
www.construct-it.org.uk (cited in Dec’2002)
Kothari, C. R., 2005. Research Methodology – Methods & Techniques, 2nd
Ed., New
Delhi: New Age International (P) Ltd.
Koulopoulos, T.M., 1995. Evolution of the Business Operating System, E-COMM, 1(1),
pp.45-47.
KPI Working Group. 2000. KPI Report for the Minister of Construction, Department of
the Environment, Transport and the Regions, Norwich.
Lacouture, D.C., Medaglia, A.L. and Skibniewski, M., 2007. Supply Chain Optimization
Tool for Purchasing Decisions in B2B Construction Marketplaces, Automation in
Construction, 16(5), pp.569-575.
Laufer, A. and Tenah, K.A., 1985. Introducing Management Information Systems in
Medium Sized Construction Companies, Project Management, 3(3), pp.169-176.
__________________________________________________________________________________
Page 333
References
Lee, S.H., Thomas, S.R. and Tucker, R.L., 2005. Web-Based Benchmarking System for
the Construction Industry, Journal of Construction Engineering and Management,
131(7), pp.790-798.
Leibfried, K.H.J. and McNair, C.J., 1994. Benchmarking: A Tool for Continuous
Improvement, London: HarperCollins.
Leuven, A.R. and Voordijk, H., 2001. Enterprise Resource Planning in Construction: An
Evaluation of Recent Implementations, In Akintoye, A. Ed. Proceedings of
ARCOM 17th
Annual Conference, University of Salford, UK, September 2001, 1,
pp.159-168.
Levin, R. I. and Rubin, D.S., 1994. Statistics for Management, New Jersey: Prentice
Hall.
Lewis J.C. and Naim, M.M., 1995. Benchmarking of Aftermarket Supply Chains,
Production Planning and Control, 6(3), pp.258-269.
Li, X., Shen, Q. and Xue, X., 2005.Application of DEA-Based Malmquist Productivity
Index Measure to the Construction Industry in China, Proceedings of Construction
Research Congress 2005, San Diego CA, April 5-7, 2005. Available from:
http://www.ascelibrary.org/ (cited in January 2007).
Liberatore, M.J., Pollack-Johnson, B. and Smith, C.A., 2001. Project Management In
Construction: Software Use And Research Directions, Journal of Construction
Engineering and Management, 127(2), pp.101-107.
Li, H., Cao, J., Lacouture, D.C. and Skibniewski, M., 2003a. A Framework for
Developing a Unified B2B e-trading Construction Marketplace, Automation in
Construction, 12(2), pp.201-211.
Li, H., Kong, C.W., Pang, Y.C., Shi, W.Z. and Yu, L., 2003b. Internet-based
Geographical Information Systems System for e-commerce Application in
Construction Material Procurement, Journal of Construction Engineering and
Management, 129(6), pp.689-697.
Li, H., Ma, Z., Shen, Q. and Kong, S., 2003c. Virtual Experiment of Innovative
Construction Operations, Automation in Construction, 12(5), pp.561-575.
Li, H., Chen, Z., Yong, L. and Kong, S.C.W., 2005. Application of Integrated GPS and
GIS Technology for Reducing Construction Waste and Improving Construction
Efficiency, Automation in Construction, 14(3), pp.323-331.
Line, L., 1997. Virtual Engineering Teams: Strategy and Implementation, ITcon, 2, pp.1-
16.

__________________________________________________________________________________
Page 334
References
Lin, K.U. and Soibelman, L., 2007. Knowledge Assisted Retreival of Online Product
Information in Architectural/Engineering/Construction, Journal of Construction
Engineering and Management, 133(11), pp.871-879.
Liston, K., Fischer, M. and Winograd, T., 2001. Focused Sharing of Information for
Multi-Disciplinary Decision Making by Project Teams, ITcon, 6, pp.69-82.
Love, P.E.D., Irani, Z., Li, H., Cheng, E.W.L. and Tse, R.Y.C., 2001. An Empirical
Analysis of the Barriers to Implementing E-Commerce in Small-Medium Sized
Construction Contractors in the State of Victoria, Australia, Construction
Innovation, 1, pp.31-41.
Love, P.E.D., Irani, Z. and Edwards, D.J., 2004. Industry-centric Benchmarking of
Information Technology Benefits, Costs and Risks for Small-to-Medium Sized
Enterprises in Construction, Automation in Construction, 13(4), pp.507-524.
Love, P.E.D. and Smith, J., 2003. Benchmarking, Benchaction, and Benchlearning:
Rework Mitigation in Projects, Journal of Management in Engineering, 19(4),
pp.147-159.
Lucas, J.H.C., Ginzberg, M.J. and Schultz, R.L., 1990. Information Systems
Implementation – Testing a Structural Model, USA: Ablex Publishing
Corporation.
Luiten, G.T.B. and Tolman, F.P., 1997. Automating Communication In Civil
Engineering, Journal of Construction Engineering and Management, 123(1),
pp.113-120.
Majumdar, S.K. and Gupta, M.P., 2001. E-Business Strategy of Car Industry: SAP-LAP
Analysis of Select Case Studies, Global Journal of Flexible Systems Management,
2(3), pp 13-16.
Mandal, A. and Deshmukh, S.G., 1994. Vendor Selection Using Interpretive Structural
Modeling (ISM), International Journal of Operations and Production
Management, 14(6), pp.52–59.
Manoochehri, G., 1999. Overcoming Obstacles to Developing Effective Performance
Measures, Work Study, 48(6), pp.223–229.
Marakas, G.M., 2003. Decision Support Systems in the 21st Century, 2
nd ed., Singapore:
Pearson Education (Singapore) Pte. Ltd.
Marsh, L. and Flanagan, R., 2000. Measuring the Costs and Benefits of Information
Technology in Construction, Journal of Engineering, Construction and
Architectural Management, 7(4): pp.423-435.

__________________________________________________________________________________
Page 335
References
McDonagh, N.H. 1995. Changing Patterns of Technology, In Brandon, P. and Betts, M.
ed. Integrated Construction Innovation. E & FN Spon.
McIntosh, G. and Sloan, B. 2001. The Potential Impact of Electronic Procurement and
Global Sourcing Within the UK Construction Industry, In Akintoye, A. Ed.
Proceedings of ARCOM 17th
Annual Conference, University of Salford, UK,
September 2001, 1, pp.232-240.
Mejie, H.S. and Punia, H.S., 2004. Strategy to Enhance the Standing of India’s
Construction Industry - Review of Strengths and Weaknesses of Existing Systems
and Technology, Proceedings of Construction Opportunities and Strategies for
Action With Focus on Asia Pacific, Middle East and African Regions, September
2004, 2, pp.1-10.
Meyer, S.M. and Collier, D.A., 2001. An Empirical Test of The Causal Relationships in
the Baldridge Health Care Pilot Criteria, Journal of Operations Management,
19(4), pp.403-426.
Milis, K. and Mercken, R., 2003. The Use of the Balanced Scorecard for the Evaluation
of Information and Communication Technology Projects, International Journal of
Project Management, 22, pp.87-97.
Mitropoulos, P., Tatum, C.B., 2000. Forces Driving Adoption of New Information
Technologies, Journal of Construction Engineering and Management, 126,
pp.340-348.
Mittelstaedt, R.E. Jr, 1992. Benchmarking: How to Learn From Best-in-Class Practices,
National Productivity Review, 11(3), pp.301-15.
Mohamed, S., 2002. Safety Climate in Construction Site Environments, Journal of
Construction Engineering and Management, 128(5), pp.375-384.
Mohamed, S., 2003. Performance in International Construction Joint Ventures:
Modeling Perspective, Journal of Construction Engineering and Management,
129(6), pp.619-626.
Mokhtar, A., Bedard, C. and Fazio, P., 1998. Information Model For Managing Design
Changes In a Collaborative Environment, Journal of Computing In Civil
Engineering, 12(2), pp. 82-92.
Molenaar, K., Washington, S., and Diekmann, J., 2000. Structural Equation Model of
Construction Contract Dispute Potential, Journal of Construction Engineering and
Management, 126(4), pp.268-277.

__________________________________________________________________________________
Page 336
References
Moore, G. A., 1991. Crossing the Chasm, New York: Harper Business. Reference
Available from: http://ist-socrates.berkeley.edu/~fmb/articles/index.html (cited in
Jan’2007).
Morehead, A., Steele, M., Alexander, M., Stephen, K. and Duffin, L., 1997. Changes at
Work: The 1995 Workplace Industrial Relations Survey, Melbourne, Australia:
Longman.
Mui, L.Y., Aziz, A.R.A., Ni, A.C., Yee, W.C. and Lay, W.S., 2002. A Survey of Internet
Usage in the Malaysian Construction Industry, ITcon, 7, pp.259-269.
Nachmias, D. and Nachmias, C., 1981. Research Methods in the Social Sciences, New
York: St. Martin’s Press Inc.
Nehru, R., 2001. E-Commerce in the Indian Construction Industry, NICMAR Journal,
16(1), pp.51-59.
Nielsen, Y. and Sayar, T., 2001. Web-based Information Flow Modeling in
Construction, In Akintoye, A. Ed. Proceedings of ARCOM 17th
Annual
Conference, University of Salford, UK, September 2001, 1, pp.219-229.
Nitithamyong, P. and Skibniewski, M.J., 2004. Web-based Construction Project
Management Systems: How to Make Them Successful?, Automation in
Construction, 3, pp.491-506.
Nitithamyong, P. and Skibniewski, M.J., 2006. Success/failure Factors and Performance
Measures of Web-based Construction Project Management Systems:
Professionals’ Viewpoint, Journal of Construction Engineering and Management,
132(1), pp. 80-87.
Nitithamyong, P. and Skibniewski, M.J., 2007. Key Success/Failure Factors and their
Impacts on System Performance of Web Based Project Management Systems in
Construction, ITcon, 12, pp.39-59.
Nunally, J.C., 1978. Psychometric Methods, (2nd
ed.), New York: McGraw Hill.
Nunnaly, J.C., 1978. Psychometric theory, (2nd
ed.), New York: McGraw-Hill.
Nuntasunti, S. and Bernold, L.E., 2006. Experimental Assessment of Wireless
Construction Technologies, Journal of Construction Engineering and
Management, 132(9), pp.1009-1018.
Oakland, J.S. and Sohal, A.S., 1996. Total Quality Management: Text with Cases, Asia
Pacific ed., Melbourne, Australia: Butterworth – Heinemann.

__________________________________________________________________________________
Page 337
References
O’Brien, W. J. and Fischer, M. A., 1993. Construction Supply Chain Management: A
Research Framework, Civil Comp 93: Information Technology for Civil and
Structural Engineers, pp.61-4.
O’Brien, W.J., 2000. Implementation Issues in Project Web Sites: A Practitioner’s
Viewpoint, Journal of Management in Engineering, May/June, pp.34-39.
O’Brien, W.J., Issa, R.R.A., Rinker, Sr., M.E., Hammer, J., Schmalz, M.S., Geunes, J.
and Bai, S.X., 2002. Seek: Accomplishing Enterprise Information Integration
Across Heterogeneous Sources, ITcon, 7, pp.101-124.
Opfer, N.D., 1997. Intranet Internet Applications for the Construction Industry, ASC
Proceedings of the 33rd
Annual Conference, University of Washington – Seattle,
Washington, 2-5 April 1997, pp.211-220.
Oppenheim, A.N., 1992. Questionnaire Design, Interviewing and Attitude Measurement.
New Ed. London: Printer Publishers.
Pandit, R. K. and Munshi, R. N., 1999. Information Concepts and Systems in
Construction Organizations, NICMAR Journal, 14(1), pp.40-47.
Peansupap, V. and Walker, D., 2005. Factors Affecting ICT diffusion: A Case Study of
Three Large Australian Construction Contractors, Engineering, Construction and
Architectural Management, 12(1), pp.21-37.
Pena-Mora, F. and Dwivedi, G.H., 2002. Multiple Device Collaborative and Real Time
Analysis System for Project Management in Civil Engineering, Journal of
Computing in Civil Engineering, 16(1), pp.23-38.
Pena-Mora, F. and Tanaka, S., 2002. Information Technology Planning Framework for
Japanese General Contractors, Journal of Management in Engineering, 18(3),
pp.138-149.
Pepper G. L., 1995. Communications in Organizations: A Cultural Approach, McGraw-
Hill Inc.
Peters, G., Evaluating Your Computer Investment Strategy, in: L. Willcocks (Ed.),
Information Management: The Evaluation of Information Systems Investments,
London: Chapman and Hall. 1994.
Platt, D.G., 1996. Building Process Models for Design Management, Journal of
Computing In Civil Engineering, 10(3), pp.194-203.
Porter, M.E. (1999). The Competitive Advantage of Nations, New York: The Free Press.
Porter, M. and Miller, M., 1985. Competitive Strategy, New York: The Free Press.

__________________________________________________________________________________
Page 338
References
Prahinski, C. and Benton, W.C., 2004. Supplier Evaluations: communication strategies
to improve supplier performance, Journal of Operations Management, 22(1),
pp.39-62.
Productivity and Quality with Information Management, 2000. (VERA Programme
Report). Finland: Tekes.
Purba, S., Sawh, D. and Shah, B., 1995. How To Manage a Successful Software Project
Methodologies Techniques Tools, Canada: John Wiley and Sons.
Ramanathan, R., 2003. An Introduction to Data Envelopment Analysis: A Tool for
Performance Measurement, New Delhi, India: Sage Publications India Pvt. Ltd.
Ramaraj, P., 1996. Flexibility with User Involvement in Planning for MIS Success: A
Study in Indian Context, unpublished thesis, IIT Delhi, New Delhi (India).
Ramirez, R. R., Alarcon, L.F.C. and Knights, P., 2004. Benchmarking System for
Evaluating Management Practices in the Construction Industry, Journal of
Management in Engineering, 20(3), pp.110-117.
Ranadive, M.S. and Gaikwad, A.A., 2006. Information Technology in the Indian
Construction Industry, In Swarup, P.R. and Kumar, B. Ed. Proceedings of the
World Conference for Design and Construction, INCITE/ITCSED 2006, New
Delhi, India, November 2006, 4, pp.22-32.
Ravi, V. and Shankar, R., 2005. Analysis of Interactions Among the Barriers of Reverse
Logistics, Technology forecasting and social change, 72, pp.1011-1029.
Rebolj. D. and Menzel, K., 2004. Mobile Computing In Construction, ITcon, 9, pp.281-
283.
Reinhardt, J., Garrett. Jr., J. and Akinci, B., 2005. Framework for Providing Customized
Data Representations for Effective and Efficient Interaction with Mobile
Computing Solutions on Construction Sites, Journal of Computing in Civil
Engineering, 19(2), pp.109-118.
Retik, A. and Langford, D., 2001. Computer Integrated Planning and Design for
Construction, London: Thomas Telford.
Rezgui, Y. and Cooper, G., 1998. A Proposed Open Infrastructure For Construction
Project Document Sharing, ITcon, 3, pp.11-25.
Rezgui, Y., Cooper, G. and Brandon, P., 1998. Information Management In A
Collaborative Multiactor Environment: The COMMIT Approach, Journal of
Computing In Civil Engineering, 12(3), pp.136-144.

__________________________________________________________________________________
Page 339
References
Ribeiro, F.L. and Lopes, J., 2002. An approach to E-Business in Construction, In
Greenwood, D. Ed. Proceedings of ARCOM 18th
Annual Conference, University of
Northumbria, UK, September 2002, 2, pp.475-484.
Rivard, H., 2000. A Survey on the Impact of Information Technology on the Canadian
Architecture, Engineering and Construction industry, ITcon, 5, pp.37-56.
Robeiro, F.L. and Love, P.E.D., 2003. Value Creation Through an E-Business Strategy:
Implication for SMEs in Construction, Construction Innovation, 3, pp.3-14.
Rogers, E.M., 1962. Diffusion of Innovations, New York: The Free Press. Reference
Available from:
http://www.ciadvertising.org/studies/student/98_fall/theory/hornor/paper1.html
(cited in Jan’2007).
Rogers, E.M., 1995. Diffusion of innovations, 4th ed., New York: The Free Press.
Reference Available from:
http://education.ed.pacificu.edu/bcis/workshop/index.html (cited in Jan’2007).
Root, D. and Thorpe, T., 2001. Refocusing Collaboration Technologies in the
Construction Supply Chain: Looking Beyond the Organization, In Akintoye, A.
Ed. Proceedings of ARCOM 17th
Annual Conference, University of Salford, UK,
September 2001, 1, pp.253-262.
Ruikar, K., Anumba, C.J. and Carrillo, P.M., 2005. End-user Perspectives on Use of
Project Extranets in Construction Organizations, Engineering, Construction and
Architectural Management, 12(3), pp.222-235.
Sahai, A., 2004. E-Collaboration in the Engineering Sector, Civil Engineering and
Construction Review, March, pp.38-42.
Santos, J.R.A., 1999. Cronbach's Alpha: A Tool for Assessing the Reliability of Scales,
Journal of Extension, 37(2), Available from: http://joe.org/joe/1999april/tt3.html
(cited in January 2007)
Saunders, M., Lewis, P. and Thornhill, A., 2000. Research Methods for Business
Students, 2nd
Ed., UK: Pearson Education Ltd.
Savioja, L., Mantere, M., Olli, I., Äyräväinen, S., Gröhn, M. and Iso-Aho, J., 2003.
Utilizing Virtual Environments In Construction Projects, ITcon, 8, pp.85-99.
Saxena, J.P. and Sushil, V.P., 1992. Scenario Building: A Critical Study of Energy
Conservation in the Indian Cement Industry, Technological Forecasting and Social
Change, 41, pp.121-146.

__________________________________________________________________________________
Page 340
References
Schaffer, R., 1992. Successful Change Programs Begin with Results, Harvard Business
Review, January/February, pp.80-90.
Schumaker, R.E. and Lomax, R.G., 1996. A Beginners Guide to Structural Equation
Modeling, Hillsdale, NJ: Erlbaum.
Scneider, W.E., 2000. Why Good Management Ideas Fail: The Neglected Power of
Organizational Culture, Strategy and Leadership, 28(1), pp.24-29.
Sekaran, U., 2000. Research Methods for Business: A Skill-Building Approach, Danvers,
MA: John Wiley and Sons, Inc.
Sekaran, U., 2003. Research Methods for Business: A Skill-Building Approach, 2nd
Ed.
Danvers, MA: John Wiley & Sons, Inc.
Serafeimedis, V. and Smithson, S., 2000. Information Systems Evaluation in Practice: A
Case Study of Organizational Change, Journal of Information Technology, 15,
pp.93-106.
Setzer, S. W., 1994. Forecast 94: Fast Computer Poised for Action, Engineering News
Rec., 232(5), pp.77.
Shank, J.K. and Govindarajan, X., 1992. Strategic Cost Analysis of Technological
Investments, Sloan Management Review, 34(1), pp.39-51.
Shearer, K. R., 1995. Networking On the Net, Engineering News Rec., 234(25), pp.5.
Siegel, S., 1956. Nonparametric Statistics for the Behavioral Sciences, Tokyo: McGraw-
Hill.
Singh, M.D., Shankar, R., Narain, R. and Agarwal, A., 2003. An Interpretive Structural
Modeling of Knowledge Management in Engineering Industries, Journal of
advances in Management Research, 1(1), pp.28-40.
Skibniewski, M.J. and Zhang, L., 2005. Economic Feasibility of Web-based Project
Management Solutions, International Journal of Construction Management,
pp.103-121.
Small and Medium Enterprise (SME) – Definitions, 2005. DTI Report (online)
http://www.dti.gov.uk/bbf/small-business/index.html (cited in March 2005).
Small and Medium Sized Enterprises: Definitions, 2005. University of Strathclyde
Library Services Report, (online) Available from: www.lib.strath.ac.uk/els.htm
(cited in March 2005).
SME Definition, 2005. Enterprise and Industry Report (online) Available from:
http://europa.eu/index_en.htm (cited in March 2005).

__________________________________________________________________________________
Page 341
References
Smit, D., Stewart, R., Wall, J. and Betts, M., 2005. Implementing Web-based
Collaboration Platforms in Construction: Evaluating the Eastlink Experience, In
Sidwell, A.C. Ed. Proceedings of Research Week International Conference,
Queensland University of Technology, Brisbane, Australia, 4-5 July 2005.
Smith, I., Hipkin, S., Underwood, J. and Abbott, C., 2001. How to Determine Project
Communications, UK: Construct IT for Business Report. Available from:
www.construct-it.org.uk (cited in Dec’2002)
Song, J., Haas, C.T. and Caldas, C.H., 2006. Tracking the Location of Materials on
Construction Job Sites, Journal of Construction Engineering and Management,
132(9), pp.911-918.
Spendolini, M. J., 1994. Benchmarking, São Paulo, Brazil: Makron Books do Brasil.
Sreepuram, P. and Rao, A.K., 2006. Build Organization Capabilities to Utilize IT, In
Swarup, P.R. and Kumar, B. Ed. Proceedings of the World Conference for Design
and Construction, INCITE/ITCSED 2006, New Delhi, India, November 2006, 4,
pp.72-80.
Srivastava, S.C. and Teo, T.S.H., 2006. Understanding, Assessing and Conducting
Interpretive Management Research, IIMB Management Review, 18(2), pp.195-208.
Steiger, J.H., 1990. Structural Model Evaluation and Modification: An interval
Estimation Approach, Multivariate Behavioral Research, 25(2), pp.173–180.
Stewart, R.A. and Mohamed, S., 2001. Utilizing the Balanced Scorecard for IT/IS
Performance Evaluation in Construction, Construction Innovation, 1, pp.147-163.
Stewart, R.A. and Mohamed, S., 2004. Evaluating Web-based Project Information
Management in Construction: Capturing the Long-term Value Creation Process,
Automation in Construction, 13, pp. 469-479.
Stewart, R. A., Smit, D. and Betts, M., 2005. Implementing Web-based Collaboration
Platforms in Construction: Evaluating the Lane Cove Tunnel (LCT) Experience,
Proceedings of International Conference on Construction Engineering and
Management, Seoul, Korea.
Structural Equation Modeling, NC State University (NCSU) reference material,
Available from: http://www2.chass.ncsu.edu (cited in July 2006).
Stumpf, A. L., Ganeshan, R., Chin, S. and Liu, L.Y., 1996. Object-Oriented Model For
Integrating Construction Product and Process Information, Journal of Computing
In Civil Engineering, 10(3), pp.204-212.

__________________________________________________________________________________
Page 342
References
Sturges, J. and Bates, M., 2001. Data Integration and Construction Contracting: Barriers
to Implementation, In Akintoye, A. Ed. Proceedings of ARCOM 17th
Annual
Conference, University of Salford, UK, September 2001, 1, pp.179-187.
Sushil, 2000. SAP-LAP Models of Inquiry, Management Decision, 38(5), pp.347-353.
Svidt, K. and Christiansson, P., 2006. Experiences From Implementation of ICT for
Resource Management in Small Construction Companies, In Swarup, P.R. and
Kumar, B. Ed. Proceedings of the World Conference for Design and Construction,
INCITE/ITCSED 2006, New Delhi, India, November 2006, 4, pp.285-296.
Tam, C.M., 1999. Use of the Internet to Enhance Construction Communication: Total
Information Transfer System, International Journal of Project Management, 17(2),
pp.107-111.
Tan, W., 2004. Practical Research Methods, 2nd ed., Singapore: Pearson Prentice Hall,
2004.
Tanyer, A.M., 2001. How to Align an IT Strategy to the Industry Vision, UK: Construct
I.T for Business. Available from: www.construct-it.org.uk (cited in Dec’2002)
Tayeh, A.E. and Gil, N., 2007. Using Digital Socialization to Support Geographically
Dispersed AEC Project Teams, Journal of Construction Engineering and
Management, 133(6), pp.462-473.
Thomas, S.R., Tucker, R.L. and Kelly, W.R., 1998. Critical Communications Variables,
Journal of Construction Engineering and Management, 124(1), pp.58-66.
Thorpe, D., 2003. Online Remote Construction Management Trials in Queensland
Department of Main Roads: A Participant’s Perspective, Construction Innovation,
3, pp.65-79.
Tone, K., 2005. Talking Past Each Other: The Impact of Cross-Cultural Communication
on Construction Project Management in Samoa, Unpublished PhD Thesis,
Queensland University of Technology, Brisbane, Australia.
Tuncer, B., Stouffs, R. and Sariyildiz, S., 2002. Document Decomposition by Content as
a Means for Structuring Building Project Information, Construction Innovation,
2(4), pp.229-248.
Vaid, K.N., 2000. IT and Construction Industry Professional – An Overview, Indian
Concrete Journal, December 2000, pp.685-691.
Van Oudenhoven, J. P., 2001. Do Organizations Reflect National Cultures? A 10-Nation
Study, International Journal of Intercultural Relations, 25, pp.89-107.

__________________________________________________________________________________
Page 343
References
Vaziri, H.K., 1992. Using Competitive Benchmarking to Set Goals, Quality Progress,
October, pp.81-5.
Villagarcia, S. and Cardoso, F., 1999. New Supply Chain Network in Brazil’s House
Construction Industry, Proceedings of IGLC-7, University of California, Berkeley,
CA, USA, 26-28 July 1999, pp.171-180.
Walker, D.H.T., Hampson, K. and Peters, R. 2002. Project Alliancing vs Project
Partnering: A Case Study of the Australian National Museum Project, Supply
Chain Management: An International Journal, 7(2), pp.83-91.
Wang, H.J., Zhang, J.P., Chau, K.W. and Anson, M., 2004. 4D Dynamic Management
for Construction Planning and Resource Utilization, Automation in Construction,
13, pp.575-589.
Ward, M., Thorpe, T., Price, A. and Wren, C., 2004. Implementation and Control of
Wireless Data Collection on Construction Sites, ITcon, 9, PP.297-311.
Warfield, J.W., 1974. Developing Interconnected Matrices in Structural Modeling, IEEE
Transcript on Systems, Men and Cybernetics, 4(1), pp.51−81.
Wass, V. J. and Wells, P., 1994. Research Methods in Action: An Introduction, in Wass,
V.J. and Wells, P.E. ed. Principles and Practice in Business and Management
Research, Aldershoft: Dartmouth, pp.1-34.
Watson, G., 1993. How Process Benchmarking Supports Corporate Strategy, Planning
Review, January/February, pp.12-5.
Watson, R.H., 1978. Interpretive Structural Modeling-A Useful Tool for Technology
Assessment?, Technological Forecasting And Social Change, 11, pp.165-185.
Weippert, A., Kajewski, S. and Tilley, P., 2002. Internet-Based Communication and
Information Systems on Remote Construction Projects – A Case Study Analysis,
In Rezgui, Y., Ingirige, B. and Aouad, G. Eds. Proceedings of European
Conference on Information and Communication Technology Advances and
Innovation in the Knowledge Society, University of Salford, UK, pp.35-43.
Weippert, A., Kajewski, S. and Tilley, P., 2003. The Implementation of Online
Information Technology (ICT) on Remote Construction Projects, Logistics
Information Management, 16(5), pp.327-340.
Weippert, A. and Kajewski, S., 2004. AEC Industry Culture: A Need for Change,
Proceedings of CIB World Building Congress 2004: Building for the Future,
Toronto, Canada.

__________________________________________________________________________________
Page 344
References
Wheaton, B., Muthen, D., Alwin, D. and Summers, G., 1977. Assessing Reliability and
Stability in Panel Models, In: Heise, D. (Ed.), Sociological Methodology, San
Francisco, CA: Jossey-Bass.
Wright, A. G., 1993. High-end, Networks Comes Down to Earth, Engineering New Rec.,
230(3), pp.26-27.
Yang, J., 1997. A Flexible Decision Support System for Performance Evaluation and
Strategic Planning for Construction Contractors, Proceedings of 4th Congress on
Computing in Civil Engineering, ASCE, Philadelphia, USA, pp.635-642.
Yang, J. and Lin, F., 1998. Bridging the Gap between Design and Planning: A
Knowledge-based Decision Support Approach, Proceedings of 2nd International
Conference on Construction Management, Singapore, pp.318-325.
Yang, J. and Peng, H., 2001. A Decision Support System for the Application of
Intelligent Building Technologies, International Journal of Renewable Energy, 22,
pp.67-77.
Yen, H.J.R. and Gwinner, K.P., 2003. Internet Retail Customer Loyalty: The Mediating
Role of Relational Benefits, International Journal of Service Industry
Management, 14(5), pp.483-500.
Yin, R., 1989. Case study research: Design and methods, Rev. ed., Beverly Hills, CA:
Sage Publishing.
Yu, J.H., Lee, H.S. and Kim, W., 2006. Evaluation Model for Information Systems
Benefits in Construction Management Processes, Journal of Construction
Engineering and Management, 132(10), pp.1114-1121.
Yun, Y.B., Nakayama, H. and Tanino, T., 2004. A Generalized Model for Data
Envelopment Analysis, European Journal of Operational Research, 157, pp.87-
105.
Zairi, M., 1996. Benchmarking for Best Practice – Continuous Learning through
Sustainable Innovation, Oxford, UK: Butterworth – Heinemann.
Zhu, J., 2002. Quantitative Models for Performance Evaluation and Benchmarking:
Data Envelopment Analysis with Spreadsheets, Boston: Kluwer Academic
Publishers.
Zhu, Y., Issa, R.R.A. and Cox, R.F., 2001. Web-Based Construction Document
Processing Via Malleable Frame, Journal of Computing In Civil Engineering,
15(3), pp.157-169.

__________________________________________________________________________________
Page 345
Appendix A: Questionnaire Survey
APPENDIX - A
QUESTIONNAIRE SURVEY
The questionnaire seeks to assess the extent of Information and communication technology
(ICT) adoption by construction organizations in the Indian construction industry for Building
Project Management and to assess their perceptions about benefits and barriers of effective
adoption of ICT and enablers that would lead to increased adoption of ICT in the Indian
construction industry. In the questionnaire office means head office of the organization.
The Questionnaire is divided into 4 Sections.
SECTION I: Organization Assessment
SECTION II: Tools Used for Generic Building Project Management Processes and
Communication Methods Adopted for these Processes
SECTION III: Industry Perceptions
SECTION IV: Respondent’s Profile
You are requested to give your response for all the sections. You are invited to add your
comments. Kindly let us know if you wish to receive a summary of the final results of the
survey. Individual responses would be kept confidential and only summaries would be
published.
SECTION I - ORGANIZATION ASSESSMENT
Kindly tick the correct answers and specify more information where required.
1. ASSESSMENT OF ORGANIZATION STRUCTURE AND SIZE
i. No. of office staff
0-15 16-30 31-45 46-60 more than 60
ii. No. of staff at project sites
0-15 15-30 31-45 46-60 more than 60
iii Turnover of the organization in Indian Rupees
Upto 2 crores 2 - 4 crores 4 – 6 crores 6 – 8 crores more then 8 crores
iv. Rate of increase of turnover in last 5 years
No increase 0-5% 5%-10% 10%-15% more then 15%
2. ASSESSMENT OF ORGANIZATION’S AREA OF EXPERTISE i. No. of building projects managed/executed as the main agency in last 5 years
0-5 6-10 11-15 16-20 more than 20
ii. No. of building projects managed/executed in last 5 years as sub-contractors/agency of
larger organizations
0-5 6-10 11-15 16-20 more than 20
iii. Executing majority of the projects as:
Architects �
Project Managers �
Contractors �
Sub-contractors �

__________________________________________________________________________________
Page 346
Appendix A: Questionnaire Survey
3. ASSESSMENT OF INTERACTION OF THE ORGANIZATION WITH
AGENCIES GEOGRAPHICALLY SEPARATED WITHIN INDIA AND
OVERSEAS i. No. of projects on which the organization has interacted with agencies geographically
separated within India - in last 5 years
0-5 6-10 11-15 16-20 more than 20
ii. No. of projects on which the organization has interacted with overseas agencies - in last
5 years
0 Upto 5 6-10 11-15 more than 15
4. ASSESSMENT OF ICT MATURITY OF THE STAFF AND THE
ORGANIZATION i. Percentage of office staff with access to computer
0 – 20% 20%-40% 40%-60% 60%-80% More than 80%
ii. Percentage of project site staff with access to computer
0 – 20% 20%-40% 40%-60% 60%-80% More than 80%
iii. Rate of increase of use of IT based communication in last 5 years
0 – 20% 20%-40% 40%-60% 60%-80% More than 80%
iv. Key software used in the office:
System software MS Office � Any other (specify) ______
Word Processing software MS Word � Any other (specify) ______
Spreadsheet software MS Excel � Any other (specify) ______
DBMS software MS Access � Any other (specify) ______
Adobe Acrobat Reader (pdf) (Yes/No)
v. IT infrastructure provided at site:
System software MS Office � Any other (specify) ______
Word Processing software MS Word � Any other (specify) ______
Spreadsheet software MS Excel � Any other (specify) ______
DBMS software MS Access � Any other (specify) ______
Adobe Acrobat Reader (pdf) (Yes/No)
Internet connection (Yes/No)
vi. All the computers within office are connected through LAN (Yes/No)
vii. Computers at project site offices are connected with computers at office through the
Intranet (Yes/No)
viii. Are there any capacity, functionality or performance issues which need to be addressed
for office computer systems? (Yes/No)
If Yes, specify ___________________________________________________
ix. Are there any capacity, functionality or performance issues which need to be addressed
for project site office computer systems? (Yes/No)
If Yes, specify ___________________________________________________
x. Most common means of communicating electronic information:
COMMUNICATION BETWEEN OFFICE AND SITE
Physical transfer of floppies/CDs etc. �
Combination of 1st and 3
rd option �
Via Internet/Intranet �
COMMUNICATION BETWEEN OFFICE AND OTHER AGENCIES
Physical transfer of floppies/CDs etc. �
Combination of 1st and 3
rd option �
Via Extranet/Internet �
xi. Centralized database in the organization (Yes/No)

__________________________________________________________________________________
Page 347
Appendix A: Questionnaire Survey
xii. System for keeping backup of electronic data
A separate hard disk
in the same computer
External hard
disk
CDs or other
storage disks
Combination of all
options
xiii. Have a communication management strategy within the organization (Yes/No)
xiv. Have a disaster recovery plan in case of failure or breakdown of IT infrastructure
(Yes/No)
If Yes, specify the plan:
_____________________________________________________________
xv. Extent of ICT adoption varies between different projects (Yes/No)
If Yes, it is mainly due to:
a. Variable ICT capability of associating project team organizations on projects
0 – 20% 20%-40% 40%-60% 60%-80% More than 80%
b. Variable requirement of client for use of ICT on projects
0 – 20% 20%-40% 40%-60% 60%-80% More than 80%
xvi Portable technology being utilized for project management
(mobile phone / mobile internet / Radio frequency identification device (RFID) for
material management)
xvii Project web sites are being utilized for project management (Yes/No)
5. MODE OF COMMUNICATION ADOPTED FOR GENERAL ADMINISTRATION (tick the correct option in each box)
Hard copy
documents
Intranet e-mail e-mail followed
by a phone call
Information
flow within the
organization
0-20%
20%-40%
40%-60%
60%-80%
80%-100%
Yes/No 0-20%
20%-40%
40%-60%
60%-80%
80%-100%
0-20%
20%-40%
40%-60%
60%-80%
80%-100%
Information
flow between
office and
project sites
0-20%
20%-40%
40%-60%
60%-80%
80%-100%
Yes/No 0-20%
20%-40%
40%-60%
60%-80%
80%-100%
0-20%
20%-40%
40%-60%
60%-80%
80%-100%
Inter
organization
Information
Flow
Hard copy
documents
Extranet e-mail e-mail followed
by a phone call
Between office
and clients
0-20%
20%-40%
40%-60%
60%-80%
80%-100%
Yes/No 0-20%
20%-40%
40%-60%
60%-80%
80%-100%
0-20%
20%-40%
40%-60%
60%-80%
80%-100%
Between office
and consultants
0-20%
20%-40%
40%-60%
60%-80%
80%-100%
Yes/No 0-20%
20%-40%
40%-60%
60%-80%
80%-100%
0-20%
20%-40%
40%-60%
60%-80%
80%-100%
Between office
and
contractors/mat
erial suppliers
0-20%
20%-40%
40%-60%
60%-80%
Yes/No

__________________________________________________________________________________
Page 348
Appendix A: Questionnaire Survey
and other
external
agencies
80%-100%
Between project
site office and
other agencies
0-20%
20%-40%
40%-60%
60%-80%
80%-100%
Yes/No 0-20%
20%-40%
40%-60%
60%-80%
80%-100%
0-20%
20%-40%
40%-60%
60%-80%
80%-100%
Personal
meetings
Teleconference Videoconference
Meetings between office
and site staff
0-20%
20%-40%
40%-60%
60%-80%
80%-100%
0
upto 25%
25%-50%
50%-75%
75%-100%
Yes/No
Meetings between office
and clients
0-20%
20%-40%
40%-60%
60%-80%
80%-100%
0
upto 25%
25%-50%
50%-75%
75%-100%
Yes/No
Meetings between office
and consultants
0-20%
20%-40%
40%-60%
60%-80%
80%-100%
0
upto 25%
25%-50%
50%-75%
75%-100%
Yes/No
Meetings between office
and contractors/material
suppliers and other
external agencies
0-20%
20%-40%
40%-60%
60%-80%
80%-100%
0
upto 25%
25%-50%
50%-75%
75%-100%
Yes/No
Joint meetings with clients,
consultants and other
agencies
0-20%
20%-40%
40%-60%
60%-80%
80%-100%
0
upto 25%
25%-50%
50%-75%
75%-100%
Yes/No
Hard copy
documents
Through
Internet
Accessing external
information for
reference
0-20%
20%-40%
40%-60%
60%-80%
80%-100%
0-20%
20%-40%
40%-60%
60%-80%
80%-100%

SE
CT
ION
II-
T
OO
LS
U
SE
D
FO
R
GE
NE
RIC
B
UIL
DIN
G
PR
OJE
CT
M
AN
AG
EM
EN
T
PR
OC
ES
SE
S
AN
D
CO
MM
UN
ICA
TIO
N M
ET
HO
DS
AD
OP
TE
D F
OR
TH
ES
E P
RO
CE
SS
ES
Th
e opti
on
s fo
r ea
ch p
roce
ss a
re g
iven
in
each
box.
For
the
pro
cess
es e
xec
ute
d i
n y
ou
r org
an
izati
on
, ti
ck o
ut
wh
ich
ever
is
appli
cable
.
Abbre
viati
on
s are
det
ail
ed
at
the
start
of
each
ta
ble
. W
her
ever
oth
er
opti
on
is
ch
ose
n,
ple
ase
sp
ecif
y.
For
each
%
of
tools
an
d
com
mu
nic
ati
on
pro
cess
use
d t
he
opti
on
may
be
tick
ed. A
sam
ple
is
done f
or
refe
rence.
SA
MP
LE
•
If ‘
Mas
ter
Tim
e sc
hed
ule
at
des
ign s
tage’
is
pre
par
ed i
n y
our
off
ice
clic
k o
n ‘
Yes
‘ i
n b
ox I
.
•
But
it i
s pre
par
ed o
nly
for
20%
-40%
pro
ject
s th
en c
lick
on ‘
20%
-40%
’ in
box I
.
•
0-2
0%
of
the
tim
e M
S P
roje
ct i
s use
d f
or
pre
par
atio
n, but
80%
-100%
tim
e it
is
pre
par
ed u
sing M
S E
xce
l. A
ccord
ingly
cli
ck i
n b
ox I
I.
•
Wit
hin
the
off
ice
this
sch
edule
is
pri
mar
ily c
om
munic
ated
thro
ugh e
-mai
l. C
lick
as
show
n i
n b
ox I
II.
•
Bet
wee
n o
ffic
e an
d s
ite
staf
f it
is
pri
mar
ily c
om
munic
ated
as
har
d c
opy. C
lick
as
show
n i
n b
ox I
V.
•
Bet
wee
n o
ffic
e an
d c
lien
ts 2
0%
-40%
tim
e it
is
com
mu
nic
ated
as
e-m
ail.
But,
60%
-80%
tim
e e-m
ail
and h
ard c
opy i
s se
nt.
Cli
ck a
s sh
ow
n
in b
ox V
.
•
Bet
wee
n o
ffic
e an
d c
ontr
acto
rs i
t is
pri
mar
ily c
om
munic
ated
as
har
d c
opy. C
lick
as
show
n i
n b
ox V
I.
Co
mm
un
ica
tio
n m
eth
od
s u
sed
fo
r th
e p
roce
ss
Pro
cess
es
Pre
pa
red
I
To
ol(
s) u
sed
fo
r th
e p
roce
ss
II
Wit
hin
th
e
off
ice
III
Bet
wee
n o
ffic
e
an
d s
ite
sta
ff
IV
Bet
wee
n O
ffic
e a
nd
Cli
ents
/Co
nsu
lta
nts
V
Bet
wee
n O
ffic
e a
nd
Co
nts
./m
at.
sup
pli
ers
an
d o
ther
ag
enci
es
VI
1.
Ma
ster
ti
me
sch
edu
le
at
des
ign
sta
ge
Yes
/No
If Y
es,
on h
ow
man
y p
rojs
.?
0-2
0%
√ √√√
2
0%
-40
%
40
%-6
0%
60
%-8
0%
80
%-1
00
%
√ √√√
0
-20
%
E
x/M
SP
/P3
/O
20
%-4
0%
E
x/M
SP
/P3
/O
40
%-6
0%
E
x/M
SP
/P3
/O
60
%-8
0%
E
x/M
SP
/P3
/O
√ √√√
80
%-1
00
% E
x/M
SP
/P3
/O
0-2
0%
H/e
20
%-4
0%
H
/e
40
%-6
0%
H
/e
60
%-8
0%
H
/e
√ √√√
80
%-1
00
% H
/e
0-2
0%
H/e
20
%-4
0%
H
/e
40
%-6
0%
H
/e
60
%-8
0%
H
/e
√ √√√
80
%-1
00
% H
/e
0-2
0%
H/e
+H
/e
√ √√√
20
%-4
0%
H
/e+
H/e
40
%-6
0%
H
/e+
H/e
√ √√√
6
0%
-80
%
H/e
+H
/e
80
%-1
00
% H
/e+
H/e
0-2
0%
H/e
+H
/e
20
%-4
0%
H
/e+
H/e
40
%-6
0%
H
/e+
H/e
60
%-8
0%
H
/e+
H/e
√ √√√
80
%-1
00
% H
/e+
H/e

TIM
E M
AN
AG
EM
EN
T
To
ols
use
d a
nd
ab
bre
via
tion
s: M
S W
ord
(W
), M
S E
xce
l (E
x),
MS
Pro
ject
(M
SP
), P
rim
avera
Pro
ject
Pla
nner
(P
3),
An
y o
ther
, sp
ecif
y (
O)
Co
mm
un
ica
tio
n m
eth
od
s u
sed a
nd
ab
bre
via
tio
ns:
Har
d c
op
y (
H),
e-m
ail
(e),
e-m
ail
and
hard
co
py (
e+H
)
Co
mm
un
ica
tio
n m
eth
od
s u
sed
fo
r th
e p
roce
ss
Pro
cess
es
Pre
pa
red
T
oo
l(s)
use
d f
or
the
pro
cess
Wit
hin
th
e
off
ice
Bet
wee
n o
ffic
e
an
d s
ite
sta
ff
Bet
wee
n
Off
ice
an
d
Cli
ents
/Co
nsu
lta
nt
s
Bet
wee
n
Off
ice
an
d
Co
nts
./m
at.
su
pp
lier
s
an
d o
ther
ag
enci
es
1.
Ma
ster
ti
me
sch
edu
le
at
des
ign
sta
ge
Yes
/No
If Y
es,
on h
ow
man
y p
rojs
.?
0-2
0%
20
%-4
0%
40
%-6
0%
60
%-8
0%
80
%-1
00
%
0-2
0%
Ex/M
SP
/P3
/O
20
%-4
0%
E
x/M
SP
/P3
/O
40
%-6
0%
E
x/M
SP
/P3
/O
60
%-8
0%
E
x/M
SP
/P3
/O
80
%-1
00
% E
x/M
SP
/P3
/O
0-2
0%
H/e
20
%-4
0%
H
/e
40
%-6
0%
H
/e
60
%-8
0%
H
/e
80
%-1
00
% H
/e
0
-20
%
H
/e+
H/e
20
%-4
0%
H
/e+
H/e
40
%-6
0%
H
/e+
H/e
60
%-8
0%
H
/e+
H/e
80
%-1
00
% H
/e+
H/e
2.
Det
ail
ed
tim
e
sch
edu
le
of
wo
rks
at
con
stru
ctio
n
sta
ge
Yes
/No
If Y
es,
on h
ow
man
y p
rojs
.?
0-2
0%
20
%-4
0%
40
%-6
0%
60
%-8
0%
80
%-1
00
%
0-2
0%
Ex/M
SP
/P3
/O
20
%-4
0%
E
x/M
SP
/P3
/O
40
%-6
0%
E
x/M
SP
/P3
/O
60
%-8
0%
E
x/M
SP
/P3
/O
80
%-1
00
% E
x/M
SP
/P3
/O
0-2
0%
H/e
20
%-4
0%
H
/e
40
%-6
0%
H
/e
60
%-8
0%
H
/e
80
%-1
00
% H
/e
0-2
0%
H/e
20
%-4
0%
H
/e
40
%-6
0%
H
/e
60
%-8
0%
H
/e
80
%-1
00
% H
/e
0-2
0%
H/e
+H
/e
20
%-4
0%
H
/e+
H/e
40
%-6
0%
H
/e+
H/e
60
%-8
0%
H
/e+
H/e
80
%-1
00
% H
/e+
H/e
0-2
0%
H/e
+H
/e
20
%-4
0%
H
/e+
H/e
40
%-6
0%
H
/e+
H/e
60
%-8
0%
H
/e+
H/e
80
%-1
00
% H
/e+
H/e
3.
Up
da
ted
con
stru
ctio
n
sta
ge
tim
e
sch
edu
les
Yes
/No
If Y
es,
on h
ow
man
y p
rojs
.?
0-2
0%
20
%-4
0%
40
%-6
0%
60
%-8
0%
80
%-1
00
%
0-2
0%
Ex/M
SP
/P3
/O
20
%-4
0%
E
x/M
SP
/P3
/O
40
%-6
0%
E
x/M
SP
/P3
/O
60
%-8
0%
E
x/M
SP
/P3
/O
80
%-1
00
% E
x/M
SP
/P3
/O
0-2
0%
H/e
20
%-4
0%
H
/e
40
%-6
0%
H
/e
60
%-8
0%
H
/e
80
%-1
00
% H
/e
0-2
0%
H/e
20
%-4
0%
H
/e
40
%-6
0%
H
/e
60
%-8
0%
H
/e
80
%-1
00
% H
/e
0-2
0%
H/e
+H
/e
20
%-4
0%
H
/e+
H/e
40
%-6
0%
H
/e+
H/e
60
%-8
0%
H
/e+
H/e
80
%-1
00
% H
/e+
H/e
0-2
0%
H/e
+H
/e
20
%-4
0%
H
/e+
H/e
40
%-6
0%
H
/e+
H/e
60
%-8
0%
H
/e+
H/e
80
%-1
00
% H
/e+
H/e

Co
mm
un
ica
tio
n m
eth
od
s u
sed
fo
r th
e p
roce
ss
Pro
cess
es
Pre
pa
red
T
oo
l(s)
u
sed
fo
r th
e
pro
cess
W
ith
in
the
off
ice
Bet
wee
n o
ffic
e
an
d s
ite
sta
ff
Bet
wee
n
Off
ice
an
d
Cli
ents
/Co
nsu
lta
nt
s
Bet
wee
n
Off
ice
an
d
Co
nts
./m
at.
su
pp
lier
s
an
d o
ther
ag
enci
es
4.
Pro
ject
per
form
an
ce
rep
ort
s fo
r ti
me
sch
edu
les
Yes
/No
If Y
es,
on h
ow
man
y p
rojs
.?
0-2
0%
20
%-4
0%
40
%-6
0%
60
%-8
0%
80
%-1
00
%
0-2
0%
Ex/M
SP
/P3
/O
20
%-4
0%
E
x/M
SP
/P3
/O
40
%-6
0%
E
x/M
SP
/P3
/O
60
%-8
0%
E
x/M
SP
/P3
/O
80
%-1
00
% E
x/M
SP
/P3
/O
0-2
0%
H/e
20
%-4
0%
H
/e
40
%-6
0%
H
/e
60
%-8
0%
H
/e
80
%-1
00
% H
/e
0-2
0%
H/e
20
%-4
0%
H
/e
40
%-6
0%
H
/e
60
%-8
0%
H
/e
80
%-1
00
% H
/e
0-2
0%
H/e
+H
/e
20
%-4
0%
H
/e+
H/e
40
%-6
0%
H
/e+
H/e
60
%-8
0%
H
/e+
H/e
80
%-1
00
% H
/e+
H/e
0-2
0%
H/e
+H
/e
20
%-4
0%
H
/e+
H/e
40
%-6
0%
H
/e+
H/e
60
%-8
0%
H
/e+
H/e
80
%-1
00
% H
/e+
H/e
5.
Va
ria
nce
an
aly
sis
rep
ort
s
for
tim
e
sch
edu
les
Yes
/No
If Y
es,
on h
ow
man
y p
rojs
.?
0-2
0%
20
%-4
0%
40
%-6
0%
60
%-8
0%
80
%-1
00
%
0-2
0%
Ex/M
SP
/P3
/O
20
%-4
0%
E
x/M
SP
/P3
/O
40
%-6
0%
E
x/M
SP
/P3
/O
60
%-8
0%
E
x/M
SP
/P3
/O
80
%-1
00
% E
x/M
SP
/P3
/O
0-2
0%
H/e
20
%-4
0%
H
/e
40
%-6
0%
H
/e
60
%-8
0%
H
/e
80
%-1
00
% H
/e
0-2
0%
H/e
20
%-4
0%
H
/e
40
%-6
0%
H
/e
60
%-8
0%
H
/e
80
%-1
00
% H
/e
0-2
0%
H/e
+H
/e
20
%-4
0%
H
/e+
H/e
40
%-6
0%
H
/e+
H/e
60
%-8
0%
H
/e+
H/e
80
%-1
00
% H
/e+
H/e
0-2
0%
H/e
+H
/e
20
%-4
0%
H
/e+
H/e
40
%-6
0%
H
/e+
H/e
60
%-8
0%
H
/e+
H/e
80
%-1
00
% H
/e+
H/e
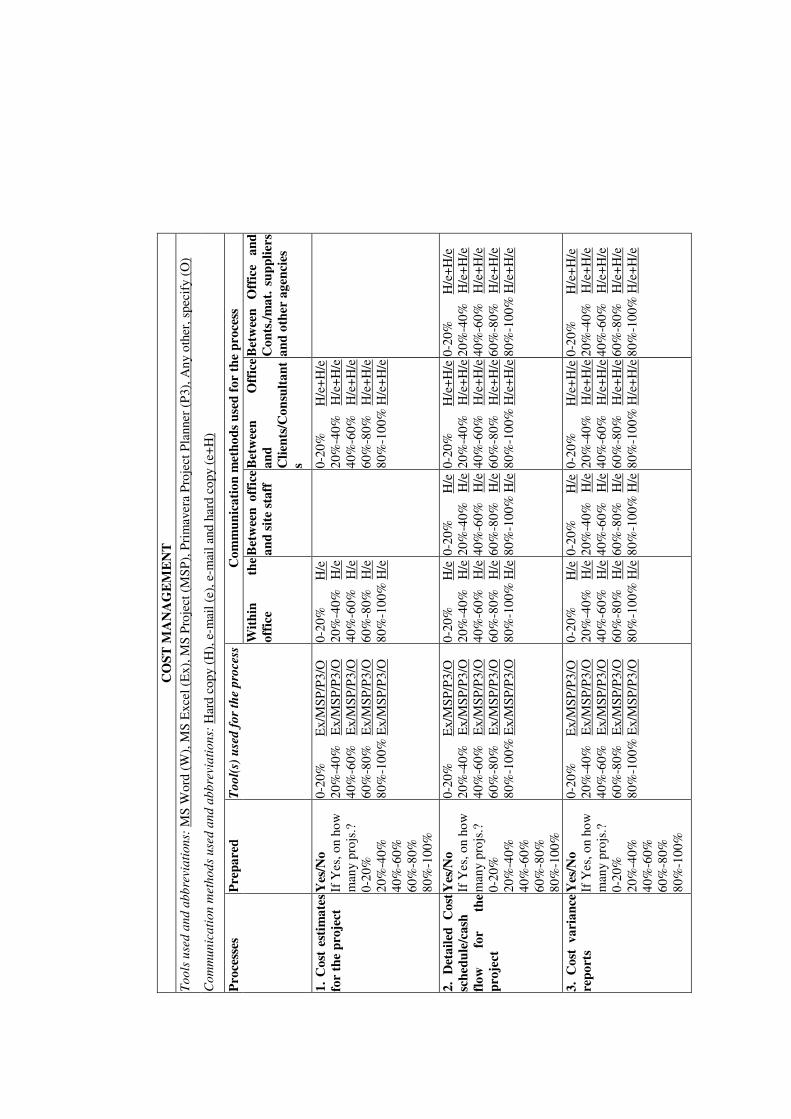
CO
ST
MA
NA
GE
ME
NT
To
ols
use
d a
nd
ab
bre
via
tion
s: M
S W
ord
(W
), M
S E
xce
l (E
x),
MS
Pro
ject
(M
SP
), P
rim
avera
Pro
ject
Pla
nner
(P
3),
An
y o
ther
, sp
ecif
y (
O)
Co
mm
un
ica
tio
n m
eth
od
s u
sed a
nd
ab
bre
via
tio
ns:
Har
d c
op
y (
H),
e-m
ail
(e),
e-m
ail
and
hard
co
py (
e+H
)
Co
mm
un
ica
tio
n m
eth
od
s u
sed
fo
r th
e p
roce
ss
Pro
cess
es
Pre
pa
red
T
oo
l(s)
use
d f
or
the
pro
cess
Wit
hin
th
e
off
ice
Bet
wee
n o
ffic
e
an
d s
ite
sta
ff
Bet
wee
n
Off
ice
an
d
Cli
ents
/Co
nsu
lta
nt
s
Bet
wee
n
Off
ice
an
d
Co
nts
./m
at.
su
pp
lier
s
an
d o
ther
ag
enci
es
1.
Co
st e
stim
ate
s
for
the
pro
ject
Yes
/No
If Y
es,
on h
ow
man
y p
rojs
.?
0-2
0%
20
%-4
0%
40
%-6
0%
60
%-8
0%
80
%-1
00
%
0-2
0%
Ex/M
SP
/P3
/O
20
%-4
0%
E
x/M
SP
/P3
/O
40
%-6
0%
E
x/M
SP
/P3
/O
60
%-8
0%
E
x/M
SP
/P3
/O
80
%-1
00
% E
x/M
SP
/P3
/O
0-2
0%
H/e
20
%-4
0%
H
/e
40
%-6
0%
H
/e
60
%-8
0%
H
/e
80
%-1
00
% H
/e
0
-20
%
H
/e+
H/e
20
%-4
0%
H
/e+
H/e
40
%-6
0%
H
/e+
H/e
60
%-8
0%
H
/e+
H/e
80
%-1
00
% H
/e+
H/e
2.
Det
ail
ed
Co
st
sch
edu
le/c
ash
flo
w
for
the
pro
ject
Yes
/No
If
Yes
, o
n h
ow
man
y p
rojs
.?
0-2
0%
20
%-4
0%
40
%-6
0%
60
%-8
0%
80
%-1
00
%
0-2
0%
Ex/M
SP
/P3
/O
20
%-4
0%
E
x/M
SP
/P3
/O
40
%-6
0%
E
x/M
SP
/P3
/O
60
%-8
0%
E
x/M
SP
/P3
/O
80
%-1
00
% E
x/M
SP
/P3
/O
0-2
0%
H/e
20
%-4
0%
H
/e
40
%-6
0%
H
/e
60
%-8
0%
H
/e
80
%-1
00
% H
/e
0-2
0%
H/e
20
%-4
0%
H
/e
40
%-6
0%
H
/e
60
%-8
0%
H
/e
80
%-1
00
% H
/e
0-2
0%
H/e
+H
/e
20
%-4
0%
H
/e+
H/e
40
%-6
0%
H
/e+
H/e
60
%-8
0%
H
/e+
H/e
80
%-1
00
% H
/e+
H/e
0-2
0%
H/e
+H
/e
20
%-4
0%
H
/e+
H/e
40
%-6
0%
H
/e+
H/e
60
%-8
0%
H
/e+
H/e
80
%-1
00
% H
/e+
H/e
3.
Co
st v
ari
an
ce
rep
ort
s
Yes
/No
If
Yes
, o
n h
ow
man
y p
rojs
.?
0-2
0%
20
%-4
0%
40
%-6
0%
60
%-8
0%
80
%-1
00
%
0-2
0%
Ex/M
SP
/P3
/O
20
%-4
0%
E
x/M
SP
/P3
/O
40
%-6
0%
E
x/M
SP
/P3
/O
60
%-8
0%
E
x/M
SP
/P3
/O
80
%-1
00
% E
x/M
SP
/P3
/O
0-2
0%
H/e
20
%-4
0%
H
/e
40
%-6
0%
H
/e
60
%-8
0%
H
/e
80
%-1
00
% H
/e
0-2
0%
H/e
20
%-4
0%
H
/e
40
%-6
0%
H
/e
60
%-8
0%
H
/e
80
%-1
00
% H
/e
0-2
0%
H/e
+H
/e
20
%-4
0%
H
/e+
H/e
40
%-6
0%
H
/e+
H/e
60
%-8
0%
H
/e+
H/e
80
%-1
00
% H
/e+
H/e
0-2
0%
H/e
+H
/e
20
%-4
0%
H
/e+
H/e
40
%-6
0%
H
/e+
H/e
60
%-8
0%
H
/e+
H/e
80
%-1
00
% H
/e+
H/e
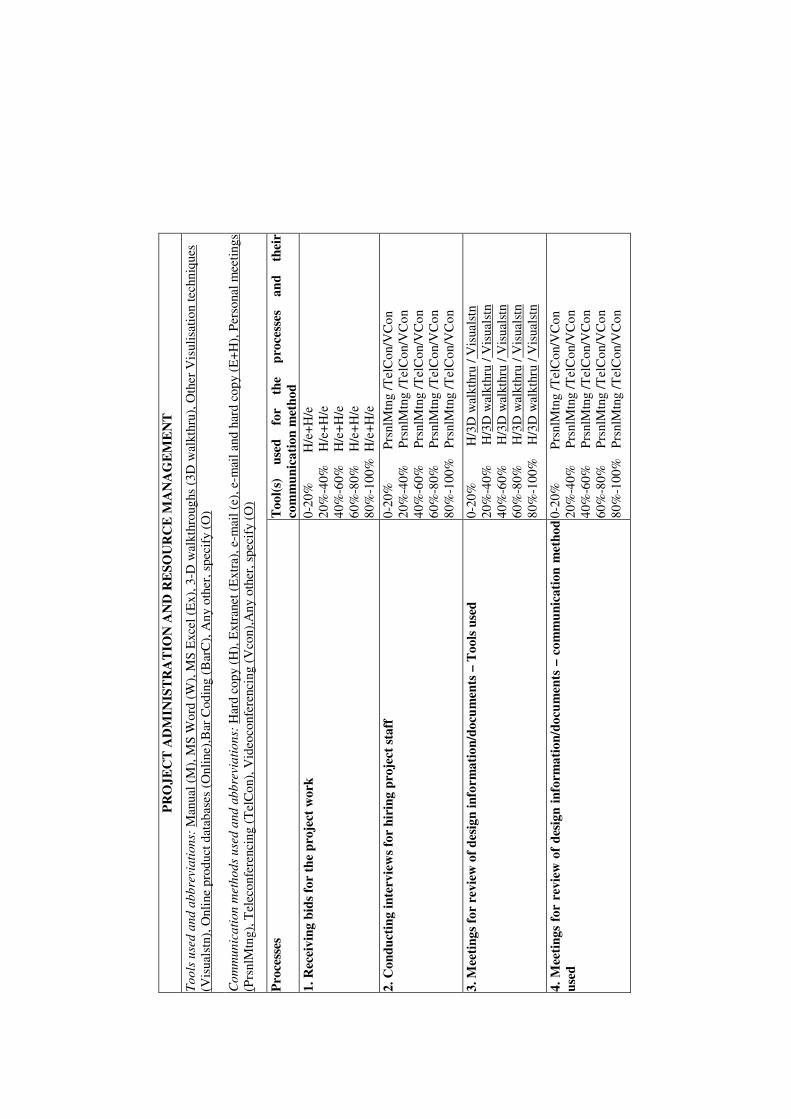
P
RO
JE
CT
AD
MIN
IST
RA
TIO
N A
ND
RE
SO
UR
CE
MA
NA
GE
ME
NT
To
ols
use
d a
nd
ab
bre
via
tion
s: M
anual
(M
), M
S W
ord
(W
), M
S E
xce
l (E
x),
3-D
wal
kth
roug
hs
(3D
wal
kth
ru),
Oth
er V
isuli
sati
on t
echn
iques
(Vis
ual
stn),
Onli
ne
pro
duct
dat
abas
es (
Onli
ne)
,Bar
Co
din
g (
Bar
C),
An
y o
ther
, sp
ecif
y (
O)
Co
mm
un
ica
tio
n m
eth
od
s u
sed a
nd
ab
bre
via
tio
ns:
Har
d c
op
y (
H),
Extr
anet
(E
xtr
a),
e-m
ail
(e),
e-m
ail
and
har
d c
op
y (
E+
H),
Per
sonal
mee
tin
gs
(Prs
nlM
tng),
Tel
eco
nfe
renci
ng (
Tel
Co
n),
Vid
eoco
nfe
renci
ng (
Vco
n),
An
y o
ther
, sp
ecif
y (
O)
Pro
cess
es
To
ol(
s)
use
d
for
the
pro
cess
es
an
d
thei
r
com
mu
nic
ati
on
met
ho
d
1.
Rec
eiv
ing
bid
s fo
r th
e p
roje
ct w
ork
0
-20
%
H
/e+
H/e
20
%-4
0%
H/e
+H
/e
40
%-6
0%
H/e
+H
/e
60
%-8
0%
H/e
+H
/e
80
%-1
00
%
H/e
+H
/e
2.
Co
nd
uct
ing
in
terv
iew
s fo
r h
irin
g p
roje
ct s
taff
0
-20
%
P
rsnlM
tng /
Tel
Co
n/V
Co
n
20
%-4
0%
Prs
nlM
tng /
Tel
Co
n/V
Co
n
40
%-6
0%
Prs
nlM
tng /
Tel
Co
n/V
Co
n
60
%-8
0%
Prs
nlM
tng /
Tel
Co
n/V
Co
n
80
%-1
00
%
Prs
nlM
tng /
Tel
Co
n/V
Co
n
3. M
eeti
ng
s fo
r re
vie
w o
f d
esig
n i
nfo
rm
ati
on
/do
cum
ents
– T
oo
ls u
sed
0
-20
%
H
/3D
wal
kth
ru /
Vis
uals
tn
20
%-4
0%
H
/3D
wal
kth
ru /
Vis
ual
stn
40
%-6
0%
H
/3D
wal
kth
ru /
Vis
ual
stn
60
%-8
0%
H
/3D
wal
kth
ru /
Vis
ual
stn
80
%-1
00
%
H
/3D
wal
kth
ru /
Vis
ual
stn
4.
Mee
tin
gs
for
rev
iew
of
des
ign
in
form
ati
on
/do
cum
ents
– c
om
mu
nic
ati
on
met
ho
d
use
d
0-2
0%
P
rsnlM
tng /
Tel
Co
n/V
Co
n
20
%-4
0%
Prs
nlM
tng /
Tel
Co
n/V
Co
n
40
%-6
0%
Prs
nlM
tng /
Tel
Co
n/V
Co
n
60
%-8
0%
Prs
nlM
tng /
Tel
Co
n/V
Co
n
80
%-1
00
%
Prs
nlM
tng /
Tel
Co
n/V
Co
n

5.
Des
ign
ch
an
ges
by
dif
fere
nt
con
sult
an
ts c
om
mu
nic
ate
d t
o c
on
sult
an
ts a
nd
cli
ents
0-2
0%
H
/e+
H/e
/ E
xtr
a
20
%-4
0%
H
/e+
H/e
/ E
xtr
a
40
%-6
0%
H
/e+
H/e
/ E
xtr
a
60
%-8
0%
H
/e+
H/e
/ E
xtr
a
80
%-1
00
%
H
/e+
H/e
/ E
xtr
a
6.
Bil
l O
f Q
ua
nti
ties
pre
pa
rati
on
0
-20
%
M
/W/E
x/O
20
%-4
0%
M
/W/E
x/O
40
%-6
0%
M
/W/E
x/O
60
%-8
0%
M
/W/E
x/O
80
%-1
00
%
M
/W/E
x/O
7.
Ten
der
pre
pa
rati
on
0
-20
%
M
/W/O
20
%-4
0%
M
/W/O
40
%-6
0%
M
/W/O
60
%-8
0%
M
/W/O
80
%-1
00
%
M
/W/O
8.
Co
mp
ara
tiv
e a
na
lysi
s o
f b
ids
rece
ived
0
-20
%
M
/W/E
x/O
20
%-4
0%
M
/W/E
x/O
40
%-6
0%
M
/W/E
x/O
60
%-8
0%
M
/W/E
x/O
80
%-1
00
%
M
/W/E
x/O
9.
Ten
der
mee
tin
gs
an
d n
ego
tia
tio
ns
0-2
0%
P
rsnlM
tng
/Tel
Co
n/V
Co
n
20
%-4
0%
Prs
nlM
tng /
Tel
Co
n/V
Co
n
40
%-6
0%
Prs
nlM
tng /
Tel
Co
n/V
Co
n
60
%-8
0%
Prs
nlM
tng /
Tel
Co
n/V
Co
n
80
%-1
00
%
Prs
nlM
tng /
Tel
Co
n/V
Co
n
10
. R
efer
rin
g i
nfo
rma
tio
n r
eg
ard
ing
ma
teri
als
0
-20
%
H
/Onli
ne
20
%-4
0%
H
/Onli
ne
40
%-6
0%
H
/Onli
ne
60
%-8
0%
H
/Onli
ne
80
%-1
00
%
H
/Onli
ne

11
. M
eeti
ng
s w
ith
ma
teri
al
sup
pli
ers
0
-20
%
P
rsnlM
tng
/Tel
Co
n/V
Co
n
20
%-4
0%
Prs
nlM
tng /
Tel
Co
n/V
Co
n
40
%-6
0%
Prs
nlM
tng /
Tel
Co
n/V
Co
n
60
%-8
0%
Prs
nlM
tng /
Tel
Co
n/V
Co
n
80
%-1
00
%
Prs
nlM
tng /
Tel
Co
n/V
Co
n
12
. P
urc
ha
se o
rder
s p
rep
ara
tio
n a
nd
ma
na
gem
en
t 0
-20
%
M
/W/E
x/O
20
%-4
0%
M
/W/E
x/O
40
%-6
0%
M
/W/E
x/O
60
%-8
0%
M
/W/E
x/O
80
%-1
00
%
M
/W/E
x/O
13
. M
ate
ria
ls m
an
ag
em
ent
reco
rds
ma
inta
ined
at
site
0
-20
%
M
/W/E
x/B
arc
20
%-4
0%
M
/W/E
x/B
arc
40
%-6
0%
M
/W/E
x/B
arc
60
%-8
0%
M
/W/E
x/B
arc
80
%-1
00
%
M
/W/E
x/B
arc
14
. M
an
po
wer
res
ou
rce
ma
na
gem
ent
reco
rds
ma
inta
ined
at
site
0
-20
%
M
/W/E
x/O
20
%-4
0%
M
/W/E
x/O
40
%-6
0%
M
/W/E
x/O
60
%-8
0%
M
/W/E
x/O
80
%-1
00
%
M
/W/E
x/O
15
. R
isk
ass
essm
ent
an
d m
an
ag
em
ent
Y
es/N
o
16
. M
ain
ten
an
ce m
an
ua
l p
rep
ara
tio
n
Yes
/No
17
. P
rep
ara
tio
n o
f a
s-b
uil
t d
raw
ing
s a
nd
do
cum
en
ts
Yes
/No

__________________________________________________________________________________
Page 356
Appendix A
COMMUNICATION MANAGEMENT
i. Assessment of processes executed at the start of the project
• Planning for the specified formats of reports to be generated throughout the project
execution (Yes/No)
• Planning for the periodicity at which reports are to be generated during project
execution (Yes/No)
• Planning for the periodicity at which meetings are to be held during project execution
(Yes/No)
ii. Method of information storage:
Method of storing the following at office (tick out whichever is applicable):
Documents H H+Elec Elec
Drawings/design details H H+Elec Elec
Time Schedules H H+Elec Elec
Cost Schedules H H+Elec Elec
Method of storing the following at project site offices
Documents H H+Elec Elec
Drawings/design details H H+Elec Elec
Time Schedules H H+Elec Elec
Cost Schedules H H+Elec Elec
Storage methods and abbreviations: Hard Copy (H), Hard copy as backup for electronic storage (H+Elec),
Electronic storage only (Elec)

__________________________________________________________________________________
Page 357
Appendix A
SECTION III - INDUSTRY PERCEPTIONS
From the list of identified barriers, benefits, enablers for effective adoption of ICT in the
Indian construction industry and the perceived industry drivers, tick which you feel are
applicable and allocate their importance at the scale of 1-5. 1 is not important and 5 is most
important.
1. BARRIERS FOR EFFECTIVE ADOPTION OF ICT
Specify any other barrier (if required) and rate its importance.
No
t Im
po
rta
nt
(1)
(2)
Mo
der
ate
ly
Imp
ort
an
t (3
)
(4)
Mo
st I
mp
ort
an
t (5
)
Technology Related Barriers
i. Non-dependability of IT Infrastructure
ii. Security of data
iii. Information overflow because of use of Internet as a
communication tool
iv. Lack of technical standards for communication
interface between different software
Projects Related Barriers
v. Uniqueness of each construction project
vi. Inadequate ICT support to construction sites
Organizations Related Barriers
vii. Initial cost of ICT infrastructure installation
viii. Cost of keeping up to date with the technological
developments in hardware/software
ix. Cost of training the staff for technological
developments in hardware/software or hiring new staff
for the updated technology
x. Uncertainty of benefit from use of IT based
communication
xi. Senior construction professionals unwilling to adopt
ICT
xii. High staff turnover in construction organizations
Industry Related Barriers
xiii. The separation of the process of design, construction
and operation and maintenance of buildings
xiv. Non-availability of critical mass of
organizations/projects in the industry that adopt ICT
xv. Fragmented construction industry having several
different organizations big and small, having different
set of requirements and different level of ICT
knowledge
xvi. The construction industry does not work on absolute
standards or is not dominated by one strong leader, as
is the case like IBM in computers or Ford in

__________________________________________________________________________________
Page 358
Appendix A
automobiles.
xvii. Lack of strategic direction within the industry in terms
of standards and protocols that would inform any ICT
investment decision
xviii. Poor supply-chain management of contractors, sub-
contractors, specialists and suppliers in the
construction projects
xix.
2. PERCEIVED BENEFITS OF IT BASED COMMUNICATION
Specify any other benefit (if required) and rate its importance.
No
t Im
po
rta
nt
(1)
(2)
Mo
der
ate
ly
Imp
ort
an
t (3
)
(4)
Mo
st I
mp
ort
an
t (5
)
Benefits related to measures of Project Success
i Project completion as per the estimated time
ii Project completion as per the estimated budget
iii Project completion as per the specifications
iv Life cycle concept becomes a competitive factor
v Project information obtained in real time
vi Richer information made available to managers
vii Less time spent in query and approval process
viii Effective change management
ix Reduced risk of errors and rework on projects
x Effective concurrent construction management
xi A complete log of all communications maintained for
tracking purposes
xii Effective material procurement and management
xiii Effective contract management
xiv “One-source” documentation archive maintained for
clients
xv Client satisfaction
xvi Reduced administrative costs of document handling
and distribution to multiple parties
xvii Project managers spend more time on managerial work
Benefits Related to Effective Team Management
xviii Effective collaboration and coordination between
project team members
xix Effective communication management between project
team members
xx Greater management control
xxi Effective joint decision making
xxii Motivation of the workforce
Benefits related to effective use of Technology
xxiii Increased information portability in the ICT
environment

__________________________________________________________________________________
Page 359
Appendix A
xxiv Reduced hard copy storage of documents/drawings
xxv Flow of accurate information
xxvi Ease of retrieval of information
xxvii Improved capability of the system to cross reference to
other correspondence
xxviii Multilocational availability of information
Benefits related to increased Organizational Efficiency
xxix Increase in overall organizational efficiency
xxx Better information assessment and management within
the organization
xxxi Useful information compiled and disseminated to other
projects
3. ENABLERS THAT WOULD INCREASE THE ADOPTION AND BENEFITS OF
IT BASED COMMUNICATION
Specify any other enabler (if required) and rate its importance.
No
t Im
po
rta
nt
(1)
(2)
Mo
der
ate
ly
Imp
ort
an
t (3
)
(4)
Mo
st I
mp
ort
an
t (5
)
Technology related enablers
i Better interface between PM/scheduling software and
software utilized for other processes
ii Adequate and dependable conditional access systems
to be provided for the automated system
iii Software to be more user friendly and flexible
iv Time and cost scheduling software with increased
capability for risk management
v Availability of more multilingual software and web
portals
vi Availability of indigenously developed software
incorporating the specific construction industry
requirements of the country
vii Development of data communication and exchange
standards
viii Use of standardized information classification systems
ix Flexible/scalable systems that would help in meeting
changing demands
x Standardized drawing formats for presentation and
content.
xi Increased use of 3D visualization techniques as a
communication tool
Projects related enablers
xii Project scope requiring use of ICT
xiii Information flow planned in standardized formats
xiv Periodicity and alternative methods of communication
for each process finalized at the start of the project

__________________________________________________________________________________
Page 360
Appendix A
xv Project information seamlessly transferred between all
the phases of a building project.
xvi Each project to have a champion for adoption of ICT
and acting as the team leader. It could be the Project
Manager/owner’s project representative
xvii Better collaborative maturity or trust between team
members for sharing information
xviii All project team members use the same IT systems for
the project
xix Use of common internet services by project team
members
xx Shared use of common databases by project team
members
xxi Improved IT support to construction site processes
xxii Development of interaction communication protocols,
information policies, and meeting structures for online
meetings
xxiii Subcontractors and suppliers to be integrated formally
into communication and reporting structures
Organizations related enablers
xxiv Organization structures to be reengineered for use of
ICT
xxv Systems for better communication between office and
project sites
xxvi Senior management should create an environment for
adoption of ICT within the organization
xxvii Equal attention to be given to associated managerial
issues while conducting technical implementation
xxviii IT communication systems developed within
organizations to be business driven
xxix Development of a realistic and reliable electronic
database in the organization
Industry related enablers
xxx Education of the users for effective use of ICT and its
Benefits
xxxi Education of the users that ICT does not increase
isolation but enhances team working
xxxii Widespread adoption of ICT in the construction
industry
xxxiii Industry data and information bases maintained by
professional bodies and government agencies
xxxiv ICT Training to be more accessible and less costly
xxxv Measuring benefits accrued by utilization of IT based
communication
xxxvi Collaboration between research and practice

__________________________________________________________________________________
Page 361
Appendix A
4. INDUSTRY DRIVERS FOR ADOPTION OF IT BASED COMMUNICATION
Specify any other industry driver (if required) and rate its importance.
No
t Im
po
rta
nt
(1)
(2)
Mo
der
ate
ly
Imp
ort
an
t (3
)
(4)
Mo
st I
mp
ort
an
t (5
)
i Increased involvement of multiple agencies in
construction projects
ii Increased involvement of geographically separated
agencies and information centers in a Project
iii Dynamic changes in information requirement during
project execution
iv Education of upcoming construction students towards
ICT
v Widespread availability of IT tools and technologies in
the country
vi Increased construction activity in the country
vii Increased competition with overseas construction
organizations executing projects in the Indian
construction industry
viii Increased requirement of adoption of ICT by larger
organizations when SMEs execute projects as
subcontracting agencies of larger organizations
ix Increased requirement of clients for more project
information resulting in increased use of ICT
SECTION IV - RESPONDENT’S PROFILE
To be filled up by the person filling up the questionnaire.
Please indicate your background of experience by providing the following information.
Your designation in the organization ______________________________
Your main area of experience:
Architecture �
Project Management �
Project site management �
General administration �
Your number of years in the construction industry ____________________
Your highest qualification_________________________________________
Your Comments__________________________________________________
THANK YOU FOR YOUR TIME AND EFFORT SPENT IN ANSWERING THIS
QUESTIONNAIRE!!!


__________________________________________________________________________________
Page 363
Appendix B: ISM Calculations
APPENDIX - B
INTERPRETIVE STRUCTURAL MODELING (ISM) CALCULATIONS
Tables showing results of iterations II to XI

__________________________________________________________________________________
Page 364
Appendix B: ISM Calculations

__________________________________________________________________________________
Page 365
Appendix B: ISM Calculations

__________________________________________________________________________________
Page 366
Appendix B: ISM Calculations

__________________________________________________________________________________
Page 367
Appendix C: SEM Analysis Data
APPENDIX - C
STRUCTURAL EQUATION MODELING (SEM) ANALYSIS DATA
Pearson Correlation between Indicator Variables
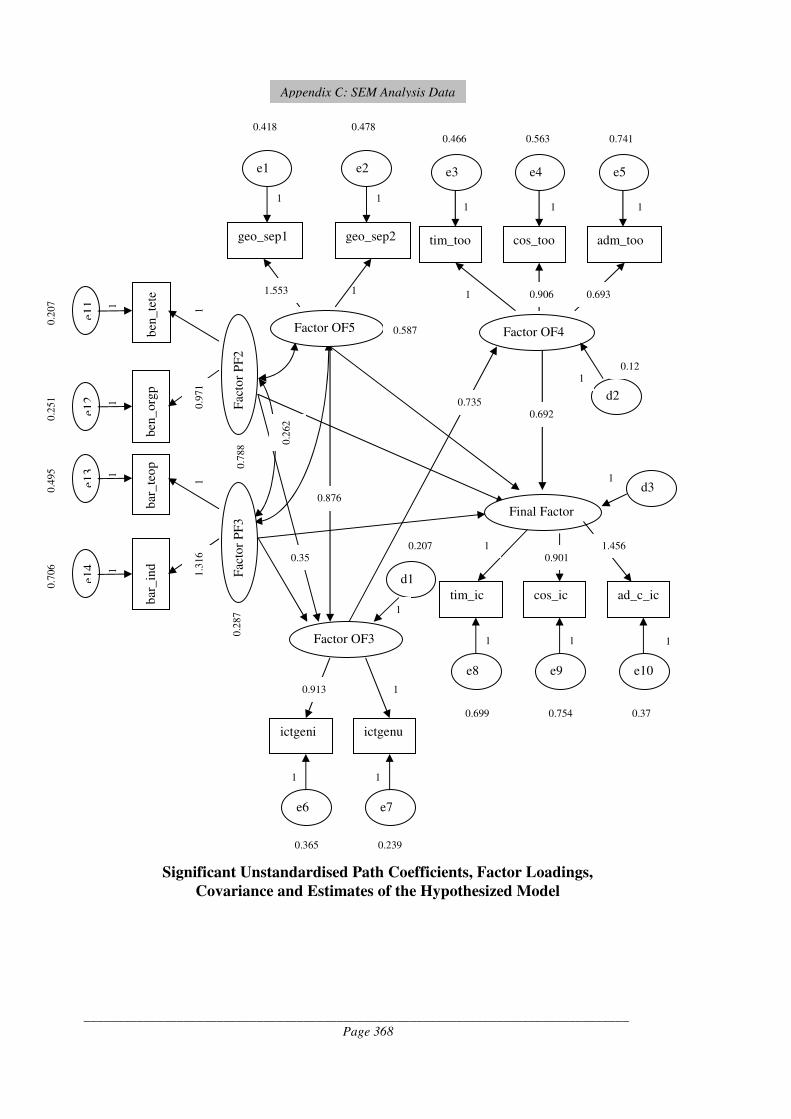
__________________________________________________________________________________
Page 368
Appendix C: SEM Analysis Data
Significant Unstandardised Path Coefficients, Factor Loadings,
Covariance and Estimates of the Hypothesized Model
0.35
0.876
0.735 0.692
0.2
62
Factor OF5
geo_sep1 geo_sep2
e1 e2
1 1
1 1.553
0.587
0.418 0.478
Factor OF4
d2
tim_too cos_too adm_too
e3 e4 e5
1 1 1
1
1
0.693 0.906
0.12
0.466 0.563 0.741
0.207
Factor OF3
ictgeni ictgenu
e7 e6
1 1
d1
1
1 0.913
0.365 0.239
Final Factor
tim_ic cos_ic ad_c_ic
e10 e9 e8
d3 1
1 1 1
1 0.901
1.456
0.699 0.754 0.37
Fac
tor
PF
3
bar
_te
op
b
ar_
ind
1
e13
1
e14
1
1.3
16
0.4
95
0.2
87
0.7
06
Fac
tor
PF
2
ben
_te
te
ben
_org
p
1
e11
1
e12
1
0.9
71
0.2
51
0
.207
0.7
88

__________________________________________________________________________________
Page 369
Appendix C: SEM Analysis Data
0.352
0.876
0.732 0.662
0.2
62
Factor OF5
geo_sep1 geo_sep2
e1 e2
1 1
1 1.549
0.589
0.422 0.477
Factor OF4
d2
tim_too cos_too adm_too
e3 e4 e5
1 1 1
1
1
0.69 0.908
0.125
0.462 0.558 0.741
0.208
Factor OF3
ictgeni ictgenu
e7 e6
1 1
d1
1
1 0.912
0.364 0.237
Final Factor
tim_ic cos_ic ad_c_ic
e10 e9 e8
d3 1
1 1 1
1 0.902
1.456
0.699 0.754 0.371
Fac
tor
PF
3
bar
_te
op
b
ar_
ind
1
e13
1
e14
1
1.3
15
0.4
97
0.2
87
0.7
06
Significant Unstandardised Path Coefficients, Factor Loadings,
Covariance and Estimates of the Modified Model – Step 1
Fac
tor
PF
2
ben
_te
te
ben
_org
p
1
e11
1
e12
1
0.9
69
0.2
52
0
.206
0.7
89

__________________________________________________________________________________
Page 370
Appendix C: SEM Analysis Data
0.294
0.854
0.731 0.677
0.2
47
Factor OF5
geo_sep1 geo_sep2
e1 e2
1 1
1 1.569
0.582
0.402 0.484
Factor OF4
d2
tim_too cos_too adm_too
e3 e4 e5
1 1 1
1
1
0.699 0.910
0.121
0.469 0.561 0.738
0.222
Factor OF3
ictgeni ictgenu
e7 e6
1 1
d1
1
1 0.917
0.359 0.24
Final Factor
tim_ic cos_ic ad_c_ic
e10 e9 e8
d3 1
1 1 1
1 0.912
1.477
0.705 0.753 0.364
Fac
tor
PF
3
bar
_te
op
b
ar_
ind
1
e13
1
e14
1
1.3
66
0.4
68
0.2
81
0.7
12
Significant Unstandardised Path Coefficients, Factor Loadings,
Covariance and Estimates of the Modified Model – Step 2
Fac
tor
PF
2
ben
_te
te
ben
_org
p
1
e11
1
e12
1
0.9
84
0.2
4
0.2
17
0.7
78

__________________________________________________________________________________
Page 371
Appendix C: SEM Analysis Data
0.304
0.865
0.727 0.633
Factor OF5
geo_sep1 geo_sep2
e1 e2
1 1
1 1.581
0.577
0.393 0.489
Factor OF4
d2
tim_too cos_too adm_too
e3 e4 e5
1 1 1
1
1
0.677 0.911
0.139
0.453 0.547 0.746
0.224
Factor OF3
ictgeni ictgenu
e7 e6
1 1
d1
1
1 0.911
0.361 0.233
Significant Unstandardised Path Coefficients, Factor Loadings,
Covariance and Estimates of the Modified Model – Step 3 (Final Model)
Fac
tor
PF
2
ben
_te
te
ben
_org
p
1.0
45
e11
1
e12
1
1
0.2
62
0
.195
0.7
32
Final Factor
tim_ic cos_ic ad_c_ic
e10 e9 e8
d3 1
1 1 1
1 0.90
1.482
0.703 0.759 0.357
0.073

__________________________________________________________________________________
Page 372
Appendix C: SEM Analysis Data
Grahical Representation of Standardized Residual
Covariances
-2
-1.5
-1
-0.5
0
0.5
1
1.5
2
2.5
1 5 9
13
17
21
25
29
33
37
41
45
49
53
57
61
65

__________________________________________________________________________________
Page 373
Appendix D: Benchmarking Framework
APPENDIX - D
BENCHMARKING FRAMEWORK
A framework for benchmarking use of ICT for building project management in the construction
industry is suggested. Measurement indicators (MIs) for the benchmarking framework are listed
below. Their performance measures are derived from the ‘Questionnaire survey’ analysis and
advanced literature review.
(MI1) Strategic use of ICT (7 performance measures)
MI1-1 Strategy is formulated for use of ICT within the organization (Yes/No)
MI1-2 Have a disaster recovery plan in case of breakdown of IT infrastructure
(Yes/No)
MI1-3 Planned timeframe for adopting Intranet for the organization
No plans Next 5-10 yrs Next 0-5 yrs/already
adopted
MI1-4 Planned timeframe for utilizing web sites for project management
No plans Next 5-10 yrs Next 0-5 yrs
MI1-5 Planned timeframe for adopting videoconferencing for meetings
No plans Next 5-10 yrs Next 0-5 yrs
MI1-6 Training is provided to staff for updated IT infrastructure and use of ICT
(Yes/No)
MI1-7 Organization has an in-house IT department or takes services of IT consultants
(Yes/No)
(MI2) Strategic Project Communication (4 performance measures) MI2-1 For majority of projects, planning is done for the specified formats of reports to be
generated throughout the project (Yes/No)
MI2-2 For majority of projects, planning is done for the periodicity at which reports are to
be generated during the project (Yes/No)
MI2-3 For majority of projects, planning is done for the periodicity at which meetings are
to be held during the project (Yes/No)
MI2-4 Project scope requires use of ICT by project team agencies (Yes/No)
(MI3) Measuring Benefits of use of ICT (7 performance measures) MI3-1 Measuring benefits of use of ICT (Yes/No)
If Yes
MI3-2 Measuring benefits related to measures of project success (Yes/No)
MI3-3 Measuring benefits related to effective team management (Yes/No)
MI3-4 Measuring benefits related to effective use of technology (Yes/No)
MI3-5 Measuring benefits related to increased organizational efficiency (Yes/No)
MI3-6 Quantitative measurement of benefits (Yes/No)
MI3-7 Subjective/Qualitative measurement of benefits (Yes/No)

__________________________________________________________________________________
Page 374
Appendix D: Benchmarking Framework
(MI4) ICT Infrastructure (15 performance measures)
MI4-1 Percentage of office staff with access to computers
0 – 45% 45%-90% More than 90%
MI4-2 Percentage of project site staff with access to computers
0 – 45% 45%-90% More than 90%
MI4-3 Project web sites being utilized for project management (Yes/No)
MI4-4 Centralized database in the organization (Yes/No)
MI4-5 Intranet facility in the organization (Yes/No)
MI4-6 Internet connection at project sites (Yes/No)
MI4-7 All the computers within office are connected through LAN (Yes/No)
MI4-8 MS Office software used in office for general administration works
(Yes/No)
MI4-9 Adobe acrobat reader provided at office (Yes/No)
MI4-10 MS Office software used at project sites for general administration works
(Yes/No)
MI4-11 Adobe acrobat reader provided at project sites (Yes/No)
MI4-12 Majority of electronic information is communicated between head office and project
sites as:
Physical transfer of
floppies/CDs etc
Combination of 1st
and 3rd
option
Via Internet/Intranet
MI4-13 Majority of electronic information is communicated between head office and other
agencies as:
Physical transfer of
floppies/CDs etc
Combination of 1st
and 3rd
option
Via Internet/Extranet
MI4-14 Basic method of keeping backup of electronic data
External/Internal hard
disk
CDs or other storage
disks
Combination of 1st and
2nd
option
MI4-15 Portable technology being utilized for project management
Mobile phone Mobile Internet Combination of 1st and 2
nd
option
(MI5) ICT for general administration (12 performance measures)
MI5-1 Majority of information flows within the head office as:
Hard copies e-mail and hard copy e-mail
MI5-2 Majority of information flows between head office and project sites as:
Hard copies e-mail and hard copy e-mail
MI5-3 Majority of information flows between head office and clients as:
Hard copies e-mail and hard copy e-mail
MI5-4 Majority of information flows between head office and consultants as:
Hard copies e-mail and hard copy e-mail
MI5-5 Majority of information flows between head office and contractors/material
suppliers and other external agencies as:
Hard copies e-mail and hard copy e-mail
MI5-6 Majority of information flows between project site office and other agencies as:
Hard copies e-mail and hard copy e-mail
MI5-7 Majority of meetings between head office and site staff are conducted as:
Personal meetings Teleconference Videoconferencing
MI5-8 Majority of meetings between head office and clients are conducted as:
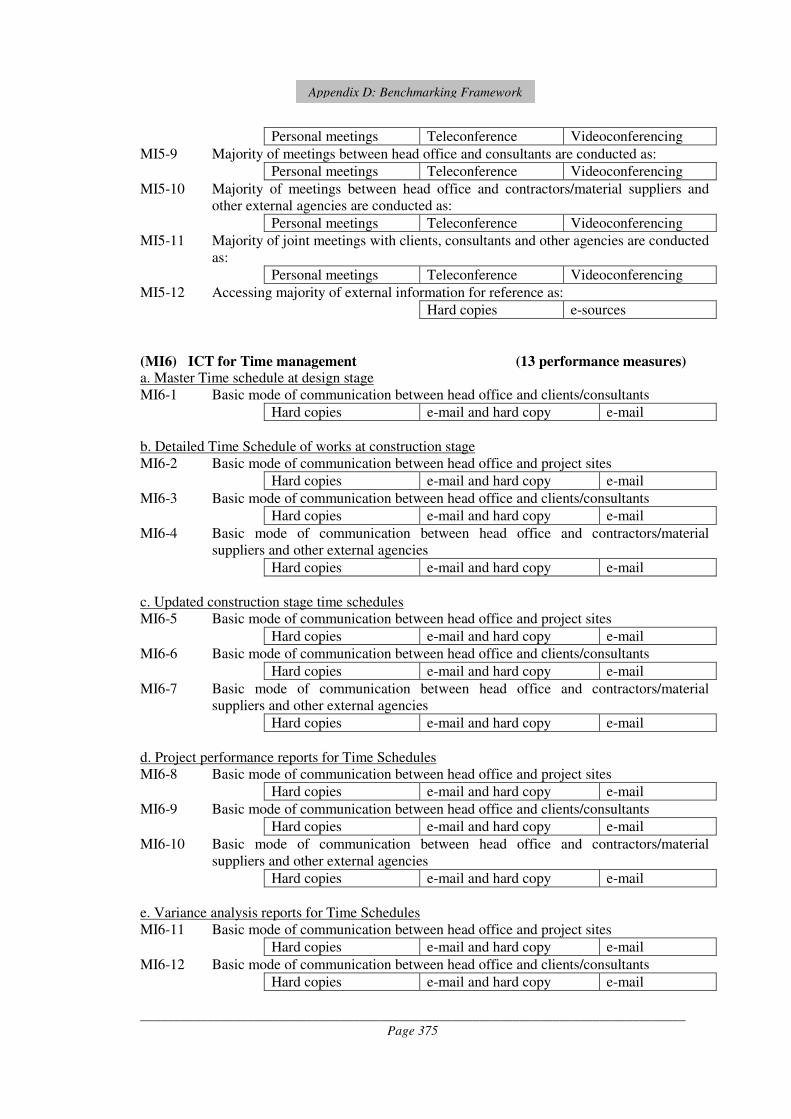
__________________________________________________________________________________
Page 375
Appendix D: Benchmarking Framework
Personal meetings Teleconference Videoconferencing
MI5-9 Majority of meetings between head office and consultants are conducted as:
Personal meetings Teleconference Videoconferencing
MI5-10 Majority of meetings between head office and contractors/material suppliers and
other external agencies are conducted as:
Personal meetings Teleconference Videoconferencing
MI5-11 Majority of joint meetings with clients, consultants and other agencies are conducted
as:
Personal meetings Teleconference Videoconferencing
MI5-12 Accessing majority of external information for reference as:
Hard copies e-sources
(MI6) ICT for Time management (13 performance measures) a. Master Time schedule at design stage
MI6-1 Basic mode of communication between head office and clients/consultants
Hard copies e-mail and hard copy e-mail
b. Detailed Time Schedule of works at construction stage
MI6-2 Basic mode of communication between head office and project sites
Hard copies e-mail and hard copy e-mail
MI6-3 Basic mode of communication between head office and clients/consultants
Hard copies e-mail and hard copy e-mail
MI6-4 Basic mode of communication between head office and contractors/material
suppliers and other external agencies
Hard copies e-mail and hard copy e-mail
c. Updated construction stage time schedules
MI6-5 Basic mode of communication between head office and project sites
Hard copies e-mail and hard copy e-mail
MI6-6 Basic mode of communication between head office and clients/consultants
Hard copies e-mail and hard copy e-mail
MI6-7 Basic mode of communication between head office and contractors/material
suppliers and other external agencies
Hard copies e-mail and hard copy e-mail
d. Project performance reports for Time Schedules
MI6-8 Basic mode of communication between head office and project sites
Hard copies e-mail and hard copy e-mail
MI6-9 Basic mode of communication between head office and clients/consultants
Hard copies e-mail and hard copy e-mail
MI6-10 Basic mode of communication between head office and contractors/material
suppliers and other external agencies
Hard copies e-mail and hard copy e-mail
e. Variance analysis reports for Time Schedules
MI6-11 Basic mode of communication between head office and project sites
Hard copies e-mail and hard copy e-mail
MI6-12 Basic mode of communication between head office and clients/consultants
Hard copies e-mail and hard copy e-mail

__________________________________________________________________________________
Page 376
Appendix D: Benchmarking Framework
MI6-13 Basic mode of communication between head office and contractors/material
suppliers and other external agencies
Hard copies e-mail and hard copy e-mail
(MI7) ICT for Cost management (6 performance measures)
a. Cost estimates for the project
MI7-1 Basic mode of communication between head office and clients/consultants
Hard copies e-mail and hard copy e-mail
b. Detailed Cost Schedule/cash flow requirement for the project
MI7-2 Basic mode of communication between head office and project sites
Hard copies e-mail and hard copy e-mail
MI7-3 Basic mode of communication between head office and clients/consultants
Hard copies e-mail and hard copy e-mail
MI7-4 Basic mode of communication between head office and contractors/material
suppliers and other external agencies
Hard copies e-mail and hard copy e-mail
c. Cost variance reports
MI7-5 Basic mode of communication between head office and project sites
Hard copies e-mail and hard copy e-mail
MI7-6 Basic mode of communication between head office and clients/consultants
Hard copies e-mail and hard copy e-mail
(MI8) ICT for Project administration and Resource Management
(11 performance measures)
MI8-1 Majority of the bids for the project work are received as:
Hard copies e-mail and hard copy e-mail
MI8-2 Majority of tender meetings and negotiations are conducted as:
Personal meetings Teleconference Videoconferencing
MI8-3 Majority of interviews for hiring project staff are conducted as:
Personal meetings Teleconference Videoconferencing
MI8-4 Majority of design review meetings are conducted as:
Personal meetings Teleconference Videoconferencing
MI8-5 Majority of design changes are communicated between clients, consultants and other
agencies as:
Hard copies e-mail and hard copy e-mail
MI8-6 Majority of information regarding materials is referred as:
Hard copies e-sources
MI8-7 Majority of meetings with material suppliers are conducted as:
Personal meetings Teleconference Videoconferencing
MI8-8 Majority of materials management records are prepared at site as:
Manual documents MS Word
documents
MS Excel or customized
software documents
MI8-9 Majority of manpower resource management records are prepared at site as:
Manual documents MS Word
documents
MS Excel or customized
software documents

__________________________________________________________________________________
Page 377
Appendix D: Benchmarking Framework
MI8-10 Method of storing documents at office for majority of the projects
Hard copies Hard copies and electronic copies Electronic
copies
MI8-11 Method of storing documents at majority of the project sites
Hard copies Hard copies and electronic copies Electronic copies
METHOD OF RATING
Following method of performance measurement was adopted:
• Wherever there were three options, rating level: 1-3 (from 1st option to last)
• Wherever there were two options, rating level: 1-2 (from 1st option to 2
nd)
• Wherever there is Yes/No option, rating level: 0-1 (0 for No)
Measurement indicators Rating range MI1: Strategic use of ICT 3-13
MI2: Strategic project communication 0-4
MI3: Measuring Benefits of use of ICT 0-7
MI4: ICT infrastructure 6-27
MI5: ICT for general administration 12-35
MI6: ICT for time management 13-39
MI7: ICT for cost management 6-18
MI8: ICT for project administration 11-32
RATING = 3 (MI1 + MI2 + MI3) + 2(MI4 + MI5) + MI6 +MI7 + MI8
= 3 (3-24) + 2 (18-62) + (30-89)
= (9-72) + (36-124) + (30-89)
= (75-285)
Divided into three equal ranges, organizations can be rated at following three levels:
Low rating: (75-144)
Middle rating: (145-215)
High rating: (216-285)
MEASUREMENT INDICATOR (MI) VALUES FOR THREE BENCHMARKED
ORGANIZATIONS
Measurement Indicator Values for Three Benchmarked Organizations
MI1 MI2 MI3 MI4 MI5 MI6 MI7 MI8
BO 12 3 4 22 20 26 12 18
PMCO 12 4 5 19 21 31 13 20
AO 8 3 5 18 17 26 9 17

__________________________________________________________________________________
Page 378
Appendix D: Benchmarking Framework
Rating Calculations of Three Benchmarked Organizations
Builders (BO)
Rating = 3(12+3+4) + 2(22+20) + 26+12+18
= 3(19) + 2(42) + 56
= 57 + 84 + 56
= 197 (Middle Rating)
Project Management Consultancy Organization (PMCO)
Rating = 3(12+4+5) + 2(19+21) + 31+13+20
= 3(21) + 2(40) + 64
= 63 + 80 + 64
= 207 (Middle Rating)
Architectural Organization (AO)
Rating = 3(8+3+5) + 2(18+17) + 26+9+17
= 3(16) + 2(35) + 52
= 48 + 70 + 52
= 170 (Middle Rating)

__________________________________________________________________________________
Page379
Appendix E: DEA Data
APPENDIX - E
DATA ENVELOPMENT ANALYSIS (DEA) DATA
Efficiency Scores for Analyzed Organizations
Potential Improvement Required in BO