it -41 restrictedc~l3 and international bank for...
TRANSCRIPT

It -41RESTRICTEDC~L3
XfX&3:^ 1tgl, ; Report No. TO-386a
This report was prepared for use within the Bank and ;tcs neffli;ntpi nrnnn,7ntiAn5*
They do not accept responsibility for its accuracy or completeness. The report rmaynot be publihked nor mrray it kequted a. rephesentnn their views.l
. ..- ,.-…..-
INTERNATIONAL BANK FOR RECONSTRUCTION AND DEVELOPMENT
INTERNATIONAL DEVELOPMENT ASSOCIATION
APPRAISAL OF THE
NABI..LJ L IP TV.CL A A LI L C .Li± rL'.'..JJ La. PCT
RASHEMITE KINGDOM OF JORDAN
SeDtember 12. 1963
Department of Technical Operations
Pub
lic D
iscl
osur
e A
utho
rized
Pub
lic D
iscl
osur
e A
utho
rized
Pub
lic D
iscl
osur
e A
utho
rized
Pub
lic D
iscl
osur
e A
utho
rized
Pub
lic D
iscl
osur
e A
utho
rized
Pub
lic D
iscl
osur
e A
utho
rized
Pub
lic D
iscl
osur
e A
utho
rized
Pub
lic D
iscl
osur
e A
utho
rized
Pub
lic D
iscl
osur
e A
utho
rized
Pub
lic D
iscl
osur
e A
utho
rized
Pub
lic D
iscl
osur
e A
utho
rized
Pub
lic D
iscl
osur
e A
utho
rized

CURRENCY EQUIVALENTS
U.S. $1.00 = JD'0.357JD 1. 00 = 1, 000 FilsTJT 1.00 nnT U. S. $
JD 1, 000, 000 = U.S. $2, 800, 000
Abbreviations
M3 cubic meter
Cu M mkm kilom.eter1 cu m = 264 U.S. Gallons100 Fils per cia m = U.S. $i.00/i,000 U.S. Gallons

APPPAT-&T. rlT-V TH.E
WAnT.Tq T WAPP iqTTPT)T.Y PPO.TErrP
THE ASHN.--TE K.--JOM OF JPTh-i--
TABLE OF' CONTENTS
SuMMAP.Y JD Cr)fTt'TT7QTCTQ * . . . e o * * e
T -rIT m0n1r-TTf'mTfMKTJ. U lV * * *UV ) " * * * e 1
III THE PF}3ESFNT WATER SYSTEM 6 - 28Present Fac:ilities 6 - 11Meters 12 -
Present Consumption 15 - 17Health Statistics 18 - 20Wat.er Rates 21 - 23AdirTnistration and Finance 24 - 28
IV. WATEl DEiAND 29 - 40Population Growth 29 - 34Future Consumption 35 - 40
V. THE 'PROJECT 41 - 62General Description 41 - 50Planning and Construction 51 - 53Project Management and Organization 54 - 57Project Cost Estimates 58 - 62
VI. FINANCING PLAN AND FINANCIAL PRtOJECTIONS 63 - 68Financing Plan 63 - 5Financial Projections 66 - 68
VII. JUSTIFICATION OF THE PROJECT S9 - 75
VIII. CONCLUSIONS AND RECOMMENDATIONS 76 - 80

1. Nablus iMunicipality Organization Chartb2. Hydrographs for Springs3. Seasonal Variation in Demand4h Health Statistics5. Financial Statements6. Income Statements - Pro Forma *- Nablus Water Department7. Estimated Future Municipal Population Growth & Water Demand89 Balata Refugee Camp Estimated Population Growth & Water Demand9. Balata Camp Estimated Water Production & Purchases
10. Anabta Well Field Punpage11. Nablus - Construction Schedule12. Invesltmrent Schedule13. Pro Forma Income Statements- Nab:Lus Water Supply Project14. Sources and Application of Funds15. Assumptions for Financial Project:ions
MAPS
1. Map if Jordan2. Nablus Water Distribution System3. Water Supply Project

APPR ATSAT. OF T14'.
NARTBLUS WATER .TTPPTY PROTPrF.T
1UE USHEEMI-TE KINTGDOM OF JORDN.a
I. SUI'l4ARY AND CDNCLUSIONS
Development Board, has requested a credit from the International Develop-rienrt Association to finance development of a new sour-ce of water ndimprovements to the existing water supply of Nqablus Municipality. The.LJA creU WU-wLU be reLenitL) UIIo IhVVU. U la'r Au1LLLwLIU.U±Iy >VWA)tJ UOrto er
with a local loan to cover the balance of project costs. The CWA wouldconstruct tlle project and then trans-er it to Nablus --Municipai-ty wit hthe obligation for loan repayment (paras. 1-5).
ii. At present, Nablus is supplied from five springs within themunicipal area. Water is adequate during most of the year, but in thesummer, when demand is greatest, the springs' yield is lowest and mustbe supplemented by truck transport* Two of three UNR-WA refugee campsin the vicinity are in a similar situation. Practically all connectionsare metered and consumption is around 30 liters per capita per day;unaccounted-for water is about 25 per cent. Seasonal variation in demandvaries from a summer high of 120 per cent of average to a winter low of80 per cent. Health statistics indicate an increasingly unsatisfactorysituation, present sources are liable to contamination. Water ratesbegin at 55 fils per cu m and go up to 80 fils per cu m; certain publicinstitutions receive special rates. The Water Department is a majormunicipal umit with 15 employees. Accounts are part of the general munic-
ipal system (paras. 6-28).
iii, Although information is conflicting, it appears that Nablus hada population of 43,000 in 1962, to which may be added 12,510 refugees in thetwo UNRWA camps to be served by the project, one of which is in the munic-ipal area.. For water demand forecastjs, a two per cent growth rate for themunicipality and the refugee camps has been assumed. It is estimated thatthe municipal per capita consumption will be 40 liters daily upon projectcompletion in 1965 and that the camp refugee consumption will be 15 liters;it is also estimated that the daily figures will increase annually by twoand one liLter respectively. Unaccounted-for water is estimated to decreaseto 20 per cent. The seasonal sumnmer water deficit would be made up bypumping from the new project source. the Anabta well field (paras. 29-1o0).
iv. The project consists of development of a new well field atAnabta, two pumping stations, a 17-kilometer transmission main to Nablus,a reservcoir, modifications and imnrovements to existing sources, andextensions to the present distributi.on system. The transmission line wouldhp pipe salvaged from an abandoned petroleum pipeline t.ransfPrrped to thpegovernment by the Iraq Petroleum Compriny. OWA would be responsible forthe construction of the project with the assistance ofaqualified englneer-ing consulting firm. International comrpetitive bidding procedures wotuld be

followed. Construction could begin in October 1963 and be finished by MarchL965 acnd would be supervised b-y a ceptable consulting firm. A strengthenedmunicipal Water Department, with separat-e accounts, would operate the systemandruwuld receive management assistance irom the CWA. Cor1lsrutVion costs,
including 18 per cent contingencies, are estimated at JD 439,000. The totalproject cost,. with provision for enginee-ring and management services, irntberestduring construction, and additions to worki.ng capital would total JD 536,90oo,or U.S $,500(,OOO, of wnich 53 per cent is estimated to be foreign currencycosts (paras.. 41-6 2),
v. An IDA credit of $1.0 million is proposed, which would cover two-thirds the total cost1 The proceeds of the credit would be made availableat 4 per cent interest, and for 23 y-ears, including a three-year graceperiod0 The other one-third would be covered by a 4 per cent local loanwith the unusually favorable conditi.ons of three years grace and 20 annualescalated capital repayments. An average water rate of 110 fils per cu mis required to finance the project; substantially higher than present ratesbut similar to raLes in otlier high cost water Eystems in Jordua. InitialLy,the rate of :return on investment wouLd 'be 2.2 per cent and would eventual:Lyincrease to *3,6 per cent by 1974/75. Operating ratios and debt coveragewould be satisfactory (paras. 63-68).
vie Nablus has a seasonal water shortage which is growing in durationand severity. Water consumption is low and health statistics indicate anunsatisfactory situation. The incremental cost of the new supply is veryhigh; ranging from 740 fils per cu m in. the first year after project com-pleticn to 210 fi''s in *the sixlth year. Cost of hauled water is about 320fils per cu m and project water would be cheaper than this only in thefourth year. Because of special consideration, the Jordanian Governmentgives a high priority, as evidenced by exceptionally favorable local loanconditions, to the project (Daras. 69-75).
vii. The project is technically sound and financially adenuate but theinitial costs are high from an economic point of view, due to the seasonaland limited dpimant. The Mumicipalitvi hins agreed to the necessary nnc.rParates and the prospective Borrower has agreed to provisions to insure properconstruction and ope!ration of the pronect.. The nroiect. therefore; canprovide a basis for an IDA credit of $-L,000,000 (paras. 76-80).

NART.IJS WATER SUPPLY PROJECT
I. INTRODUCTION'
1. The Hashemi.te Kingdom. of JordAn nActing +hrough the JordnnDevelopment Board, has requested a development credit from the Inter-n-ational' Deve:Lop-ment+ A.soitn -- C- hel -nnc +^e fxo--io 4of
a new source of water,, improvement to the facilities at the existingwaTle sorEs._A AAA_A -- A E -- $%A ; A U - 4>;1-- W- _wcWwr. OWuX.i<iX ClU. X U1I,1}UV-Vv1tUSlUXO cLLU CUt:: LtJCA1O. QUi W1UW t,Lt- LUt- l U T UL4;-
tion system for the Mumicipality of Nablus (see Map 1). An IDA credit~ ~'~JsJ~.J WLU.LU %~.;vvt-.L- d±0V l.F.JLVZ .Ut1.LU_Y tV'.JiLa .L 0 L± .0 kAlt; LAJuc".~L H J~'-'
cost. A local loan for the remainder would be made to Nablus by theAS-1- c4 _ T_ ro_rl -id -.0 agenc of Who:.-dan --vloraen' 'oards2ILU.E±kJCL. 1.0JIU £ UdU, cua l is sLd ME, u Uc±LJ. rJUJE±y aEl ,b D Usi±U
&. ±L1.L0 c;.P10L-L-L UcLeAU Ull U EQU.EA)V 6ULA[LL UUAeU LY VLIEI V.L-)L)±UWU.U
and prepared by a consulting firm, a fie:Ld visit carried out by membersof1 a l Le AssocicatJonts sta fL, inflorI,inatiOll ;iUirLL±LteL Uy WI LndIUpeULLt,UIb con-
sulting firm retained by the Association, and additional reports by anotherconsulting Firm retained by the Borrower to undertake further studies.
II. THE PROPOSED BOIRROWER
3, The Borrower would be the Hashemite Kingdom of Jordan, wihichwould relend the credi.t proceeds to the Central Water Authority on termsacceptable to the Association.
4. The project would be constructed by the Central Water Authority(CWA), an autonomous agency of the Borrowier with nation-wide authority inwater resource development and administration. Upon termination of theconstruction, the works would be turned over to Nablus Municipality foroperation, together with the corresponding financial obligations forrepayment of t;he loans.
5. Water supply in Nablus is now a municipal function supervisedby the mayer cad municipal council (see Annex 1)e No basic change is pro-posed, although the Water Department would be considerably strengthened.
III. THE PRESE;T WATER SYSTEM
Present Facilities
6. Nablus is now supplied by five springs, all located within themunicipal boundaries. Their flow varies directly with the timing andquantitv of rainfall. Annex 2 is a svnthetic hydrograph showing the seasonalvariation of their yield. Because of their location and the geological andtonogranhieal natiirp of the tpxrain. the springS Are silbject to Contamina-
tion. Chlorin.ation is the only treatment and it would be sufficient wereit tOnnq it-Dnt1v annp rti ndnr thpe qnrinsrq nrn+.prot-.te frnm qiirfqnp' rGon-tminatOnnD
which is not now the case.

7. There are four pumping stations wihich discharge to the distribu-tion system and/or to- -e'r' -^s. A ml pt of the water is distributer.
directly by gravity. The oldest equipment, with diesel primemovers, wasinstalled in :L95v; the newest, electricacily pUwered, was instclled ;. 1960
Q~~~rl m u - :- _1_ X XJ4 _ - _U 4 _ H _ -44 - _:s rss|1 we ±UI'.UtL d.L ' t, e.LgIil csLbUvarU IuVu LU C Ud Ub±-U c UUL, LUi % | u,y w . ws
a total capacity of 4,150 cu m and ranging in size from 150 cu m to ls500CU m.1 The8e an1d other elements Of' the system are sho-wn in Matp 2e
9. The town lies in a narrow valley between two hill masses. UrbaJdevelopment has been mostly up the sides of the hills so that the presentdistribution area ranges between elevations 490 m and 620 m above sea leve'icAs a consequence, the distribution syste!m is divided into two pressure zones.It has more than 40 kilometers of pipes from 2 inches to 12 inches in size.Approximately half of the pipes have been installed since 1955, the restdates back as far as 1933. There are no fire hydrants,
10. Water supply is insufficient in the summer, the season of great.estdemand and lcwest spring yield. Water is trucked into the city; the onlyavailable informatienr, of limited reli ability, reports as much as 230 cu ntdaily in 1960) at a cost to the municipality of 350 fils per cu m.
11 The refugee carnp in the municipal area, called Nablus No. 1, hasobtained its water from the municipal supply since January 1962. Two othercamps, Balata and Askar, just outside the town are jointly fed from twoother springs. Nablus No. 1 camp in the municipal area and nearby Balataare partially supplied by UNRWA trucks during the summer months, Askar camnphas an adequate source the year-round.
Meters
120 The following table classifies the water connections accordingto groups of users as of 31 December, 1.962 and shows estimated averagemonthly consumption based on the period from 1 March to 31 December, 1962.
TABLE 1
No. of Connections Consumption, Cu MClass Not Not
Metered Metered Total Metered Metered Total.
Dlomestie~ 4,3.14 )A0 4 j31 32120 2
Commercial 171 - 171 1,500 ° l5(o0IndustrIal 55 - 55 l5360 - 1,360oPublic or Governmenti 28 5 33 3,750 500 14,25,oExem pted Organ.izations on ......... '.03 4,70 if00 9,6'0 ;?Wholesale to Others - - - - 60 60
4,588 15 4,603 43,400 5s560 48,960

13. The meters are from 3/8 inch to 1 inch in nominal size. Theyare ofL G-era ,ar.4 ,d 44- Brtshm-A>;=r cost- <b1-+ JDT 1, eCh hiOJ. ~ '± U~.LIL~L Q JJ.L L.L .L0I.~L LIOLUO.JU AW44L%k u ~U- wiJ s4q.J-
average service life is ten years; maintenance is frequent. As is theCUSt .L i 3Lrd.L, IAsey t-e jJu.LLIchadsed b-y 1;U- user nd rm- nh;
property, and are repaired at his expense in private shops.
1i. House connections are of galvanized steel pipe. The customerpays for the muaterial arid th e Water DUpardt4entI taps the mainS, lay-s Ule
service piping to the meter, and installs the meter.
Present Consurption
15. The following table shows the total metered water for the yearsas noted, inc:luding the military camp, aad the daily per capita consumptionbased on the census population. Rough estimates of the unmetered quantities,such as are sIhown in Table 1, are available but, as they consist almostentirely of free water and amount to ten per cent of the total, they areincluded in the factor for free and lost water (see para. 16).
TABLE 2
Fiscal Year Metered Water Population Per CapitaEnding March 31 Cu M _ Daily Consumption
(iters)
1959/60 500,000 41,300 33.21960/61 443,000 42,100 28.81961/62 504,000 43,000 32.1
16. Lost water is estimated at 15 per cent of production. Unmeteredconsumption, almost all free, has been estimated at about 10 per cent ofproduction. Based on these figures unaccounted-for water would be about25 per cent of total production.
17. Because water demand is ereatest in the summer when the springst
yield is lowest and because the project supply will initially be limited tosupplying this summer deficiency, the seasonal variation in demand is im-portant. The consultants now employed by the Borrower have estimated arange of 60 per cent of the average dermnd for normal winter demand and a140 per cent for summer demand because of the Nablus climate. This rangemay be too great for the nresent stage of Nablus dAvelonm.r1t.. An Pstimateof monthly wELter production for three previous years shows a monthly rangeof 80 to 120 per cent (Annex 3)- Arbitr1arily nadjusting +he mimmor fiumresupwards to compensate for the limited sunmmer supply, a rough pattern may teHii.inarnnpi q.- fnIInur-q in nor'nn+.ano< ' of h nOnn+hlTir n-rornae- .Tinm..qn+Pmhnr-
120 per cent; March-May and October, 10) per cent; and November-February,80 per cent.
Heal Ui Stanti-stic-s
increasing in the Nablus District, of whlich the Nablus Municipality is apk'". There 4s no breakdoAr. to : e specific disease rat 4es 4i 4Ae 44i,-

itself, although it is believed that the situation is generally similarthroughout +1h(,e A;4 Strict+ Th er ii no breAdoq^m +nr to r'.y s ow s 'innIvariation in disease rates.
19. Comparative disease rates in (ifferent parts of the world areISSS'SY-SS ~S- J. < t. i4~ -L Wt V.L.L.L LJU WX UG .I t WALL ra± cOI G ; .S- v -
the Nablus area and point out the generally poor health situation there.Tihe . of pri-llwy -mpui_ iu-e -3 -w W± L,U- '
sanitation.
20. The five springs are all located within the city. Because ofthis location,, the lack of sewerage, Vne topography, and the limestonenature of the ground, the Nablus springs will always be exposed to thepossibility of contardinatien. Dependable operation of disinfection equip-ment will be required to insure safety of the water for drinking. Presentfacilities and chloriniation practices cannot insure such dependabilityoPresent water samplingJ procedures are too infrequent and do not providesufficient data to pernmit accurate evaluation of the actual condition ofthe springs from one season to the next. Chemical tests indicate that thewater is of satisfactory quality for domestic and normal industrial usewith chlorination.
Water Rates
21. The following monthly water rates are in effect:
Domestic Consumption:
1-:20 eu m 55 fils/cu m21-40 eu m 65 fils/cu mOver 41 cu m 80 fils/cu m
Industrial Consumption:
Flat rate of Lo fils/cu mi,Hospitals, public schools, charitable and religiousinstitutionas pay 30 fils/cu m,
22. The following special rates are in effect:
a. The Armv Camn is allowed a 140 per cent discountfrom the domestic rate.
h fovPernrn-ent departments are billed at the domesticrate.
G. Police qUarterS PaY )i( fils per eu m pin to 500 nu m.after lwhich the charge is 55 fils.
d. -MNunieinpl buildngs Are supplis;ed free=e. Public taps and unmetered customers are supplied free.

23. Other charges are as follows:
Connection fee:
1/2-inch service connection JD 2! -1- - - -1 - - - - -_ ___ Tn 0)/ 4±IIl a erVlUe LBcoLIUleiUioUIl UJ v
l-.Lnch service connection JD 4
Deposit fee:
Anticipated monthly bill less than 800 fils JD 2Anticipated monthly bill more than 800 fils JD 4Monthly meter rental (if supplied by Water
'Department) 40 f-ils
Administration and Finance
24. The Water Department is one of nine major organizational unitsof the municipality, as set forth in Annex 1. Its director is responsibleto the mayor. The Water Supply By-Laiws of 1947 give the council custodyand administration of the waterworks, including determination of waterrates and other charges with approval of the District Commissioner. TheBy-Laws, esta.blished pursuant to the Municipal Corporative Ordinance, 1934,appear adequate,
25. Wa.ter Department staff consists of a director, two supervisors,three clerks, seven meter-readers and bill collectors, three mechanics andtwo chlorinator officers. No formal training is required for any of thesepositions.
26. Pro forma financial statements for Nablus Municipality and itsWater Departmtent are shown in Annex 5 and Annex 6. The system has beenmaking a modest profit, although costs, particularly salaries and adminis-trative expenditures have been increasinig at a substantially greater ratethan revenue. The municipality has been able to finance municipal improve-ments with its own funds and development loans. From financial year 1959to financial year 1962, JD 16,000 was invested in the waterworks.
27. Accounting; services are provIded by the Municinal Accountancy.Separate accounts are kept for a number of the direct costs of thedepnartment; ot.hers nre combined with general mTninininl itpm.S_ No sepnratebalance sheets are kept for the Water Department, nor are its receivableskept sepanrnted from those of the m.fuinicirality aS a wholea
28e E>!gineerirga2ss1stance is giv.en by the mu.1nicipal engineer.Records of the system are fragmentary.
TU TJ WAITER nNMAND
Population Grmoth
29. Prior to 1948, Nablus had. some 25,000 inhabitants. As a result.J.L ULAC * CA_LU0UtlJ4Ie ±ViJL1;U, Jc t,e 1i iIIUC;e V.L C LIIUVtCU tiV WA,C C1L t:CdL.I J11-.LLU

of whom live in UNRWA camps and part in the city. Previous populationfigures are of little value, even when available, in proJecting fuVuregrowth rates.
30 There are a variety of confLicting estimates as to the presentplau~i±uUL U.. L1CU..LUO .ULi II .UIU ue Ot;%.V1tU UY _LUO WCLUZ.!. OUJAJkJ.L.Ye L.ipopulaio arNbu ,te<ea 4to '- s-Irdb t atrspl ;
principal difficulty seems to revolve around whether the refugee popula-tions in the 'uTJNR'wA cEmps are included or not, and how much tulese popula-tions might be.
31. A house to house census made in 1960 by former consultantsfor the Nablus water scheme, counted 48,897, exclusive of camp refugees,of whom they reported 15,734. The Mayor of Nablus said, in 1960, thatthere were 100,000 or more iz-A.biUtnts, excluding refugees. CWA reported45,658 for 1'362 plus 20,000 refugees.
32. The offic-ial national census in 1961 shows 45,773 for the munic-ipal area (including the in-town refugee camp), although the Nablus peopledispute this as too :low by far. There are no separate figures for the threerefugee camps in the area but UNRWA reports that there were 29,27 in thecamp, Nablus No. 1, inside the municipal area in December 1961 and 9,684in Balata camp and 3,519 in Askar camp outside the town limits, Askar havingan adequate year-round spring source.
33. Accepting the official 1961 census figures for Nablus Municipa2ityand the 1961 TJNRWA f:Lgures, the civilian population to be served (excludingthe in-town camp) was 42,960 and the refugee populations in the two campsto be served, Nablus Ne. 1 and Balata, were 12,510.
34. A two per cent growth rate for the refugee camps and NablusMunicipality has beenz assumed in the appraisal. This somewhat low figureis used because of the limited growth potential of the area; actually,available data indicate a past rate of less than one per cent.
Future Consumntion
35. It is assumed that the average demand in Nablus will have in-creased to 40 liters per capita per day by 31 March 1965, the beginning ofthe first fisnal year after nronict eoIpletion. This figure. which incluilpsall comiercial, industrial, and governmental uses as well as domestic demand,
a- ke-peated to. inrreaseo bh +.wn 1i+.=r.Q :nn-ainl,r nn ini+tial rateo of inrwranP:c.of five per cent. This rate will represent in part new consumers connectingon to the se.rvice -as- a !res-CJt of ar. ann +dequulate sulply -o n'.jatere
IA 4-~~~&'~S 4..Jb.. 1. C 4&Sj..U +IeAjJrJ J.. As ~ Oml Ut'lr
liters daily, based on UNRWA expexrience when adequate water is available fornormal ca.mp lin"in. An AJdi4+s %-1 '4 4-liter iS - added y parily-o com-
-1, _' ~ ~~~~~~~A. ~. .o~JA~.. ~ a. IdL~L.LJJ vS.'- .. f
pensate for the private connections in the camp which would be made oncerur,A tsn+ a. .n-,rn '1 1"I
_1 I Un a c own tved=f Por waterV. -Ls UV; e tormain atv bhe vxesmbs 2_5per cent rate until the first year after project completion, when it hasueern assdumed. Ltuo dUecrease one per centLU CLLLLnua_tLl1y tA)o a mILJUniImaOIL of 20 per centj.

-7-- 7 -
38. ALnnex 7 presents the total annual water requirements for Nablus-LAL-L;CipdL cll iSerege &lp nwe tIo-urn, whc s opetl revedru .I.Jd.CLJ- Uyl c.LLU Ui4t, Lt%-.L Ur=: LCUILjJ .LL1 I4i IAJ± WliIJAii -LO I.UlI)Lt .~ ke. A
by the municipal system. It is based on the population growth estimatesarnu whe conc ---u- pu±v ass~JuptiOns prev±uusly sussedo
39. -t is assii-ued that BaeJata Cmrp will have ±is ±Ladequate sprng;source supplemented by water purchased from Nablus. Annex 8 shows itsestimated populatiorl growth and water demand; calculated in the same mrwILeas in Annex 7. Annex 9 shows this camp's spring flow, on the basis oflixited data, and the deficit to be made up by purcnase from tne municipality.
The seasonal variation in demand is estimated to be the same as discussed inparagraph 'r.
hO. The low-cost municipal spring supply wouLd be supplemented bypumping relatively high-cost project water from the Anabta well field(Map 3). For the early years the demand would require Anabta water onmyduring the summer months. Annex 10, kaabta Well Field Pumpage, sets outthe calcula-tions of the additional pumped water so required.
V. THE PROJECT
General Description
41. 'The project consists of development of a new well field (seeMap 3) 17 kilometers northwest of Nablus, a main pumping station, chlorina-tion equipment, a booster pumping station, and a transmission line todeliver the water to a new resevvoir at the edge of the city. The newsource will supplement the existing sources within the municipal area,initially only during the summer months. Also included are improvementsto the existing sources and extensions to the present distribution system.
42 CWA has drilled two wells in the Anabta area wlhich have beentested for short periods with flows of from )L5 cu m Der hour to 75 cu m perhour. A third well is planned for the first phase of the program, followedby additional wells staged for construction as the demand develops; perhapstwo more by 1970. A hydrogeological report by CWA states that up to 600cu m per hour could be easily developed.
h3. The wells would be fitted with electrically driven submersiblepumps, delivering to a concrete tank of l,500 cu m capacity.
44. The Nablus electric company has agreed to sell power at 10 fi:Lsnpr kilowatt honiir and bhild +he tranjsmission line to the site. No standbygenerators wzould be provided at present at any of the pumping stations.
45. A pumping unit of 160 cu m per hour capacity would be installed
would also house the chlorinating equipment. A booster pumping stationwo-14 'd e bilt -1ri.4--^a -;- elevation Abetween art -d -alsa on~V ~JU L i UtIU.LJ.JU 1II-L-VCOy .LL~V _L1t- UVCL'.J1U.L LJ IWIC .lLUU.L~ IJ d IIU ±CL..LUD t CA' d. JLLI U
about 14 kilometers from the main station. The pumping lift is fromelVCa.LLIo n4 III UU to.LVdLi.LjUii 575 Iu.

- 8 -
46. The transmission line wotld be approximately 17 kilometers inlnv -J.. rL l be. ,onstr'uctJeLd o.L 16=nch s an
abandoned petroleum pipeline now transferred to the Government by the'Iraq Pe-tr-olewn. Coz-upway. g .It wll beeuipe --wI.44s, avi-surg e pmen.LJ ~ U ..~UkIL OUIi% LJ .L W.L.L.j Je equ'.jU. " W.LUAl VLL4.0.sarge '' '~
to avoid excessive water hammer when pumps are started or stopped. ItW.-L.LL LJZ 4.'C1JU VII U~LIU rLUU11U "A.&U;jJ U .aJi I.'Vc.U dUU U±.LL.;A'. U1V00.lJ) 1IIL =1" Ul-VIIC.
vulnerable points.
47. A new service reservoir of 7,500 cu m capacity, will be con-svrtUaCet of reinforced concrete and loca-ted at the end' of the ta-USisiouunmain.
48. MNodifications and additions to the existing springs will includeprotective works against unauthorized acceiss, insta l ation oI flow recOrdersand gaging stations, a new 6-inch pumping main to parallel an existing 4-inchline to reduce friction head losses; installation of a standby pump at oneof the pumping stations; and overhaul and expansion of the chlorinationfacilities.
49e Detailed designs of the distribution system have not yet beenmade. It is proposed, however, that the required improvements be done intwo stages, the first of which would be part of this project and wouldconsist principally of reinforcements to existing mains through areas ofmaximum demand and secondary lines to extend services over a wider areas
50. Provisiorn is made for the purchase of additional house metersand meter testing and repair facilities, R=nicipal ownership of all metersis contemplated. Also included is a sum for the purchase of some vehiclesand other e.luipment.
Planning and Construction
51. An initial study was made for the municipality by a firm of con-sulting engineers. The consulting finn ernployed by the Jordan DevelopmentBoard for the Ein Samiya Project was asked to continue the study with thecollaboration of GWIA.
52. Construction would be done by CWA through contractors. All con-tracts would be let through international competitive bidding. Projectconstruction could begin in October 1963 and be completed by March 1965 -intime for the summer demand of that year. (See Construction Schedule inAnnex ll).
53. Although the construction phase would be the responsibility oFCWA. a consulting f:irm satisfactorv to the Association would be emnlovedto supervise the work. Upon completion, -the works would be turned over tothe Mimninp.Iliiv of Nablu�s for operation=
Project Managnem.ent and Organizat-ion
54, Th WD.- Depa+wr. of N=>u - -- -- _ be --r-.Ebvher.- wi-h additional personnel. As in the case of the other IDA water projects in Jordan,
continu.g ~ ~ ~ ~ ~~ -I mg-en asitc udb r-v-ided throug -T, wo wo'i
utilize the services of formign consultants. Funds are included in tho ccs;;eetfimatesw for the pro-rslon of this assistance.

550 The separation of accounts and outside auditing have been agreedto, as well as safe-arcis agnsta+ Arsin ofimrc +to o+henvr Tminici-i usnel
56.k - -P I -&sis diseussedin ;. nex+ ne.+ en shqrvrc! +that
an average rate of IlQ fils per cu m will be needed to meet operating cos-ts,¢otze -Wke locn -nd pr-Aid 0o - .in T ssbt yhgeLW.J. JJ-t. VIU J .~L Jcloy L% LU. UV .JAV U ± Ot-LI1 JW. LLL'Q O u ucl'uSL J 1 ~-6 --
than the present rate of 55 to 80 fils per cu m. It is higher than ther-4- s - 4 ' - A- -o rc in ,;l (6l pe cu r-.) -a -nd - Za-qa (6 fl-n per cur,)rc L . LL J1 LU-rUc: -L±± MUMJICId~ %V; -L.LO PUL .U 11 .LJ.UU ZCL.e IU'J ±J.-LO PE L C ItL/*
On the other hand, the rates in force in Jerusalem and Ramallah (120 and15)0 flJs pe- cU III espectively) -higher-
570 -s evidenze of acce,ptability, Uhc Borrower should sub,lnit XTrittenass-rances by Nabulus InUunicipality that it will 1 o U SaISfaCOI-31 1.1 c"and managerial policies, including adequate water rates. Adequate would bedefined as aa ILida-L rate of EL fils, to be subsequently mrodified asnecessary to maintain an acceptable operating ratio.
Project Cost Estimates
58. The total cost of the project, as detailed in Annex 12 is estiiaatedat JD 536,000 (US$1,500,000), including interest during construction and add-itions to working capital. Fstimated foreign exchange costs of $801,000represent 53 per centJ of the total project costs.
59. The construction costs include 18 per cent for contingencies andprice increases on the total of both local and foreign costs. The costsshown in Annex 12, are those presented by the consultants and reduced by C(Ain light of its construction experiences. The costs and contingencies areconsidered to be reasonable.
60. Eigineering costs are intended to cover design, general supervision,and resident inspection of major construction. The sum for management se-viceswill be utilized by CWA to cover the costs of management consultants and assist-ance for the IDA water supply projects, jointly with similar sums included inthe other projects.
61. Cash requirements during the two-year constructien period are sum-marized in Table 4. Existing service on debt incurred by the municipalityfor waterworks, amounting to JD 8,300 at thie end of financial year 1962/63,and part of the additions to working capitcl are covered by funds (JD 28,COO)generated from operations.
r-ABLE 4C.=u-iir. o. Vs.~>A{L. -n .- __
(In Thousands)
Foreign Exchange Costs Lecal Costs TotalITSR .M nJ.TD .m
Construction Costs 661 236 203 439Engineering Services v 2 40 - 40Management Se!rvices 28 10 - 10Interest During Construction - - 17 17Existing Debts Service - - 4 4Additions to Working Capital - - 54 54
Total 801 286 278 56b

- 10 -
6` -h .L±Ie proposed cash soces d -LG ut E-L c1 nstructio U se forl, "
Table 5.
TABLE 5
Summary of Estimated Cash Sources
US$ JD equiv.
IDA Credit 1,000,000 357,000Local Loan 500,000 179,000Funds venerated fromOperations o0,000 28,000Total 1,580,000 564,000
VI. FINANCING PLAN AND FINANCIAL PROJECTIONS
Financing Plan
63. An IDA credit of $1,000,000 would cover the foreign exchangecosts of $801,000 (JD 286,000), and also part of the local costs. Thecredit would be relent by the goveniment to the Municipality of Nablus at4 per cent interest for a period of 23 years, including a three-year graceperiod.
64e The conditions of the local loan (already agreed upon by theBorrower) by the Municipal Loan Fundi of the Jordan Development Board to themunicipality include escalated repayment. The terms of three-year graceand 20-year escalated amortization are markedly different from the usualLoan Fund terms of one-year grace and eight annual equal capital repayments.
65. An average water rate of 1C) fils per cu m will be needed tomaintain an adequate financial position.. There are various alternatives toestablishing a flat rate structure of 210 fils. It is possible to have asummer and a winter rate so designed to encourage greater use in winter.A promotional, declining rate would have merit in building the demand moreauickly than estimated.
Financial Prolections
66. The Pro Forma Income Proiections. Annex 13. indicate that theproposed water rates of 110 fils per cu m will yield a return of 2.2 perGent the first yenr after in-htThn n irPiv'ing to 5n0 ner cnnt in
1969/70 and 806 per cent in 1974/75. The ratio of operating costs to waterrevenues is 79 pr no +. +.three r afte' constructionn, decreasincr to lessthan 60 per cent by 1973/74.
67. The Schedule of Sources and Applications of Funds in Annex 14shows- - -ag4wrn, ai-' at the ernd ofP «>e constructio perod -ereare drawdowns in the three years following completion of construction andagcLJU Jiri 1970/71 - WhI LI adUUj. -LtUndJ we'ls ar-e inst'led. taaly Uiri) etal
of the water rate increase is necessary to accumulate a working capitalsulficLently large so as to sufiLce ior the arawaowns after project completion.

- 11 .
68. The Debt Service coverage is low: 129 in 1965/66, L,17 inJ-/-k/ %J I , JU V CJ..L VUJ WLLOU IJICI,IQ'.A. -,VU I vh~ UV.- -1 - ' -j I-' I-+
If the credit were granted, a limitation on further debt would be in-
VII. JUSTIFICATION OF THE PROJECT
69. Prcr cap-L ad cUr,sU1wi.L±uu _±. 1NbULUO iL loW, eVenJ Uj dJ'iLLL LJEast
standards, presumably because of the lack of continuously available water.Output of the present system has increased very little i-n recent years nd.peak summer demand has been met by hauling water by trucks. Additionalwater is needed and -the need will be progressively more urgent in futureyears.
70. Available health statistics indicate a serious upward trend inwater-borne diseases in the Nablus area. Both the improvement in qualityand the greater quantity of domestic water contemplated in this projectshould be important factors in reducing such intestinal diseases, as wellas filth-borne diseases in general.
710 The cost of the incremental Anabta water in the first years isvery much higher than the average proposed water rate of 110 fils per cu m.The basis upon which the following table was prepared is explained in Annex15, but, in summary, the additional interest, depreciation and operatingcosts incurred by reason of development of the Anabta source were dividedby the addit.ional water produced from 1this source.
TABE 6
Fixed Operating Water IncrementalYear Incremant. Increment Reciuired Cost
March 31 JD JD Cu M Fils/cu m
1965/66 19,500 12,300 42.900 7UO1966/67 19)5OO 13,100 6h-800 5001967/68 l9.o00 13.700 87.900 M801968/69 19:50)0 134shOO 113,9400 )01969/70 19^H03 15.100 113.700 2.l01970/71 199500 16,300 173,100 210
72. Niablus Municipality reports its cu m cost of water haulage asine1luding 5O fi=s for nurchase from Anabta village, 2C) f'il5 for transnortto Nablus, and 100 fils for chlorination, labor, and the like0 UNTRWA reportsi+.ts wte.or hailango osrtC+.s +.n it.sc canmnp in +.he Nablus aren inrlincd ngprhnchasat Anabta, as 320 fils per cu me The JN Agency warns that these figures areTreytT nnyv-xJm.enl+ k thiy+ + ainrer best +hi av
414l- +rn to - +h 1 tu c :
' 4 LItiIiA .iIUij-fJ'. L - - 9 - jj - L- riC VL .LOL-L a.Jt U-' -JA a L~.l I'
UNRWA also notes that its water haulage costs, including depreciation, are".L8'J Ufil s V± W±I..Lr 0IL per to klloImete. Ch.l gener V contract god .Ualir, inL" 4 - To rA.Lr,
costs 65 fils per ton kilometer but that contract hauling is not available.LUr WdatIer '±au'dge

- 12
73. The tot,al annual cost of the additional we.ter required is shownl belowif it were supplied lbyr the project cir if it were hauled in trucks at a costof 320 fils per cu m.,
1ABLE 7Additional
Water Froject TruckYear :Required Cost Cost
Niarch 31 Cu I'i JD JD
1965/66 42,900 31,800 13,7001966/67 64.800 32,600 20,7001967/68 87,900 ,,3,200 26,4001968/69 113.400 't3,900 36,3001969/70 143,700 ,;4,600 46,0001970/71 173,100 15,800 53,400
74. The foregoing indicates that the project, when compared with trucktransport as an alternative, will not be economically attrac-tive, even at aL per cent return. until the fourth vyear after nroiect completion. Neverthe-less, it is obvious that the project will be needed sooner or later.
75. Even in view of the lack of iMmediate economic justification, theJordanian Governent conrsilders it ncpc-s'scrr to grejr ahlgh npririty tor the
scheme for other reasons. The high -priority is evidenced by the uniquelyfavorab<le loan terms, incl-A 1 escalaed a'-+rti+4l+tion, to be granr- for c arl
loan funds in an atteeipt to make the project financially viable.
XrIIj. CONCLUSIONS jl.4-D C'dCli!DATI0NS
76. Nablus Nlunicipality has reached the stage where its peak seasonalZ ^ _ ____ |__ 1| .1_ _: n2 1_ _ __: _ .A* AAP1 A 4 -udemranUd 4is gr-eatuer lthlan Llthe yi eldU of the existing sources. Th 'i- s deficit sJ.
progressive:l-y increarSing in intensity and duration.
77. The project provides for a new source to meet the seasonal deficitand for extensions and i!.provem-ents to the existing systemi.
(0. ±'..L L,jLUt1 ;U t,0 tOUU1[i±LUZ:±.L±Y OULUI1U UII1U ±±IaL. L AI/ -u~t I k/C) A. ullUUgll W1iU PIUU e U IU.. t2 lEl t,L_ UUl all 1'L2ALS C J/GUtU
the economic costs are high for the additional supply, due to the seasonalnature and :Liniti1ed U mXo-unt of t,he dCeIi&IIj. On the basis of the data ava1lcableit could be argued that, froml an economic point of view, the project should bepostponed two or thiree years untii tne water demand will have glOWnl to tlepoint where costs for the increri.ental water of the project and for water hauledby trucks are more nearly comparable. There is no question that the projectwill be needed in the near future and the extra cost of completing the projectearly is perhaps within the margin oI- error of the calculations. The projectcould be accepted for financing if the city of Nablus agrees to the increasedrates necessary to ma.ke the projecit financially viable and this the cityhas recentl;y agreed to do.

- 13 -
79. The Borrower has agreed to thLe following conditions:
(a.) Local. loan funds will be made available to the NablusMunicipality at 4 per cent, three years grace, andwith escalated repayment over a 20-year period;
(b) The Nablus Water Department will have such functionsand staff, separation o.- accounts and funds, and safe-guard.s against diversion of funds as are necessary fordiligent and efficient operation and maintenance;
(c) The accounts of the Wgater Department will be audited byan outside accountant;
(d) Water rates will be maintained so as to cover operatingexpenses, including taxes, if any, interest, maintenance,depreciation, debt repayments in excess of depreciation,normal extensions, and a reasonable part of future ex-pansion. To this end, an initial water rate of 110 filsper cubic meter will be made a condition of withdrawal.A 70 per cent operating ratio is to be attained in thefourth year following project completion;
(e) Nablus will not incur any long-term indebtedness inrespect of its water operations unless net revenues fromwater supply operations in any 12 consecutive months inthe oreceding I5 exneed 1.5 times new total nroiecteddebt service requirements;
(f) CWA wiU employ satisfactory consultants in the con-strurcti n of the project;
(g) NablusIii wl utilzIe in Fft operation of' i ctsIq Water
Department the assistance of management consultants
80. Thei prictt. nrovides a ba.sis for an InA credit of $1,000000 tothe Hashemite Kingdom of Jordan to be relenit to the Central Water Authority
tion period.
September 12, 1963

Jordan
NABLUS MUNICIPA4LITY
ORCANTZATTON CHIART
MUNICI PALMAYOR COUNCIL
F=z- ] r [~~~~~~~~~itary Pubc Genieral 7 Electrical 7 [ Water Police I Fire ~ ~ ~ ~ ~ ~ ~ ~ ~~. iFli Account ng Egnering__________i L T<r L Libr JL AdminLstrati on L Power L t i Ege
Chief Chief' 2 I)octors I.ibrarian Secretary Accountant Director Director Enginee:r9 Policemen 4 Firemen 7 E:mployee8 2 Clerks Chier CJerl 3 E:mployees 12 Technical ',TarhnlUu 9 Tucxllcal
6 Emlployees Staff S taf f Staff6 Drivers 25 Fmployeen 11 Employees 5 Employees
MAY, 1963 IBRD - 1189

JORDAN
NABLUS WATER SUPPLYSYNTHETIC HYDROGRA,PHS FOR SPRINGS
*--- --Ilk RECORDED FLOWS_T_ _ _ _ _I _ (Four springs combined)7000 - ---- 0 -RECORDED FLOWS
(Five springs combined)SYNTHETIC IIYDFCOGFAPHS
SOOO ~~~~~~~~~~~~~~~~~~~~~~~~~~0 0 _I3'A E_ t C[''XISTINQG PUIMPING CAPACITY
NOTE:-Only four springs were measu(Fversering combined
5000 ~- -t=H7-H
4000 _ ___ 15 1 1959 and 1 b ___.
_ ~ ~ _ __ __ 1_ 1 1 .7 -_
MAY 1963 IBRD-1957.19 ~~~AVERAGE FLOW
Z30007 - -- -- __ _- -__ __
01
U.~~~~~~~~~~~~~~~~~
NOT E:-Only four springs were measu-red inIOIDO - ~ 1957, 1958, 1959 and 1960,, but in 19I61 anrd _ _ ___ ________LOW FLO'
____ - 1962 fi-ve springs weire measured. The ~syn- - ______
thetic hlydrcigraphs are for- five spriLngs.I
NOV DEC JAN FEB MVAR APDR IL MIAY JUJNE JULY AIJG S1EPT OCT NOV
MAY 1963 IBRD-1191

ANNEX 3
NABLUS WATER SUPPLY PROJECT
Seasonal Variation in Demand
The average monthly production for the fiscal years 1959/60, 15960/61,
and 1961/62 are presented below.
AssumedAverage Percent of Adjusted Percent of Seasonal
Month Gross Production Average Month Production Average Month VariatiorCu M Cu M %
April 5 0 98 2 7.93 10
riay 62,680 118 ''2 100
Js,e 6~~~~l,l 121Zt1r 1 1C~~~~10Al.cnI9 )' c~n II
july ,At IO 1 6 6-o00+ 118 120
August 59,200 111 66o000+ 118 120
September 53,180 100 6,o000+ 115 120
October 50,9b0 96 60,000+ 108 100
November h7,820 90 L7,820 86 80
December 47,900 90 47,900 86 80
January 46,980 88 46,980 84 80
February 143,160 81 143,160 77 80
March 48,,460 91 48.h60 87 100
Total 6o40,270 669,300
Average Month 53,400 55,80o
+ Arbitrarily adjusted to what might have been the demand had the spring flow
been sufficient.

AI JEX L
WABLUS iTL.JR SUP? LY PROJECT
HIIPL7H STI'TIS TICS
Table~ :L. f^Eorbid±it Dta~+ .for Nablus Distic
Case!s per
Year Typhoid Paratyphoid Dysentery Total Cases Population 1,0(0
1'')5 7 1 ,7 6 22 175
-1 ''57 12 On 20- 1. r
1' I -L 5 12 57
.L,7 iou± t41
i100QU Du) LyE D) r L4
1961 702 269 2L 995 3)2,616 2.90
Reliable population data are available only for 1961.
Source: Statistical Yearbook, Jordan Government Department oI Statistics, 1L961.
Talole 2. Comparative Disease Rates
Disease RateCases per 1,000 Persons
Typhoid and DysenteriesArea 'Year Paratyphoid Alone Both
Puerto Rico 1958 0.009 0.005 0.01]
Taipei, Taiwan 1960 0.068 0.026 0.09
Wqorthern America 1958 o.041 0.094 0.:14
Middle America* 1958 0.230 1.260 1.'49
NIBLUS DISTRICT, J0RDAi'4 1961 2.83 0.070 2. 90
South Armerica. 1958 0.495 0.359 0.35
Source: Reported cases of ilotifiable Diseases in the.8mericas19)L9-l958, PpJ'IO, liMhO, Augu.st 1960.

MUNICIPALI-T'Y OF NABLUS ANNEX
Financial Statements 1958/59-1i62/63(In Thousands of Jordanian Dinars)
__ __ Fiacal Year Ending March 31JJU-k-4UBudget
1958/59 1959/60 196o/61 1961/62 1962/63
RECEIPTS
Rates, taxes & 'licenses 39.5 39.4 49.8 46.1 51.6Market fAes and Publie Servieas 19.2 2 262 21.0 36.5
Revenues from MunicipalProDerties 10.9 f.1 10.9 12.8 15.0
Interest 0.6 0.6 1.3 1.1 -Water Rates 21.7 23.5 24.6 27.8 29.5Connection fees 0.5 0.7 1.3 0.8 o.8Electricity 45.6 61.6 64.3 66.4 78.0Loans 10.2 4.0 18.4 4.5 150.3Other 3.0 _3.6 26.6 3.9 ____
Total Receipts 151.84 170.6 2234 184.4 368.6
EXPENDITURES
Operating:General Administration 6.6 9.4 11.4 11.3 18.3Pensions etc. 0.2 1.2 2.9 1.8 2.8Health 10.3 11.2 15.1 16.7 21.8Safety Services 2.5 2.1 3.5 3.5 4.3Social Services 1.9 2.0 4.4 4.3 4.8Public Works 6.8 9.3 14.8 13.9 29,8Water 5.3 15.1 20.3 24.1 27.6Electricity 17.6 23.0 26.0 28.4 38.90ot'5er 8. 1. 12.9 l23.2
Capital Improvements 144.14 614.0 63.9 54.9 176.
Amortization 24.4 25.8 25.8 28.7 8.2IntereBt 7 4. .8 -4.
TotaL Debt Service 31i- 30.9 30e6 32,2 12.2
Total Expenditures 1836t10.3
SurTius (Deficit) 15.9 (13.0) 127A/ (2066) 8o0
i/'unicipality reported a cash balance of JD6(.5 as of March 31, 1961.

'AiS!EX 6
NABLUS WATER DEPARTMENT
Pro Forma Income Statements
Fiscal Year - March 31 1959/60 1960/61 1961/62 1962/63Budget
Total water produced l,OOO m3 668 480 668 700Total water sold l,OOO m3 50C0 43 504 525% unaccounted for 25 23 25 25
Average Water Revenue Fils/imu 47 56 55 56Average Water Cost Fils/m? 23 35 36 39
RevenuesWater Sales 23,472 2L 607 27,800 29.500Meter Installation & connection
Fees 682 1.304 825 800Total Revenuaes 2I i,54 25,911 28,625 30,300
Operating CostsSalaries and Administration 7,239 10,947 12,683 15,339Maintenance 253 627 432 600Depreciation 1/ 5,000 5,603 6,000 6,300
Fuel and Power 1,08L 1,681 4,104 4,200Chlorination l'> 321 97 364Total operating costs 13s5°13 19,179 239316 zob w j
Interest 145 1.150Total Costs 15,0 20,335 2h,06 27,2
Net Income 9s07 5s,576 4,557 2,672
Estimated Fixed Assets 194,00') 196,000 198,000 200,000RIetUrn or nst .ae F-ULixed ASC;u-
(before iaterest) 5.4t 3.4% 2.7% 1.7%
Ratio of Operating Costs(inc luding depranr4ati otJn) ntWater Revenues 56% 74% 81% 88%
1/ At 2% for land property and 4% for pipes and machinery.

NLBLUS WATE:R SUPPLY PROJECT
Eatinated Future Municipal Population Crrowith and Water Demand
Nablus ,-
Pooulaticrn Li ters oer Poiulation Liters ner Total Per cert of Daily DemandYear Ending 2% Annual Canita :,er Consumotion 2% Annual Capita per Consumption Cons:upti on Producti on Per cent of Av
March 31 Increase Day Cu M/Day Increase Day Cu M/Day Cu M/Day Unaccounted 100 120 80 Sol(iFor Cu M Cu M Cu M Cu M/Year
1.961/61 42,120 30 - - - - - - - - - -
3.961/62 42,960 32 _ 2,830 -
3 962/63 43,820 34 - 2,890
1963/(÷ ,44?700 36 _ 2,950 - - - _ _ _ _ _
3 964/65 45,590 38 - 3,010 - - - - - - - _
].965/6,6 46,500 40 1,860 3,070 15 46 1L,906 25 2,541 3,049 2,033 696,o00
1966/67 47,430 42 1,992 3,130 16 50 2,042 24 2,687 3,224 2,150 745,(00
1967/68 48,380 44 2,129 3,190 17 54 2,183 23 2,835 3,402 2,268 797,(00
1968/619 49,350 46 2,270 3,250 18 58 2,328 22 2,985 3,582 2,388 850,(00
1969/710 50 ,340 48 2,416 3,320 19 63 2,479 21 3,138 3,766 2,510 905,(00
1970/71 51,350 50 2,568 3,390 20 68 2,636 20 3,295 3,,954 2,636 962,C00
1-9T±/72 52,,380 52 2,724 3,460 21 73 2,797 20 3,496 4,195 2,797 1,021,000
1972/73 53,430 54 2,885 3,,530 22 78 *2,963 20 3, 704 4,445 2,963 1,081,000
1973/74 54,500 56 3,052 3,600 23 83 :3,135 20 3,919 4,703 3,135 1,144,(00
31974/75 55,,590 58 3,224 3,670 24 88 :3,312 20 4,140 4,968 3,312 1,209,000

ANNEX 8
NABLUS WATER SUPPLY PROJECT
Balata Refuge!e C:amp Estimated
Population Growth and Water Demand
Population Liters per Consumption Percentage of Daily Demand-Percent of'°t A..,ual. Gap'Lta ..- Ia Pro-o "r.=
Increase Day accounted for 100 120 80t1s m GU m GU m
1961/62 9.680 - -
1962/63 9,870 - _
1963/64 10,070 - -
1964/65 10,270 - -
1965/66 10,480 15 157 25 209 250 167
1966/67 10,690 16 171 24 225 270 180
1967/68 10,900 17 185 23 240 288 192
1968/69 11,120 18 200 22 256 307 205
1969/70 11,340 19 215 21 272 326 218
1970/71 11,570 20 231 20 289 347 231
1971/72 11,800 21 2h8 20 310 372 248
1972/73 12,040 22 265 20 331 397 265
1973/74 12,280 23 282 20 352 422 282
1974/75 12,530 24 301 20 376 451 301

NABLUS WAP:R:SUPI:L iY 'R.C
Balata C_ap Estimate!d Watr Pruda. ction and Purchas5es
Consumpticn Supply 1965/66 1L966/67 1967/68 _ 1968/69 L969/70Montd Per cent Available Demand afceitWi t.emanDicticitt Demand Defricit Demand Deficit
of Average cu m/day cu m/day cu rn/day cu m/day cu m/day cu m/day cu m/day cu mr/day cu m/day cu m/day Cu =/day
April 100 150 210 60 220 70 2L0 90 260 1130 2 70 120Kay 100 120 210 9( 220 100 240 1u20 260 31l, 270 lSO
June 120 100 250 150 270 170 290 :190 3110 2:10 330 230July 120 70 250 18( 270 200 290 220 3110
2140 330 260
August 120 60 250 190 270 210 290 230 310 25iO 330 270September 120 50 250 200 270 220 290 2h0 310 260 330 280October 100 40 210 17( 220 180 240 2 00 260 220 270 230November 80 40 170 130 180 3JLO 190 150 20D 160 220 180December 80 60 170 11( 180 120 190 130 20H 1m0 220 160January 80 80 170 9( 180 100 190 i0O 20D 120 220 14
0
February 80 100 170 70 180 80 190 90 20D 100 220 120March 100 180 210 3( 220 I0 240 60 260 80 270 90
1,050 2,520 1,L70 2,680 1.630 2,880 1. 330 3,080 2.030 3,280 2,230
Consumpt tics Supply 1970l71 i971/72 1972/73 1973/i7 L197ij/75Month Per cent Available Dicand DeTcitt Demand Defticit Demand Deficit DemEnd 5eTit Demandi DefiCi t
of Average cu rn/day eu rn/day cu m/day cu m/day cu m/day cu m/day cu m/day cu m/day cu mr/day cu m/day cu m/day
April 100 150 250 ]I( 310 160 330 :180 350 200 380 230May 100 120 290 170 310 190 330 210 350 2.30 380 260June 120 100 350 250 370 270 400 300 420 320 450 350July 120 70 350 280 370 300 400 330 420 3 50 450 380August 120 60 350 290 370 310 400 3340 420 360 L50 390September 120 50 350 30( 370 320 400 350 420 370 450 400October 100 40 250 250 310 270 330 290 3510 310 380 340November 80 40 230 190 250 210 260 ;220 280 21I0 300 260December 80 60 230 170 250 190 260 200 280 220 300 240January 80 80 230 150 250 170 260 180 280 200 300 220February 80 100 230 130) 250 150 260 :160 280 180 300 200March 100 180 250 110 310 130 330 150 350 170 380 200
1,050 3,480 2,43() 3,720 2,670 3,960 2,910 4,200 3,150 4,520 3,470

WIAUS0 UMI00 SLW991 ?MiJECT
Am,bt.. 10,1 Firnid -pg
Camomtin Supply 1965/66 1966/67 1967/63 1968/o9____ 1969/70I%mth Pr ca,at A-iAUbl. ?/ G~ge Drnoad Dericit A..bt. 1urnp.g. D-uod tD,f1u1t knD.o-u.rn fe.d 0,fiit d.b. urpg aadubta Puapa.
of Av.rnrgo I/ *u,/daj' Cu/day Cu rn/day a/ .eorth, uu ,day .u rn/day cu n/u,otJ, cu rn/day C- r/day ,ur/rnunh C. m/day -. rn/dy Cu rn/ooth c. r/day Cu C/day u e/-nnth
Awlpl 100 5,060 2,60C' 3,000 ~/ 2,7650 - 3,000 2,930 - 3,000 3,090 - 1,00 :3 ,260 - 3OONNY iou 4~~, 700 2,61v 3C0f0 2;700 - 3,000 2.,P60 - 3,1000 3,120 - .I,000 .1,290 -300
J,= ~~120 3,700 3,200' 3,000 3,390 - 3,000 3,590 3 ,uWt 3,,790 301,000 6,CY) 300900July2 120 3,100 3,230I 130 3,900O 3,1V0 320 9,600 3,6520 520 15,600 3,820 720 21, 600 4,,030 930 27,900A',guat 120 2,800 3,2460 640 13,2C0 3,630 6530 18,9100 3,630 030 24,900 3,830 1,030 30,900 4,040 1,260 37,200soptmrnr 120 2,600 3,250 650 19,5CC 3,61.0 360 25,200 3,660 1,060 31,200 3,860 1,21.0 37,200 64,050 1,650 43,500
Octobar 100 2,500 2,71C1 210 6,300 2,870 370 11,100 3,0360 560 16,200o 3,200 700 21,000 3,370 870 26,100ADRnmbe 80 3,O00 2,160i - 3,000 2,290 - 3,000O 2,6,20 - 3,000 2,550 - 31,000 2?,690 - 3,000Drn e 80 5,11,o 2,14.0 - 3,OC0 2,270 - 3,000 2,1400 - 3,000 2,530 - .1,00 Go2,670 - 3,0O0Jernuary 80 5,110 2,120, - 3,000 2,250 - 3,000 2,380 - 3,0l0 2,510 - 1~,000 2,650 -300Fymouryw s0 5,0L0 2,100 - 3,000 2,230 - 3,000 2,:)60 - 3,000I 2,690 - 11,000 2!,630 - 3,000
affi,fth 100 51.0L 2,570 - 3,000 2,730 - 3,000 2,9?00 - 3,000 3-,060 - 31,000 3,230 - 3,000TliI9C; 66,-9-0 3-3870 F3 35,IT70 111,900O 37,830 I3,203990 ~,700
C4 t1m sum1y 1970/71 _____1971/72 _____1972/73 1973/16 1974/75N,ontl per gm% uja.,3 Sa ,~IAQ urc1C1C auuL. Fuprngo D-ud ~ l,.d Daficit An.bta 7;uopag, enn Dflul t knabta Pp. -,oaUd DefiCi AOabta PuePa,9
of Iverege v,/n rn/day Cur/day C/ u ,,/day Cu rnr..nt6 C r/day Cu C/day Cu,/,otb , ,/day Cu u/day Cur/annL, Cu ~day Cu n/Cy Cu-/nui ,uday C- u 1-
A1pril 100 5,040 3,660 - 3,000 3,66:0 - 3,000O 38380 - 3,0)00 6,120 - 3,000O 1,,370 - 3,00-0flq 100 6,700 3,470 - 3,000 3,6910 - 3,000 3,9110 - 3,000 61,150 - 3,000 j,,4W - 3,200-.Jeam 120 3,7C0 6,200 500 15,000 6,670 770 23,100 46,760 1,040 31,200 5,020 :1,320 39,600 5,320 1,620 45,600
J~~.Jr 120 3,100 6,230 1,130 33,900 6,500 1,4,00 62,000 4,r7o 1,670 50,1L00 s,oso :1,950 58,500 :35,350 2,150 66,500kaguat 120 2,800 6,260 1,660 63,200 6,510 1,710o 51,300 6,7r80 1,980 59,4
0 05,060 21,260 67,300 !5,360 2,560 76,800
Sopt.aber 120 2,600 6,250 1,650 69,500 6,520 1,'920 57,600 6,790 21,190 65,700 5,070 :1,470 74,1 0 0
'5,370 2,770 83,100Outoter 100 2,500 3,550 1,050 31,500 3,770O 1.270 38,100 3,990 1,4690 66,700 4,230 :1,730 51,900 6,680 1,980 59,600November 80 3,000 2,830 - 3,000 3,010L 10 3,000 3,100 100 5,4,00 3,380 380 11;,400 .3,570 570 17,100D1imnber s0 5,060 2,810 - 3,002 2, 9310 - 3,000 3,160 - 3,000O 3,360 - 3,000 .3,550 - 3,000JanuaAry 80 5,060 2,790 - 3,000 2,970O - 3,000 3,160 - 3,000 3,,360 - 3,000 .3,530 - 3,000-f,brn.ary 80 5,040 2,770 - 3,000 2,050O - 3,000 3 ,12 0 - 3,000 3,320 - 3,000 3,510 -3DOIhLrnh 100 5,060 3,610 - 3,000 3,6:30 - 3,000 3,850 - 3,000 6,090 - 3,000 ,, 360 - 3,000
61,990 1964, 10 66U,670O 23,10673047,100 50,1190 31305,56,0
See Pwareprap3, 17.rruAmx2.
fta k,uez.e 6 eand S.NeiAl,, puepag, tbroughCuut the year at 3,0X0 Ca... an'thly isa,,tial patod f,,r operatllonal pwpeeo..

jordan
NA BLU'S WATER SUPPLY PFtOJE'CT
CONST;RUCTION S(CHEDULE
ITEM Fiscal Yiear Endi;ng March 31 of Stated Y.ear1964 1965
Design and Tenders I =JAN 1964 JAN 1965
Award of Construction Contracts +_l
ProcuArement Vof Pumpsnn inr Rrmninmnil L_=__Construction of Pumping Stations
Modification of Existilg StLations
Construction of Trans,mission Main ==_>
Construction of Reservoir . _=_X
Construction of Distrilbution System ____ ____ _
AUGUST 1963 IBRD- 1190R

Au'L!EX 12
NABLUS ,?JPTER SUPPLY PROJECT
Investmcnt Schedule(in thousands of Jordanian Dinars)
Foreign Local TotalItem Costs Costs Costs
Supply System
IJells and pumps 20 10 30Contact Tank 3.5 11.5 15Miodifications to existing Springs
and Pumping Stations 7 8 15
Total Supply System 30.5 29.5 60
Transmission System
Chlorinators &: First Lift Pumps 14.5 0-5 15Main Pump Housing 1.5 6.5 8Booster Purps 11.5 0.5 12Booster Pump Housing 1 5 6Transmission Line, 16-inch IPC 20 60 80Anti-surge Equipment 4 1 5
Distribution System
Reservoir 7 33 L4Pipelines 100 20 120House H'ieters and Repairs 6 6 12
Total Distribution System 113 59 172
Other
Hobile Equipment 4 -4
Local Freight - 10 10
Total Other 4 10 14
Subtotal 200 172 372
Contingencies at. 18% 36 31 67
Total Construction Cost 236 203 439
IS - 4n
Management Services 10 - 10
Subtotal 286 203 489
Interest during Construction - 17 17Addition to Cash 30 30
Total 286 250 536
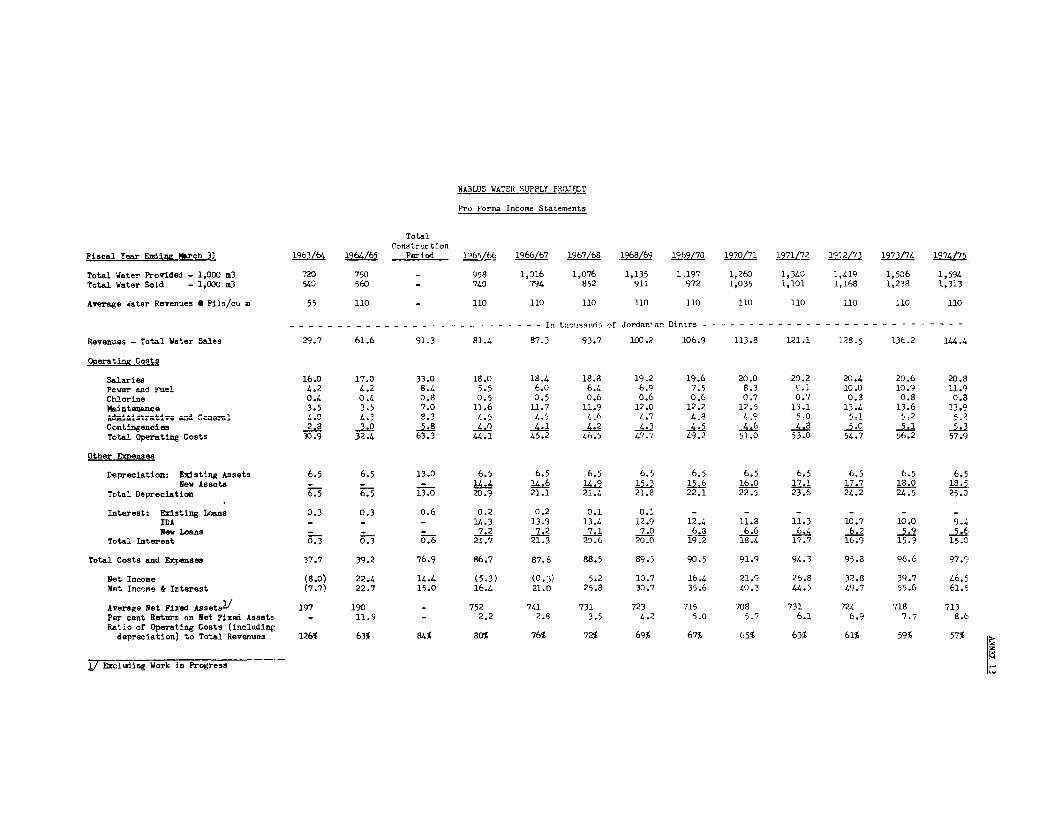
NABLUS WATER SUJPPLY PROJECT
Pro Forma Income Statements
TotalCc,nstruc tion
Fiscal Year Ending MKreh 1L 1963/64 1964/65 _ Perioi 1965/66 19656/67 1967/68 1968/69 169(Z 1970/71 [971/72 1i'2/73 1973/74 ]-974h75
Total Water Protided - 1,000 m3 790 750 - 958 1,016 1,076 1,135 1,197 1,260 1,340 1,419 1,506 1,591Total Water Sold - 1,CW0 m3 'i40 560 _ 740 794 852 911 972 1,015 1,101 1,168 1,238 1,313
Average Water Revenues e Fils/cu m 55 110l 110 110 1:L0 110 110 110 110 11O 110 110
- - - - - - - - -- - - - - - - - - - - - - - - - - - - In thousands of Jordanian Dinars - - - - - - - - - - - - - - - - - - - - - - - - - - - -
Revenues - Total Water Sales 29.7 61.6 91.3 81.4 87.3 93.7 100.2 106.9 113.8 121.1 128.5 13t.2 144.4
Operat ing Co sts
Salaries 16.0 17.0 33.0 18.0 18.4 18.8 19.2 19.6 20.0 20.2 20.4 20.6 20.8Power and Fuel 4.2 4,2 8.. 5.5 6.0 6..4 6.$9 7.5 8.3 '.1 10.0 10.9 11.9Chlorine 0.4 0.4 0.8 0.5 0.5 (.6 o.6 0.6 C0.7 0.'/ 0.3 0.8 0.aPaintenance 3.5 3.5 7.0 11.6 11.7 11.9 12.0 12.2 12.5 13.1 13.4 13.6 13.9M'ifti .rati-.C czn l 4.0 4.3 8.3 4.5 4.5 1 6 4 4.8 4 .9 55 LJi 5n? 5 zCcontingewicies .2.8 3.0 S.B 4.0 4.1 4.'2 4.! 4.s 4.6 4.8 _.1LW
ToFtal Operating3 Coats 30.9 32.4 63.3 44.1 45.2 416.5 47.7 49.2 51.0 53.0 54.7 56.2 57.9
Other Expen3s
Depreciation: lEdsting Assets 6.5 6.5 13.3 6.5 6.5 6.5 6.5 6.5 6.5 6.5 6.5 6.5 6.5New Assets 14- - 414. L4.
1' ! 15.6 16.0 17.1 17.7 18.0 18.5.
Total Depreciation 6.5 6.5 13.0 20.9 21.1 21.4 21.8 22.1 22.5 23.6, 24.2 24.5 25.0
Initerest: IBxsting LoAns 0.3 0.3 o.6 0.2 0.2 0.1 0.1 - -- -
IDA - _ _ 14.3 13.9 13.4 12.9 12.4 1;.8 11.' 10.7 10.0 9.4Now Loans - - 7.2 7.2 7.1 7.C) 6.3 6.6 6.14 6.2 _i.9 S
Total Interest 0.3 003 0.6 21.7 21.3 20.6 20.0 19.2 18.4 17.7 16.9 15'.9 15.0
Total Costs and Expenses 37.7 39.2 76.9 86.7 87.6 88.5 89.'i 90.5 91.9 94.3 95.8 96.6 97.9
Net Income (8.0) 22.4 14.4 (5.3) (0.3i 5.2 10.17 16.4 2:L.9 26.8 32.8 39.7 46.5Net Income & Inrterest (7.7) 22.7 15.0 16.4 21.0 25.8 30.7 35.6 410.3 44.' 49.7 55.6 61.1
Average let Fixed AssetsV' 197 190 - 752 741 731 723 715 708 731 '724 718 713Petr cent Returr on Net Fixed AssetEs - 11.9 - 2.2 2.8 3.5 4-.2 5.0 5 .7 6.1 6.9 7.7 8.6Ratio of Operating Costs (including
depreciation) to Total Revenues 126% 63% 84% 80% 76% 72% 69% 67% 6'5% 63% 61% 59% 57%
7/ Excluding Work in Prggress

NABLIJS WATJR SUPPLY PROJECT
Sources and Aplica;ion of Fund.(Thi Thousands of Jordanian DOmn)
To talConstruction
Fiscal Year Eniing Ms.rch 3L )314/65 Period 1965/66 1966/67 1967/68 a%8/62 1269/70 19i0/7L 1971/72 1972/73 1973/74, 274/75
SourcesNet Income before Interest (7.7) 22.7 15.0 L6.4 21.0 25.8 30.7 35.6 4.0.3 44.5 49.7 55.6 61.5Depreciation 6 _6.5 13.0 29 21.1 21. 21.8 22.1 22S 23.6 24.4.5 25.0Total Generation of Fwnds (1.2) 29.2 28.0 37.3 4,.1 47.2 52.5 57.7 62.8 68.1 73.9 80.1 86.5
IDA Credit 60.2 296.8 357.0 - - - - - - - -Local Loan 22.8 15.2 179.0Total Loans 94.0 .442.0 536.0 - - - - - - - - - -
Totaj. Scurzce 922. 1 471.2 564.0 37.3 42. 1 47.2 52.5 57.7 62.8 68.1 73.9 80.1 86.5
ApplicationsTotal Foreign Costs 59.0 227.0 286.0 - .-Total Local Costs 28.0 175. 203.0 - 10.0 Total Project Investment 87.0 402.0 489.0 - - - -_U.O - - -
Extensions and Improvements - - - 9.2 12.2 13.1 14.1 15.0 .0 17.1 18.2 19.3 20.4Addition to Working Capital - - - 8.0 5.0 1.5 1.6 1.6 1.7 1.7 1.8 1.9 1.9
A.ortization Existing Loan 1.7 1.4 3.1 1.4 L.4 1.2 1.2 - - - - - -ADrtisation IDA Credit - - - 5.9 12.2 12.,7 13.2 13.7 14.3 14.8 15.4 16.1 16.7Aortiaation New IAa - _ - - 0.9 1.7 2.6 3.4 4.3 5.1 6.0 6.B 7.7latereat Existing Loan 0.3 0.3 0.6 0.2 0.2 0.1 0.1 - - -. - - -Interest IDA Credit 1.2 10.0 11.2 14.3 13.9 13.4 12.9 12.4 :11.8 11.3 10.7 10.0 9,4Interest Nev Loan 0.8 IO i,8 7.2 7.7 2 7 7.0 6 8 6.6 6.4 6.2 S.9 5,6Total Debt Service 4.0 16.7 20.7 29.0 35.8 3.2 37.0 36 37.0 3,.6 38.3 38.8 39.4
Total Applications 91.0 418.7 509.7 46.2 53.0 50,,8 52.7 52.9 134.7 56.4 58.3 60.0 61.7
Clanges in Cash Position 1.8 52.5 54.3 (8.9) (10.9) (3,,6) (0.2) 4.8 (21.9) 1:1.7 15.6 21.1 24.8 ECaLsh at End of Period 1.8 54.3 54.3 45.4 34.5 30,a- 30.7 35. 13.6 25.3 40.' 6?.7 86.8
Debt Service Coverage - - - 1.29:1 1.17:1 1.30:1 1.42:1 1.59:1 1.70:1 1.81:1 1.93:1 2.06:1 2.20:1

ANiTEX 15Page 1
NABLUS IATER SUPPlY PROJECT
PASSIlKsPTIONL i`% FIIhARCIA.I, P11JJEGTI0N;S
1. The total of the water provided in each yeer is the sum of thedemoand colunn in Annex 9 times 30 days per month. W1.4ater sold is the yearlsaverage daily cernand for Fablus liunicipality ancl refugee camp, times365 days, as shown in the last colunmn of Annex 6, plus the total of theBalata Camp deficit, set out in Annex E, times 30 days per month.
2. The governnent would relend the IDA Credit tG the iunicipalityof Nablus at 4,, interest for a period of 23 years, including a three-yeargrace period; repayment of principal an]. interest would be in 40 equalserii-annual payments.
3. Funds from other sources will be borrowed by the municipalityunder the following conditions: repayment amounts to cover capital escalatedover 20 years, (as shown obelow) and after three years of grace; the interestis 4% per annur-, payable annually, on the outstanding amount. If the amnountof local credit is C, to be paid in annmal installim,ents in 20 years, thepayment in the year n is
C x II210
where n varies between 1 and 20 years and where (210) is tl,e arithmeticsum of the numbers 1 to 20.
4- An 2veragse i,nter ra-te of' 110 fils,/cu m is proposed, to he introducedat the beginning of t:he 1964/65 financial vear.
5. Beginning thie fiscal y,eea.r 1965/66, provision is inade for usingpart of the funrds genercted by operation,Qs to finance additions to the dis-tri'oution syrstem in ainnual anounts equal to 15, of the gross water revenuesof the previous year.
6._ Sa>?laris incrlude n1l nlother remneratio nl nq , Pn trtnr 1nfMtqand cost of living allowances to staff, laborers and guards and are theestimates of the pre sent consul ±onts.
7. The power an.d fuel costs were arri.ved t as'r 1f olws
a) 'l ' h rfl,,f ,v6 coV% sts ( po. re ) f V L0 vm 4
,.na.bta. nO .....+......0........+.....lrev taen+
JD20 per 1,000 cu in. This is ba.sed on power costsof 10 fils per kilowatt hu puming rate of 160 cu mDer hour, a C coefficient of 120 in the Hazen-lWilliamsflow, 'ormu'la, a--' an overall gamping e-fflciency ofM 0iSubsequent to 1970, JD21 per 1,000 cu m was used tocom,pensa'te e:xtra friction 'losses of puu,Aing-1 at ,2Cu mI per hour. These costs have been applied to theinabta pumr-pa.,Z-e ann-ual totals as snoWn in Arm-ey 9.

RI, L... |
Page 2
b) Pumping costs froi; the present sources are basedon experience; the estimated costs for 1962/63were JD1I,000 for fuel and J-3,200 for power,with power costing 15 fils per kilowatt hour.As the power costs are to be reduced to 10 filsper kilowatt hour, but on the other hand thepresent souarces will be exploited more inten-sively and more water will. be pumped, it hasbeen assumed that the pumping costs from thepresent sources will rerain at around JD4,200per year.
8. Chlorine costs a.re calculated at a dosage of 2 mg per liter anda cost of JD265 per ton.
9. Annual maintenance costs are calculated at rates ccnsidered appro-priate for the soveral types of facilities and average 1.4X6. of capital costfor the new facilities (including interest during construction) and around1.75% for existing facilities0
10. Administrative and general costs are estimated at 25/a of salaries;contingencies wqere taken at 10% of the other operating costs.
11. Existing assets are ienreciated at a rate of 3.255 of the estimatedvalue of JD200,,000, which is close to the original cost. Mew assets (pluSinterest during constmentinn) nre depreciated at 2.5/&a assumidng no newfacilities are in operaition until completion of the project. The depreciationof new assets a.dded annually after completitoin of the project begins in theyear following their installation.
12. In the calculation of the fixed assets, as well as for depreciationa.nd laintena:aee a salvage vaIlue of th.e IPG pipe of M,4 per m -- total length17.5 hn - has been added (JD70,000) to construction costs and interest
13. ,Jo balance sheets are aailable for the. water epnartment. h1ut.allowjances hive been made in the cash flowvr for increases in working capitailequal to-( 251 of' the rerpndrlinH year's- l jncr-e-sPe in wanter reve7nues.
14. T+ has been assimed tha-t it+ will be +a l dri11 two morewells in nabta and add additional pumping units during the fiscal year19O70,7- (cost vm0,0r) for whl;ch enu,hcas'h must -enerated.
15. The1,2 ca-lcu4'ations fCor TabLile 6are b-asedI thu,s:
.a r r.LUJdit1eA I I, L±the UpjJp.Ly Cs C LA,.Lji U(wiU Ur ±UU
fications to existing springs) and the tra.ns-mri:ssion syteii, pl-us the sa.lvage value of IPCpipe total JD241,000, which is equal to 56", ofth1is sum (.JD241,000) pius the costs of the distri-bu-tion system and spring modifications (JDS17,000).This percenLage .was applied to the total projectcost of JD536,000 to arrive at incremental invest-men-t of D,30-0,000.

A 1tTT\1TV A 1.M~J.L'a'.A I )
Page 3
b) The incremental investment thus arrived at was multipliedby the overall depreciation factor of 2.5/) and a 4%ini,erest rate to arrive at an anrnual fixed cost ofJD19, 500.
c) Annual operating costs were assumed to be: one-forthof salaries;, the increase in power and fuel and chlorineover base year 1964/65, JD4,200 annual maintenance,one-fourth of administrative and general, and conti:n-gencies at 10%s of the foregoing.
d) The incremental water required froim Anabta is as shownin hnnex 9, without the operational pumping.

MAP I
< 7i~~~rber,os f<1 / 0 A/ |
r fi gS Irbid * 7 ./
g g ~/1Jenino ),\/
L Tulkarm 0Ajlu Mcfroqo \ .Zr / ! a:Ojarosh
.1 / ~~~Nrablus ,
Ramallh ' Soj ,Suweileh R, Zorqo
r i ~~~~Rcmallah q puef() O > A M MANJerichoo
Jeru!,alemb Kollioa Madaba
0 . , "^thlehem , *1 'l ./~~~~~~etl . '......
| ('Hebron
P , , W t S~~~~~~~A U DD
(it KarokO 0Octrono
Tof i l0n~ ~ ~ ~ ~ ~~ nE OIE Hasa
) di Musao
|. Mo'an
t ! ~~~~~~~Noqb Ashtar D R D A N|I !0 o lo 20 30 40 50 60
MILES
: p~Aqbcb_
JUNE 1963 [BR-105R'ERD- 1095R, 1

JO IR DAN
NABLUS WATER SUPPLYEXISTING SF'RING', AND DISTRIBUTION
T~~~~ ~ ~ ~~~~~~~~~~~~~~~~~~~~ 5-5e
--; c -j-< *,- --- i /(--,,, -,, A~~~~~~~~~~~~~~~~~~~~~~~~~~~~~~~~~~~~~~~~~~~- -- -- -
EXITING PlG N lRTH
A~~~~~~~~~~~~~~~~~~~~~~~~~~~~~~~~~~~~~~EIrN~' 1/
i S w t .</ XX , 0 0 'MN H~~~~~~~~~~~~~~~R W W
-~~~~~ PR~~~~1IsNG I (1RUIN STRET ------ O [ -EET^S X I
OUTER SPRING e .I, ,
zRESSIRE REOLCING VALVE S IUTI0N ------- IGG T
GATE VAL E-
GI.N AF-'~, -EXIST NG WAl ER RESTERIG6I ~ . ~ - - - ' AZXXRRr
---- -------- -
lOATER SUPPLY LINES - -
EHSTING GAS IV..Al HIS E /H~~(p - -; 3CR ,IILLRESEGUGIY~~~~~~~~~61 -----
ELEVATION IS GE rEPS V H /RSR
--X- ~ ~ ~ ~ ~ ~ ~ ~ ~ ~ ~ ~ ~ ~ ~ ~ ~ ~ ~ ~ ~ ~ ~ ~ ~ ~ ~ ~ ~ ~ ~ ~~~~~~~~~~~~~~~~~~~~~~~~~~~~~~~~~~~~~ER-w

t ! .--M M 18 t g tb tt i lt $ E~~~~~~~~~~J' - R D A N
|'- ABU FiESE nobta R 'o q, ; - IPROJIECT WE'LL FIELD AiND,lurqIA-, TRANSMISSION MAIN
el Labad
60cr
400
----0'----------;"-'------ ----- --t eit Lid' d0a ' ; O BLUS "
30c,~~~~~~~~~~~~~~~~~c
N -5 .o b4 i X l a\ e< l . .Bet Iba
-- ~~~~ _. RV E IR 0< RK;); \a>aticliya )NABLLJS Be8
P A I L R 0 A D , e v. ; . ,._ _=-,< , , * \ > ; ~ - I t c
0 5000 (000 55000 200020 250DO FEET,-,F''
IIUGUST !963 0BRD-IZOI R