issues related to uncertainty in risk assessment high to low dose extrapolation species to species...
TRANSCRIPT
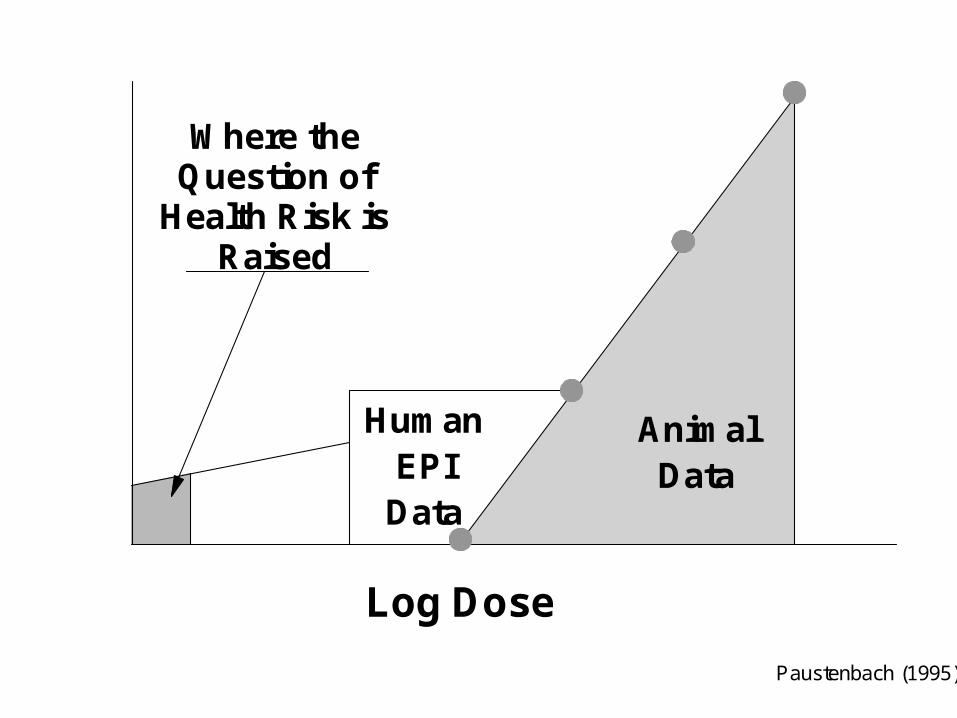
HumanEPI
Data
Where the Question of
Health Risk is Raised
Resp
on
se Log Dose
Paustenbach (1995)
AnimalData

Issues Related to Uncertainty in Risk Assessment
• High to low dose extrapolation
• Species to species extrapolation
• Mechanism of carcinogenesis
• Interindividual differences

• Chemicals that are carcinogenic in animals are expected to be carcinogenic in humans
• Humans are assumed to be as sensitive as the most sensitive animal
• The dose-response is assumed to be linear
Major Default Assumptions in Cancer Risk Assessment
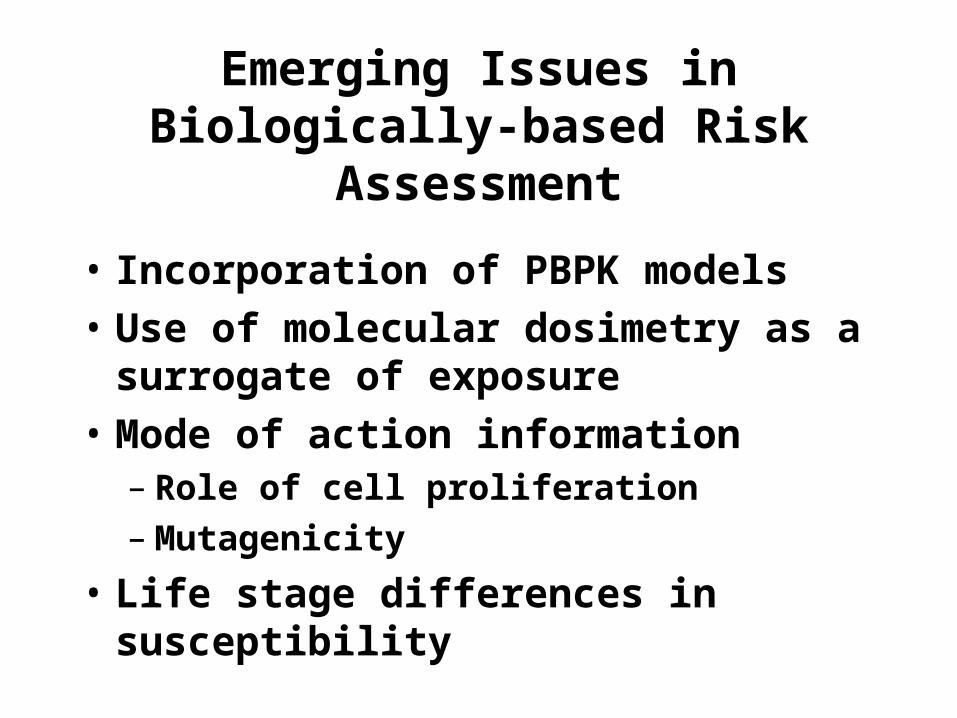
Emerging Issues in Biologically-based Risk Assessment
• Incorporation of PBPK models
• Use of molecular dosimetry as a surrogate of exposure
• Mode of action information– Role of cell proliferation– Mutagenicity
• Life stage differences in susceptibility

Potential of Molecular Dosimetry in Risk Assessment
• High to low dose extrapolation– Saturation of metabolic activation– Saturation of detoxication– Saturation of DNA repair
• Route to route differences
• Species to species differences
• Role of endogenous DNA damage

Chemical Exposure (air, water, food, etc.)
Internal Exposure
Metabolic Activation
Macromolecular Binding Detoxication
DNA RNA Protein
Biologically Effective Dose
X
Efficiency of Mispairing
X
Cell Proliferation
Biomarkers of Exposure
Mutation/Initiation
Progression Cancer
Biomarkers of Effect

ca
b
Increasing External Exposure
Inc
rea
sin
g A
dd
uc
t C
on
ce
ntr
ati
on
Sublinear
Supralinear

Role of Increased Cell Proliferation in Carcinogenesis
• Decreases time available for DNA repair
• Converts repairable DNA damage into nonrepairable mutations
• Necessary for chromosomal aberrations, insertions, deletions and gene amplification
• Clonally expands existing cell populations
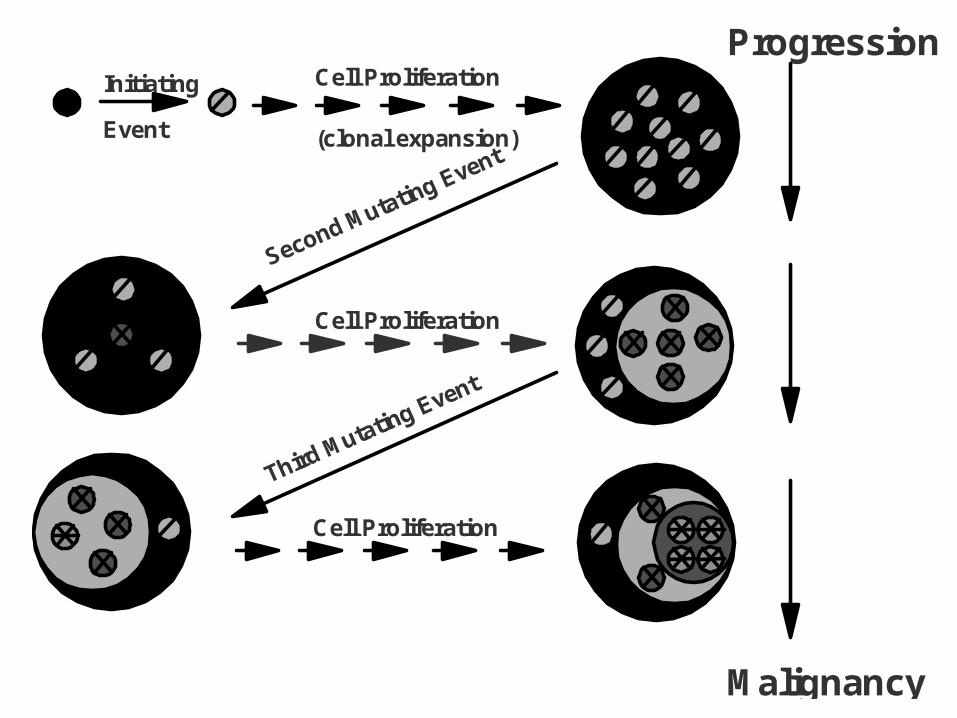
Initiating
Event
Cell Proliferation
(clonal expansion)
Progression
Cell Proliferation
Cell Proliferation
Malignancy
Second Mutating Event
Third Mutating Event
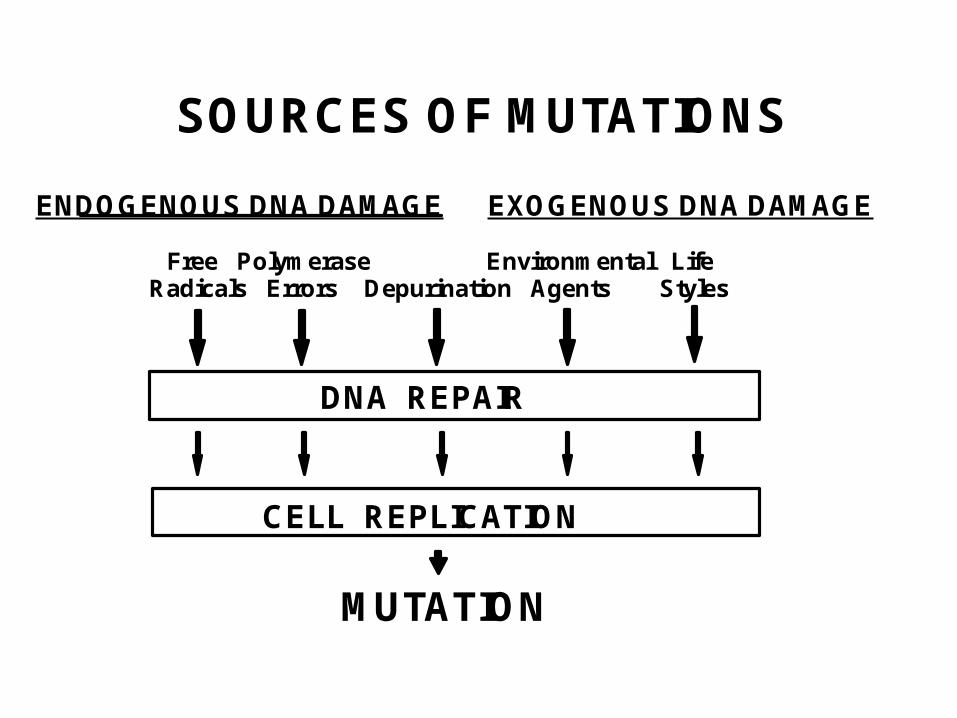
SOURCES OF MUTATIONS
ENDOGENOUS DNA DAMAGE EXOGENOUS DNA DAMAGE
Depurination
DNA REPAIR
MUTATION
LifeStyles
EnvironmentalAgents
FreeRadicals
PolymeraseErrors
CELL REPLICATION

Sources of DNA Damage
Spontaneous DNA Chemistry
Depurination
TA
G C
T A
TA
C
T A
Deamination
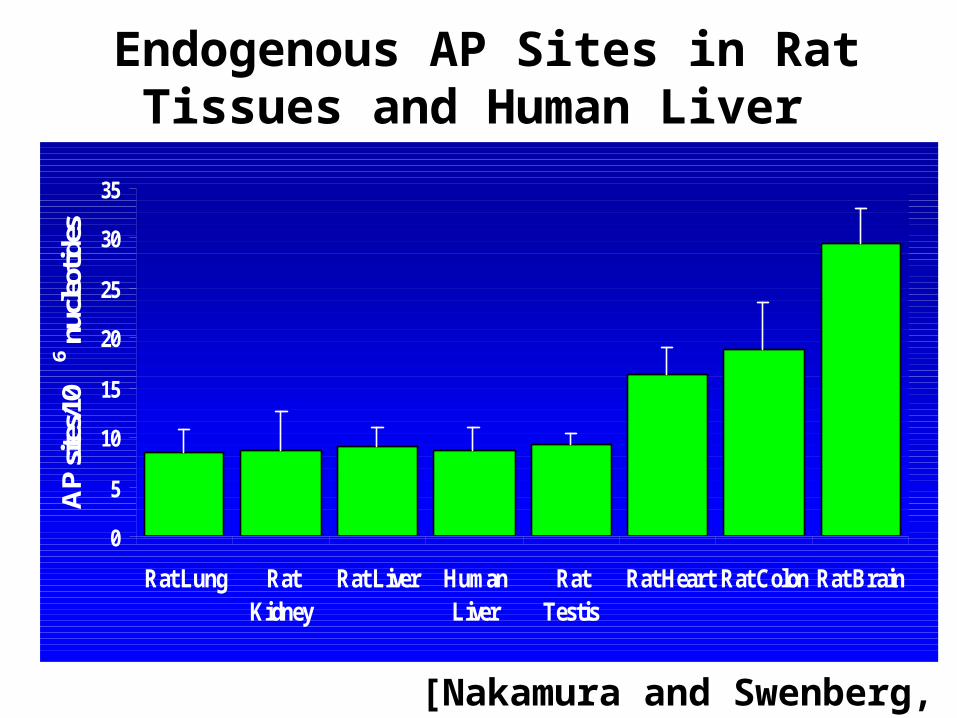
Endogenous AP Sites in Rat Tissues and Human Liver
0
5
10
15
20
25
30
35
Rat Lung RatKidney
Rat Liver HumanLiver
RatTestis
Rat Heart Rat Colon Rat Brain
AP
sites
/10
6 nuc
leot
ides
[Nakamura and Swenberg, 1999]
Oxidative Stress Induced-DNA Damage

Aldehydic DNA lesions (ADL) in HeLa cells exposed to H2O2 (0.06-20 mM) for 15
min
0
5
10
15
20
25
0 5 10 15 20
H2O 2 (mM)
AD
L/1,
000,
000
ntd

0
10
20
30
40
50
0.01 0.1 1 10 100H2O2 (mM)
Incr
ease
d A
DL
s/H
2O2
conc
entr
atio
n
Efficiency of Low Doses of H2O2
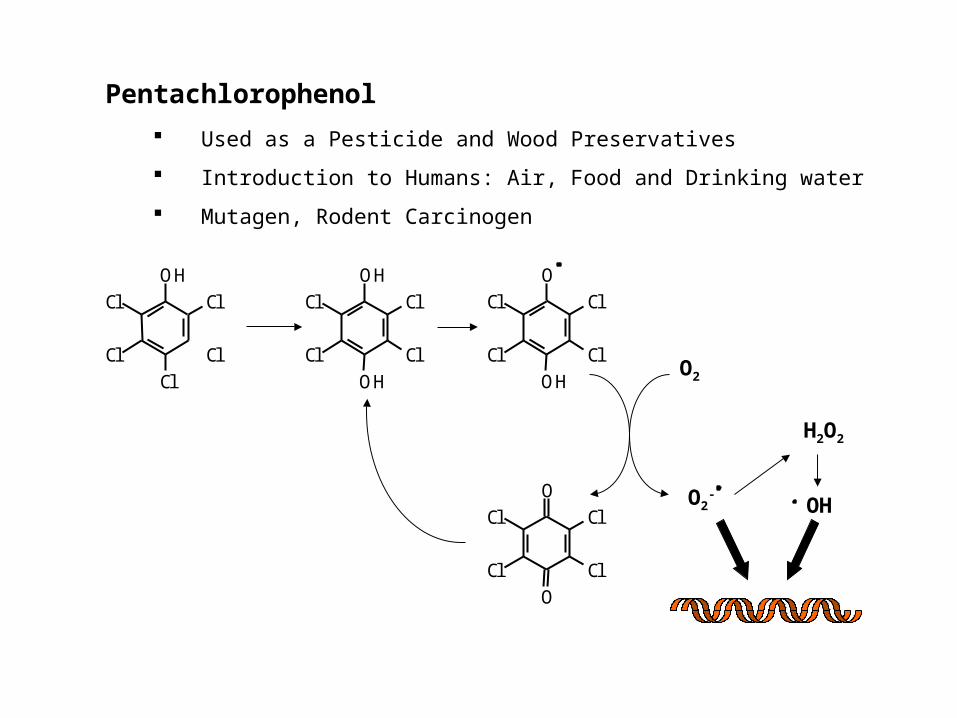
Pentachlorophenol
Used as a Pesticide and Wood Preservatives
Introduction to Humans: Air, Food and Drinking water
Mutagen, Rodent Carcinogen
OH
Cl
Cl
Cl
Cl
Cl
OH
Cl
Cl
OH
Cl
Cl
O
Cl
Cl
O
Cl
Cl
O
Cl
Cl
OH
Cl
Cl
O2
O2-
H2O2
OH

Induced Oxidative StressCalf Thymus DNA Exposed to TCHQCalf Thymus DNA Exposed to TCHQ
0
10
20
30
40
50
0.1 1 10 100 1000
TCHQ (uM)
8OH
dG
/dG
(10
e-6)
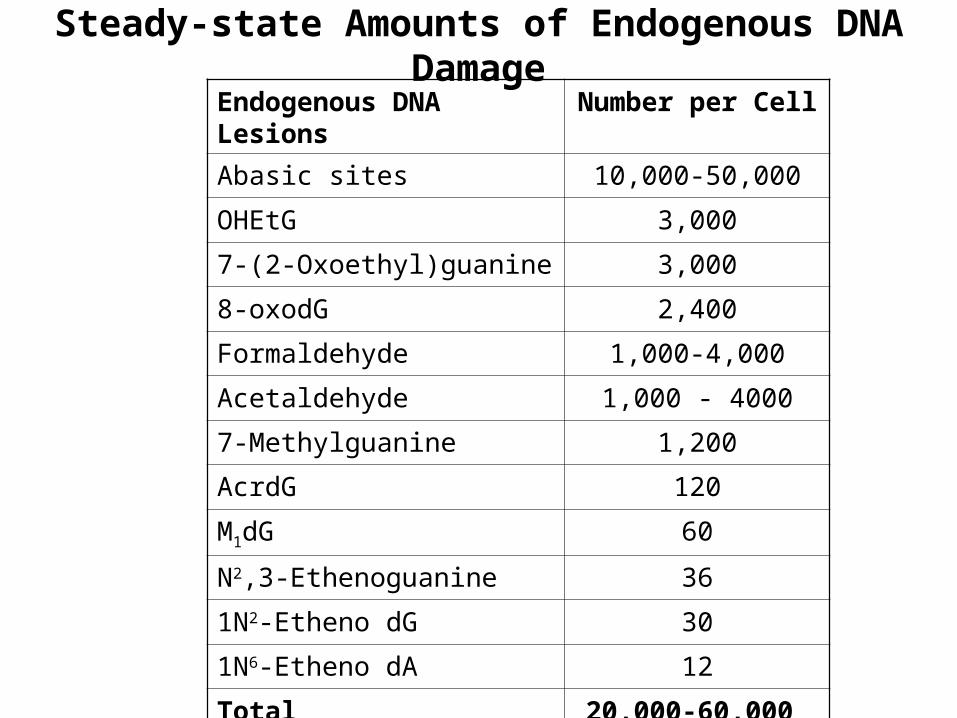
Steady-state Amounts of Endogenous DNA Damage
Endogenous DNA Lesions Number per Cell
Abasic sites 10,000-50,000
OHEtG 3,000
7-(2-Oxoethyl)guanine 3,000
8-oxodG 2,400
Formaldehyde 1,000-4,000
Acetaldehyde 1,000 - 4000
7-Methylguanine 1,200
AcrdG 120
M1dG 60
N2,3-Ethenoguanine 36
1N2-Etheno dG 30
1N6-Etheno dA 12
Total 20,000-60,000

Chemical-Specfic DNA Alkylation
N7AlkylGuanine
O6 Akyl Guanine
O4 Alkyl Thymine
O2 Alkyl Thymine
MMS 85% 0.3% - -
MNU
DMN
70% 7% 0.1% 0.4%
ENU
DEN
14% 7% 2% 7%
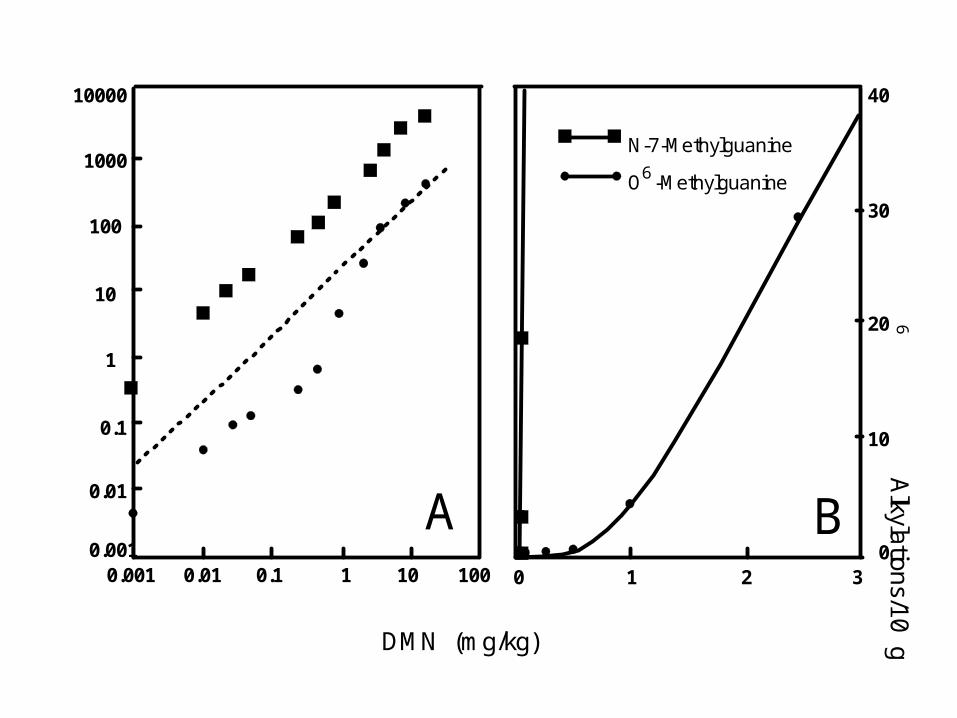
N-7-Methylguanine
O -Methylguanine
10000
1000
100
10
1
0.1
0.01
0.001 0.001 0.01 0.1 1 10 100
40
30
20
10
03210
6
DMN (mg/kg)
Alkylation
s/10 gu
anin
es
Alkylation
s/10 gu
anin
es
6 6
A B

0.00E+00
2.00E-06
4.00E-06
6.00E-06
8.00E-06
1.00E-05
1.20E-05
0 10 20 30 40 50 60 70 80
Duration of DEN exposure, days
Mo
lar
rati
o in
DN
A
O4-EtdThd
O6-EtdGuo

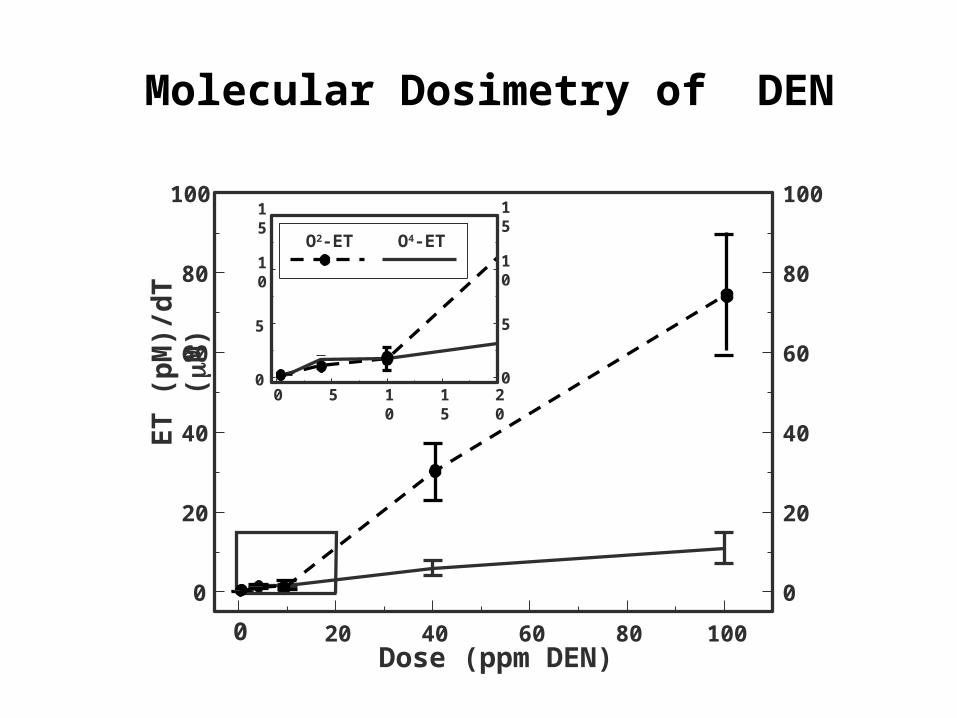
0 20 40 60 80 100
0
20
40
60
80
100
0
20
40
60
80
100
Dose (ppm DEN)
ET
(p
M)/
dT
(M
)
0 5 10 15 200
5
10
15
0
5
10
15
O2-ET O4-ET
Molecular Dosimetry of DEN

Vinyl Chloride
• Vinyl chloride is a known human and animal carcinogen that induces hepatic angiosarcomas
• Carcinogenic response is associated with high exposure (>50 ppm)
• To date, 197 VC workers have developed hepatic angiosarcomas. All of them started work prior to lowering the occupational exposure 1 ppm
• Vinyl chloride is present in many Superfund sites and some public drinking water in ppb amounts

Exposure-Response for Vinyl Chloride Metabolism and Carcinogenicity
0
5000
10000
0 1000 2000 3000 4000
VC Exposure (ppm)
n (
g / 6
hr)
(Gehring et al, 1978)
0.0
0.1
0.2
0 2000 4000 6000VC Exposure (ppm)
AS
L In
cid
ence
(Maltoni et al, 1981)

Formation of [13C2]-DNA Adducts by Vinyl Chloride
CH2Cl
O
Cl
N
NH
NN
N
OOH
dRib
N
NN
N
dRib
N
N
N
N
dRib
O
NH
NH2NN
NH
O
dRib
O
NH
NNN
N
O
dRib
CYP450 2E1
vinyl chloride chloroethylene oxide
DNA
HO-ethanodeoxyguanosine1,N6-ethenodeoxyadenosine 3,N4-ethenodeoxycytidine
7-(2-oxoethyl)-deoxyguanosine N2,3-ethenodeoxyguanosine
* ** *
* *
*
*
*
* *
*
**

Miscoding Properties of Vinyl Chloride DNA Adducts
7-(2-Oxoethyl)guanine(7OEG) None
N2,3-Ethenoguanine (εG) G → A
3,N4-Etheno-2’-deoxycytidine (εdC)
C → T
C → A
C → G
1,N6-Etheno-2’-deoxyadenosine (εdA)
A → T
A → C
A → G
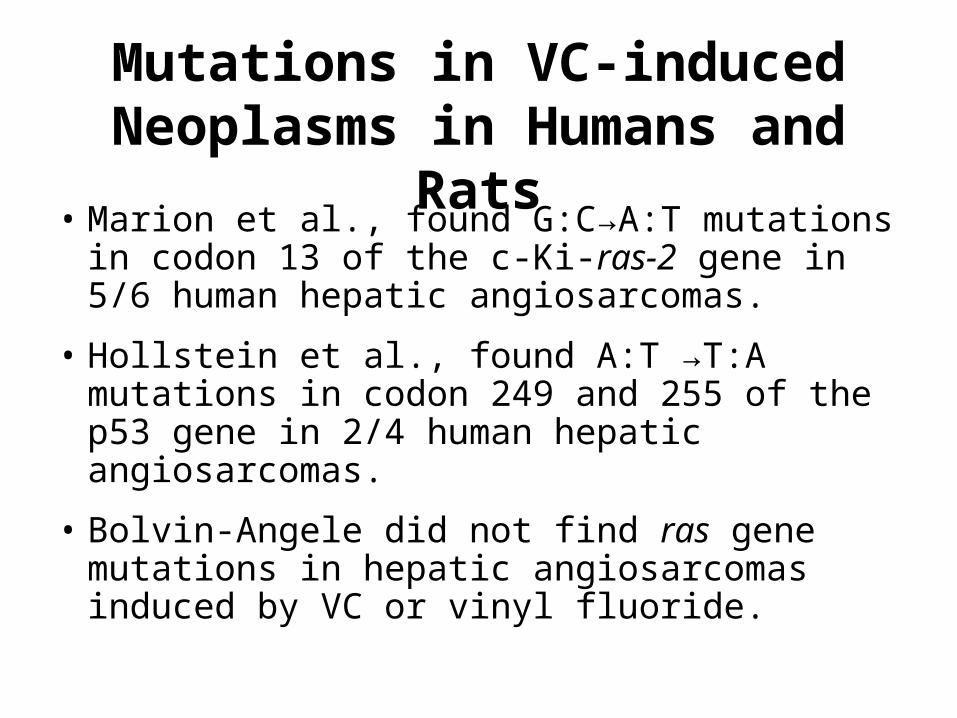
Mutations in VC-induced Neoplasms in Humans and Rats
• Marion et al., found G:C→A:T mutations in codon 13 of the c-Ki-ras-2 gene in 5/6 human hepatic angiosarcomas.
• Hollstein et al., found A:T →T:A mutations in codon 249 and 255 of the p53 gene in 2/4 human hepatic angiosarcomas.
• Bolvin-Angele did not find ras gene mutations in hepatic angiosarcomas induced by VC or vinyl fluoride.
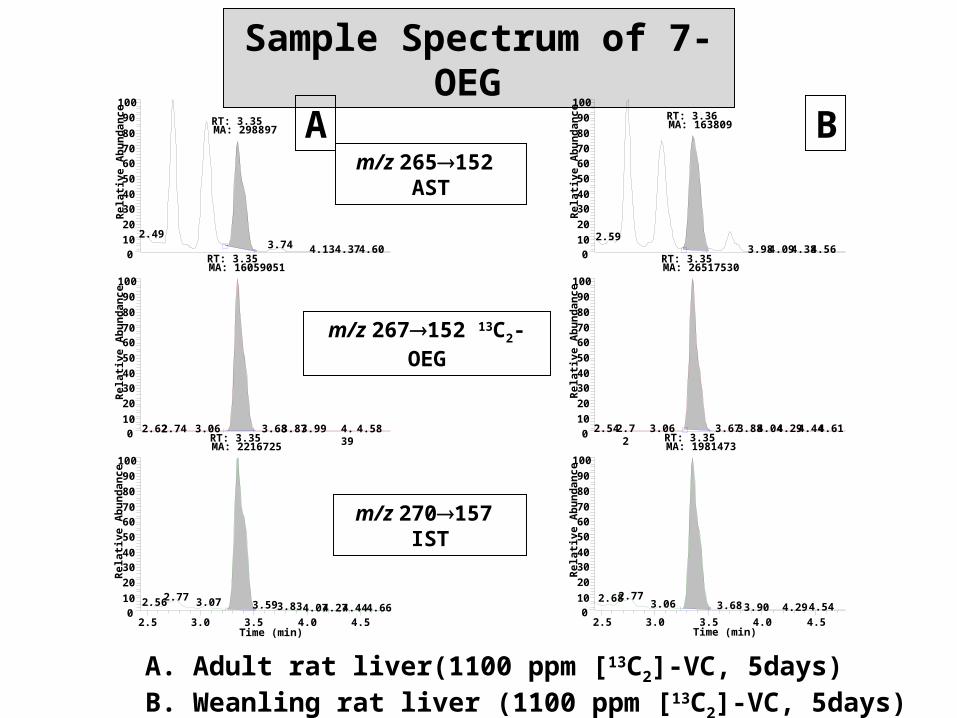
Sample Spectrum of 7-OEG
2.5 3.0 3.5 4.0 4.5Time (min)
010
20
3040
50
60
70
80
90
100
Rel
ativ
e A
bu
ndan
ce
0
10
20
30
40
50
60
70
80
90
100
Rel
ativ
e A
bu
ndan
ce
0
10
20
30
40
50
60
70
80
90
100
Rel
ativ
e A
bu
ndan
ce RT: 3.36MA: 163809
2.593.98 4.09 4.384.56
RT: 3.35MA: 26517530
3.06 3.67 3.884.042.72 4.442.54 4.29 4.61RT: 3.35MA: 1981473
2.772.68 3.06 3.68 4.543.90 4.29
m/z 265152 AST
m/z 267152 13C2-OEG
m/z 270157 IST
2.5 3.0 3.5 4.0 4.5Time (min)
0
10
20
30
40
50
60
70
80
90
100
Rel
ativ
e A
bu
ndan
ce
010
20
30
40
50
6070
80
90
100
Rel
ativ
e A
bu
ndan
ce
0
10
20
30
40
50
60
70
80
90
100
Rel
ativ
e A
bu
ndan
ce RT: 3.35MA: 298897
2.493.74 4.13 4.37 4.60
RT: 3.35MA: 16059051
3.06 3.683.872.74 3.992.62 4.39
4.58RT: 3.35MA: 2216725
2.77 3.072.56 3.59 3.83 4.444.07 4.664.27
A B
A. Adult rat liver(1100 ppm [13C2]-VC, 5days)B. Weanling rat liver (1100 ppm [13C2]-VC, 5days)
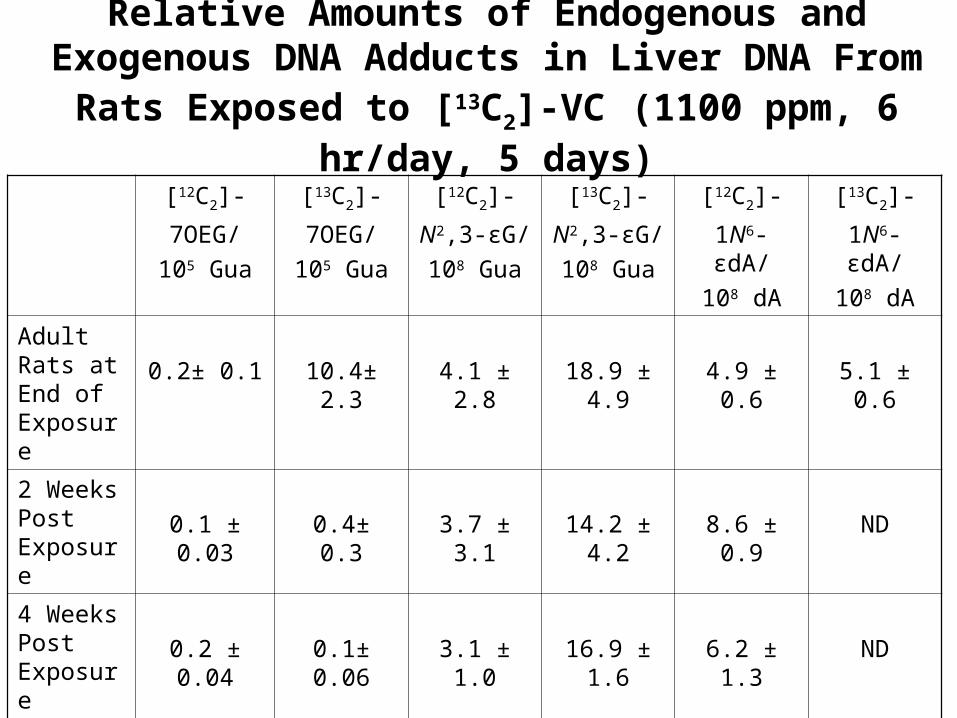
Relative Amounts of Endogenous and Exogenous DNA Adducts in Liver DNA From Rats Exposed to [13C2]-VC
(1100 ppm, 6 hr/day, 5 days)
[12C2]-
7OEG/
105 Gua
[13C2]-
7OEG/
105 Gua
[12C2]-
N2,3-εG/
108 Gua
[13C2]-
N2,3-εG/
108 Gua
[12C2]-
1N6- εdA/
108 dA
[13C2]-
1N6- εdA/
108 dA
Adult Rats at End of Exposure
0.2± 0.1 10.4± 2.3 4.1 ± 2.8 18.9 ± 4.9 4.9 ± 0.6 5.1 ± 0.6
2 Weeks Post Exposure
0.1 ± 0.03 0.4± 0.3 3.7 ± 3.1 14.2 ± 4.2 8.6 ± 0.9 ND
4 Weeks Post Exposure
0.2 ± 0.04 0.1± 0.06 3.1 ± 1.0 16.9 ± 1.6 6.2 ± 1.3 ND
8 Weeks Post Exposure
0.2 ± 0.07 ND 3.7 ± 1.5 13.2 ± 2.5 4.1 ± 0.5 ND

None
1100 ppm VC; 4 wk
1100 ppm VC; 4 wk10 ppm VC; 4 wk
None
None known
None known
Exposure
110 ± 40
15 ± 2
3.0 ± 0.8SD rat hepatocytes
16 ± 5Human colon
17 ± 2Human liver
10 ± 11
7.8 ± 2.1
SD rat brain
N2,3-G / 108 GSample
N2,3-G in Control and VC-exposed Samples
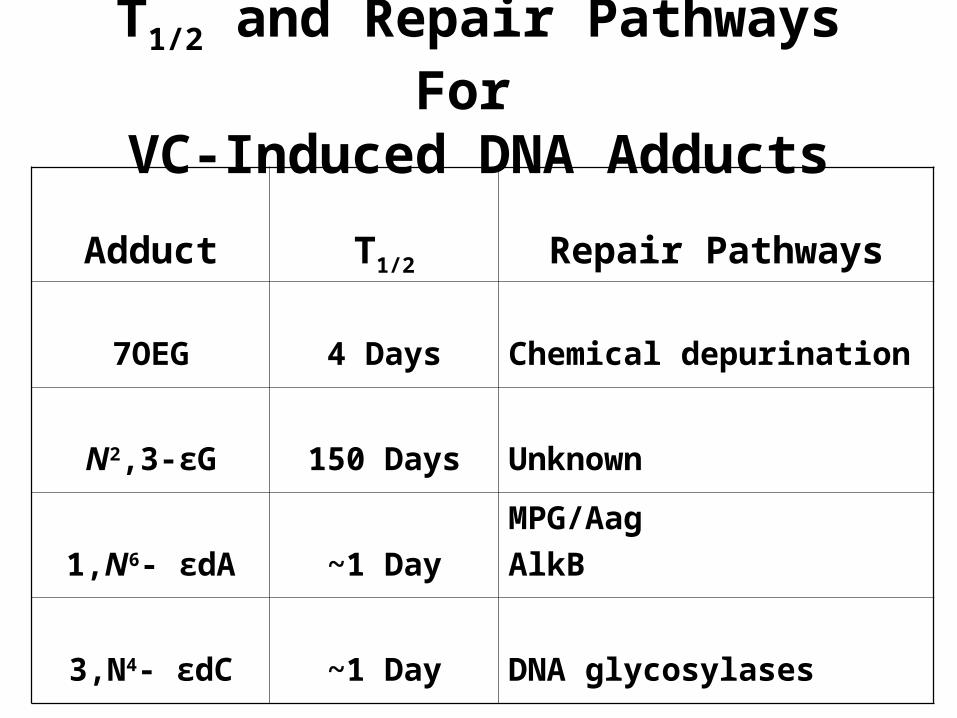
T1/2 and Repair Pathways For VC-Induced DNA Adducts
Adduct T1/2 Repair Pathways
7OEG 4 Days Chemical depurination
N2,3-εG 150 Days Unknown
1,N6- εdA ~1 Day
MPG/Aag
AlkB
3,N4- εdC ~1 Day DNA glycosylases

Vinyl Chloride Cancer Risk Estimates
1.6-3.7Rat
PBPK/LMS1995Clewell et
al
2000
1996
1989
1994
Year
1.4EpiChen & Blancato
4.4Rat (f)
1.0-2.3Mouse
0.3-2.8Epi
PBPK/LMSEPA
0.6RatPBPK/LMSReitz et al
0.7-1.4RatPBPK/LMS
84RatLMSEPA
Inhalation Risk
(per g/m3 x 10-6)DataModelAuthor(s)
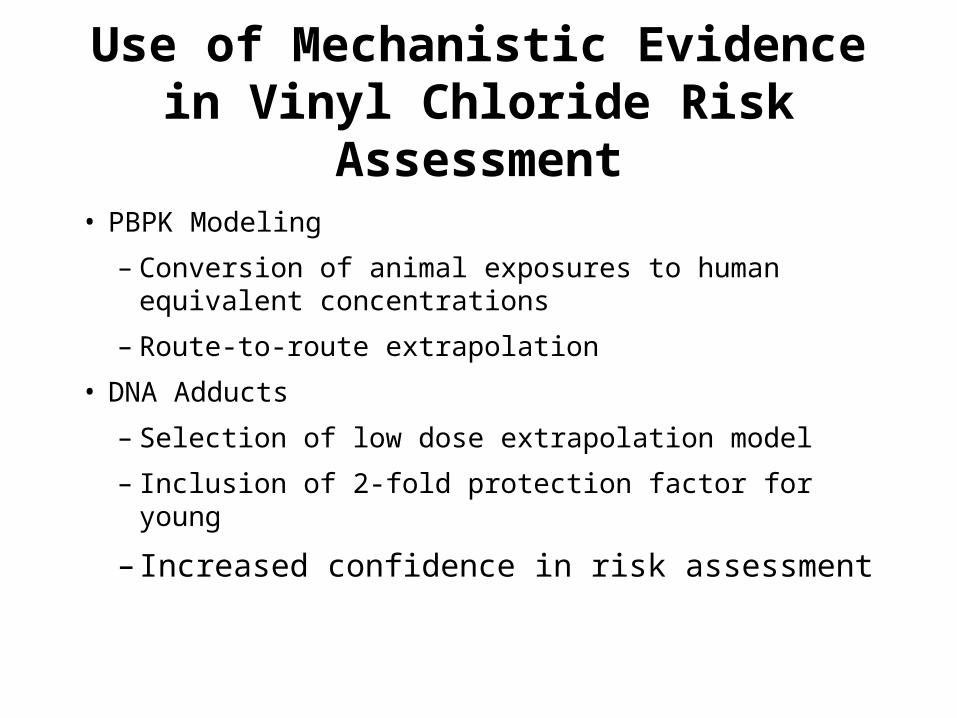
Use of Mechanistic Evidence in Vinyl Chloride Risk Assessment
• PBPK Modeling
– Conversion of animal exposures to human equivalent concentrations
– Route-to-route extrapolation
• DNA Adducts
– Selection of low dose extrapolation model
– Inclusion of 2-fold protection factor for young
– Increased confidence in risk assessment

Uncertainties in Vinyl Chloride Risk Assessments
• Relationship between low exposure and cancer has large uncertainty.
• High quality human exposure data are not available for individuals with angiosarcoma.
• There has not been any utilization of new data on endogenous DNA adducts.
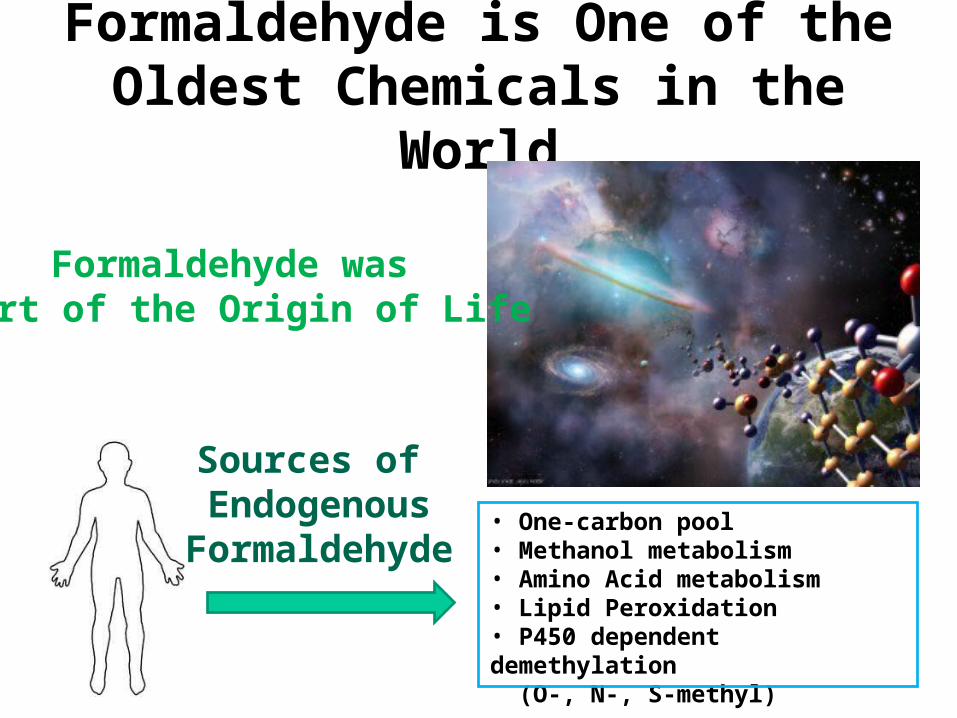
Formaldehyde is One of the Oldest Chemicals in the World
• One-carbon pool• Methanol metabolism• Amino Acid metabolism• Lipid Peroxidation• P450 dependent demethylation (O-, N-, S-methyl)
Sources of Endogenous
Formaldehyde
Formaldehyde was Part of the Origin of Life
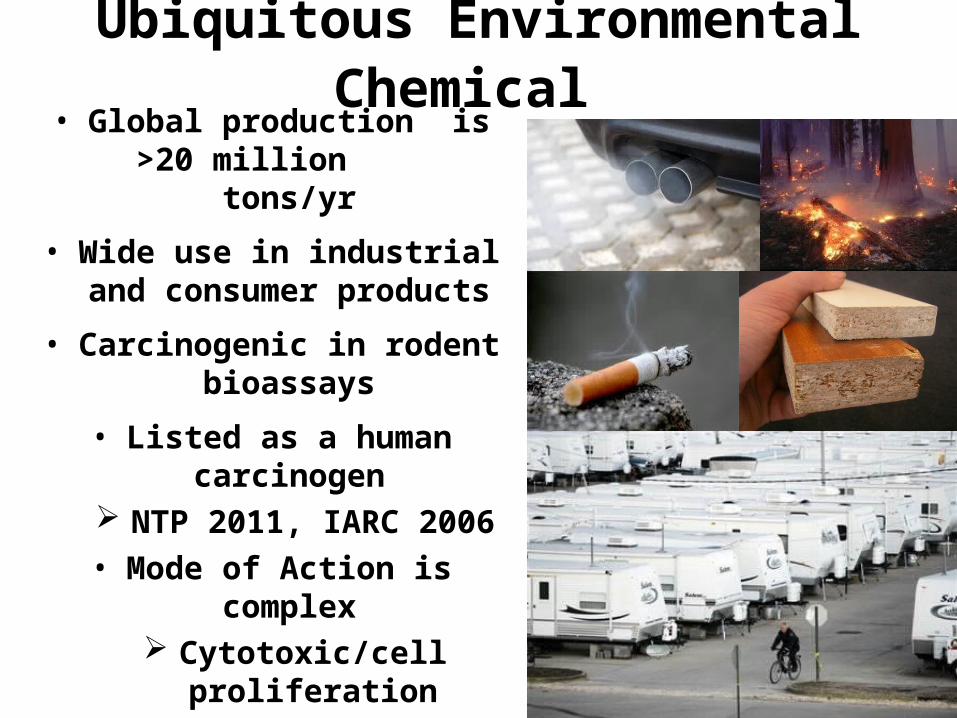
Ubiquitous Environmental Chemical • Global production is >20
million tons/yr
• Wide use in industrial and consumer products
• Carcinogenic in rodent bioassays
• Listed as a human carcinogen NTP 2011, IARC 2006
• Mode of Action is complex Cytotoxic/cell proliferation
Mutagenic Site of contact vs distant
sites Endogenously formed in all
cells

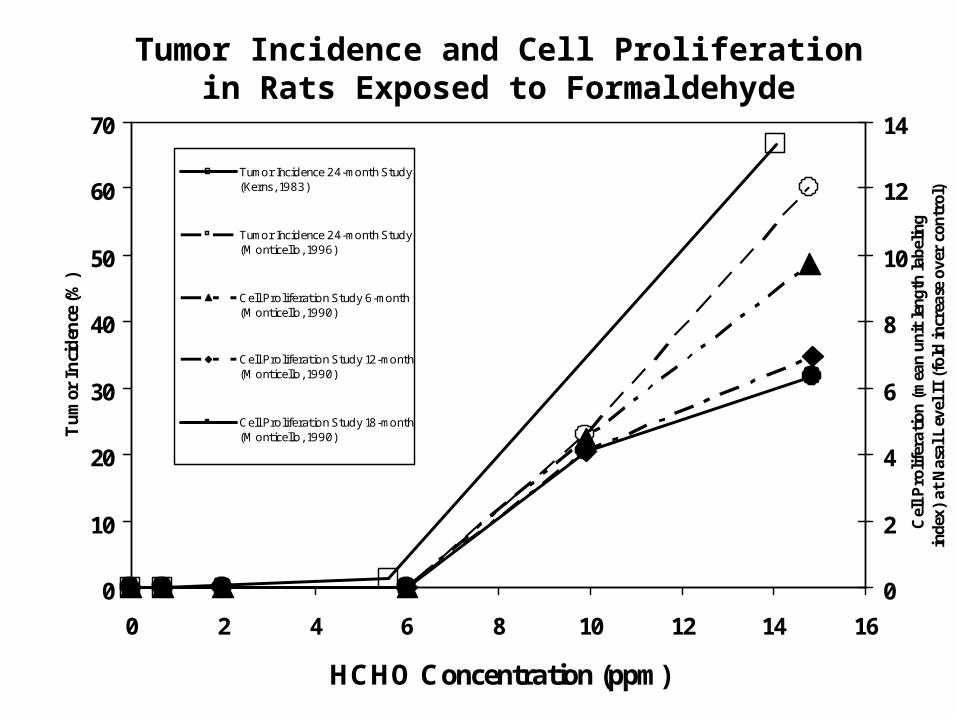
Carcinogenesis Bioassays• CIIT/Battelle studies in rats and mice
– 12 month sacrifice/interim report – 18 month data published in Cancer
Research (Swenberg ,et al 1980)– Final report and Cancer Research
paper on the study (Kerns, et al. 1983)• CIIT expanded the exposure range and
mechanistic designs in a second bioassay published in Cancer Research (Monticello, et al, 1996)
• Subsequent cancer bioassays– Inhalation studies– Oral studies
0
10
20
30
40
50
60
70
0 2 4 6 8 10 12 14 16
HCHO Concentration (ppm)
Tu
mor
In
cid
ence
(%
)
0
2
4
6
8
10
12
14
Cel
l Pro
lifer
atio
n (m
ean
unit
leng
th la
belin
g in
dex)
at
Nas
al L
evel
II
(fol
d in
crea
se o
ver
cont
rol)
Tumor Incidence 24-month Study(Kerns, 1983)
Tumor Incidence 24-month Study(Monticello, 1996)
Cell Proliferation Study 6-month(Monticello, 1990)
Cell Proliferation Study 12-month(Monticello, 1990)
Cell Proliferation Study 18-month(Monticello, 1990)
Tumor Incidence and Cell Proliferation in Rats Exposed to Formaldehyde

Epidemiology of Formaldehydeand Cancer
• Nasopharyngeal Cancer– The NCI cohort found an increase in NPC, while other
studies have been negative.• Only 1 plant out of 10 had an increased incidence of NPC
• The same plant was in a region known for silversmithing and metal working, two known causes of NPC.
• The extent of formaldehyde exposure was not associated with the increase in NPC.
• While biologic plausibility is clearly present, the lack of consistency between studies and the lack of an exposure relationship in positive studies weakens the conclusion.
• Confounding cannot be eliminated.

Epidemiology of Formaldehydeand Cancer (Cont.)
• Myeloid Leukemia– No evidence has been provided that demonstrates that
formaldehyde gets to sites distant to the portal of entry.
– While several studies have shown associations, equal numbers of studies have not.
– No mechanisms have been identified for the induction of leukemia by formaldehyde.
– Thus, the biologic plausibility of inhaled formaldehyde causing leukemia is weak.

• Formaldehyde is a ubiquitous environment pollutant, but it is also an essential metabolite in all living cells. Therefore, both endogenous and exogenous formaldehyde is present.
• Formaldehyde is very reactive with DNA and proteins, leading to diverse protein adducts and DNA damage.
ProteinN CH2
ProteinCH2
CH2OH
H2C
O
H H
glutathione
S-hydroxymethyl-glutathione
ADH3
S-formylglutathione
S-formylglutathionehydrolase
formate
CO2+H2O
glutathione
endogenous sources
exogenous sources
ALDH1A1ALDH2
one carbon
pool
adduct formation
Fate and metabolism of formaldehyde
Adapted for IARC monograph 88
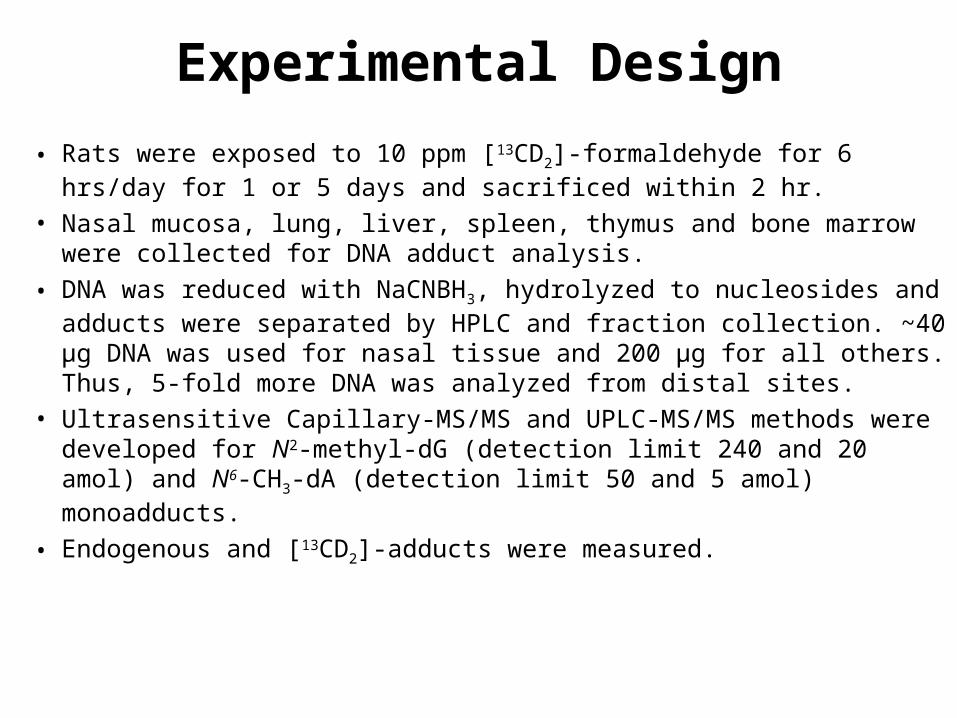
Experimental Design
• Rats were exposed to 10 ppm [13CD2]-formaldehyde for 6 hrs/day for 1 or 5 days and sacrificed within 2 hr.
• Nasal mucosa, lung, liver, spleen, thymus and bone marrow were collected for DNA adduct analysis.
• DNA was reduced with NaCNBH3, hydrolyzed to nucleosides and adducts were separated by HPLC and fraction collection. ~40 µg DNA was used for nasal tissue and 200 µg for all others. Thus, 5-fold more DNA was analyzed from distal sites.
• Ultrasensitive Capillary-MS/MS and UPLC-MS/MS methods were developed for N2-methyl-dG (detection limit 240 and 20 amol) and N6-CH3-dA (detection limit 50 and 5 amol) monoadducts.
• Endogenous and [13CD2]-adducts were measured.

NH
N
N
O
NH2N
O
HOH
HHHH
HO
NH
N
N
O
NH
N
O
HOH
HHHH
HOCH3
NH
N
N
O
NH
N
O
HOH
HHHH
HOCH2OH
NaCNBH3
HH
O
NH
N
N
O
NH
N
O
HOH
HHHH
HO
13CD2H
NH
N
N
O
NH
N
O
HOH
HHHH
HO
13CD2OH
NaCNBH3D13C
D
O
m/z=282.2
m/z=285.2
endogenous
exogenous
The formation of N2-hydroxymethyl-dG originating from both endogenous and exogenous formaldehyde.

6.0 6.5 7.0 7.5
0
20
40
60
80
100
0
20
40
60
80
100
0
20
40
60
80
100
RT: 7.55
RT: 7.52
RT: 7.54
6.0 6.5 7.0 7.5
RT: 7.56
RT: 7.54
RT: 7.54
0
20
40
60
80
100
0
20
40
60
80
100
0
20
40
60
80
100
6.0 6.5 7.0 7.5
Time (min)
RT: 7.53
RT: 7.53
0
20
40
60
80
100
0
20
40
60
80
100
0
20
40
60
80
100A. B. C.
Endogenous
Exogenous
Internal standard
Endogenous
Exogenous
Internal standard
Endogenous
Exogenous
Internal standard
100
100
6.0 6.5 7.0 7.5
RT: 7.55
RT: 7.56
0
20
40
60
80
0
20
40
60
80
0
20
40
60
80
100 D.
Endogenous
Exogenous
Internal standard
Time (min) Time (min) Time (min)
1 day-exposed nasal epithelium (A), 5 day-exposed nasal epithelium (B), bone marrow (C) and spleen (D).
LC-ESI-MS/MS SRM chromatograms of N2-Me-dG in typical tissues

Exposure period Tissues
N2-HOCH2-dG (adducts/107 dG)
N6-HOCH2-dA (adducts/107 dA)
exogenous endogenous exogenous endogenous
1 day
Nose 1.28±0.49* 2.63±0.73 n.d. 3.95±0.26
Lung n.d.+ 2.39±0.16‡ n.d. 2.62±0.24
Liver n.d. 2.66±0.53 n.d. 2.62±0.46 #
Spleen n.d. 2.35±0.31 n.d. 1.85±0.19
Bone Marrow n.d. 1.05±0.14 n.d. 2.95±1.32
Thymus n.d. 2.19±0.36 n.d. 2.98±1.11
5 day
Nose 2.43±0.78 2.84±1.13 n.d. 3.61±0.95
Lung n.d. 2.61±0.35 n.d. 2.47±0.55
Liver n.d. 3.24±0.42 n.d. 2.87±0.65
Spleen n.d. 2.35±0.59 n.d. 2.23±0.89
Bone Marrow n.d. 1.17±0.35 n.d. 2.99±0.08
Thymus n.d. 1.99±0.30 n.d. 2.48±0.11
Formaldehyde-induced monoadducts in tissues of rats exposed to 10 ppm [13CD2]-formaldehyde for 1 day or 5 days
# Endogenous N6-HOCH2-dA was present in control rat liver at 1.96±1.86 adducts/107 dA
From Cheng et al., Chem. Res. Toxicol. 21, 746-751,2008.
RT: 8.00 - 12.00 SM: 9G
8 9 10 11 12Time (min)
0
500000
1000000
1500000
2000000
2500000
30000000
500000
1000000
1500000
2000000
2500000
3000000
Inte
nsi
ty
0
500000
1000000
1500000
2000000
2500000
3000000
RT: 10.30
RT: 10.30
RT: 10.31
NL: 3.00E6TIC F: + p NSI SRM ms2 282.200 [165.600-166.600] MS ICIS Me_dG_09272010_05
NL: 3.00E6TIC F: + p NSI SRM ms2 285.200 [168.600-169.600] MS ICIS Me_dG_09272010_05
NL: 3.00E6TIC F: + p NSI SRM ms2 297.200 [175.600-176.600] MS ICIS Me_dG_09272010_05
Endogenous282.2 → 166.1 m/z
Exogenous285.2 → 169.1 m/z
Internal Standard297.2 → 176.1 m/z
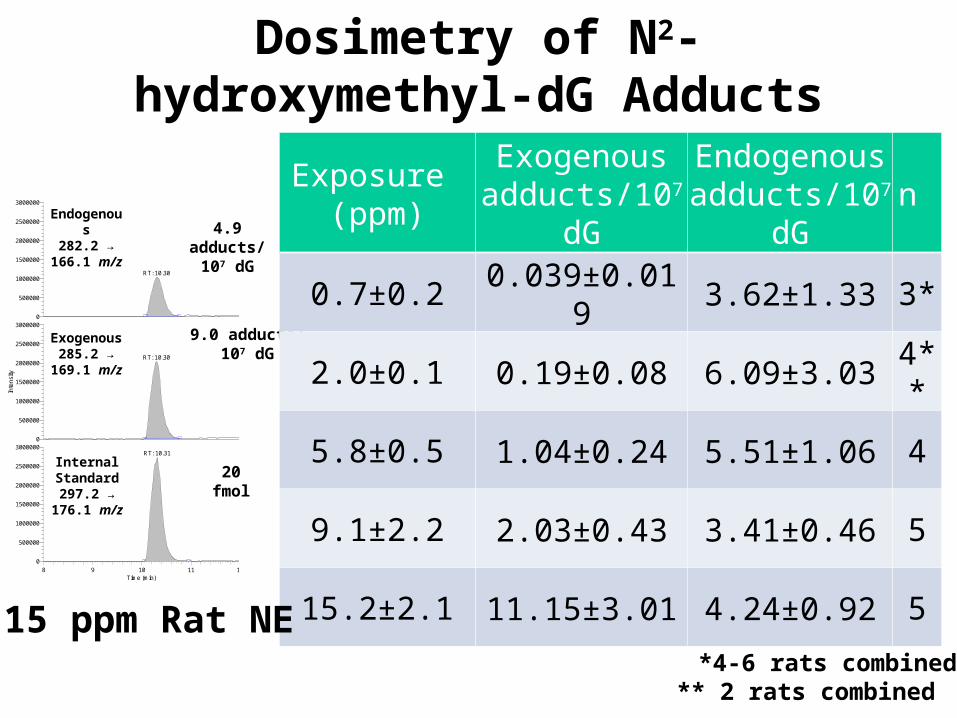
4.9 adducts/107 dG
9.0 adducts/107 dG
20 fmol
Exposure (ppm)
Exogenous adducts/107
dG
Endogenous adducts/107
dGn
0.7±0.2 0.039±0.019 3.62±1.33 3*
2.0±0.1 0.19±0.08 6.09±3.03 4**
5.8±0.5 1.04±0.24 5.51±1.06 4
9.1±2.2 2.03±0.43 3.41±0.46 5
15.2±2.1 11.15±3.01 4.24±0.92 5
*4-6 rats combined** 2 rats combined
Dosimetry of N2-hydroxymethyl-dG Adducts
15 ppm Rat NE

Non-Linear Dose Response for Formaldehyde DNA Monoadducts

Non-Human Primate Study
• 13CD2O Exposure for 2 days (6 hours/day)
• Cynomolgus Macaque
• Tissues (to date)
– Nasal Maxilloturbinate
– Femoral Bone Marrow
• Exposure Levels
– 2 ppm (n=4)
– 6 ppm (n=4)
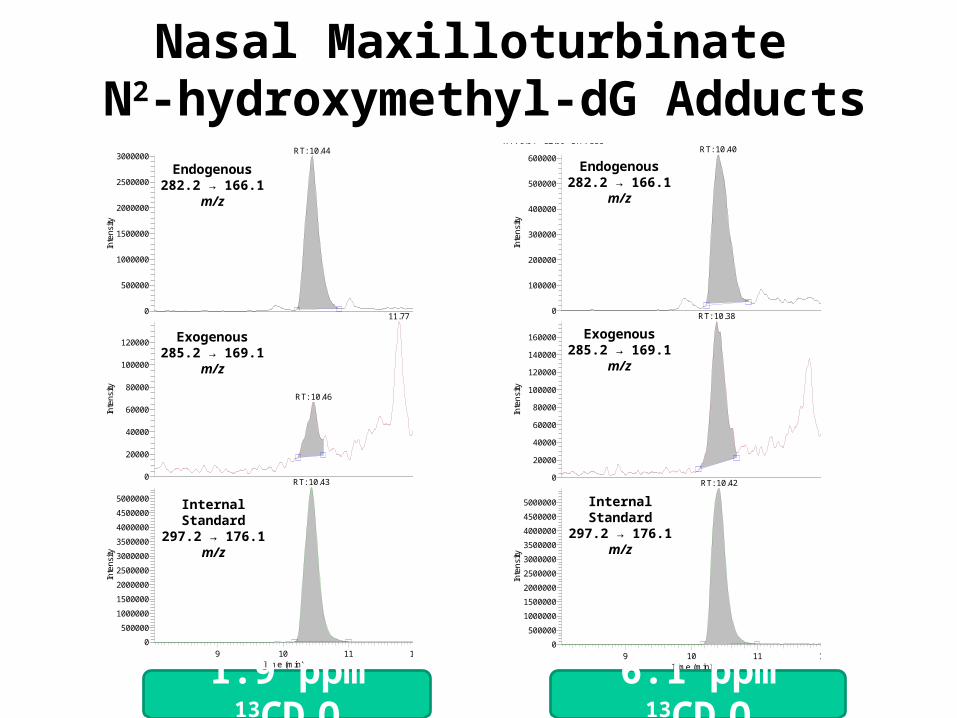
Nasal Maxilloturbinate N2-hydroxymethyl-dG Adducts
RT: 8.04 - 12.00 SM: 13G
9 10 11 12Time (min)
0
500000
1000000
1500000
2000000
2500000
3000000
3500000
4000000
4500000
5000000
Inte
nsi
ty
0
20000
40000
60000
80000
100000
120000
Inte
nsity
0
500000
1000000
1500000
2000000
2500000
3000000
Inte
nsity
RT: 10.44
RT: 10.46
11.77
RT: 10.43
NL: 3.00E6TIC F: + p NSI SRM ms2 282.200 [165.600-166.600] MS ICIS Monkey_Me_dG_092910_06
NL: 1.39E5TIC F: + p NSI SRM ms2 285.200 [168.600-169.600] MS Monkey_Me_dG_092910_06
NL: 5.40E6TIC F: + p NSI SRM ms2 297.200 [175.600-176.600] MS ICIS Monkey_Me_dG_092910_06
Endogenous282.2 → 166.1 m/z
Exogenous285.2 → 169.1 m/z
Internal Standard297.2 → 176.1 m/z
RT: 8.04 - 12.00 SM: 11G
9 10 11 12Time (min)
0
500000
1000000
1500000
2000000
2500000
3000000
3500000
4000000
4500000
5000000
Inte
nsi
ty
0
20000
40000
60000
80000
100000
120000
140000
160000
Inte
nsi
ty
0
100000
200000
300000
400000
500000
600000
Inte
nsi
ty
RT: 10.40
RT: 10.38
RT: 10.42
NL: 6.14E5TIC F: + p NSI SRM ms2 282.200 [165.600-166.600] MS ICIS Monkey_Me_dG_092910_07
NL: 1.78E5TIC F: + p NSI SRM ms2 285.200 [168.600-169.600] MS Monkey_Me_dG_092910_07
NL: 5.50E6TIC F: + p NSI SRM ms2 297.200 [175.600-176.600] MS ICIS Monkey_Me_dG_092910_07
Endogenous282.2 → 166.1 m/z
Exogenous285.2 → 169.1 m/z
Internal Standard297.2 → 176.1 m/z
1.9 ppm 13CD2O 6.1 ppm 13CD2O
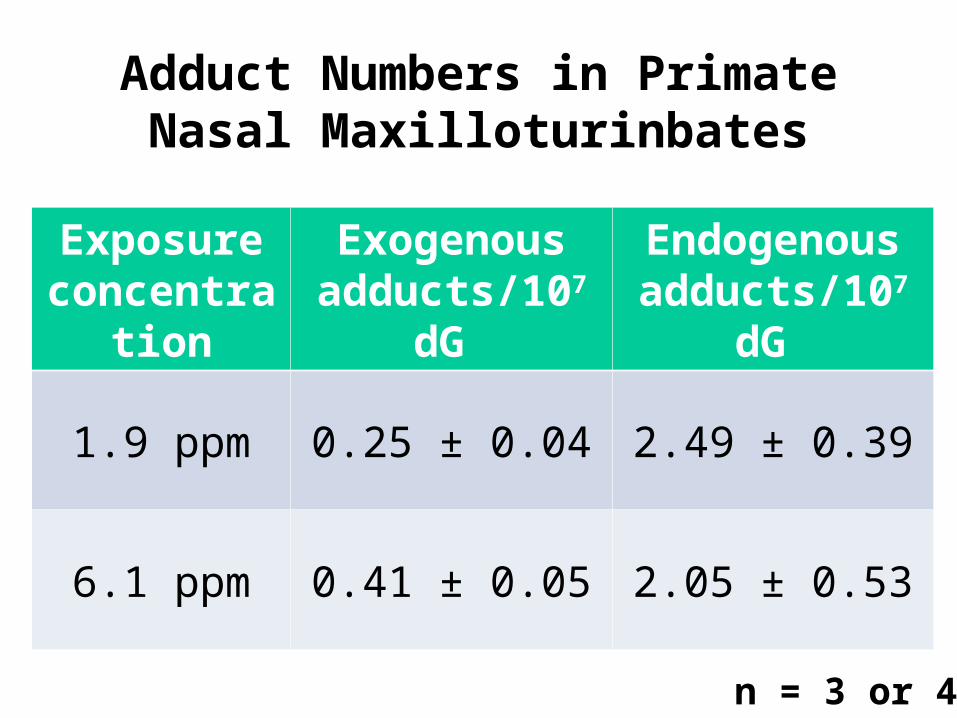
Adduct Numbers in Primate Nasal Maxilloturinbates
Exposure concentrati
on
Exogenous adducts/107
dG
Endogenous adducts/107
dG
1.9 ppm 0.25 ± 0.04 2.49 ± 0.39
6.1 ppm 0.41 ± 0.05 2.05 ± 0.53
n = 3 or 4

Species Comparisons
1 day 1 day 2 day2 day
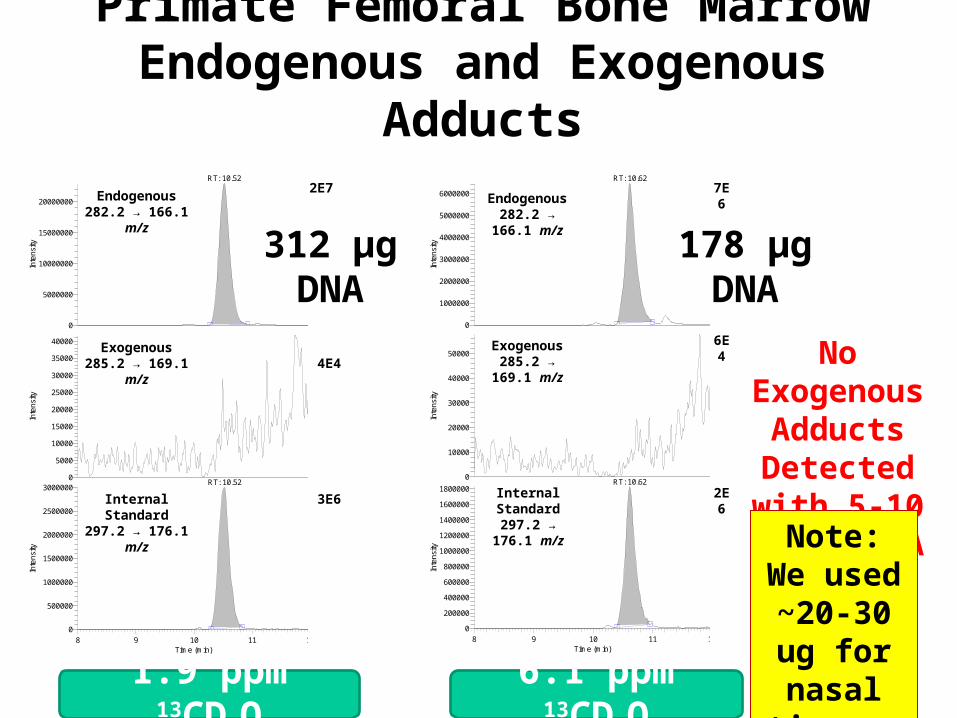
Primate Femoral Bone Marrow Endogenous and Exogenous Adducts
1.9 ppm 13CD2O 6.1 ppm 13CD2O
312 µg DNA
RT: 8.00 - 12.00 SM: 7G
8 9 10 11 12Time (min)
0
200000
400000
600000
800000
1000000
1200000
1400000
1600000
1800000
Inte
nsity
0
10000
20000
30000
40000
50000
Inte
nsity
0
1000000
2000000
3000000
4000000
5000000
6000000
Inte
nsity
RT: 10.62
RT: 10.62
NL: 6.48E6TIC F: + p NSI SRM ms2 282.200 [165.600-166.600] MS ICIS Monkey_Me_dG_092910_10
NL: 5.76E4TIC F: + p NSI SRM ms2 285.200 [168.600-169.600] MS Monkey_Me_dG_092910_10
NL: 1.83E6TIC F: + p NSI SRM ms2 297.200 [175.600-176.600] MS ICIS Monkey_Me_dG_092910_10
7E6
6E4
2E6
Endogenous282.2 → 166.1
m/z
Exogenous285.2 → 169.1
m/z
Internal Standard
297.2 → 176.1 m/z
178 µg DNA
No Exogenous Adducts
Detected with 5-10 fold >DNA
RT: 8.00 - 12.00 SM: 7G
8 9 10 11 12Time (min)
0
500000
1000000
1500000
2000000
2500000
3000000
Inte
nsity
0
5000
10000
15000
20000
25000
30000
35000
40000
Inte
nsity
0
5000000
10000000
15000000
20000000
Inte
nsity
RT: 10.52
RT: 10.52
NL: 2.30E7TIC F: + p NSI SRM ms2 282.200 [165.600-166.600] MS ICIS Monkey_Me_dG_092910_11
NL: 4.18E4TIC F: + p NSI SRM ms2 285.200 [168.600-169.600] MS Monkey_Me_dG_092910_11
NL: 3.01E6TIC F: + p NSI SRM ms2 297.200 [175.600-176.600] MS ICIS Monkey_Me_dG_092910_11
2E7
4E4
3E6
Endogenous282.2 → 166.1 m/z
Exogenous285.2 → 169.1 m/z
Internal Standard297.2 → 176.1 m/z
Note: We used ~20-30 ug for
nasal tissue
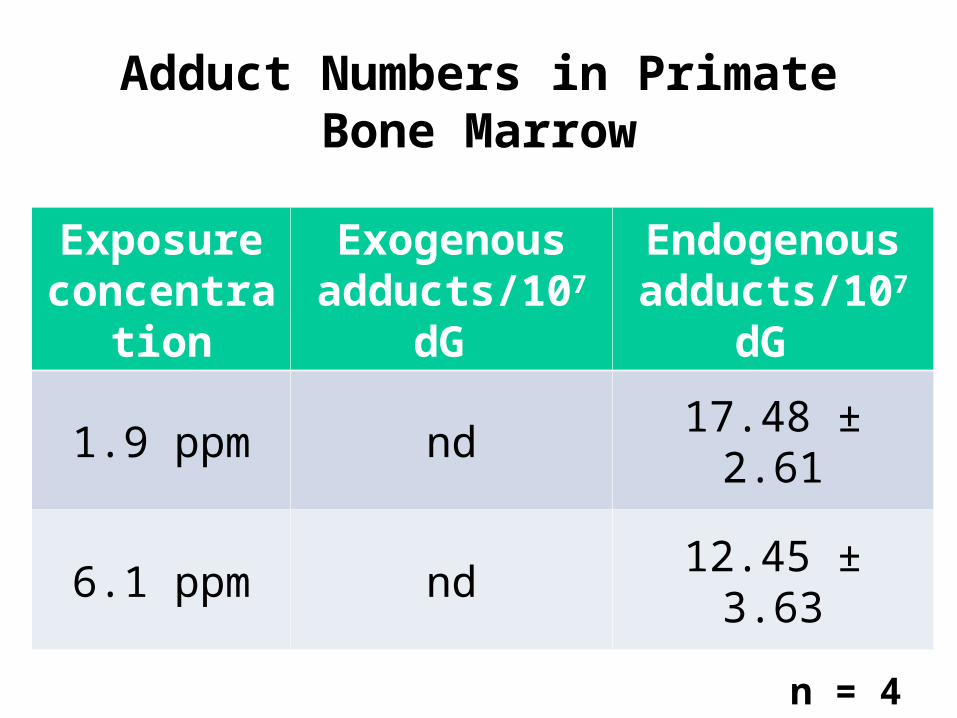
Adduct Numbers in Primate Bone Marrow
Exposure concentrati
on
Exogenous adducts/107
dG
Endogenous adducts/107
dG
1.9 ppm nd 17.48 ± 2.61
6.1 ppm nd 12.45 ± 3.63
n = 4

Conclusions• Both cytotoxicity and genotoxicity are key events for the
induction of nasal carcinoma.
• The sustained increase in cell proliferation that results from formaldehyde cytotoxicity “fixes” both endogenous and exogenous DNA adducts into heritable mutations.
• If a rat was placed in a FEMA trailer for 6 hours, only 91/100,000 formaldehyde adducts would come from the exposure. The rest are endogenous.
• A 6 hr exposure of a rat to the USEPA proposed safe level of formaldehyde (0.07 ppt) would induce 83/100,000,000 adducts.
• The lack of exogenous formaldehyde adduct formation in bone marrow and other distant sites does not support the biologic plausibility of leukemia.
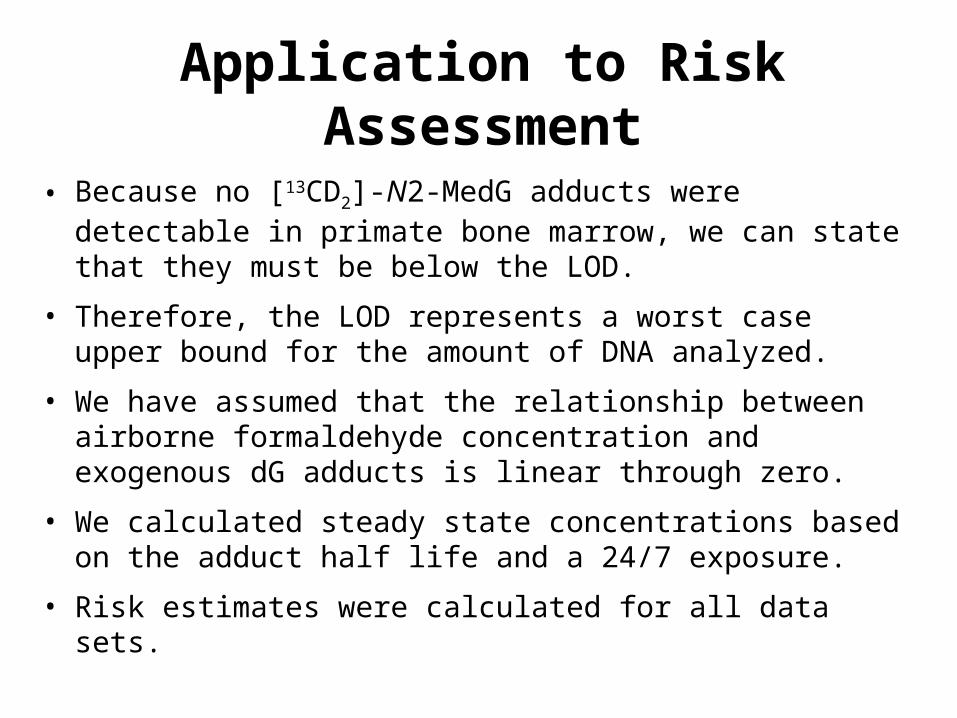
Application to Risk Assessment
• Because no [13CD2]-N2-MedG adducts were detectable in primate bone marrow, we can state that they must be below the LOD.
• Therefore, the LOD represents a worst case upper bound for the amount of DNA analyzed.
• We have assumed that the relationship between airborne formaldehyde concentration and exogenous dG adducts is linear through zero.
• We calculated steady state concentrations based on the adduct half life and a 24/7 exposure.
• Risk estimates were calculated for all data sets.
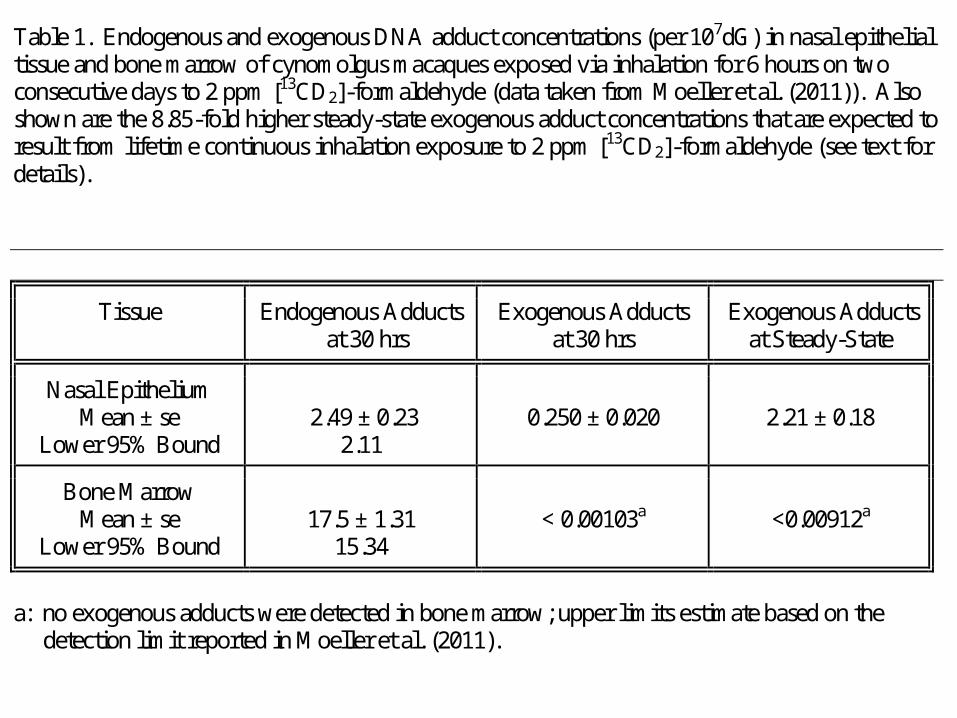
Table 1. Endogenous and exogenous DNA adduct concentrations (per 107dG) in nasal epithelial tissue and bone marrow of cynomolgus macaques exposed via inhalation for 6 hours on two consecutive days to 2 ppm [13CD2]-formaldehyde (data taken from Moeller et al. (2011)). Also shown are the 8.85-fold higher steady-state exogenous adduct concentrations that are expected to result from lifetime continuous inhalation exposure to 2 ppm [13CD2]-formaldehyde (see text for details).
Tissue Endogenous Adducts at 30 hrs
Exogenous Adducts at 30 hrs
Exogenous Adducts at Steady-State
Nasal Epithelium Mean ± se
Lower 95% Bound
2.49 ± 0.23
2.11
0.250 ± 0.020
2.21 ± 0.18
Bone Marrow Mean ± se
Lower 95% Bound
17.5 ± 1.31
15.34
< 0.00103a
<0.00912a
a: no exogenous adducts were detected in bone marrow; upper limits estimate based on the detection limit reported in Moeller et al. (2011).

Table 2. Comparison of estimated lifetime risks of developing nasopharyngeal cancer (NPC) and leukemia (LEU) from continuous lifetime inhalation exposure to 1 ppm formaldehyde, as estimated with the bottom-up approach and, alternatively, by USEPA using top-down linear extrapolation from epidemiologic data (as taken from Table 6-3, pp 6-41-6-42 of the Agency’s 2 June 2010 draft assessment).
Cancer
Background Risk, P0
Bottom-Up Slope, P0/C0L
a Bottom-Up
Risk at 1 ppmb USEPA
Risk at 1 ppm
NPC 7.25 x 10⁻⁴ 3.44 x 10⁻⁴ 0.038 x 10⁻² 1.1 x 10⁻²
LEU 1.30 x 10⁻² 8.50 x 10⁻⁴ < 3.9 x 10⁻⁶ 5.7 x 10⁻²
a: for NPC, 3.44 x 10-4 = 7.25 x 10⁻⁴ / 2.11 for LEU, 8.50 x 10-4 = 1.30 x 10⁻² / 15.3 b: for NPC, 0.038 x 10-2 = 3.44 x 10-4 x (2.21/2) for LEU, < 3.9 x 10-6 = 8.50 x 10⁻⁴ x (< 0.00912/2)

Risk Assessment Model is Conservative
• Attributes all background risk to dG adducts.
• Only utilizes endogenous dG adducts, even though endogenous dA adducts are also present.
• Risk model is linear.
• Used lower 95% confidence bounds of measured endogenous adducts to generate upper 95% bounds on slopes.
• Made conservative assumptions on kinetics and dG adduct half-life data.
• Used same scaling methods used by the USEPA.

Epigenetic Mode of Action Studies
• Adduction to histone lysines• Altered expression of miRNAs
– Primate maxilloturbinates, bone marrow, WBC and CD34+ cells
– Rat tissues following 28 days of inhalation exposure to 2 ppm (6 hr/day, 7 days/week)
• DNA methylation in tissues from inhalation exposed rats and primates
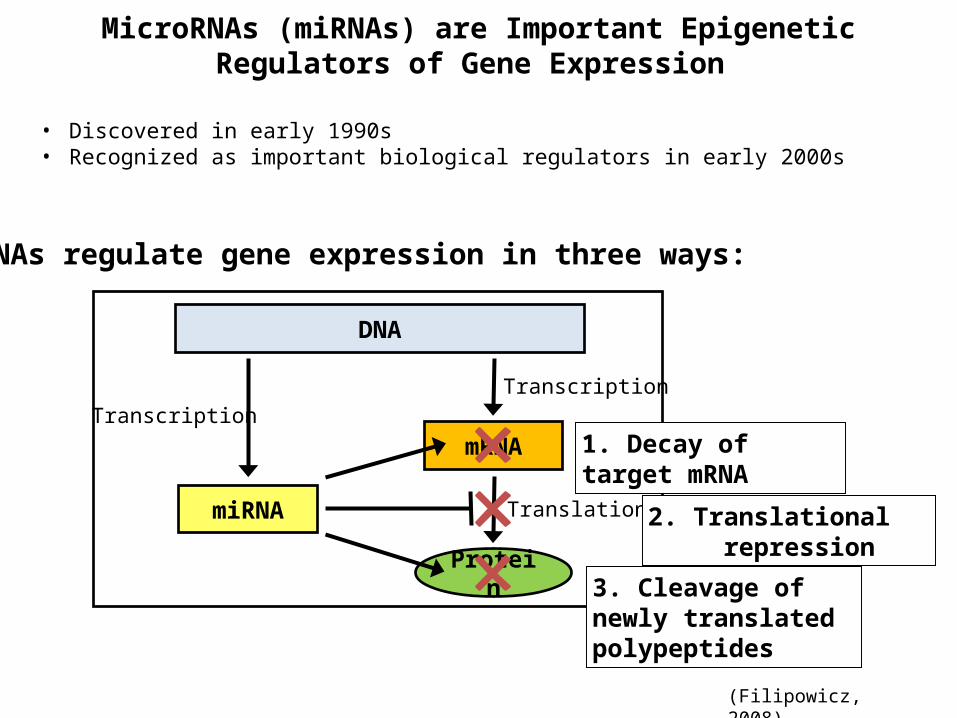
• Discovered in early 1990s• Recognized as important biological regulators in early 2000s
(Filipowicz, 2008)
DNA
miRNA
mRNA
Protein
Transcription
Translation
Transcription
1. Decay of target mRNA
2. Translational repression
3. Cleavage of newly translated polypeptides
miRNAs regulate gene expression in three ways:
MicroRNAs (miRNAs) are Important Epigenetic Regulators of Gene Expression

Nonhuman Primate Project
• Cynomolgus macaques were exposed to 0, 2, or 6 ppm 13CD2 formaldehyde for 6 h/day for 2 days
• Time-matched control macaques received clean air under the same conditions
• RNA samples were collected from the nose
• RNA samples were hybridized to miRNA microarrays to compare genome-wide miRNA expression profiles of formaldehyde-exposed versus unexposed samples

Formaldehyde Exposure Changes the Expression Levels of 13 miRNAs in the Nonhuman Primate Nasal Epithelium
Plot displaying the fold changes in miRNA expression induced by formaldehyde exposure in the nasal epithelium of nonhuman primates. 3 and 13 miRNAs were significantly (FC ≥ ±1.5, p<0.05, q<0.10) differentially expressed upon exposure to 2 ppm and 6 ppm formaldehyde, respectively.
Computationally predicted mRNA
targets for miR-125b

RT-PCR of selected miRNAs with altered
expression upon exposure to formaldehyde.
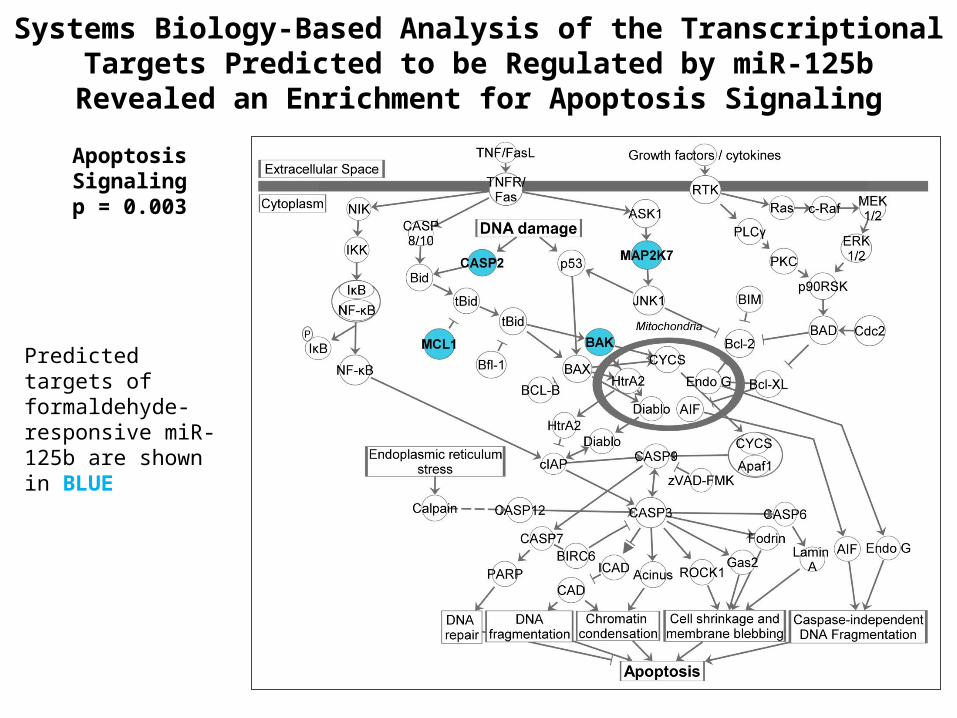
Systems Biology-Based Analysis of the Transcriptional Targets Predicted to be Regulated by miR-125b Revealed an Enrichment for
Apoptosis Signaling
Apoptosis Signalingp = 0.003
Predicted targets of formaldehyde-responsive miR-125b are shown in BLUE
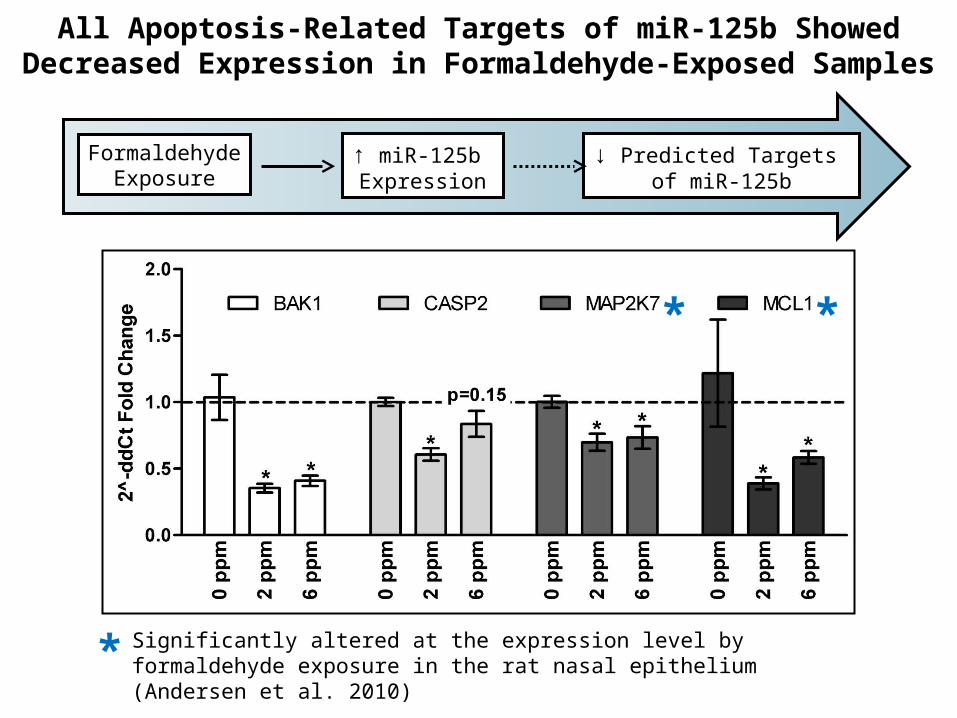
All Apoptosis-Related Targets of miR-125b Showed Decreased Expression in Formaldehyde-Exposed Samples
FormaldehydeExposure
↑ miR-125b Expression
↓ Predicted Targets of miR-125b
* *
* Significantly altered at the expression level by formaldehyde exposure in the rat nasal epithelium (Andersen et al. 2010)
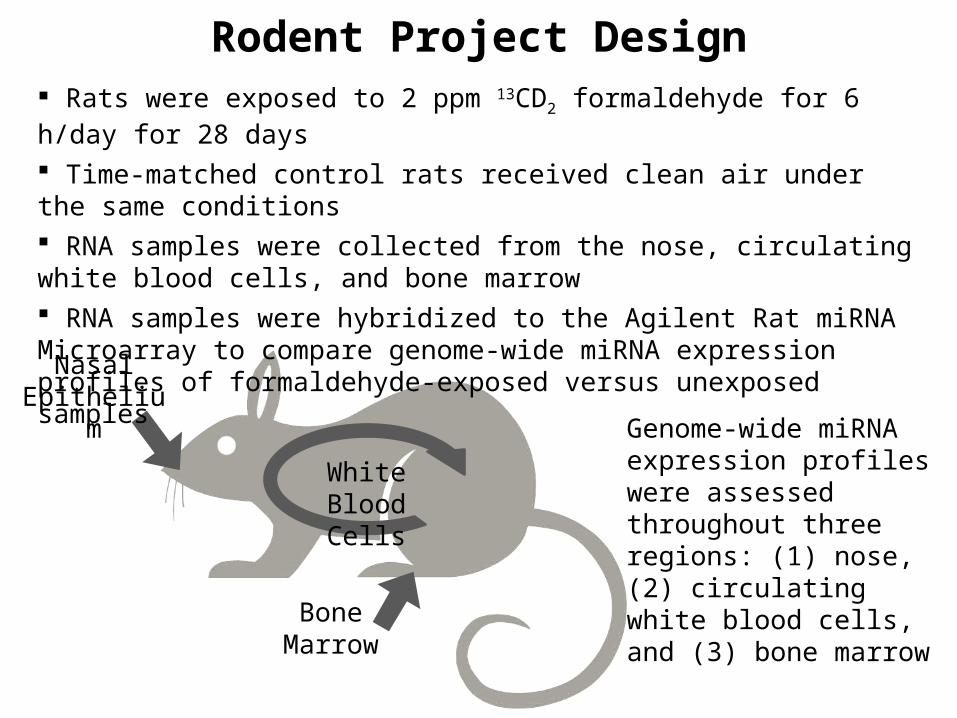
Rodent Project Design
Nasal Epithelium
Bone Marrow
White Blood Cells
Rats were exposed to 2 ppm 13CD2 formaldehyde for 6 h/day for 28 days
Time-matched control rats received clean air under the same conditions RNA samples were collected from the nose, circulating white blood cells, and bone marrow RNA samples were hybridized to the Agilent Rat miRNA Microarray to compare genome-wide miRNA expression profiles of formaldehyde-exposed versus unexposed samples
Genome-wide miRNA expression profiles were assessed throughout three regions: (1) nose, (2) circulating white blood cells, and (3) bone marrow
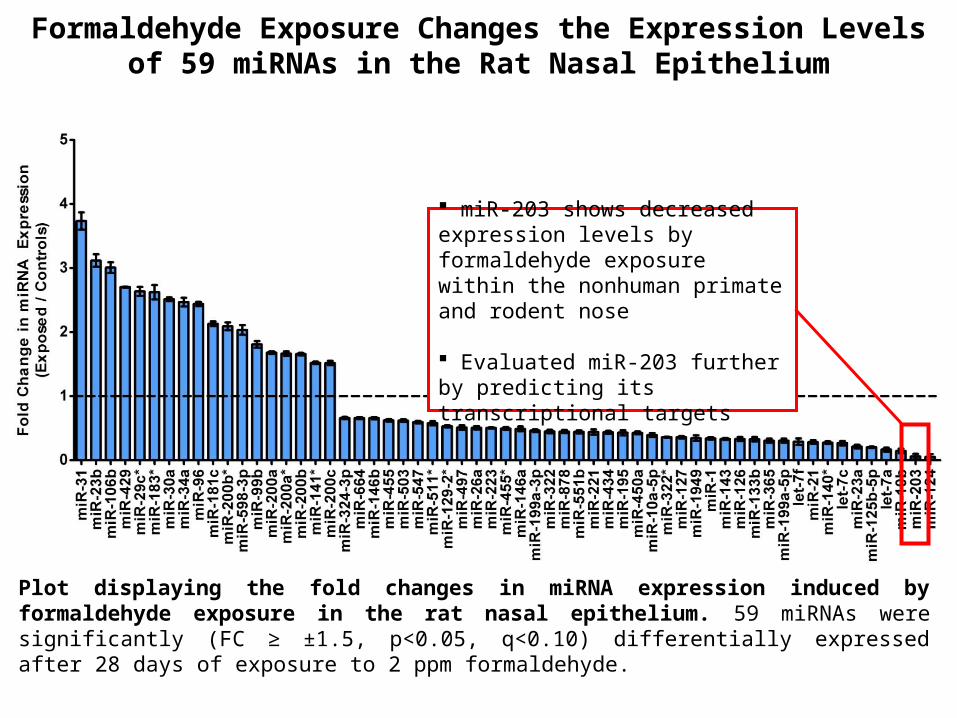
Plot displaying the fold changes in miRNA expression induced by formaldehyde exposure in the rat nasal epithelium. 59 miRNAs were significantly (FC ≥ ±1.5, p<0.05, q<0.10) differentially expressed after 28 days of exposure to 2 ppm formaldehyde.
Formaldehyde Exposure Changes the Expression Levels of 59 miRNAs in the Rat Nasal Epithelium
miR-203 shows decreased expression levels by formaldehyde exposure within the nonhuman primate and rodent nose
Evaluated miR-203 further by predicting its transcriptional targets

Systems Biology-Based Analysis of the Transcriptional Targets Predicted to be Regulated by miR-203 Revealed an Enrichment for
Carcinogenesis-Related Signaling
*
** Involved in carcinogenesis
Altered at the expression level by formaldehyde in the rodent nasal epithelium (Andersen et al. 2010)
*
*
*
**
**
*p < 10-51
** Member of the RAS oncogene family Altered at the expression level in nasopharyngeal carcinoma (Zheng et al. 2007)
Most significant network associated with miR-203 targets

Plot displaying the fold changes in miRNA expression induced by formaldehyde exposure in the rat leukocytes. 8 miRNAs were significantly (FC ≥ ±1.5, p<0.05, q<0.10) differentially expressed after 28 days of exposure to 2 ppm formaldehyde.
Formaldehyde Exposure Changes the Expression Levels of 8 miRNAs in Rat White Blood Cells
miR-31 shows formaldehyde-induced increased expression in the rat nose and circulating white blood cells

Summary of the Number of miRNAs with Altered Expression by Formaldehyde Exposure throughout Multiple Regions of the Body
Nasal Epithelium
Bone Marrow
White Blood Cells
59 miRNAs59 miRNAs
8 miRNAs8 miRNAs
0 miRNAs0 miRNAs
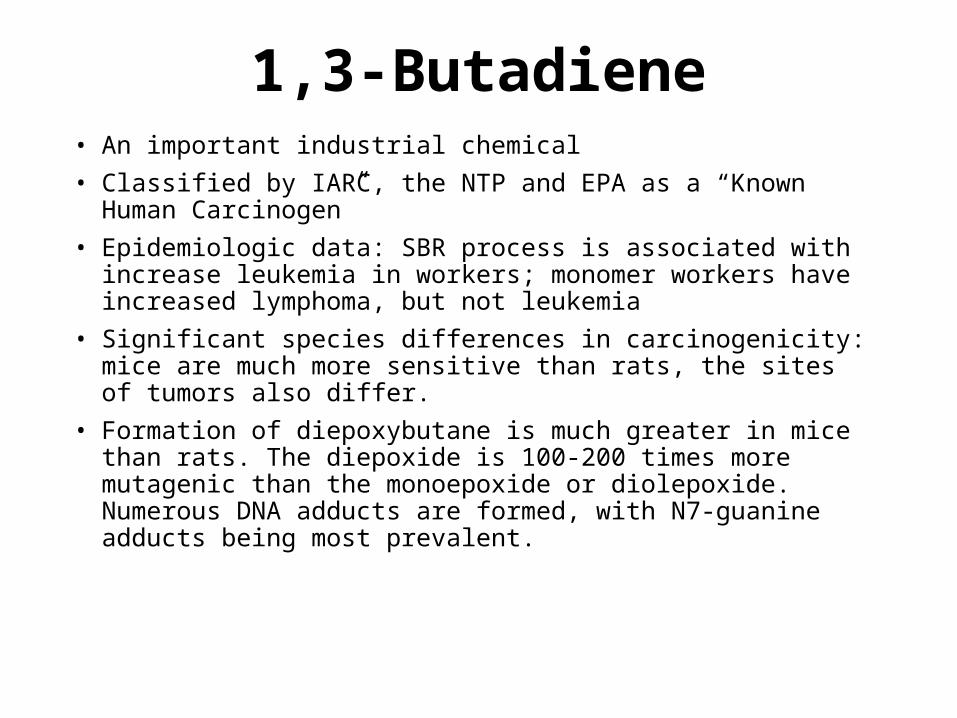
1,3-Butadiene• An important industrial chemical
• Classified by IARC, the NTP and EPA as a “Known Human Carcinogen”
• Epidemiologic data: SBR process is associated with increase leukemia in workers; monomer workers have increased lymphoma, but not leukemia
• Significant species differences in carcinogenicity: mice are much more sensitive than rats, the sites of tumors also differ.
• Formation of diepoxybutane is much greater in mice than rats. The diepoxide is 100-200 times more mutagenic than the monoepoxide or diolepoxide. Numerous DNA adducts are formed, with N7-guanine adducts being most prevalent.

Goggin, M. et al. Cancer Res 2009;69:2479-2486
Metabolic activation of BD to reactive electrophiles and the formation of DNA adducts
Goggin, M. et al. Cancer Res 2009;69:2479-2486
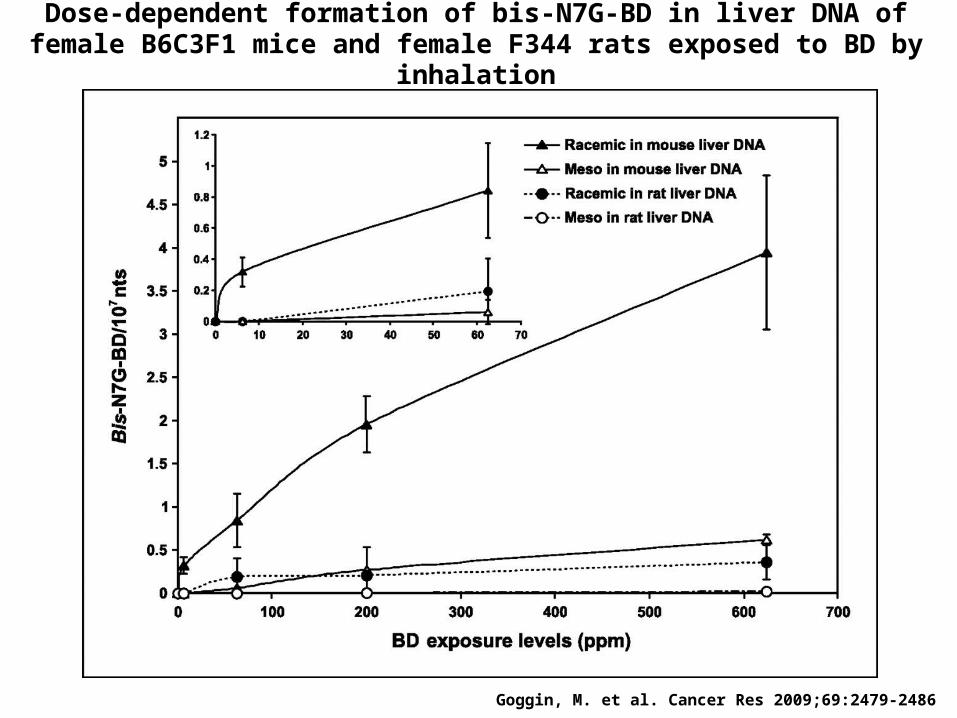
Dose-dependent formation of bis-N7G-BD in liver DNA of female B6C3F1 mice and female F344 rats exposed to BD by inhalation
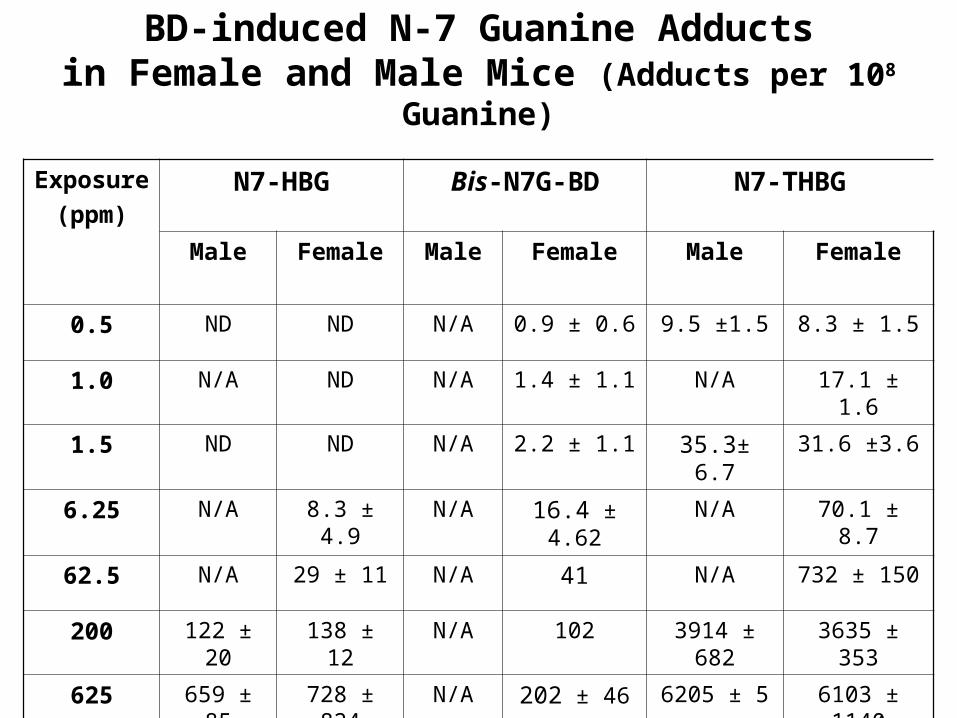
BD-induced N-7 Guanine Adductsin Female and Male Mice (Adducts per 108 Guanine)
Exposure
(ppm)N7-HBG Bis-N7G-BD N7-THBG
Male Female Male Female Male Female
0.5 ND ND N/A 0.9 ± 0.6 9.5 ±1.5 8.3 ± 1.5
1.0 N/A ND N/A 1.4 ± 1.1 N/A 17.1 ± 1.6
1.5 ND ND N/A 2.2 ± 1.1 35.3± 6.7 31.6 ±3.6
6.25 N/A 8.3 ± 4.9 N/A 16.4 ± 4.62 N/A 70.1 ± 8.7
62.5 N/A 29 ± 11 N/A 41 N/A 732 ± 150
200 122 ± 20 138 ± 12 N/A 102 3914 ± 682 3635 ± 353
625 659 ± 85 728 ± 824 N/A 202 ± 46 6205 ± 5 6103 ± 1140

O
O
O
OH
OH
OH
OHO
Globin
PeptideOH
NOH
OH
OHPeptide
ON
HO
HO
1,3-Butadiene (BD)
1,2-Epoxy-3-butene(EB)
3-Butene-1,2-diol(BD-diol)
3,4-Epoxy-1,2-butanediol(EBD)
1,2:3,4-Diepoxybutane(DEB)
EH
Globin
P450s
P450s
PeptideOH
NOH
EH
Globin
HB-Val THB-Valpyr-Val
P450s
Butadiene Hemoglobin Adducts

Lack of Gender Differences in Pyr-Val in Mice Exposed to Butadiene
0
500
1000
1500
2000
0 10 20 30 40 50 60 70
Am
ou
nts
of
pyr
-Val
[p
mo
l/g
]
BD Exposure evels [ppm]
males
females

Lack of Gender Differences in Pyr-Val in Rats Exposed to Butadiene
0
20
40
60
80
100
120
140
160
0 100 200 300 400 500 600 700
Am
ounts
of pyr-
Val [p
mol/
g]
BD exposure [ppm]
males
females
0
2
4
6
8
10
0 2 4 6
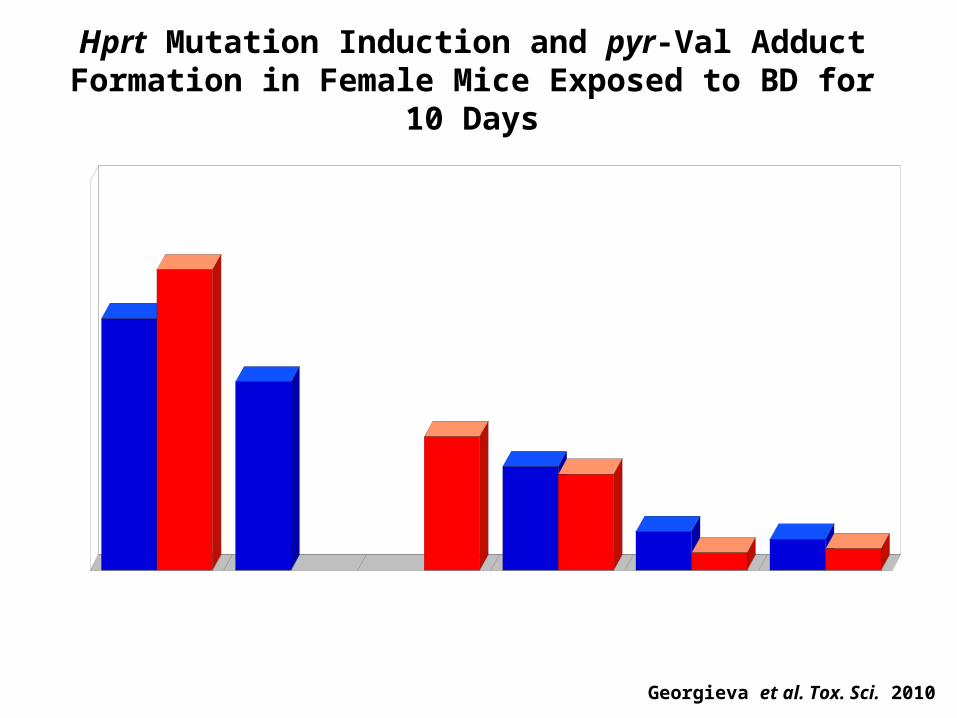
Hprt Mutation Induction and pyr-Val Adduct Formation in Female Mice Exposed to BD for 10 Days
3 6.25 20 62.5 625 1250
BD exposure [ppm]
0
5
10
15
20
25pyr-Val adducts/ppm BD Induced Hprt MF x 10(-8)/ppm BD
Georgieva et al. Tox. Sci. 2010

Copyright ©2009 American Association for Cancer Research
Goggin, M. et al. Cancer Res 2009;69:2479-2486
Figure 4. Gender differences in the formation of racemic bis-N7G-BD in B6C3F1 mice and F344 rats exposed to 625 ppm BD, and mice exposed to 200 ppm BD by inhalation for 2
wk

Male Female
BD
-in
du
ced
Mu
tan
t F
req
ue
nci
es
(x 1
0-6)
0
2
4
6
8
10
12
14
16
18
20
Black bars = mice; Gray bars = rats
Gender and species differences in BD-induced Hprt MFs in mice and rats exposed for 2 weeks to 1250 ppm BD
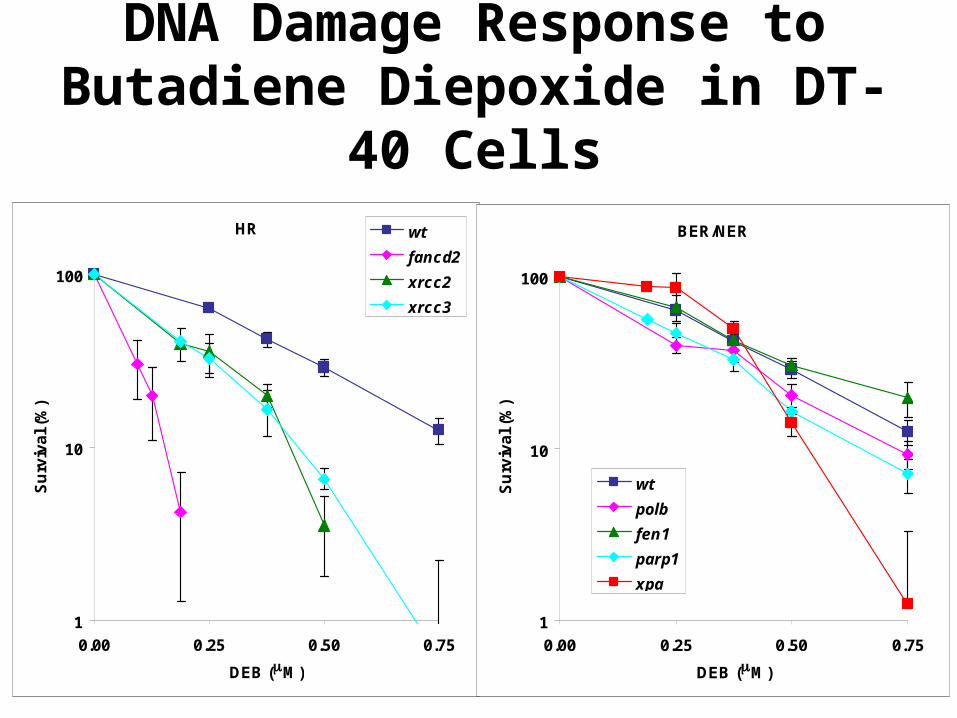
DNA Damage Response to Butadiene Diepoxide in DT-40 Cells
HR
1
10
100
0.00 0.25 0.50 0.75
DEB (M)
Su
rviv
al
(%)
wt
fancd2
xrcc2
xrcc3
BER/NER
1
10
100
0.00 0.25 0.50 0.75
DEB (M)
Su
rviv
al
(%)
wt
polb
fen1
parp1
xpa

Czech BD Gender Study
• A second molecular epidemiology study was conducted in the same plant to investigate gender differences in biomarkers using 26 female controls, 23 female BD-exposed workers, 25 male controls and 30 male BD-exposed workers (Albertini RJ, et al., Chem Biol Interact. 166:63-77, 2007.)
• The design was similar to the 2003 study, but BD exposures were lower (Exposed Males - 0.81 mg/m3 [0.37 ppm], Exposed Females – 0.397 mg/m3[0.18 ppm]).
• Biomarkers of exposure and effect were measured including: urinary metabolites, hemoglobin adducts, chromosomal aberrations and HPRT mutations, as well as metabolic genotypes.

Effect of Butadiene Exposure on Hemoglobin Adducts, Urinary Metabolites, and Indicators of Genotoxicity in Humans
Endpoint Control Monomer Polymer Significance(Kruskal-Wallis)
Butadiene Exposure(mg/m3)
0.02 0.64 1.79 p<0.05
HB-Val (pmol/g Hb)
THB-Valine (pmol/g Hb)
0.295
0.5180
2.2715
p<0.05p<0.05
Net M1 (ug/L)
Net M2 (ug/L)
-219-0.05
2135.3
270084
p<0.05p<0.05
Hprt VF (106)
MF (106)
10.7513.00
5.7310.69
6.4818.83
p<0.05--
SCE (SCE/cell)
CA (%)
6.321.56
6.141.52
6.471.54
----
Albertini et al., Res. Rep. Health Eff. Inst., 1-141 (2003).

Calculation for the EB-dose Calculation for the EB-dose Equivalent in Humans, Rats and MiceEquivalent in Humans, Rats and Mice
Dose-equivalent = EB × 1 + DEB × 32 + EBdiol × 0.21 Dose-equivalent = EB × 1 + DEB × 32 + EBdiol × 0.21

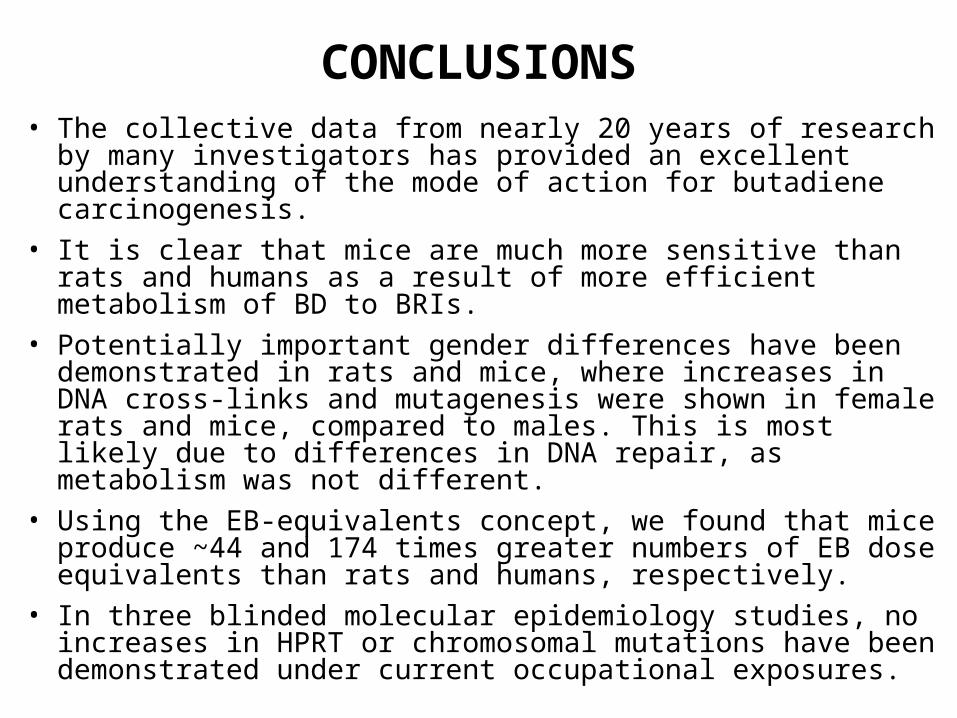
CONCLUSIONS• The collective data from nearly 20 years of research by many
investigators has provided an excellent understanding of the mode of action for butadiene carcinogenesis.
• It is clear that mice are much more sensitive than rats and humans as a result of more efficient metabolism of BD to BRIs.
• Potentially important gender differences have been demonstrated in rats and mice, where increases in DNA cross-links and mutagenesis were shown in female rats and mice, compared to males. This is most likely due to differences in DNA repair, as metabolism was not different.
• Using the EB-equivalents concept, we found that mice produce ~44 and 174 times greater numbers of EB dose equivalents than rats and humans, respectively.
• In three blinded molecular epidemiology studies, no increases in HPRT or chromosomal mutations have been demonstrated under current occupational exposures.
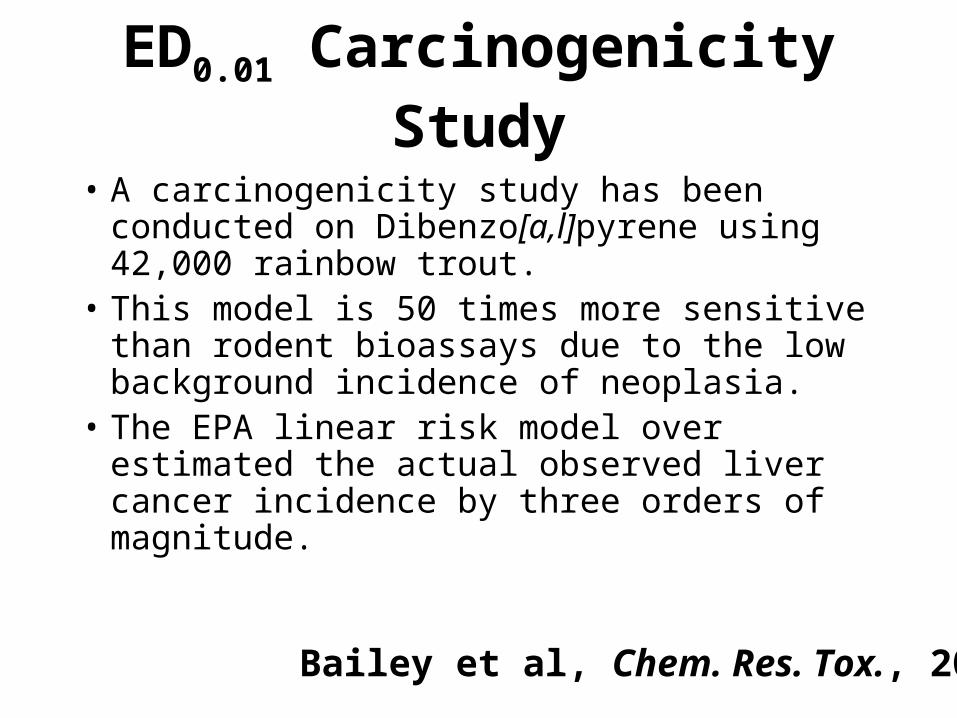
ED0.01 Carcinogenicity Study
• A carcinogenicity study has been conducted on Dibenzo[a,l]pyrene using 42,000 rainbow trout.
• This model is 50 times more sensitive than rodent bioassays due to the low background incidence of neoplasia.
• The EPA linear risk model over estimated the actual observed liver cancer incidence by three orders of magnitude.
Bailey et al, Chem. Res. Tox., 2009
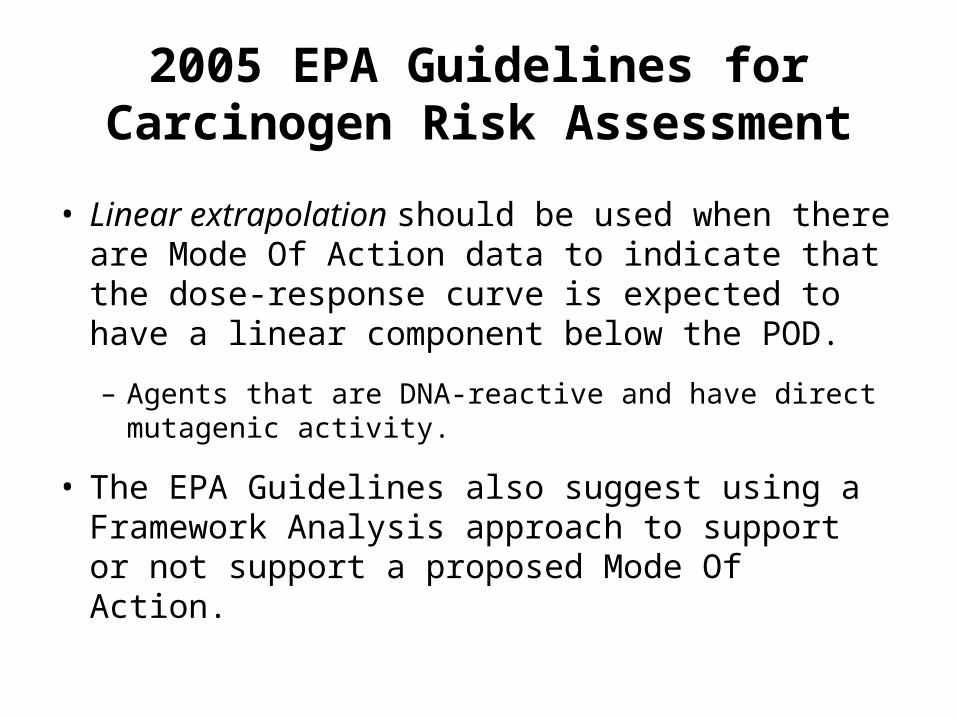
2005 EPA Guidelines for Carcinogen Risk Assessment
• Linear extrapolation should be used when there are Mode Of Action data to indicate that the dose-response curve is expected to have a linear component below the POD.
– Agents that are DNA-reactive and have direct mutagenic activity.
• The EPA Guidelines also suggest using a Framework Analysis approach to support or not support a proposed Mode Of Action.

IPCS/EPA Framework for Evaluating Mechanistic Data
• Introduction• Postulated mode of
action• Key events• Dose-response
relationship• Temporal association• Strength, consistency
and specificity of association with key events
• Biological plausibility and coherence
• Other modes of action• Assessment of mode
of action• Uncertainties,
inconsistencies and data gaps

MOA Key Events
Genotoxicity
DNA Adducts
Mutations in reporter genes
Mutations in cancer genes
Cancer
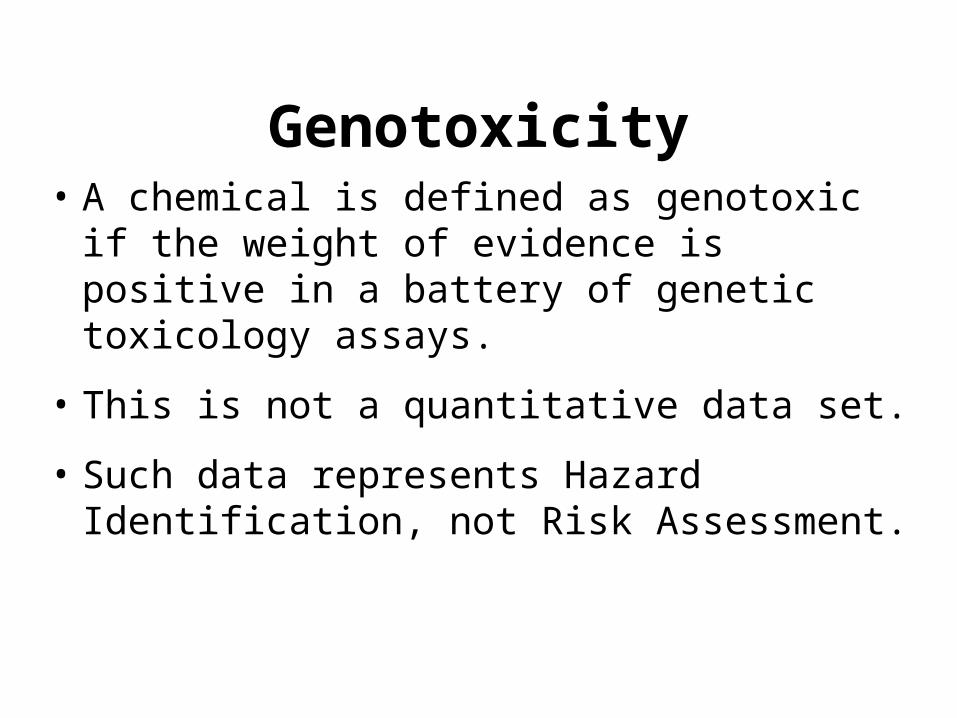
Genotoxicity• A chemical is defined as genotoxic if the weight
of evidence is positive in a battery of genetic toxicology assays.
• This is not a quantitative data set.
• Such data represents Hazard Identification, not Risk Assessment.

MOA Key Events
Genotoxic
DNA Adducts
Mutations in reporter genes
Mutations in cancer genes
Cancer

Molecular Dosimetry of DNA Adducts
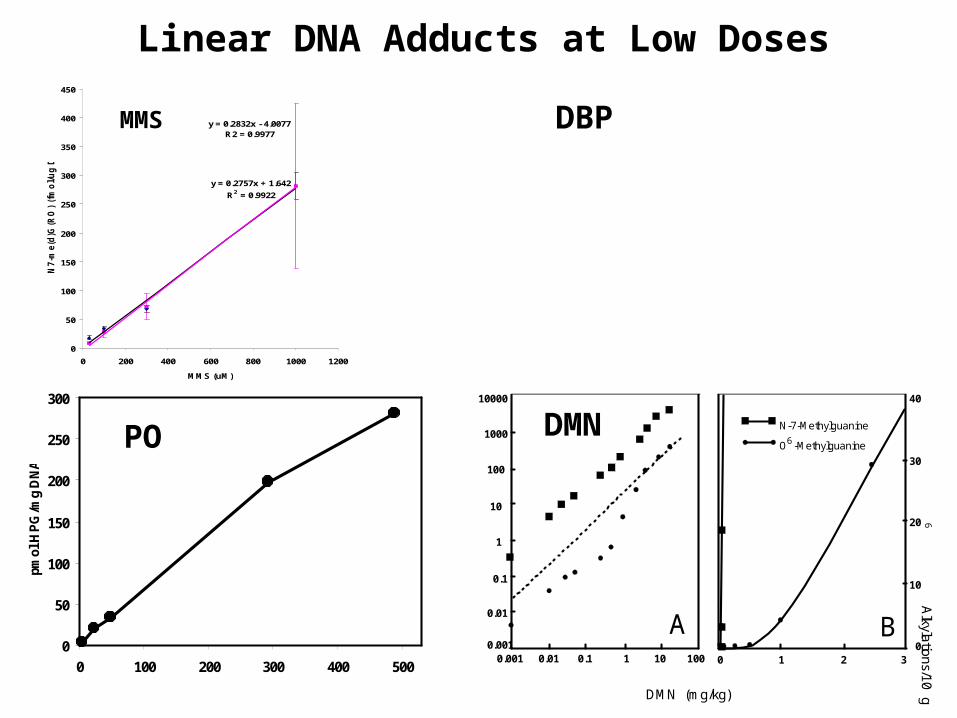
• DNA adducts are expected to be linear at low doses.
• An exception to this is when identical adducts are formed endogenously.
• Many forms of endogenous DNA adducts have been identified and measured. These include direct oxidative adducts, exocyclic adducts, AP sites and deamination products.
MMS 1 hr exposure (HeLa cells)(912-06 to 927-06, combined)
y = 0.2757x + 1.642
R2 = 0.9922
y = 0.2832x - 4.0077R2 = 0.9977
0
50
100
150
200
250
300
350
400
450
0 200 400 600 800 1000 1200
MMS (uM)
N7-m
e(d
)G(R
O)
(fm
ol/u
g D
NA
)
0
50
100
150
200
250
300
0 100 200 300 400 500
pmol
HP
G/m
g D
NA
N-7-Methylguanine
O -Methylguanine
10000
1000
100
10
1
0.1
0.01
0.001 0.001 0.01 0.1 1 10 100
40
30
20
10
03210
6
DMN (mg/kg)
Alkylations/10 guanines
Alkylations/10 guanines
6 6
A B
Linear DNA Adducts at Low Doses
MMS DBP
PO DMN

MOA Key Events
Genotoxic
DNA Adducts
Mutations in reporter genes
Mutations in cancer genes
Cancer

Mutations Do Not Go Through Zero
• In contrast to most DNA adducts, mutations do not go through zero.
• Rather, they reach a spontaneous level that reflects the summation of endogenous DNA damage and repair that occurs in cells.
• The point in the dose response curve where the number of mutations significantly increase above the spontaneous level represents the point at which the exogenous DNA damage starts driving the biology that results in additional mutations.

0
50
100
150
200
250
300
350
0 100 200 300 400 500
DNA Adducts
Mut
ant F
requ
ency
Inflection point
Dose
Typical Mutation Dose Response
0
1
2
3
4
5
6
7
TK6 AHH-1
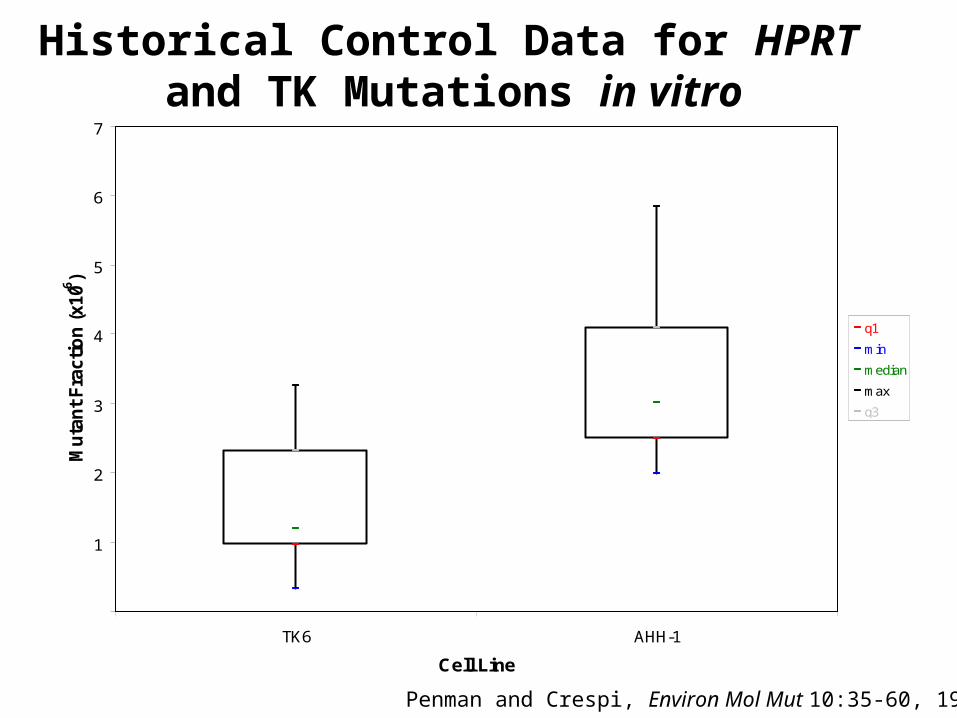
Cell Line
Mu
tan
t F
ract
ion
(x1
0-6)
q1
min
median
max
q3
tk locusn=87
hprt locusn=34
95th
Historical Control Data for HPRT and TK Mutations in vitro
Penman and Crespi, Environ Mol Mut 10:35-60, 1987
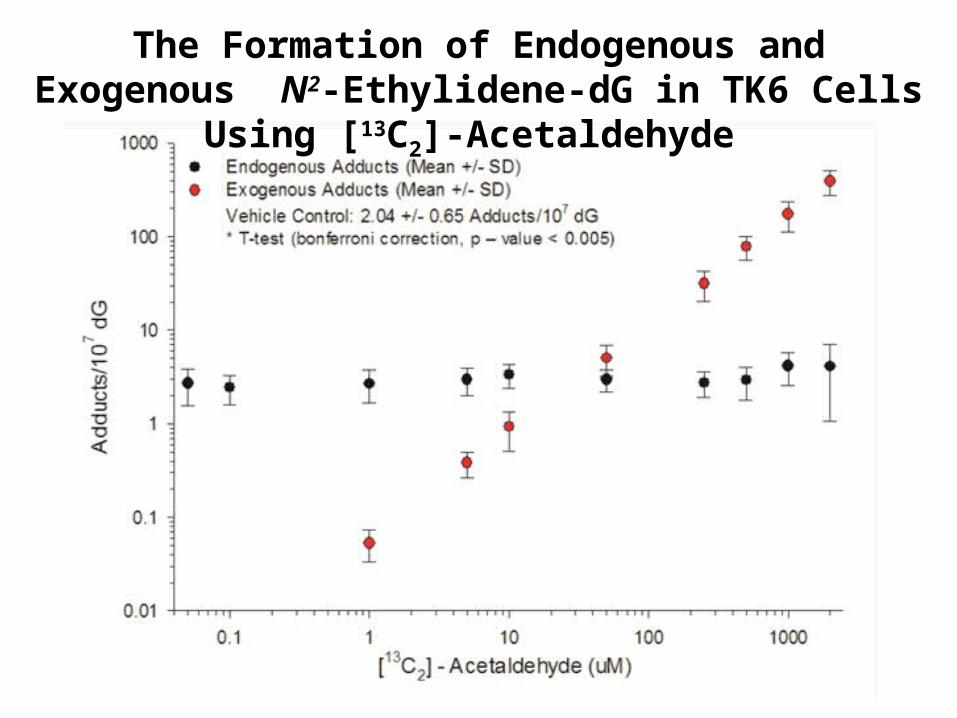
The Formation of Endogenous and Exogenous N2-Ethylidene-dG in TK6 Cells Using [13C2]-Acetaldehyde

The Sum of Endogenous and Exogenous N2-Ethylidene-dG in TK6 Cells Using [13C2]-Acetaldehyde

Micronucleus Formation in TK6 Cells exposed to [13C2]-Acetaldehyde

Survival of TK6 Cells exposed to [13C2]-Acetaldehyde
0
0.5
1
1.5
2
0 0.5 1 1.5 2 2.5 3
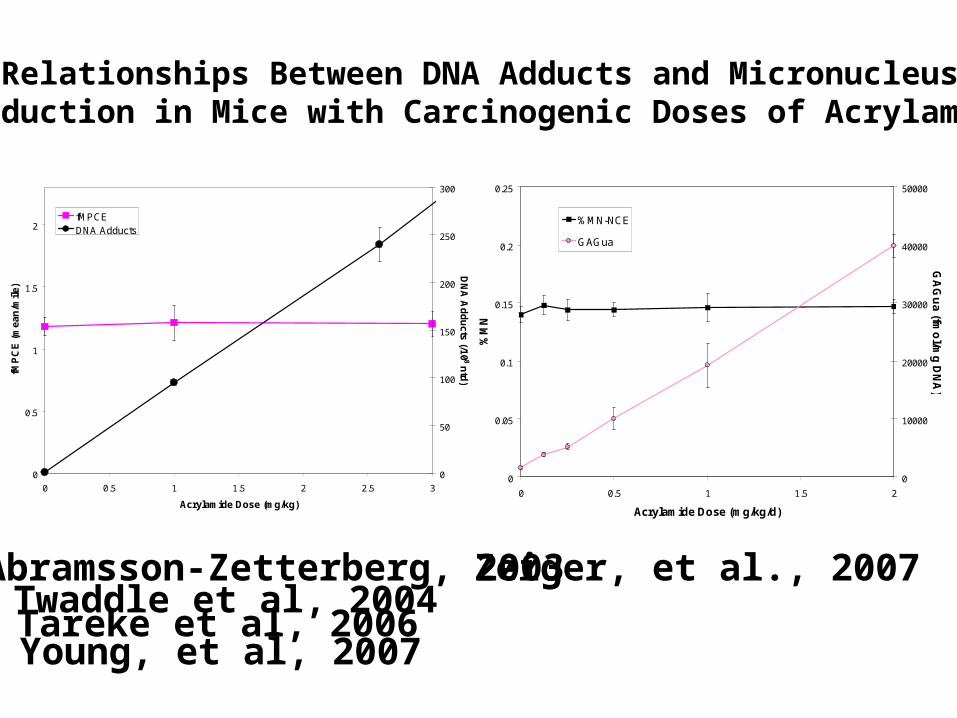
Acrylamide Dose (mg/kg)
fMP
CE
(m
ea
n/m
ile
)
0
50
100
150
200
250
300
DN
A A
dd
uc
ts (/1
08 n
td)
fMPCEDNA Adducts
0
0.05
0.1
0.15
0.2
0.25
0 0.5 1 1.5 2
Acrylamide Dose (mg/kg/d)
%M
N0
10000
20000
30000
40000
50000
GA
Gu
a (fmo
l/mg
DN
A)
%MN-NCE
GAGua
Abramsson-Zetterberg, 2003 Zeiger, et al., 2007
Relationships Between DNA Adducts and Micronucleus Induction in Mice with Carcinogenic Doses of Acrylamide
Twaddle et al, 2004Tareke et al, 2006Young, et al, 2007

0
5
10
15
20
0 50 100 150 200
Ethylene Oxide (or equivalent) Dose (ppm)
Hp
rt M
F (
X10
6 )
0
1
2
3
4
5
0 10 20 30 40 50
Ethylene Oxide (or equivalent) Dose (ppm)
Hp
rt M
F (
X10
6 )
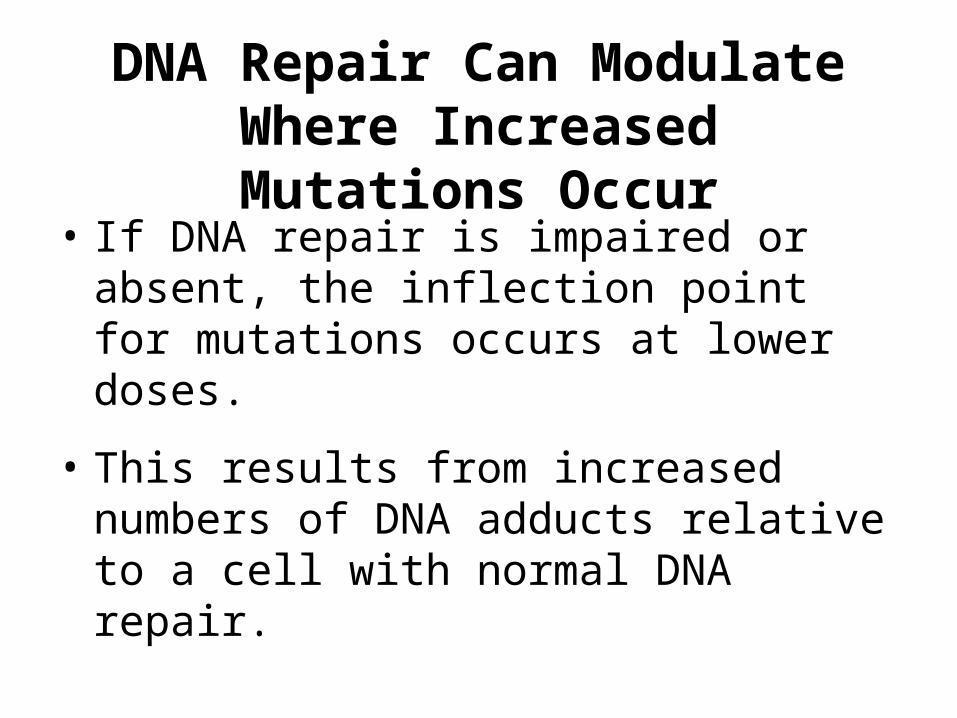
DNA Repair Can Modulate Where Increased Mutations Occur
• If DNA repair is impaired or absent, the inflection point for mutations occurs at lower doses.
• This results from increased numbers of DNA adducts relative to a cell with normal DNA repair.

6
0.1
1
10
100
0.01 0.1 1 10 100
7-HPG/10 nucleotides
ind
uc
ed
RL
mu
tan
t fr
eq
ue
nc
y
PO-NER+PO-NER-
6
Exposure-response for Mutagenesis in Drosophila ExposedBy Inhalation To Propylene Oxide
Nivard et al, Mut. Res. 529: 95-107, 2003.
12,000 ppm hr PO

EMS and ENU in MutaMouse, GI tract 4-week treatment
acute treatment, sampling day 7acute treament, sampling day 30
0
50
100
150
200
250
300
350
400
450
0 50 100 150 200 250 300 350 400cumulated dose (mg/kg)
Mu
tan
t fr
equ
ency
(10
-6)
EMS 4-week
ENU acute day31
ENU acute day 7
ENU 4-week
EMS acute day 7
EMS acute day 31
Comparison of Acute and 28-Day Treatments
350 mg/kg
12.5 mg/kg/day

MOA Key Events
Genotoxic
DNA Adducts
Mutations in reporter genes
Mutations in cancer genes
Cancer

Gaps in Knowledge
• Most mutation assays are done at high doses to establish that a compound is or is not genotoxic.
• There is a real need to generate dose response data at low exposures to establish NOAELs for mutation in CA, MN and surrogate genes such as hprt.
• These data will further establish the exposures where the background number of mutations become significantly increased.

Conclusions
• As our knowledge of carcinogenesis has expanded, concepts of “one molecule → cancer “ have little to no scientific support.
• Mutations in genes controlling cell proliferation and cell death appear to play major roles in the induction of cancer.
• While these genes are difficult to monitor in noncancer tissues, surrogate mutations can be used to examine dose response in cells, animals and humans.
Conclusions (cont.)
• Such mutations do not have linear relationships with exposure. Rather, they reach a spontaneous incidence that is driven by endogenous biological processes.
• The exposures where mutagenesis becomes significantly increased over background represents a scientifically based Point of Departure for setting acceptable exposures.
• This could be accomplished by using a Margin of Exposure approach to protect susceptible individuals.
Biologically-Based Risk Assessment
• Refine estimates of dose to relevant targets through use of biomarkers of exposure and PBPK modeling
• Improve hazard characterization through a better understanding of the mode(s) of action for endpoints of concern
• Strengthen inferences regarding the shape of dose/response curves outside the range of traditional observations
• Identify/investigate opportunities for research in human populations, such as susceptibility factors
The Exposome• Chris Wild proposed that we should be considering the
“Exposome” for cancer etiology. Wild, C: CEBP 14: 1847-1850, 2005
– Under this view, the assessment of exposures should not be restricted to chemicals entering the body from air, water, food, smoking, etc., but should also include internally generated toxicants produced by the gut flora, inflammation, oxidative stress, lipid peroxidation, infections, and other natural biological processes. In other words, we must focus upon the ‘internal chemical environment’ arising from all exposures to bioactive chemicals inside the body
• More recently, Martyn Smith et. al. made similar statements. Smith, M: Chemico Biological Interactions 192: 155-159, 2011
– The question arises as to how to find the causes of the majority of de novo AMLs that remain unexplained. We propose that we should attempt to characterize the 'exposome' of human leukemia by using unbiased laboratory-based methods to find the unknown 'environmental' factors that contribute to leukemia etiology.

Systematic Characterization of ComprehensiveExposure-Dose-Response Continuum and the Evolution of Protective to Predictive Dose-Response Estimates