issues related to increasing the “retirement age” · 2019-04-26 · the age at which canadians...
TRANSCRIPT

May 2013
Document 213038 Ce document est disponible en français
© 2013 Canadian Institute of Actuaries
CIA Task Force on Retirement Age
Issues Related to Increasing the “Retirement Age”
Report

Report May 2013
2
CONTENTS I – Executive Summary ................................................................................................................... 4 II – Aging of the Canadian Population ........................................................................................... 6 III – Projected Costs of Our Present Programs: A Financial Crisis? ............................................ 10
The Cost of OAS/GIS ............................................................................................................. 10 The Cost of CPP/QPP ............................................................................................................. 11 International Comparisons ...................................................................................................... 11 The Cost of Health Care ......................................................................................................... 13 Raising the Entitlement Age and Public Policy ...................................................................... 15
IV – The Shift in Retirement Age Prior to any Change in OAS Eligibility Age .......................... 17 Canada ..................................................................................................................................... 17
Average Retirement Age – Historical Development and Projections ............................... 17 Transition from Work to Retirement: CPP Working Beneficiaries .................................. 20 Transition from Work to Retirement: Québec Experience ............................................... 22 Conclusions ....................................................................................................................... 29
International Observations ...................................................................................................... 29 Average Effective Retirement Ages – Historical Development ......................................... 29 Official Retirement Ages ................................................................................................... 32 Policy Statements – International Organizations ............................................................. 34
V – Recent Changes to OAS and C/QPP ...................................................................................... 37 OAS/GIS ................................................................................................................................. 37 C/QPP ..................................................................................................................................... 38
VI – Retirement Age and Defined Benefit Pension Plans ............................................................ 40 Background ............................................................................................................................. 40 Terminology ............................................................................................................................ 41 Early Retirement Incentives .................................................................................................... 42 The Rationale (or Lack Thereof) for Early Retirement Incentives in DB Plans .................... 43 The Evolution of Early Retirement Incentives in DB Plans ................................................... 44
Private Sector.................................................................................................................... 44 Public Sector ..................................................................................................................... 45
Public Policy Considerations with Respect to DB Plans ........................................................ 46 VII – Retirement Age and Capital Accumulation Plans ............................................................... 48
Implications of a Shift in the Normal Retirement Age ........................................................... 49

Report May 2013
3
VIII – Other Programs Affected by Changing Retirement Ages .................................................. 50 IX – Other Variables Affecting the Impact ................................................................................... 50
Fertility .................................................................................................................................... 50 Net Migration .......................................................................................................................... 51 Labour Force Participation ..................................................................................................... 51 Productivity ............................................................................................................................. 52
X – The “Lump of Labour” Fallacy .............................................................................................. 53 References ..................................................................................................................................... 55 Appendix ....................................................................................................................................... 58
Report May 2013
4
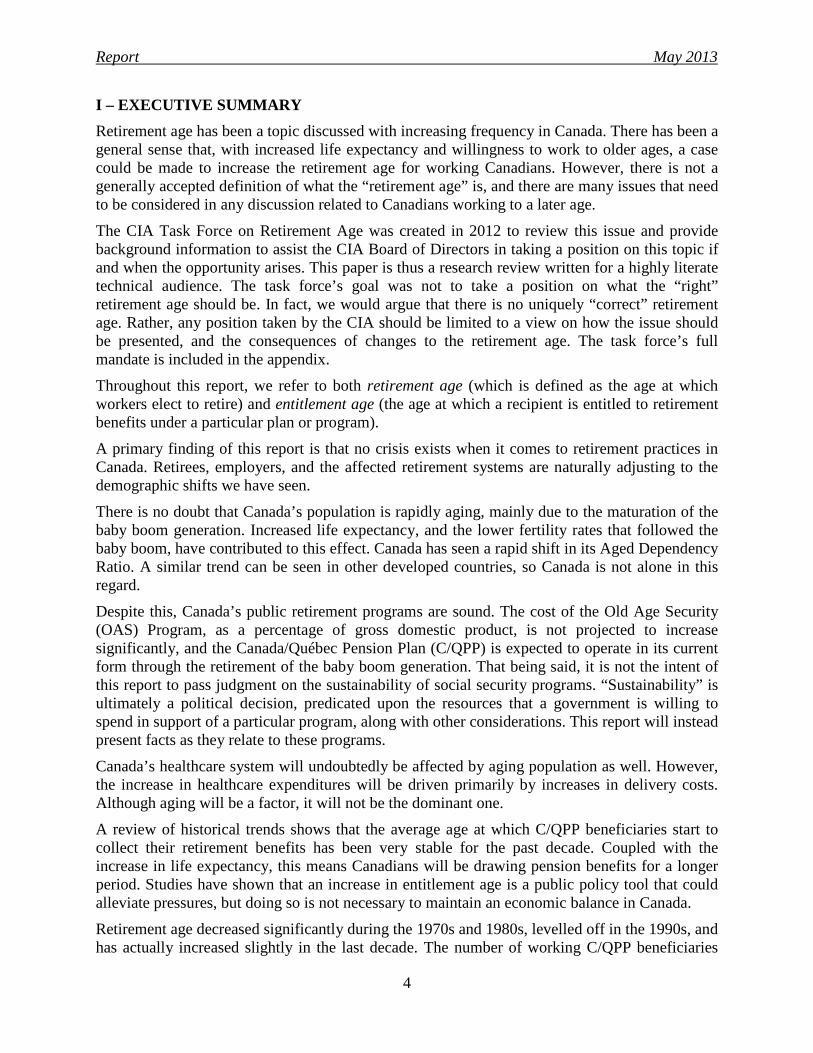
I – EXECUTIVE SUMMARY Retirement age has been a topic discussed with increasing frequency in Canada. There has been a general sense that, with increased life expectancy and willingness to work to older ages, a case could be made to increase the retirement age for working Canadians. However, there is not a generally accepted definition of what the “retirement age” is, and there are many issues that need to be considered in any discussion related to Canadians working to a later age.
The CIA Task Force on Retirement Age was created in 2012 to review this issue and provide background information to assist the CIA Board of Directors in taking a position on this topic if and when the opportunity arises. This paper is thus a research review written for a highly literate technical audience. The task force’s goal was not to take a position on what the “right” retirement age should be. In fact, we would argue that there is no uniquely “correct” retirement age. Rather, any position taken by the CIA should be limited to a view on how the issue should be presented, and the consequences of changes to the retirement age. The task force’s full mandate is included in the appendix.
Throughout this report, we refer to both retirement age (which is defined as the age at which workers elect to retire) and entitlement age (the age at which a recipient is entitled to retirement benefits under a particular plan or program).
A primary finding of this report is that no crisis exists when it comes to retirement practices in Canada. Retirees, employers, and the affected retirement systems are naturally adjusting to the demographic shifts we have seen.
There is no doubt that Canada’s population is rapidly aging, mainly due to the maturation of the baby boom generation. Increased life expectancy, and the lower fertility rates that followed the baby boom, have contributed to this effect. Canada has seen a rapid shift in its Aged Dependency Ratio. A similar trend can be seen in other developed countries, so Canada is not alone in this regard.
Despite this, Canada’s public retirement programs are sound. The cost of the Old Age Security (OAS) Program, as a percentage of gross domestic product, is not projected to increase significantly, and the Canada/Québec Pension Plan (C/QPP) is expected to operate in its current form through the retirement of the baby boom generation. That being said, it is not the intent of this report to pass judgment on the sustainability of social security programs. “Sustainability” is ultimately a political decision, predicated upon the resources that a government is willing to spend in support of a particular program, along with other considerations. This report will instead present facts as they relate to these programs.
Canada’s healthcare system will undoubtedly be affected by aging population as well. However, the increase in healthcare expenditures will be driven primarily by increases in delivery costs. Although aging will be a factor, it will not be the dominant one.
A review of historical trends shows that the average age at which C/QPP beneficiaries start to collect their retirement benefits has been very stable for the past decade. Coupled with the increase in life expectancy, this means Canadians will be drawing pension benefits for a longer period. Studies have shown that an increase in entitlement age is a public policy tool that could alleviate pressures, but doing so is not necessary to maintain an economic balance in Canada.
Retirement age decreased significantly during the 1970s and 1980s, levelled off in the 1990s, and has actually increased slightly in the last decade. The number of working C/QPP beneficiaries

Report May 2013
5
has increased significantly, which is indicative that retirement is becoming more of an event of gradual transition.
A survey of retirement practices in other developed countries shows a general trend towards higher entitlement ages.
It is too early to tell what impact the increase in entitlement age for OAS benefits will have on retirement trends throughout Canada. The same comment can be made for the changes in the C/QPP adjustment factors, removing the work cessation test and introducing post-retirement benefit for working beneficiaries.
Canada’s public social security pension plans (the C/QPP and OAS Program) do not subsidise early retirement. Benefits are payable at set ages whether or not Canadians choose to retire and are adjusted to avoid subsidising or punishing those who choose to draw benefits earlier or later than the “normal” age.
The only workplace pension plans that subsidise early retirement are defined benefit pension plans providing unreduced pensions (or pensions subject to less-than-actuarial reductions) to qualifying employees retiring before age 65. In the private sector, pension plans with lucrative early retirement provisions cover a small and declining percentage of the workforce. In the public sector, defined benefit plans continue to cover more than 80% of the workforce and almost all public sector pension plans incorporate significant early retirement incentives. As a consequence, public sector employees retire much earlier than their private sector counterparts. So far, there is little to suggest that public sector early retirement incentives will soon diminish, in part because the public sector underestimates the cost of pensions in assessing the reasonableness of employee compensation, thereby reducing the impetus for change.
The age at which Canadians choose to retire has already started to increase for a variety of reasons (improved health, better employment opportunities for older workers, inadequate savings at a time of very low interest rates, etc.). This trend will almost certainly continue with or without changes to public policy. While the task force sees some merit in policies that would reduce or eliminate early retirement incentives, thereby promoting longer working lives, policies that go beyond this, say by limiting the retirement savings opportunities of Canadians or by financially penalizing those who choose to retire at their own expense, should only be contemplated if Canada’s economic prospects deteriorate to an extent not now imagined.
Employers, faced with increased pension costs and rumors of labour shortages, may consider the elimination of early retirement provisions as a way to deal with these problems. This paper discusses a number of public policy considerations with regards to early retirement benefits, and offers some proposals which could help reduce the prevalence of these provisions.
This paper also discusses other factors which will influence the future direction of retirement ages; specifically factors which will have an impact on the number of workers we can expect in future years. These include fertility rates, net migration, labour force participation, and productivity. A discussion of the “lump of labour” fallacy demonstrates that increases in the retirement age will not crowd out job opportunities for younger workers.

Report May 2013
6
II – AGING OF THE CANADIAN POPULATION Canada is facing a rapidly aging population. There are two reasons for this: ever-improving life expectancy and the continued movement of the baby boom in age.
Canada had one of the more dramatic baby booms amongst the developed world. The following graph, comparing birth rates between Canada and the United States, shows a pronounced difference between the two countries.
Figure 1 – Total Fertility Rates: Canada and the United States

Report May 2013
7
The following graph, dating from 2010, projects births and deaths in Canada to 2056.
Figure 2 – Number of Births and Deaths in Canada, 1926 to 2056
Source: Statistics Canada (2010)
This report will make reference to the baby boom generation. The popular media have defined the “baby boom” as the cohorts born between 1946 and 1962. Others have argued that the boom did not really start until 1951, and may not have ended until 1966. What is not disputed is that the peak of the baby boom occurred in 1959 in Canada. Regardless of the definition, the baby boomers will all be aged 65 by 2031.

Report May 2013
8
Life expectancy in Canada has improved steadily over the last century. The following table illustrates these historical changes:
Table 1 – Life Expectancy in Canada
Year At Birth At Age 65 At Age 75 Male Female Male Female Male Female
1921 58.8 60.6 13.0 13.6 7.6 8.0 1941 63.0 66.3 12.8 14.1 7.5 8.2 1961 68.4 74.2 13.5 16.1 8.2 9.5 1981 71.9 79.0 14.6 18.9 9.0 11.9 2001 76.9 82.0 17.0 20.5 10.3 12.9 2006 78.3 82.9 18.1 21.3 11.2 13.5
Source: Statistics Canada: Life Tables, Canada and the Provinces
Due to this improving life expectancy, the median age of the Canadian population does not decrease until after the demise of the baby boom, which is around mid-century, as seen in figure 3.
Figure 3 – Projected Median Age
The combination of improved life expectancy and the aging of the baby boom cohorts results in a significant shift in the profile of the Canadian population, which can be seen in table 2.

Report May 2013
9
Table 2 – Distribution of Canadian Population by Age Group, 1956 to 2036
Age 1956 1986 1996 2016 2036
Under 20 39.4 35.6 26.7 21.1 20.2 20–64 52.9 55.8 61.1 62.4 55.0 65+ 7.7 8.6 12.2 16.4 24.8
75+ 2.5 3.2 5.1 7.0 12.8 85+ 0.4 0.7 1.2 2.1 3.8
Source: Statistics Canada Population Projections, 2010 The affordability of certain social programs in Canada depends on the Aged Dependency Ratio (ADR). This ratio is defined as the ratio of those aged 65+ to those aged 20–64, the latter group being the source of the productive labour force. Table 2 allows us to calculate ADRs at each point in time. A more meaningful statistic is the “Inverse ADR”, which shows the number of individuals aged 20–64 for every individual aged 65+:
Table 3 – Aged Dependency Ratios
Year ADR Inverse ADR 1956 0.146 6.9 1976 0.141 7.1 1996 0.200 5.0 2016 0.263 3.8 2036 0.451 2.2
Canada has seen one of the most rapid shifts in ADRs of any developed country in the world, as seen in table 4:
Table 4 – Aged Dependency Ratios, And Growth Therein, 2050 versus 2010
Country ADR 2010 (%) ADR 2050 (%) Increase Italy 31.0 61.7 113.3 Canada 20.3 42.3 108.4 France 25.9 43.4 99.0 Japan 35.5 69.6 96.1 U.S. 19.5 35.4 81.5 UK 25.1 39.9 59.0 Sweden 28.0 42.3 51.1
Source: U.N. data, http://data.un.org/Data.aspx?d=PopDiv&f=variableID%3A44 Of the countries listed, Canada has the second most-dramatic aging increase, surpassed only by Italy, and notably higher than the United States. The reason for this is the more dramatic shift in our fertility rates, as seen in figure 1 above. Today, the U.S. has a fertility rate of around 2.1 (which means that their population will replace itself without immigration), while Canada is at 1.68 (which is well below the replacement rate). Similarly, Canada experiences much more of an

Report May 2013
10
age shift than more mature societies in Europe (e.g., Sweden). In fact, it is probably true that if Sweden can afford its support systems today, then it faces a very small increase in financing over the next half century.
III – PROJECTED COSTS OF OUR PRESENT PROGRAMS: A FINANCIAL CRISIS? Given the rapid rise in Canada’s Aged Dependency Ratio, one is compelled to ask if our present social programs face a financial crisis over the next half century.
The two programs that are most important in this regard are:
• Social security, consisting of o The Old Age Security (OAS) Program, which includes the Guaranteed Income
Supplement (GIS) and Allowance; and o The Canada/Québec Pension Plan (C/QPP); and
• Healthcare. The federal government recently announced its intention to raise the eligibility age for OAS from 65 to 67, which will be examined further in section V. As part of this announcement, it was disclosed that the OAS/GIS programs will cost Canadians $108 billion in 2030, compared to $36.5 billion today. That in itself may signal a crisis to some, but the numbers need to be looked at in more detail.
The Cost of OAS/GIS The most important consideration is not the absolute cost of these programs, but whether or not they are affordable in a growing Canadian economy. The cost figures quoted in the preceding paragraph were produced by the chief actuary of the OAS program. However, they need to be examined in the context of other facts.
It should be first noted that OAS is taxable income, so much of the funds that are paid out will return to the federal government as tax revenue. In addition, OAS is further clawed back depending on the recipient’s income. For example, in 2012, OAS is lost at a 15% clawback rate if the recipient’s income exceeds $69,562. For incomes over $112,966, no OAS is received at all; i.e., it is all clawed back. Similarly, for GIS, a clawback rate of 50% applies. In this instance, no GIS is received if the recipient’s income exceeds $16,5121 (excluding OAS and the first $3,500 of employment income). In addition, OAS and GIS benefits rise with the Consumer Price Index (CPI), whereas tax revenues rise with the growth in gross domestic product (GDP). Normally, GDP will rise faster than CPI.
These factors help mitigate the situation with OAS/GIS, but they do not paint the entire picture around affordability. The projections performed by the chief actuary (the 9th Actuarial Report on the Old Age Security Program as at 31 December 2009) provide that information. Assuming that the cost of living rises at 2.3% per annum, and that earnings rise at 3.6% per annum, it is projected that:
• The number of beneficiaries of the basic pension is expected to almost double over the next 20 years, growing from 4.7 million in 2010 to 9.3 million by 2030, mainly due to the retirement of the baby boom generation over that period.
1 These amounts are different for married beneficiaries.

Report May 2013
11
• The number of GIS and Allowance beneficiaries is expected to almost double over the next 20 years, growing from 1.7 million in 2010 to 3.3 million by 2030.
• Total annual expenditures are projected to increase by 32% over the next five years, from $36.5 billion in 2010 to $48.3 billion in 2015 and to $108 billion by 2030.2
• OAS as a percentage of GDP would be 2.3% in 2010, which is similar to what the ratio was in 1980. After 2010, the ratio is expected to peak at 3.1% in 20303, driven largely by the retirement of the baby boom generation. This level is somewhat higher than the previous peak of 2.7% in the early 1990s. The ratio is then projected to fall to 2.6% by 2050, which is attributable to expected slower growth in inflation compared to growth in the GDP and projected higher incomes of new retirees.
It should also be noted that, if these assumptions materialize, each generation of retirees will receive an OAS benefit that will be a smaller ratio of their final pay (the replacement ratio) than the generations before.
It can therefore be argued that the increased cost of OAS/GIS does not represent a crisis.
The Cost of CPP/QPP The tri-annual actuarial reports have verified that both the Canada and Québec pension plans are sustainable at the legislated contribution rates for the next 75 years. The annual contribution rate for the CPP is 9.9%. With regards to the QPP, it is currently 10.15%, increasing to 10.8% in 2017. As with OAS/GIS, there is no apparent crisis affecting the sustainability of these programs.
International Comparisons It is insightful to compare Canada’s situation with other developing countries. Table 5 shows projected public pension expenditures as a percentage of GDP for selected countries (data effective January 2011):
2 There are three main contributing factors to the projected increase in costs over the 20-year period: baby boomers (41% of the increase); longevity improvements/declining mortality rates (32%); and the expected impact of inflation (27%). 3 The expected cost of OAS in 2030 as a percentage of the GDP was projected to be 3.16% in the 5th Actuarial Report on the Old Age Security as at 31 December 2000.

Report May 2013
12
Table 5 – Projections of Public Expenditure on Pensions, 2010–2060 (in percent of GDP)
Source: Pensions at a Glance 2011: Retirement-Income Systems in OECD and G20 Countries Part II.4: Long-term projections of public pension expenditure
Pension schemes for civil servants and other public-sector workers are generally included in the calculations for EU member states. Expenditures on these schemes are not included for Canada and the United States. Projections are not available for the United States and some EU member states for separate resource-tested programs for retirees. The projections are derived from the European Union’s aging report or from national projections.
Despite the limitations of such international comparisons, the table reveals broad trends. Pension spending is projected to grow nearly 40 per cent faster than GDP over the period 2010 to 2050 on average in the 28 Organisation for Economic Co-operation and Development (OECD) countries and the 27 European Union countries. This rate of growth is much slower than would result from demographic change alone.
Part II.5 of the same publication contains data on the old-age support ratio, which is the inverse of the ADR. It shows a halving of the number of people of working age to the number of people of pension age between 2010 and 2050. The OECD observes that “This would imply a doubling in the proportion of national income devoted to public pensions” and that “pension reforms explain why such an increase is not projected to take place”. The reforms cited are cuts in benefits for future retirees and increases in the age at which people first claim pensions.
Table 2 of the 25th Actuarial Report on the Canada Pension Plan as at 31 December 2009 (25th CPP Report) demonstrates that the old-age support ratio (the inverse of the ADR) for Canada less Québec falls from 4.6 in 2010 to 2.2 in 2050. Despite this fall, and without reforms to maintain sustainability such as those mentioned by the OECD, table 5 shows public expenditure on pensions for Canada is expected to rise modestly from 5.0% to 6.3% of GDP over the period.
Country 2010 2020 2030 2040 2050 2060
Australi
3.6 3.7 4.3 4.7 4.9 Austria 12.7 13.0 13.8 13.9 14.0 13.6 Canada 5.0 5.8 6.6 6.5 6.3 6.2 Denmar
9.4 10.6 10.6 10.4 9.6 9.2 Finland 10.7 12.6 13.9 13.6 13.3 13.4 France 13.5 13.6 14.2 14.4 14.2 14.0 German
10.2 10.5 11.5 12.1 12.3 12.8 Italy 14.0 14.1 14.8 15.6 14.7 13.6 Japan 8.9 9.5 Netherlands 6.5 7.8 9.3 10.3 10.3 10.5 New Zealand 4.7 5.3 6.7 7.7 8.0 Norway 9.6 11.5 12.7 13.4 13.3 13.6 Spain 8.9 9.5 10.8 13.2 15.5 15.1 Sweden 9.6 9.4 9.5 9.4 9.0 9.4 Switzerland 6.3 6.8 8.1 8.6 8.6 United Kingdom 6.7 6.9 7.6 8.0 8.1 9.3 United States 4.6 4.9 4.9 4.8 4.8 4.7

Report May 2013
13
The Cost of Healthcare Age is undoubtedly an important factor affecting the cost of health care, as can be clearly seen in figure 4 below. From that perspective, it is clear that the cost of health care should rise as the population ages:
Figure 4 – Relative Per Capita Costs of Health Care for Males and Females by Age
Source: Denton and Spencer, 1995 That being said, it can be demonstrated that the impact of population aging, in and of itself, is not huge and may be affordable. The estimates of the impact of aging on per capita total health costs in Canada (in real terms, net of inflation), for the whole population, generally place it at about 1% per capita per year (Barer et al, 1995). Barer et al. are famous for asking if the impending health care “crisis” is an avalanche or a glacier. (See table 7 below.) It has been noted that even a sustained trend of low economic growth would enable us to support an expansion of health care services adequate to satisfy the needs associated purely with the aging of the population (see also Marzouk (1991) and Sepehri and Chernomas (2004)).
A 1996 task force of the Canadian Institute of Actuaries also found that population aging, by itself, would cause health care delivery costs to rise about 1% per annum (Canadian Institute of Actuaries, 1996). This means that, if health care costs Canada 10% of GDP this year, the cost next year, due to population aging only would be 10.1% (and would be 12.2% in 20 years).
Relative cost per capita
(arbitrary units)

Report May 2013
14
There are reasons to believe that even the 1% assumption may be pessimistic. For example, Brown and Suresh (2004) point out that it is more correct to say that health care costs are a function of the year of death, rather than age. It is the high expenditures on health just prior to death, combined with the higher probability of death as we age, that drives health care spending, not the pure age of the population; i.e., older patients who continue to survive do not cost the system that much. Evidence of this is provided in table 6:
Table 6 – Cost Ratio: Died*/Survived Costs of Medical and Social Care by Age
Age Range Cost Ratio: Died*/Survived 65 16.7 75–76 8.4 85–87 3.8 90–93 2.5
* Last six months of life Source: McGrail et al. (2000) The impact of this is important. Health care is funded on a pay-as-you-go basis. Thus, as life expectancy improves, increased health care costs (if they are a function of time-at-death) are delayed. But costs that are delayed decrease the funding needed in any year to support the system.
Brown and Suresh compare their projected health care costs using separate cost factors for those who survive a year versus those who die to projections done by Denton and Spencer (1995) who simply apply (constant) average age-specific costs to an aging population with the following results:
Table 7 – Health Care Costs Projection
Denton and Spencer Brown and Suresh Year Health Care
Costs ($B) 10-Year Growth Rate
Health Care Costs ($B)
10-Year Growth Rate
2005 104.16 1.64 103.92 1.58 2015 123.22 1.69 122.29 1.64 2025 149.23 1.93 147.38 1.88 2035 172.30 1.45 169.31 1.40 2045 180.59 0.47 176.53 0.42 2055 186.06 0.30 181.01 0.25 2065 193.85 0.41 187.76 0.36 2075 199.98 0.31 192.77 0.26
[Note: The 70-year % growth rate is 0.94% per annum in the Denton and Spencer Projection and 0.89% in the Brown Suresh Projection.] Although it might be concluded that population aging is not the chief component of the rise in health care costs, there still exists a health care delivery system whose costs are rising, in total, faster than GDP. This factor alone should be a concern for policymakers. The rise in health care delivery costs alone from 2005 to 2035 overwhelms the total cost of the OAS program in 2035. Thus, if there is a focus on the problems of population aging and publicly funded services, that focus should be on health care delivery.

Report May 2013
15
Raising the Entitlement Age and Public Policy Given that the Canadian Social Security systems are sustainable for the foreseeable future, it is fair to question whether raising the normal retirement age of eligibility is a good public policy move.
To address this question, we can return to the work done by Brown, first with Bilodeau (1999) and later with Damm and Sharara (2001). Brown (1999) introduced a model that purported to be able to determine a macro-economic indicator of age at retirement. The philosophical basis for the model was that workers could retire at the earliest possible age so long as the consumption requirements for all members of society could be met. This was defined by a mathematical formula where the total demand for consumption of goods and services by all members of society (the numerator) was exactly matched by the supply of those goods and services (the denominator) produced by the active labour force. The balancing variable was the age of exiting the labour force (i.e., retirement, which moves one from the denominator to the numerator).
Brown first looked backward to see if his model fit the experience of the previous decade and found that (with a delay factor) there was a very high level of fit between what the model showed was the indicated age of retirement for society and what the actual age of retirement had been. Brown then applied the model to the future Canadian population and derived the following outcome:
Figure 5 – Median Retirement Age in Canada (1996 to 2047)
Source: Brown, Damm, Sharara, (2001, p8)
As stated, the balancing variable is the optimal age of retirement. However, there is one other important model variable. Note that we can obtain more output from the labour force in two ways. First, we can make the labour force bigger by having more members in that labour force (e.g., through immigration or with higher participation rates) or we can apply more capital investments into the economy and make each member of the labour force more productive. The

Report May 2013
16
above graph assumes that worker productivity grows by 0.9% per annum, which had been the average growth rate in the period from 1976 to 1998.
This graph shows that the extra period of work that would be necessary to maintain economic balance is not as dramatic a shift as one might presume. In the figure above, the minimum retirement age is 60.3 years in 2017 rising to 60.9 years in 2034. With productivity improvements of 1.29% per annum, no increase in retirement age is required at all. At the other extreme, if productivity growth were zero, then the retirement age would reach a minimum of 61.2 in 2005 and then have to rise to 65.7 in 2046.
Brown and Bilodeau (1999) argued that a rise in the retirement age might be advisable in terms of public policy, because life expectancy has improved measurably this half century with no commensurate rise in the age of entitlement for social security. Brown and Bilodeau (1999) show for Canada (which introduced the C/QPP and GIS in 1966) the retirement age that would keep life expectancy (and hence the expected period of receipt of social security benefits) constant at its 1966 level.
Table 8 – Retirement Age for Equivalent Life Expectancy
Year Male Female Combined 1966 65.0 65.0 65.0 1981 66.5 67.8 67.2 2001 69.2 69.9 69.6 2021 71.5 71.7 71.6 2041 73.8 73.6 73.7
Source: Brown and Bilodeau, 1999 Thus, politicians might be able to argue that the shift proposed for the OAS age of eligibility is less than the shift based on improved life expectancy. This might make raising the age of eligibility for OAS, as recently announced, politically saleable.
But, it must be realized that if one were to raise the age of eligibility at the same pace as improved life expectancy (i.e., as indicated in table 8), the cost of OAS as a percent of GDP would drop measurably. The program would be seriously eroded.
From figure 5 we can see that the median retirement age needed to achieve production/consumption equilibrium can decrease until 2017, where it reaches a local minimum of 60.3 years. After this date, even with 0.9% per annum increases in productivity, the median retirement age must rise to achieve the production/consumption equilibrium. The increase is projected to last until 2034, when the median retirement age reaches a local maximum of 60.9 years. After that, the retirement age is again projected to decrease (to 60.6 in 2041 and 60.0 in 2047).
The authors did not present this analysis as goals that could be achieved if correct public policy were legislated, but rather events that are inevitable in a stable economy.

Report May 2013
17
IV – THE SHIFT IN RETIREMENT AGE PRIOR TO ANY CHANGE IN OAS ELIGIBILITY AGE Canada Average retirement age – historical development and projections Retirement age decreased significantly in Canada during the 1970s, the 1980s, and even the 1990s. As shown in the following section, a similar downward trend was seen in most other developed countries. However, it is generally acknowledged that this trend towards a reduction in retirement age has come to an end over the last few years, at least with regard to the age of withdrawal from the labour market. In fact, as shown in figure 6, the age of withdrawal from the labour market has increased in Canada between 2000 and 2009. It stood at 63.4 for men and 62.2 for women in 2009 compared with 62.7 and 60.8 in 2000.
Figure 6 shows the past and future trends in the exit age from the labour force in Canada. It is based on the modified OECD methodology that relates the retirement age to withdrawals from the labour market. This methodology produces results that are somewhat lower than the ones shown in table 16. However, the general trend shows the projected increase in the average retirement age in Canada from 61.8 in 2009 (combined for both genders) to 64 by 2030 under the best-estimate assumptions of the 25th CPP Report.
Figure 6 – Projected Average Exit Age from the Labour Force Based on the Assumptions of the 25th CPP Report
Source: Office of the Chief Actuary, Canada
On the other hand, table 9 shows how stable the average age at which people start receiving their CPP and QPP retirement pension has been over the past few years.

Report May 2013
18
For Québec men, it remained almost unchanged between 2000 and 2010. For women, it decreased slightly from 61.9 in 2000 to 61.5 in 2003, and has remained stable since then. It is also important to keep in mind that roughly 50% of QPP beneficiaries begin receiving their benefits at age 60, which is the minimum QPP entitlement age. In fact, a significant number of people retire from the labour force before that age, and begin receiving benefits as soon as they are eligible. For CPP, the retirement age for men remained in the range of 62.4 to 62.7 from 2000 to 2010. For women, the retirement age remained in the range of 62.2 to 62.6 from 2000 to 2010, except for an increase to 63.1 in 2002. In general, slightly over 40% of CPP beneficiaries begin receiving retirement benefits at age 60.
However, historical data should be interpreted with caution, since recent changes to the actuarial adjustment factors, removal of the work cessation test, and recent introduction of the CPP working beneficiaries’ provision may impact the retirement behaviour of beneficiaries.
Table 9 – Canada Pension Plan and Québec Pension Plan: Average Pension Age
Year QPP CPP Male Female Overall Male Female Overall 2000 61.9 61.9 61.9 62.7 62.6 62.7 2001 61.8 61.7 61.7 62.7 62.5 62.6 2002 61.8 61.6 61.7 62.7 63.1 62.9 2003 61.8 61.5 61.7 62.6 62.5 62.5 2004 61.8 61.5 61.6 62.6 62.6 62.6 2005 61.8 61.5 61.6 62.6 62.5 62.6 2006 61.8 61.4 61.6 62.5 62.3 62.4 2007 61.8 61.5 61.6 62.4 62.6 62.5 2008 61.9 61.5 61.7 62.5 62.3 62.4 2009 61.9 61.5 61.7 62.5 62.5 62.5 2010 61.9 61.5 61.7 62.4 62.2 62.3
Source: Georges Langis, QPP Chief Actuary, Office of the Chief Actuary, Canada When coupled with the increased longevity over the recent decades, a stable retirement age implies a reduction in the active life/retirement ratio. This ratio is defined as the number of years actively at work divided by the number of years lived in retirement. Table 10 shows data based on Québec experience. For men, there were 1.9 years of active life for each year in retirement in 2005, compared with 2.6 years in 1980. For women, it decreased from 1.9 years in 1980 to 1.6 years in 2005.

Report May 2013
19
Table 10 – Changes in the Active Life to Retirement Ratio for Québec
Year Active Life (Years) Retirement (Years) Ratio Males 1980 42.8 16.7 2.6 1990 41.7 19.4 2.2 2005 41.9 21.7 1.9 Females 1980 42.5 21.9 1.9 1990 41.2 24.3 1.7 2005 40.7 26.0 1.6
Source: Actuarial Report of the Québec Pension Plan as at 31 December 2006. However, as shown in table 11, the proportion of QPP pensioners who keep working (and therefore contributing) has increased significantly over time. In 1998, 14.6% of men and 6.5% of women earned more than the $3,500 Basic Exemption, and therefore contributed to the QPP. In 2006, the percentages were 22.7% for men and 13.1% for women.
Table 11 – Proportion of QPP Retirement Pension Beneficiaries Aged 60 to 65 With Employment Earnings over $3,500
1998 2002 2006 Males 14.6% 20.1% 22.7%
Females 6.5% 10.2% 13.1%
Source: Régie des rentes du Québec, Working Paper – Toward a Stronger and Fairer Québec Pension Plan, Published 2009
In the case of the CPP, prior to January 1, 2011, the retirement beneficiaries who continued to work were not allowed to contribute to the CPP and did not accrue any additional benefits. As it can be seen from table 12, the proportion of working beneficiaries has increased significantly between 2001 and 2009 for all age groups and both genders. The most dramatic increase is for age group 60–64, with the percentage of female working beneficiaries increasing from 14.4% in 2001 to 26.4% in 2009, and the percentage of male working beneficiaries increasing from 24.1% to 37.2% over the same period. It should be noted that the proportion of working retirement beneficiaries in Québec is lower than in the rest of Canada. This trend is consistent with the fact that average pension age for the QPP is lower than for the CPP, as shown in table 9.

Report May 2013
20
Table 12 – Proportion Working Beneficiaries – Canada Pension Plan (%)*
Male 2001 2002 2003 2004 2005 2006 2007 2008 2009 60–64 24.1% 24.7% 26.5% 28.8% 31.9% 34.0% 35.9% 37.2% 37.2% 65–69 17.6% 18.1% 18.8% 19.8% 21.1% 22.7% 24.5% 25.8% 26.1% 70–74 9.5% 9.8% 9.9% 10.3% 10.9% 11.6% 12.5% 13.3% 13.6% 75+ 4.4% 4.4% 4.3% 4.4% 4.6% 4.9% 5.3% 5.5% 5.5% Overall 11.8% 12.0% 12.4% 13.2% 14.2% 15.2% 16.4% 17.3% 17.6% Combined 2001 2002 2003 2004 2005 2006 2007 2008 2009 60–64 19.1% 19.6% 21.1% 23.0% 25.6% 27.7% 29.5% 31.0% 31.5% 65–69 14.1% 14.5% 15.0% 15.8% 16.9% 18.3% 19.6% 20.9% 21.5% 70–74 7.4% 7.6% 7.7% 8.0% 8.5% 9.0% 9.7% 10.3% 10.6% 75+ 3.2% 3.2% 3.1% 3.2% 3.3% 3.5% 3.8% 3.9% 3.9% Overall 9.3% 9.4% 9.8% 10.3% 11.2% 12.0% 13.0% 13.8% 14.2%
Source: Office of the Chief Actuary, Canada * Ratio of working beneficiaries in year (with employment earnings > $3,500) to all retirement beneficiaries who took their retirement prior to year and who were in receipt of a retirement pension throughout year. Transition from Work to Retirement: CPP Working Beneficiaries The following summarizes the characteristics of CPP working beneficiaries in 2005:
• In 2005, out of 329,000 working beneficiaries, 64% were male. • On average, 71% of working beneficiaries were employed (salaried) and 29% were self-
employed. More males were self-employed at 32% compared to females at 23%. The proportion of self-employed individuals increases with age: older individuals (75+) were self-employed at 46% compared to their younger counterparts (61–64) at 22%.
• The majority of male working beneficiaries had CPP benefits in the range of 75% to 100% of the maximum pension, at an average of 84% of the maximum. Female beneficiaries received CPP benefits that were more evenly distributed, at an average of 60% of the maximum. Employed (salaried) beneficiaries received a slightly higher CPP pension (76% of the maximum) compared to self-employed (71% of the maximum).
• In 2005, working CPP beneficiaries in general had higher career-average earnings than the non-working CPP beneficiaries. The following figures show that for 2005 male CPP working beneficiaries, the average career-average earnings were 158% of the Yearly Maximum Pensionable Earnings (YMPE) as compared to 143% of the YMPE for non-
Female 2001 2002 2003 2004 2005 2006 2007 2008 2009 60–64 14.4% 15.0% 16.1% 17.7% 19.7% 21.9% 23.6% 25.3% 26.4% 65–69 10.1% 10.5% 10.9% 11.6% 12.5% 13.6% 14.6% 15.9% 16.8% 70–74 5.0% 5.1% 5.3% 5.5% 5.8% 6.2% 6.6% 7.1% 7.4% 75+ 2.0% 2.0% 2.0% 2.0% 2.1% 2.2% 2.4% 2.5% 2.5% Overall 6.6% 6.7% 7.0% 7.5% 8.1% 8.8% 9.6% 10.4% 10.9%

Report May 2013
21
working male CPP beneficiaries. For females, these earnings levels were 72% and 62% of the YMPE for working and non-working CPP beneficiaries respectively. The career-average earnings are in general higher for older working beneficiaries.
Figure 7 – Average Career-Average Earnings as % of YMPE for Working and Non-working Retirement Beneficiaries (2005) – Females
Source: Office of the Chief Actuary, Canada
Figure 8 – Average Career-Average Earnings as % of YMPE for Working and Non-working Retirement Beneficiaries (2005) – Males
Source: Office of the Chief Actuary, Canada
• About 52% of the 2005 CPP working beneficiaries (54% male, 48% female) received a private pension and 62% (60% male, 65% female) received investment income in addition to their CPP pension. The proportion of working beneficiaries with private pensions or investment income increases with age. About 15% of beneficiaries received RRSP income.

Report May 2013
22
• In 2005, the proportion of working beneficiaries receiving GIS at ages 65–69 was 9% for males and 8% for females. This was much lower than for general population (25% for males and 30% for females at ages 65–69).
• The employment income (employed and self-employed) makes up almost 50% of the income of working beneficiaries, while the CPP benefit constitutes 9% of the income.
Figure 9 – Distribution of Income for 2005 CPP Working Beneficiaries – Both Genders
Source: Office of the Chief Actuary, Canada
• In 2005, employment income of CPP working beneficiaries was at 86% of the YMPE (105% for men and 54% for women). The level of employment income increases with age.
Transition from Work to Retirement: Québec Experience A study entitled La transition travail-retraite – Données de 1991 à 20074 (Transition from Work to Retirement: 1991–2007) was published by the Régie des rentes du Québec. It aims to merge the idea of receiving a pension and withdrawal from the labour force. Retirement is defined as a significant reduction in employment earnings and sustained reliance on retirement income. It does not imply that the person totally stops working; it means rather that the person no longer relies on employment income as the major source of income. Such a definition is more up to date with the behaviour of workers who do not necessarily transition from the labour force to retirement in a totally and irreversible way at a given date.
This study is based on longitudinal data, looking at people who retired within the period 1991–2007. Retirement age was estimated considering that, prior to retirement, the person was relying
4 Régie des rentes du Québec, 2010.

Report May 2013
23
mainly on work income (at least 50%), whereas pension revenue has become the main source of income (at least 50%) following retirement. Different sources of retirement income were considered: OAS/GIS, QPP/CPP, private pension, and retirement income received from RRSPs. Interesting conclusions can be drawn from this:
• The pattern of effective retirement age has been rather flat over the years (figure 10). A modest increase, of about one half year, has been registered between 2003 and 2007.
Figure 10 – Retirement Age, Male and Female
Note: the lower retirement age for the year 1997 is the result of an early retirement program in the public sector.
• The effective retirement age is higher for individuals who rely, at least partially, on self-employment income (figure 11). The income replacement rate is also higher (figure 12) for those individuals with self-employment income.
55
56
57
58
59
60
61
Year of retirement
Male Female

Report May 2013
24
Figure 11 – Retirement Age, by Employment Status
Figure 12 – Income Replacement Rate, by Employment Status
• Effective retirement age decreases with earnings, except for high-income workers (more
than $80,000) who show a stronger attachment to the labour force (figure 13). The income replacement rate of the high-income earners is also slightly lower on average, especially for those who earned more than $100,000 per year (figure 14).
60 %
65 %
70 %
75 %
80 %
85 %
Year of retirement
With self - employment income Without self - employment income
55
56
57
58
59
60
61
62
Year of retirement
With self - employment earnings Without self - employment income

Report May 2013
25
Figure 13 – Retirement Age, by Earnings Level
55
56
57
58
59
60
61
62
Pre-retirement earnings (in thousands of dollars)
Figure 14 – Income Replacement Rate, by Pre-retirement Earnings Level
50 %55 %60 %65 %70 %75 %80 %85 %90 %95 %
100 %
Pre-retirement earnings (in thousands of dollars)
• On average, income replacement rates are lower for individuals who retire before 65 (figure 15). Of course, those individuals are not entitled to public pensions as soon as they retire (OAS before 65 and QPP before 60).

Report May 2013
26
Figure 15 – Income Replacement Rate, by Age
60 %
65 %
70 %
75 %
80 %
85 %
90 %
Age of retirement
Relying on the definition of retirement used in this study makes it easier to characterize gradual retirement. The retirement age is then lower than both the QPP pension age and the labour force retirement age discussed previously, although a significant percentage of pensioners maintain some form of employment following retirement:
• 29% of retirees were still receiving employment income in the year following retirement (table 13). This was also the case 10 years after retirement for 18% of retirees (table 14). The percentage of retirees with employment income is significantly higher for men.
Table 13 – Percentage of Retirees Having Employment Income in the Year Following Retirement
Total Income Before Retirement Males Females Overall
Less than $20,000 30% 19% 22% $20,000–$39,999 28% 18% 22% $40,000–$59,999 33% 20% 28% $60,000–$79,999 40% 24% 37% $80,000+ 50% 36% 48% Overall 35% 20% 29%
Report May 2013
27
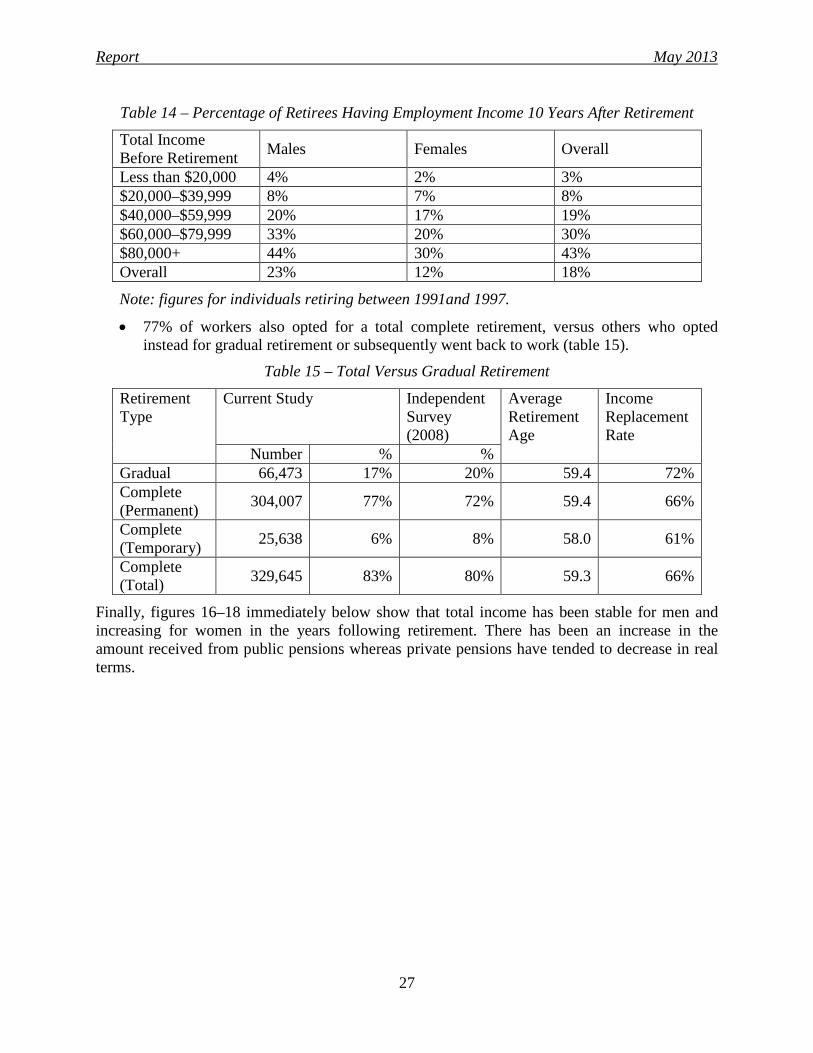
Table 14 – Percentage of Retirees Having Employment Income 10 Years After Retirement
Total Income Before Retirement Males Females Overall
Less than $20,000 4% 2% 3% $20,000–$39,999 8% 7% 8% $40,000–$59,999 20% 17% 19% $60,000–$79,999 33% 20% 30% $80,000+ 44% 30% 43% Overall 23% 12% 18%
Note: figures for individuals retiring between 1991and 1997.
• 77% of workers also opted for a total complete retirement, versus others who opted instead for gradual retirement or subsequently went back to work (table 15).
Table 15 – Total Versus Gradual Retirement
Retirement Type
Current Study Independent Survey (2008)
Average Retirement Age
Income Replacement Rate
Number % % Gradual 66,473 17% 20% 59.4 72% Complete (Permanent) 304,007 77% 72% 59.4 66%
Complete (Temporary) 25,638 6% 8% 58.0 61%
Complete (Total) 329,645 83% 80% 59.3 66%
Finally, figures 16–18 immediately below show that total income has been stable for men and increasing for women in the years following retirement. There has been an increase in the amount received from public pensions whereas private pensions have tended to decrease in real terms.

Report May 2013
28
Figure 16 – Income of Québec Pensioners in the Years Following Retirement: Total Income
Figure 17 – Income of Québec Pensioners in the Years Following Retirement: Private Pensions
0
5 000
10 000
15 000
20 000
25 000
1 2 3 4 5 6 7 8 9 10
Inco
me
($ o
f 200
7)
Number of years since retirement
Male Female
Inco
me
($ o
f 200
7)
0
5 000
10 000
15 000
20 000
25 000
30 000
35 000
40 000
1 2 3 4 5 6 7 8 9 10
Income ( $ of 2007)
Number of years since retirement
Male Female

Report May 2013
29
Figure 18 – Income of Québec Pensioners in the Years Following Retirement: Public Pensions
0
2 000
4 000
6 000
8 000
10 000
12 000
14 000
1 2 3 4 5 6 7 8 9 10
Inco
me
($ o
f 200
7)
Number of years since retirement
Male Female
Conclusions In summary, recent statistics on retirement age from the labour force show an increase in average retirement age in Canada. This is not necessarily coupled with an increase of the age at which people become entitled to a pension. Recent experience has been characterized by an increasing number of retirees combining some form of employment income with their pension income in the years following retirement. In other words, retirement should not be analysed solely on the basis of “a single age”, since the transition from work to retirement is a process increasingly spread over time, with a combination of work and pension income over a certain number of years.
International Observations It is instructive to compare the experience in Canada with what is happening in other countries. It should be noted that social security systems and retirement practices differ from country to country, so it will be difficult to draw concrete conclusions. However, a review can still provide some valuable insights. Average Effective Retirement Ages – Historical Development According the OECD, there was a strong trend to early retirement throughout the 1970s and 1980s, which came to an end for men in the mid-1990s and for women slightly later. Thereafter, the average age of labour market exit was broadly constant for a few years, and there has been a trend to later retirement in recent years. A detailed analysis of the pathways into retirement suggests that for men, at least half of them use routes such as unemployment or sickness or

Report May 2013
30
disability benefits in half of the countries covered. Women often leave the labour market to care for family members.5
Table 16 shows the average age at which older workers withdrew from the labour force over the period 1970–2009 for selected OECD countries, which is the average effective retirement age.6 The OECD notes:
The average effective age of retirement is calculated as a weighted average of (net) withdrawals from the labour market at different ages over a five-year period for workers initially aged 40 and over. In order to abstract from compositional effects in the age structure of the population, labour force withdrawals are estimated based on changes in labour force participation rates rather than labour force levels. These changes are calculated for each (synthetic) cohort divided into five-year age groups. The estimates shown in italics are less reliable as they have been derived from interpolations of census data rather than from annual labour force surveys.
5 OECD, 2011. 6 OECD, 2011.

Report May 2013
31
Table 16 – Average Effective Retirement Ages in Selected OECD Countries
Source: “Statistics on average effective age and official age of retirement in OECD countries”
at http://tinyurl.com/bl3d8t8
In all the countries shown in the table, the effective retirement age has declined since 1970. In recent years, for both men and women, there has been a small increase in the effective retirement age; however, it is still well below the levels in 1965–1970.
1970 1980 1990 2000 2009 1965-70 1975-80 1985-90 1995-00 2004-09
Australia 67.4 64.1 62.5 62.0 64.8 Austria 66.8 64.8 62.7 60.3 58.9 Canada 65.9 64.9 63.3 62.7 63.4 Denmark 68.3 65.5 65.4 63.4 64.4 Finland 65.9 65.9 61.3 60.2 61.8 France 67.6 63.5 60.0 58.8 59.1 Germany .. .. .. 61.0 61.8 Italy 65.9 62.2 62.3 60.2 61.1 Japan 72.3 70.7 70.4 70.1 69.7 Netherlands 66.6 63.0 59.7 60.6 62.1 New Zealand 69.5 66.2 63.0 64.3 67.1 Norway 68.2 67.3 63.3 63.9 64.7 Spain 69.4 64.8 62.9 61.7 61.8 Sweden 67.9 65.3 64.2 63.7 66.0 Switzerland 72.0 69.5 67.8 65.5 65.7 United Kingdom 67.7 66.0 62.8 62.4 64.3 United States 68.5 66.4 64.7 64.7 65.5
Australia 65.2 60.1 60.4 59.7 62.9 Austria 64.2 62.6 60.8 58.9 57.5 Canada 66.3 63.9 61.8 60.8 62.2 Denmark 66.0 64.3 61.9 59.8 61.9 Finland 62.0 62.7 60.7 59.9 61.4 France 68.2 64.1 60.0 58.9 59.7 Germany .. .. .. 60.2 60.5 Italy 62.1 61.8 59.3 58.8 58.7 Japan 68.1 66.6 66.4 66.2 67.3 Netherlands 66.7 64.1 58.8 58.7 62.6 New Zealand 68.9 63.8 61.3 59.9 65.0 Norway 68.2 65.9 62.6 63.7 64.5 Spain 71.9 66.6 64.9 61.9 63.4 Sweden 66.6 64.0 62.5 62.3 63.6 Switzerland 72.1 66.8 65.9 62.3 63.5 United Kingdom 65.7 62.6 60.7 60.9 62.1 United States 68.0 66.3 64.9 63.5 64.8
Females
Country
Males

Report May 2013
32
Official Retirement Ages Table 17 shows the average effective age at which older male workers withdraw from the labour force and the official age of entitlement in public programs in selected OECD countries. The official age corresponds to the age at which a full old-age pension can be received in 2010, irrespective of whether a worker has a long insurance record of years of contributions.

Report May 2013
33
Table 17 – Retirement ages and Recent Changes in Selected OECD Countries7
Country Effective (Male)
Official (2010)
Current or ultimate age
(year)
Changes in official retirement age (year legislation enacted)
Australia 64.8 65 (F 64) 67 (2023) Ages to be equalized at 65 by 2014; increased to 67 over 2017-23. (2009)
Austria 58.9 65 (F 60) 65 (F 60) Increase under discussion.
67 (2029) OAS: Lowered from 70 over 1965-69 (1965); increase to 67 over 2023-29. (2012)
65 CPP/QPP
Denmark 64.4 65 67 (2027)Lowered from 67 to 65 (1999); increasing to 67 over 2024-27; thereafter every 5 years according to life expectancy at age 60. (2011)
Finland 61.8 65 65 Increase under discussion.
France 59.1 60 60 Lowered from 65 to 60 (1983); increased to 62 in 2017 (2011); increase reversed (2012).
Germany 61.8 65 67 (2029) Increasing to 67 over 2012-29. (2007)
Italy 61.1 65 (F 60) 67 (2022)Increasing to 66 (F 62) in 2012; 66 over 2013-18 and 67 over 2019-22. (2011)
Japan 69.7 64 (F 62) 65 (2018) National insurance plan ages increasing from 60 to 65 (M) over 2001-13 and from 55 to 65 (F) over 2006-18. (1994)
Netherlands 62.1 65 67 (2023) Increasing to 66 over 2013-19 and to 67 in 2023. (legislation pending)
New Zealand 67.1 65 65 Increase to 67 under discussion.Norway 64.7 67 67 Lowered from 70 (1973).Spain 61.8 65 67 (2027) Increasing to 67 over 2013-27. (2011)
Sweden 66.0 65 65
Retirement after age 61; amount of pension is based on average life expectancy for the cohort at retirement and an implicit rate of return of 1.6%. The means tested Guarantee Pension is available at age 65. (1998)
Switzerland 65.7 65 (F 64) 65 (F 64) Increase in F age to 65 rejected in 2010.
United Kingdom 64.3 65 (F 60) 67 (2028)Ages to be equalized at 65 over 2016-18; increasing to 66 over 2018-20 and to 67 over 2026-28; State Pension Age to be linked to life expectancy. (legislation pending)
United States 65.5 65.8 67 (2027) Increasing from 65 to 67 over 2003-2027. (1983)
Changes since 2010Average effective age of retirement versus the official age, 2004-20091
6563.4Canada
1 Source: Ageing and Employment Policies – Statistics on average effective age of retirement (OECD) http://tinyurl.com/bl3d8t8
7 It is reported that in the Netherlands the increase in the retirement age to 67 may be advanced from 2023 to 2021. See Investment & Pensions Europe.

Report May 2013
34
Aside from Japan, the effective male retirement age is well below the official age for receiving a full old-age pension. Table 17 also shows recent changes in the official entitlement age. It shows the basic public program current or ultimate official entitlement age, and where applicable, the year the relevant legislation was enacted. Information on changes since 2010 is drawn from multiple sources.
Table 17 focuses solely on retirement age. It must be interpreted with caution, since there is great variation among public pension programs, for example, in their structure (e.g., benefit formulas, replacement rates), their provisions for early or deferred retirement, their interaction with other social security benefits and the availability and provisions of supplements for low-income pensioners, all of which affect the age when workers retire. In addition, some countries (e.g., France and Italy) allow retirement at a lower age after a specified number of years of contributions.
According to the OECD Pensions Outlook 2012:
Most OECD countries have already begun to increase pensionable ages, or plan to do so in the near future. Age 65 remains the modal age at which people normally draw their pensions, accounting for 17, or half, of OECD countries for men and 14 countries for women. But 67—or higher—is becoming the new 65. Some 13 countries (12 for women) are either increasing pension ages to this level or, in the cases of Iceland and Norway, are already there. Italy, which links pension age and seniority requirements to life expectancy from 2013 and Denmark, which plans to link pension age to life expectancy from the mid-2020s, are forecast nearly to reach age 69 in 2050. The United Kingdom has accelerated the increase in the pensionable age, which will move from 65 to 66 by 2020 (six years earlier than planned) and from 66 to 67 by 2026–2028 (10 years earlier than planned).8
Policy Statements – International Organizations Policy advice on public pensions provided by international bodies is not necessarily relevant to Canada, as each country’s socio-economic conditions and public pension programs are unique. Nevertheless, it is of interest to know the measures these bodies are advising their national constituents to take.
a) European Commission In February 2012, the European Commission published a White Paper on adequate, safe and sustainable pensions.9 It puts forward a range of initiatives to help create conditions so that those who are able can continue working, thereby leading to a better balance between time in work and time in retirement. At the European Union level, in order to support and complement national pension reforms, among other recommendations the White Paper proposes to:
• Create better opportunities for older workers by calling on the social partners to adapt workplace and labour market practices and by using the European Social Fund to bring older workers into work. (The European Social Fund is the European Union’s main financial instrument for supporting employment in the member states as well as promoting economic and social cohesion.)
8 OECD, 2012. 9 European Commission, 2012.

Report May 2013
35
• Encourage member states to promote longer working lives, by linking retirement age with life expectancy, restricting access to early retirement, and closing the pension gap between men and women.
b) OECD The final communiqué of the 2011 Ministerial Meeting on OECD Social Policy, “Building a Fairer Future: The Role of Social Policy”, includes references to pensions.10 Concerning pensions and retirement the communiqué states:
We agreed that pension systems should remain socially adequate and financially sustainable. The design of reforms should focus not only on pension expenditures, but also on securing adequate financial resources and coverage of schemes . . . Most of our countries have reduced financial incentives to retire early but pension policies should also seek to increase the effective age of retirement to reflect increasing life expectancy. More efforts may be required in some countries, notably employer-driven initiatives to provide suitable working conditions, including flexible working time, retraining opportunities and health and safety at work, in order to promote employment and employability of older workers and new forms of work organisation throughout the life-cycle.
From Pensions at a Glance 2011: . . . the OECD observes that Governments’ long-term projections for public expenditure on pensions are heavily reliant on the assumption that people will retire later in the future. But it is important to bear in mind the scale of the challenge in realising such a change. The average age of labour-market exit for men in OECD countries is 63.5 on the latest estimates and for women, it is 62.3. If life expectancy continues to increase, as most forecasts show, then significant increases in the effective retirement age are required to maintain control of the cost of pensions.
In 2050, only an effective retirement age of 66.6 for men and 65.8 for women would leave the duration of retirement at the same level as it is now (based on United Nations population projections).
c) International Monetary Fund (IMF) In 2011, the IMF Fiscal Affairs Department published “The Challenge of Public Pension Reform in Advanced and Emerging Economies”.11 This paper is consistent with the recommendations of the European Commission and the OECD. Highlights include:
• Pension reforms should not undermine the ability of public pensions to alleviate poverty among the elderly.
• Gradually raising the entitlement age can avoid the need for cuts in replacement rates, and in countries where the tax burden is already high, avoid increases in contribution or tax rates which could jeopardize competitiveness and growth prospects. Raising the entitlement age (and indexing the entitlement age to life expectancy) may be easier for the public to understand and accept than cutting pensions or increasing contributions.
10 OECD, 2011. 11 IMF, 2011.

Report May 2013
36
• Raising the entitlement age can help boost GDP by increasing the number of years the average person spends working rather than in retirement.
• Gradual increases in official entitlement ages have already been legislated in many advanced economies. However, there is room for more ambitious increases. On average, the increases are expected to raise the official entitlement age by about one year over 1990–2030, while there will be a roughly five-year increase in life expectancy at retirement over this period.
• Increases in the entitlement age should be accompanied by measures that protect the incomes of those who cannot continue to work.
• Over the long run, there is no reason why increasing the number of older workers would affect employment opportunities for younger generations—just like the large increase in the number of female workers has not resulted in fewer jobs for men over the last few decades.
d) International Labour Organization The International Labour Organization’s (ILO) social security standards promote a comprehensive and consistent set of complementary policies and measures providing income security and affordable access to medical care. ILO Conventions No. 102 and 128 stipulate that old-age pensions are to be paid to persons reaching the age prescribed by national legislation, which generally should not be higher than 65. The conventions allow a higher entitlement age if it can be justified, giving “due regard to the working ability of elderly persons” and “demographic, economic and social criteria, which shall be demonstrated statistically”. Convention No. 128 provides that if the prescribed age is 65 years or higher, the age shall be lowered for persons engaged in occupations that are deemed to be arduous or unhealthy.
According to the ILO, the growth in number and proportion of older people in many countries around the world has led to growing concerns about existing social policies and whether they are equitable to all parts of society. Pressures on retirement pension systems have been met with calls simply to raise entitlement ages and extend working life. This assumes a simple extension of the status quo for older workers in the labour market, which may not be realistic. In order to take into account the situation of older workers, policies must be developed to address inequities in the labour market. A policy tool that has received increasing attention has been age discrimination legislation which can help to extend working lives for older workers who are able and choose to continue to work, and help ensure decent conditions of work and employment.12
In total, the data in this section of the report indicate that we should expect that Canadian workers will stay in the labour force longer, regardless of public policy.
12 ILO, 2008.

Report May 2013
37
V – RECENT CHANGES TO OAS AND C/QPP OAS/GIS The OAS program and the C/QPP are the cornerstones of the Canadian retirement income system. As such, the age when Canadians become eligible to receive OAS and the CPP retirement benefits impacts the retirement behavior of the population. This is especially true for the segment of the population not covered by private employer-sponsored pension plans.
The aging of the population due to decreasing fertility and increasing longevity impacts both legislated and effective retirement ages of the population. The 25th CPP Report projects that the cohort life expectancy at age 65 is expected to increase by more than two years from 2010 to 2050 for both males and females. Assuming that the status quo is maintained with respect to the provisions of the OAS and the CPP, and labour force participation rates for older workers do not change, these demographic developments will eventually result in a decrease in contributions and tax revenues, and in an increase in expenditures.
From an individual’s point of view, the risk of outliving retirement savings is increasing. This risk is even further exacerbated by the facts that, in 2010, only 39% of Canadian workers are covered by registered pension plans and, out of this number, approximately one-sixth of members are in defined contribution plans13.
In 2012, the federal government introduced changes to the OAS program in Bill C-38, the Jobs, Growth and Long-term Prosperity Act14. Two main changes proposed are the increase in the eligibility age for the OAS and the introduction of the possibility to delay retirement.
The eligibility age for the basic OAS pension and the GIS will increase from 65 to 67 starting from April 2023, with full implementation by January 2029. Below is the implementation schedule for this change. Individuals 54 years of age or older as of March 31, 2012, are not affected. The eligibility age for the Allowance will increase from age 60 to age 62 in line with changes to the OAS/GIS eligibility age.
13 2010 numbers based on Statistics Canada’s Pension Plans in Canada and Labour Force Survey. 14 Bill C-38, the Jobs, Growth and Long-term Prosperity Act, received the Royal Assent on June 29, 2012.

Report May 2013
38
Table 18
Source: Jobs, Growth and Long-term Prosperity – Economic Action Plan 2012, page 197
It was acknowledged in the Budget that the increase of the eligibility age for the OAS pension will have an impact on other programs, such as federal programs providing income support to age 65 (e.g., Veteran Affairs Canada, and Aboriginal Affairs and Northern Development Canada) and the survivor and disability benefits of the CPP.
Starting from July 2013, the OAS pension can be voluntarily deferred for up to five years. The deferred pension will be actuarially adjusted, using an actuarially neutral basis. The adjustment is 0.6% per month, or 7.2% per year. The actuarial adjustments do not apply to the GIS. This change is aimed at increasing labour market participation among older workers.
It is also projected that by 2030, the number of OAS and GIS beneficiaries will be respectively lower by about 1 million and 230,000 compared to the 10th OAS Report.
It remains to be seen how popular this measure will be, and how it will impact retirement behaviour with respect to other retirement system tiers.
It needs to be recognized that raising the eligibility age for OAS will be viewed by some commentators as regressive legislation. It is well known that wealthy Canadians live longer than poorer Canadians. Any constant change to the age of entitlement thus is a larger percentage cut to benefits for someone in the lower socio-economic strata than someone who is wealthier.
C/QPP The current C/QPP eligibility rules provide a degree of flexibility in choosing the age where one starts to receive a retirement benefit. Currently, a person aged 60 or over is eligible for a C/QPP retirement pension, provided contributions have been made during at least one calendar year. If a retirement pension is taken before age 65, it is adjusted downward by multiplying the pre-65 monthly adjustment factor by the number of months between age 65 and the pension commencement age. If the retirement pension is taken after age 65, then its amount is adjusted upward by multiplying the post-65 monthly adjustment factor by the number of months between age 65 and the pension commencement age or, if earlier, age 70. The adjustments are made in order to take account of the length of contributory period and the length of benefit payment period.

Report May 2013
39
So far, both pre-65 and post-65 monthly adjustment factors were set at 0.5%. These factors resulted in the reduction in pension benefits of 30% at age 60, and an increase in pension benefits of 30% at age 70. Actuarial adjustments have been left unchanged since inception (1984 for QPP and 1987 for CPP) despite significant shifts in the economic and demographic factors.
Starting in 2011, the actuarial adjustments factors of the CPP are scheduled to change in order to be restored to their actuarially fair values. For contributors who take their retirement benefit early, the adjustment factor will gradually increase to 0.6% per month over a period of five years starting in 2012. For those who take their benefit after age 65, the factor will gradually increase to 0.7% per month over a period of three years starting in 2011. The pension adjustment factors will come into effect according to the following schedule:
Table 19 – Schedule of Pension Adjustment Factors
Effective Date Pre-65 Downward Adjustment Factor
Post-65 Upward Adjustment Factor
Jan 1, 2011 0.50% 0.57% Jan 1, 2012 0.52% 0.64% Jan 1, 2013 0.54% 0.70% Jan 1, 2014 0.56% 0.70% Jan 1, 2015 0.58% 0.70% Jan 1, 2016 0.60% 0.70%
The downward pension adjustment factor of 0.6% per month, applicable for years 2016 and thereafter, will result in a pension that is reduced by 36% for pension take-up at age 60. The upward factor of 0.7% per month, applicable for years 2013 and thereafter, will result in a pension increased by 42% for pension take-up at age 70.
These factors were determined using the steady-state method. Under the steady-state method, actuarial neutrality occurs when the net cost to the plan (steady-state contribution rate) is the same whether each individual takes the benefit at age 65 or at any other age from 60 to 70 inclusive. Actuarial adjustments that are set to achieve this objective are said to be actuarially cost-neutral for the plan and for plan members on a collective basis. However, it is important to note that an actuarial adjustment derived in this manner may not be actuarially neutral for a particular individual plan member.
For the QPP, the new pension adjustment factors will be phased-in as of 2013 for retirement after 65 and 2014 for retirement before 65. Moreover, the 0.6% pension adjustment factor will be applied only to retirees entitled to the maximum pension. The adjustment factor will be lower for a person receiving less than the maximum pension and it will stay at 0.5% for very small pensions. Further changes to both the CPP and the QPP were introduced recently in order to accommodate alternative retirement paths, i.e., allow for the combination of work and retirement.
The Work Cessation Test was formerly applied in order for a retirement pension to become payable before age 65. This test required individuals who apply to take their C/QPP retirement benefit early (i.e., before age 65) to either stop working or materially reduce their earnings both in the month immediately preceding and the month of benefit take-up. The month following the start of pension payment, an individual could return to work and/or earn more without affecting the eligibility for, or amount of, the benefit. There was no work cessation test for those aged 65

Report May 2013
40
or older. Commencing January 1, 2012, the CPP was amended by removing the Work Cessation Test. For the QPP, the Work Cessation Test will be removed as of January 1, 2014, at the same time that new pension adjustment factors are adopted.
Since 1998, QPP beneficiaries who choose to work while receiving their retirement pension have to contribute along with their employer. In return, they receive an annual retirement pension supplement that is 0.5% of their contributory earnings.
Since January 1, 2012, CPP beneficiaries aged less than 65 who choose to work while receiving their retirement benefit are also required, along with their employers, to contribute to the plan. Working beneficiaries aged 65 or older are given the option of continuing to contribute to the plan; however, employers of those opting to do so are also required to contribute. The contributions paid by working beneficiaries provide for a post-retirement benefit that is earned at a rate of 1/40 of the maximum retirement pension under the basic plan per year of additional contributions, and is adjusted for the earnings level and age of the contributor.
In both schemes, the resulting total pension may be greater than the maximum pension payable. No further contributions are permitted upon attaining age 70.
Similar to the OAS, the C/QPP is affected by the demographic pressure. To quote the Executive Summary of the 25th CPP Report:
If recent short-term improvements in life expectancies continue, especially for ages 75 to 89, the long-term assumptions will need to be adjusted accordingly. This will put additional pressure on the minimum contribution rate that could cause the rate to increase above 9.9%.
If the CPP were to implement the increase in age when the unreduced retirement pension is available, the rule of thumb is that for each year of increase, the minimum contribution rate will be reduced by 0.3%. These estimates are based on the information provided by the Office of the Chief Actuary and presented in the paper by Martin Hering and Thomas R. Klassen “Is 70 the new 65?”15 The cost of increase in retirement age depends on many factors: economic and demographic assumptions, schedules of increase (i.e., notice period and transition period), and assumptions on the take-up rates.
Finally, increasing the normal entitlement age is equivalent to a reduction in the pension amount on an age-to-age comparison. Nonetheless, it would create an incentive to work longer to guarantee a certain level of income at retirement.
VI – RETIREMENT AGE AND DEFINED BENEFIT PENSION PLANS Background Unlike defined contribution (DC) pension plans, defined benefit (DB) pension plans can encourage employees to retire at certain ages and discourage them from retiring at others. This is usually accomplished by making “unreduced” pensions available to members who satisfy prescribed age/service conditions when they retire while those who do not satisfy these conditions receive pensions that are subject to unappealing reductions.
Early retirement incentives are both expensive and popular. Plan members generally appreciate an option to retire at an early age on attractive terms if they no longer enjoy their work or if they
15 Hering and Klassen, 2010.

Report May 2013
41
are unable, for health or other reasons, to keep their jobs. Unions see early retirement as an attractive option for members who have spent decades doing physically demanding and/or repetitive work. Employers, while not enthusiastic about the high cost of advantageous early retirement options, have generally been prepared to offer them as an attractive compensation element and as a tool for facilitating the retirement of older workers.
In recent years, DB pension plans have become more expensive than was the case in the 1980s and 1990s due to plan maturity, low interest rates, increasing life expectancies and disappointing stock markets. Early retirement options are now viewed by many employers as a luxury that can no longer be afforded. Moreover, members who qualify for unreduced pensions are less inclined to retire than was the case 10 years ago because:
• Their personal retirement savings and/or those of their spouses have not performed as well as expected; or
• High levels of economic uncertainty have made them understandably cautious about giving up their jobs; or
• They enjoy their jobs and want to continue to work notwithstanding the financial incentives to retire.
For these and other reasons, early retirement incentives are becoming less prevalent in the private sector, as are DB pension plans. However, they remain a prominent feature of public sector pension plans.
Terminology At any point in time, the active members of a DB pension plan have accrued pensions based on their service (i.e., the length of time they have participated in the pension plan), earnings (possibly) and the formula set out in the plan document (for example, 2% of final average earnings for each year of service). These accrued pensions are further defined by:
• The age at which they commence, usually called the normal retirement age (NRA)—typically age 65;
• The frequency with which payments are made (usually monthly); • The benefits, if any, payable upon the death of the member (typically to the member’s
surviving spouse or estate); and • Whether, and to what extent, the pension payments are indexed to changes in the cost of
living.
The term “normal retirement age” is somewhat misleading. It is not the age at which members normally retire. There are many pension plans where only a small percentage of the workforce will work up to the “normal” retirement age of 65. For this reason, the NRA is best viewed as the age at which accrued pensions are available without reduction, not the age at which members retire. In particular, when a vested member ceases employment before becoming eligible to retire, the member’s deferred pension will commence at the NRA without reduction (or earlier with reduction, if the member so elects).
The early retirement age (ERA) is the earliest age at which a terminating member can draw an immediate pension, usually a reduced pension (i.e., the full accrued pension reduced actuarially, or according to some formula, in recognition of the fact that $1 of pension payable for life starting immediately is worth more than $1 of pension payable for life starting at the NRA).

Report May 2013
42
Pension standards legislation will usually stipulate that pension plans must allow members to retire with an immediate pension if they cease working after the age of 55.
The unreduced retirement age (URA), sometimes called the pensionable age, is the earliest age at which a member can retire and immediately receive the full, unreduced, accrued pension. In many pension plans, the URA is the same as the NRA, i.e., pensions commencing prior to the NRA are always subject to reduction. Other plans waive the early retirement reductions otherwise applicable if employees satisfy certain age/service criteria at the time employment ceases. For example, a plan with an NRA of 65 might allow employees to retire and immediately draw their full accrued pension if they satisfy any of the following criteria at the time employment ceases:
• The member’s attained age is greater than or equal to 62; or • The member’s service is greater than or equal to 35 years; or
• The sum of the member’s age and service is greater than or equal to 85 years. The term “unreduced retirement age” is also somewhat misleading. A member retiring between the URA and the NRA will receive his or her full accrued pension immediately upon retirement. However, the accrued pension at that time will be based upon earnings and service to the date of retirement. If the member continued working until his or her NRA, the accrued pension would usually continue to grow as the member’s service and earnings increase. The member retiring between the URA and the NRA qualifies for an unreduced pension, but it is not as large as the unreduced pension for which the member would have qualified by continuing to work.
Early Retirement Incentives A member retiring after the ERA and before the URA will qualify for a reduced immediate pension. The “reduction” formula will be set out in the plan document. For example, the reduction formula might be:
• 0.5% for each month that retirement precedes the NRA; or • 0.5% for each month that retirement precedes the URA16; or • An actuarial reduction, i.e., the reduction that makes the actuarial present value of the
immediate pension equal to the actuarial present value of the unreduced accrued pension payable at the NRA using prescribed actuarial assumptions.
Pension standards legislation will typically insist that the “formula” reduction be no greater than the actuarial reduction, i.e., that the reduced immediate pension must have an actuarial value at least as great as the actuarial value of the unreduced accrued pension commencing at the NRA.
Where the early retirement reduction is less than the full actuarial reduction, it is tempting to conclude that early retirement is being subsidized and that the plan is therefore encouraging members to retire. This is often untrue. The actuarial reduction is a fair reduction if, and only if, the alternative being considered by the member is an unreduced deferred pension commencing at the NRA. Thus, if a member has already decided to retire and is trying to decide whether to take a reduced immediate pension or an unreduced deferred pension, the fact that the proposed
16 For this purpose, the URA might be determined using service at the date employment ceases or the service that the member would have accumulated by continuing in employment to the URA, i.e. it might be the URA at the time employment ceases or what the URA would have been had the member continued in employment.

Report May 2013
43
reduction is less than the full actuarial reduction means that the reduced immediate pension is the better choice from an actuarial perspective.
However, the member who has not yet decided to retire is faced with an entirely different choice. The question is not when the member’s pension should commence but when to stop working. This member needs to know how the actuarial present value of the pension payable if he or she retires today compares to the actuarial present value of the pension payable for service to date17 at future potential retirement dates. This analysis, which is well beyond the capabilities of even the most industrious member, depends critically upon plan provisions, early retirement reductions, inflation, rates of salary growth, interest rates, etc.
How then do members come to understand the early retirement incentives in their pension plans? The general rule is that any reduction is interpreted by members as a “penalty”, even reductions that are actuarially attractive. Typically, members will try to avoid early retirement “penalties” by working until they qualify for an unreduced pension. Moreover, since the ability to retire at the URA with an unreduced pension is recognized as a valuable pension option, members are generally aware that by working well past the URA they are failing to collect something to which they are entitled. Consequently, in many defined benefit pension plans members typically retire during the two or three years following the attainment of the URA.
There are instances where this oversimplified understanding can lead to erroneous conclusions. For example, if a plan reduces pensions by 2% for each year that retirement precedes the URA (based on projected service) the reduction is so small that, from an actuarial perspective, members are being encouraged to retire before the URA even though their pensions will be reduced. As a second example, if a member of a pension plan with pensions based on the average earnings in the final five years of employment receives a major promotion at the URA, the member might be wise to work for an additional five years after the URA so that his or her large salary increase is fully reflected in the accrued pension.
In assessing the effectiveness of early retirement incentives and disincentives it is important to remember that employee behaviour will be influenced not by what the incentives are in an actuarial sense but by what the members perceive them to be.
The Rationale (or Lack Thereof) for Early Retirement Incentives in DB Plans The early retirement provisions in many DB pension plans were adopted in the 1980s and 1990s, a period when pension plans were well funded due to a fortuitous combination of high interest rates and strong stock markets. The conventional wisdom at that time was that:
• Employees want to retire early (Freedom 55); • Employees want to retire fully (i.e., they wish to move abruptly from full-time
employment to full-time retirement); • Employers are well served by the early retirement of long-service employees who can be
replaced by less expensive, better educated, highly motivated, younger employees; and, most importantly
• Good pensions starting at an early age are affordable in a world with high interest rates and rapid economic growth.
17 Pensions earned for service between the current date and the future dates at which a member might retire are best viewed as compensation for future employment, and do not enter into the analysis.

Report May 2013
44
It is not surprising that, in such an environment, pension surpluses were used to fund both temporary and permanent increases to early retirement incentives.
Today the conventional wisdom is quite different:
• Many employees are thought to love their jobs and to want to work well beyond the ages at which earlier generations retired;
• Many employees are thought to prefer gradual, phased retirement, particularly if the most burdensome aspects of their jobs are eliminated to accommodate older workers;
• Employers are reluctant to lose their most experienced and valuable employees; and • Good pensions, starting at a reasonable age, are unaffordable in a world with low interest
rates and slow economic growth.
Not surprisingly, as companies wrestle with funding deficiencies and rumours of labour shortages, they begin to look for ways to eliminate the early retirement incentives adopted in times past.
Pension plan design has proven to be a blunt instrument for addressing the needs of companies wrestling with unpredictable economic environments and diverse employee populations.
• Companies cannot confidently predict their workforce needs decades in advance; sometimes businesses grow quickly and need to attract and retain skilled workers; sometimes they reverse course and downsize; sometimes they are profitable, sometimes they are not. They need retirement plans that can adjust to their changing circumstances.
• When companies downsize, they want to act quickly and effectively. Ideally, they would like to decide who should stay and who should go. DB plans, by their nature, are unable to distinguish good times from bad times and unable to distinguish the employees that the company would like to retain from those that it would like to see go.
• From the employees’ perspective, retirement is personal. Some employees want to retire as soon as it is economically feasible to do so. Others love their jobs and want to work for as long as they can. Some want to retire fully and abruptly; others want to gradually reduce their hours and responsibilities; still others want to fully retire from their career jobs and take up full- or part-time employment in an unrelated field. Some are prevented, by poor health or job loss, from working for as long as they would like. Others are prevented, by family responsibilities and/or financial circumstances, from retiring as early as they had hoped.
The Evolution of Early Retirement Incentives in DB Plans Private Sector Employers are playing a smaller role in the retirement plans of private sector employees. Only one third of private sector employees have a workplace pension plan. Less than 20% have access to a traditional DB pension plan. Since DC pension plans and personal retirement savings plans do not provide early retirement rewards or penalties, most private sector employees make their own decisions about when to retire.
Private sector non-union DB plans will, if they survive, gradually deemphasize or eliminate provisions that attempt, at significant expense, to influence the age at which employees retire, preferring instead to move in the direction of the Canada and Québec pension plans, where

Report May 2013
45
pensions are tied to retirement age in ways that are actuarially neutral, allowing employees to choose for themselves, without coercion, when to retire. If, for business reasons, employers want to occasionally persuade employees to retire earlier or later than they are otherwise inclined to do, temporary targeted cash incentives can do the job.
Public Sector Public sector DB pension plans cover 82% of the public sector workforce. Unlike private sector DB plans, public sector DB plans are growing and participation rates are reasonably stable. The URA for public sector DB plans is often below 60, as is the average age at which employees retire. The average retirement age has been increasing and is likely to continue to do so for a variety of reasons, including an increase in the average age at which public servants are hired.
So far, there have been few changes to the early retirement incentives embedded in public sector DB plans. The issue is not whether employers are well served by these provisions; it is whether members support them and are prepared to bear the high cost, directly or indirectly, as part of their compensation package.
In the case of private sector DB plans, it is relatively clear that:
• Accounting standards ensure that management and shareholders are well informed about the cost of the pension plan and DB pension plans have a major impact on financial statements of private corporations;
• Pension costs that are not directly borne by members (through their contributions) are considered part of the “total compensation package” and reduce the amounts available for other compensation elements;
• Pension costs and benefits are regularly discussed and/or negotiated as part of the collective bargaining process; and
• These pension costs used in valuing the total compensation package are normally based on generally accepted accounting standards.
Consequently there is reason to believe that, if the cost of early retirement incentives exceeds the value members attach to them, private sector pension plans will be amended to reduce the cost of early retirement incentives and the savings will be diverted to other compensation elements.
In the case of public sector DB plans:
• Taxpayers are poorly informed about the cost of pensions, although the political pressure for change increases as the divide between public and private sector pensions grows;
• Pensions generally represent a bigger share of the total compensation package in the public sector; and
• There is little to suggest that the cost of pensions and, in particular of early retirement incentives, is properly valued for inclusion in the total compensation package.
Consequently, the impetus for change may be lacking although changes to pensions provided in the public sector will have to be considered sooner or later.

Report May 2013
46
Public Policy Considerations with Respect to DB Plans Governments around the world are being encouraged by organizations such as the OECD and the International Monetary Fund to address fiscal problems by, among other things, increasing the age at which employees retire.
While Canada’s problems are less severe than those of other OECD countries for a variety of reasons18, population aging during the next 20 years combined with low interest rates will stress our retirement system. This stress can be alleviated, in part, by public policies that promote later retirement, longer working lives, less private borrowing, and more retirement savings. The federal government has begun to address these issues by, among other things, increasing the eligibility age for OAS from 65 to 67 (as discussed above), announcing an increase in the entitlement age for federal public servants from 60 to 65 (affecting only future hires) and introducing the pooled retirement pension plans (PRPPs). It is generally believed that more will be required.
Public policy, as it relates to the ages at which Canadians retire, should be guided by basic principles. Should retirement remain largely a personal decision made by individual Canadians taking into account their personal circumstances and preferences, or should the ages at which Canadians retire be heavily influenced by government policy? To what extent and in what circumstances should governments create financial incentives or disincentives for retirement at specific ages? What instruments should be used for this purpose?
In moving forward, it is important to distinguish changes that remove incentives for early retirement from changes that punish those who retire early. The former reduce the government’s role in the retirement system by eliminating subsidies for those who retire early and allowing people to make their own decisions after taking into account the full economic cost of retiring. The latter increase the government’s role in the retirement system by penalizing those who wish to retire and who are prepared to pay the full economic cost of doing so.
At the present time, Canadians are generally receptive to the idea that governments should no longer subsidize early retirement. Canadians should be allowed to retire early if, by virtue of sound financial planning, they have saved enough to support themselves. Other Canadians, i.e., those retiring later, should not be expected to subsidize those who retire early.
Public pensions (OAS and C/QPP) do not subsidize early retirement. C/QPP benefits are adjusted to be retirement age neutral, i.e., those who retire early and those who retire late receive benefits commensurate with the contributions made by them or on their behalf. OAS benefits are available at age 65 (eventually age 67) regardless of the age at which people retire.
The only significant early retirement incentives left in the retirement system are those found in DB pension plans, predominantly in the public sector. As mentioned earlier, these incentives are effectively created by rules that allow members to receive their full accrued pensions prior to age 65. If, as a matter of public policy, the government wanted to gradually eliminate these plan provisions it could do so by amending the Income Tax Regulations that permit unreduced pensions to be paid to members who retire after the earlier of19:
18 Relatively low levels of public debt, abundant natural resources, a strong banking system, a partially funded C/QPP, decent levels of retirement savings, relatively modest public pension benefits, etc. 19 An exception is made for public safety workers who are permitted to receive unreduced pensions five years earlier.

Report May 2013
47
• The attainment of age 60; • The completion of 30 years of service; or • The point at which the sum of the member’s attained age and service exceeds 80 years.
For example, by changing 60 to 65 and eliminating the service related rules, accrued pensions could be paid in full only to those retiring at or after age 65. Those retiring before age 65 would be subject to a reduction of 0.25% for each month that pension commencement precedes age 65.
Alternatively, since significant early retirement incentives are largely found in public sector plans, and since governments can easily circumvent the Income Tax requirements by paying non-conforming pensions directly, governments could tackle this problem through collective bargaining and/or unilateral amendments to the public sector plans they sponsor. This would make it easier for governments to tailor solutions to individual plans and workforces.
As a rule, pension plans can be improved immediately but they can only be cut back gradually. Benefit reductions almost never affect the already retired and seldom affect pensions that will be payable to active employees for service already rendered (although, by overriding pension legislation, governments can make these changes if they choose to do so). As a practical matter there are three approaches that one might adopt to gradually reduce early retirement incentives.
• Remove the incentives, but only for future hires; • Remove the incentives for future service, i.e., the existing incentives would apply only to
pensions for service prior to the date of the amendment; or • Remove the incentives for members who, as of the date of the amendment, are more than
a certain number of years (say five) from qualifying for an unreduced pension under the current rules. For example, a plan offering unreduced pensions to members who have attained age 55 and completed 30 years of service might eliminate the provision for members who have not attained the age of 50 and completed 25 years of service on the date of the amendment.
Since the first approach will have virtually no impact on early retirement incentives for at least 20 years, and since the rate of population aging will be most severe during the next 20 years, meaningful changes must be implemented following the second or third approaches.
We are beginning to see changes to public sector pension plans, largely driven by funding pressures that have pushed contribution rates well above 20% of pay (employer and employee combined) and, in some instances, above 25% of pay:
• Many public sector plans in Alberta, B.C., Ontario and Québec are cost shared and risk shared. Employees typically pay 50% of all contributions.
• More recently, the indexing of pensions in payment has become partially conditional; i.e., it depends on the funded status of the plan.
• Recent changes to several public sector pension plans in New Brunswick will effectively convert them (for active and retired members) to target benefit plans where pensions depend on the performance of the pension fund.

Report May 2013
48
• In its most recent budget, the federal government announced its intention to increase the retirement age and unreduced retirement age by five years for new hires and to move gradually to a 50/50 sharing of current service costs for all active members20.
So far, the proposed reforms have focused on the need to control funding costs, not the desirability of eliminating early retirement incentives. Indeed, the changes already proposed only impact future hires and would not noticeably reduce early retirement incentives in the foreseeable future.
Finally, if governments decide that Canadians are likely to retire too early even after all of the financial incentives to do so have been eliminated, they can adopt more stringent measures. Ultimately, this could become a very slippery slope. If governments decide to prevent people from retiring early or to coerce them to continue working beyond the age at which they want to retire, there are a number of increasingly draconian measures that might be invoked to achieve this end. Examples include:
• Lowering RRSP/RPP/TFSA contribution limits and DB pension accrual rates to prevent Canadians from saving enough to retire early;
• Prohibiting the payment of pensions and/or RRSP withdrawals prior to some age, to prevent those with adequate savings from accessing their savings prior to the age at which the government believes they should be permitted to retire;
• Surtaxing pension and RRSP income received prior to some age to punish those who retire early; or
• Increasing the age at which OAS and/or C/QPP benefits are first available (for example, eliminating the option to draw reduced CPP benefits before age 65) so that low-income workers have no economically viable way to retire early.
These measures, none of which we advocate or support, would obviously be difficult to sell to Canadians, as would the notion that the state, not the individual, should decide when Canadians are allowed to stop working.
VII – RETIREMENT AGE AND CAPITAL ACCUMULATION PLANS A defined contribution pension plan or group RRSP by definition is an individual cash account retirement savings vehicle with no guaranteed benefits at retirement.
Rather, an individual’s retirement income is funded by their accumulated contributions and investment gains over the period they participated in the plan as a plan member (also known as a participant).
The basic elements of a DC plan are as follows:
• Each year a plan participant contributes a dollar amount to their account. The member contributes either a percentage of pay or a fixed dollar amount.
• Member contributions are typically “matched” by the plan sponsor (typically their employer) based on a formula. The matching contributions are generally limited to a maximum percentage or dollar amount. (e.g., 100% match to 5% of income).
20 There was no suggestion that employees would bear any pension risk through variable contributions or benefits, and the increased employee contributions would be commensurate with an increased value of benefits.

Report May 2013
49
• The accumulated contributions will be invested in a portfolio that the member selects from a suite of investment options made available by their employer. Available options would typically include a small set of market-based investment funds and guaranteed interest instruments. Investment gains/losses each year will accrue to each member based on their own investment mix.
• At retirement, the member can purchase an annuity, begin to draw down the account balance, or some combination of both.
Implications of a Shift in the Normal Retirement Age For each year of deferred retirement, individuals will have the ability to save more for a shorter retirement. Delayed retirement allows one to positively influence both the DC asset (increase account balance) and liability (decreased future income need).
At the same time, as we have seen shifts in retirement ages and life expectancies, the average age of entry to the workforce in has increased. Over the past three decades North Americans have tended to stay in school longer, delaying the start of their working lives21 . In theory this should lead to a corresponding increase in retirement age, if a member is to realize the same outcome from their retirement plan.
It is common for members to sub-optimally participate in employer matching programs. At times, members forgo current and future income in the process22. This inability of members to contribute appropriately to their DC plans is often a result of personal economic circumstances and the inability to defer consumption.
It has been shown that the level of disposable income of an individual is directly correlated to the contribution rates to DC programs.23 In addition, for some segments of the population, wealth accumulation has been delayed while individuals have taken on higher levels of debt, primarily in the form of home ownership.24 Delays in the ramp-up of personal savings rates may have a direct impact on the ability of an individual to retire. That is, the later an individual begins to save for retirement, the more likely that retirement will be delayed.
While retirement is typically thought of an irrevocable point in time, arrived at after working an extended number of years for a single employer, we know that individuals are now more likely to:
• Work for multiple employers in their career25; • Be self-employed26; • Work as a contract employee27; and/or • Work part-time28.
21 Mosisa and Hipple, 2006, and Statistics Canada, 2001. 22 Choi, Laibson, and Madrian, 2005. 23 Huberman, Iyengar, and Jiang, 2007. 24 Statistics Canada, 2011 and 2012. 25 Ignaczak and Voi, 2009. 26 Statistics Canada, 1999, and Kamhi and Leung, 2005. 27 Statistics Canada, 2003. 28 Ibid.

Report May 2013
50
The basic structure of DC plans allows for more fluid participation of plan members as they enter and exit the work force. In principle, they also allow for members to move between “active contributing” status to “retiree” status and back again. Plan design, pension laws, and tax laws do not fully contemplate this today; however, as public policy shifts to encourage delays in retirement, it seems natural that this gap will be addressed.
DC plans offer employers a predictable benefit cost. Benefit formulas do not vary by age and thus, for employers, delayed retirement does not have a material impact on benefit costs (in absolute terms or relative to a younger worker).
While participation in a DC plan does not lead to a particular retirement age or trend upward in retirement ages, other demographic and economic trends will have a direct impact on one’s ability to save in a DC plan and thus impact on retirement ages both positively and negatively. The shift from workplace DB plans to DC plans will in itself result in an upward trend on retirement ages.
VIII – OTHER PROGRAMS AFFECTED BY CHANGING RETIREMENT AGES Many disability, unemployment and welfare programs, including
• Provincial welfare; • Workers’ compensation; • Employment insurance; • Workplace long- and short-term disability plans; and • Workplace group insurance plans,
provide coverage and/or benefits until recipients qualify for, or receive, pensions. If the age at which Canadians can achieve retirement benefits is increased beyond age 65, these programs will cover older populations and become more expensive. In particular, if the age at which Canadians can afford to retire increases without a commensurate increase in the age up to which Canadians are able to find and keep jobs, the economic gains associated with increasing the retirement age will be offset, in part, by an increase in dependency on welfare, unemployment, and/or disability programs.
IX – OTHER VARIABLES AFFECTING THE IMPACT There are other considerations which will have an indirect impact on retirement age. It is not anticipated that these can be affected by government action; rather, it is just a recognition that these factors exist currently, and will continue to do so going forward.
The most recent C/QPP reports provide much useful information on these topics.
Fertility As seen in figure 1 above, the total fertility rate dropped rapidly from an average level of about 4.0 per woman in the 1950s to 1.6 by the mid-1980s. It then declined to a level of 1.5 by the late 1990s, but has more recently risen to over 1.6. It is also true that in 2006, the Québec fertility rate exceeded Canada’s level for the first time since 1958.
The overall decrease in the total fertility rate since the 1950s occurred as a result of changes in a variety of social, medical, and economic factors. Although total fertility rates have increased in

Report May 2013
51
recent years, it is unlikely that the rates will return to historical levels in the absence of significant societal changes.
The 25th CPP Report assumed that the total fertility rate for Canada would decrease slightly from its 2007 level of 1.66 to an ultimate level of 1.65 in 2015. The total fertility rate for Québec is assumed to decrease from its 2008 level of 1.74 to the same ultimate level of 1.65 in 2015.
Net Migration Net migration (i.e., the excess of immigration over emigration) is unlikely to materially reduce the continued aging of the population unless
• The level of immigration rises significantly above what has been observed historically; • The average age at immigration falls dramatically; and • A higher percentage of immigrants are labour force prepared. (Today, 23% of immigrants
are of the “family completion” nature.)
An ultimate best-estimate assumption for net migration of 0.58% of the population was used in the 25th CPP Report for years 2023 and thereafter. The net migration rate based on average experience over the previous three years (2007–2009) was 0.62%, and over the last 30 years (1980–2009) was 0.53%. Based on a continuation of the average experience over the previous 30 years, it is assumed that net migration rates will reduce from 0.62% to 0.53% by 2014 and remain stable at that level until 2018. In the long run, a possible labour shortage resulting from the retirement of the baby boom generation could prompt an increase in immigration to supply the required workforce. This is why the net migration assumed rate is projected to increase from 0.53% in 2018 to 0.58% in 2023. The ultimate net migration rate represents the average experience over the last 15 years. In projecting the Québec population, the net migration assumed rate averages 0.4% over the projection period.
Labour Force Participation Labour force participation rates vary not only with the rate of unemployment, but also reflect trends in increased workforce participation by women, longer periods of formal education among young adults, and changing retirement patterns of older workers.
As the population ages, it becomes more heavily weighted in age groups where participation is lower and, as a result, the labour force participation rates for Canadians aged 15 and over are expected to decline from 67.2% in 2010 to 62.2% by 2030. A more useful measure of the working-age population is the participation rate of those aged 15 to 69, which is expected to increase from 74.9% in 2010 to 75.2% in 2030. The participation rates of those aged 60 to 69 are projected to increase after 2009. Also, the narrowing of the gap between the age-specific participation rates of men and women is assumed to continue but at a much slower pace than in the past.
Prior to 2009, significant increases in labour force participation rates were experienced in both younger and older age groups for both males and females. The recent economic downturn slightly reduced the participation rates mainly for younger age groups. It was anticipated that these rates would rebound to levels similar to those in 2008 by 2012. In general, participation rates for females are projected to increase more than for males, primarily for those aged 25 to 44. Overall, the male participation rate of those aged 15 to 69 is expected to be 79.0% in 2010 and in 2030, while the female participation rate for the same age group is expected to increase from

Report May 2013
52
70.9% in 2010 to 71.5% in 2030. Therefore, the current gap of 8.1% between males and females in this age group is expected to slightly decrease to 7.6%.
The job creation rate in Canada was, on average, 1.7% from 1976 to 2009. The assumed job creation rate in the 25th CPP Report is about 0.9% from 2010 to 2014 and 0.7% from 2015 to 2021 and is slightly higher than the labour force growth rate. For years 2022 and thereafter, the job creation rate follows the labour force growth rate and is about 0.4% due to the aging of the population.
Productivity In Canada’s Aging Workforce: Participation, Productivity and Living Standards (2008), Charles M. Beach states:
Canada’s elderly dependency ratio will rise, and more and more retirees will have to be supported by relatively fewer members of the workforce. This raises question as to the economic well-being and average living standards of the population as relatively fewer workers are involved in producing output in Canada.
The increase in employment rates among older workers for Canada shown in table 20 are one of the higher rate increases among OECD countries.
Table 20 – Rates of Labour Market Activity by Gender for Workers Aged 55 and Over
Year Participation Rate Unemployment Rate Employment Rate Men 1976 47.2% 3.8% 45.4% 1986 39.8% 6.9% 37.0% 1996 32.2% 7.3% 29.8% 2005 39.1% 5.1% 37.2% 2006 39.1% 5.2% 37.1% 2007 40.0% 4.9% 38.1% Women 1976 17.7% 4.3% 16.9% 1986 16.8% 6.9% 15.6% 1996 16.6% 7.2% 15.4% 2005 24.9% 5.2% 23.6% 2006 26.1% 5.0% 24.8% 2007 27.3% 4.7% 26.1%
Source: Beach, 2008 More educated workers also tend to maintain longer attachment to the labour market, and the current cohort of older workers—men and women—are significantly better educated than in previous decades. Their working career starts later, so they want more time to follow it through. The shift towards a white-collar economy where jobs are less physically demanding also provides greater opportunity for a longer working career.
If the Canadian economy is entering an era of labour shortages, particularly for selected skills, this will likely raise the demand for older workers to continue working.

Report May 2013
53
Canada’s position next to the United States, with its population of 315 million that is aging more slowly than any other major developed country, will create continued demand for Canadian exports and heavy investment in Canadian energy and resources will help keep incomes in Canada relatively high.
Canada’s standard of living thus depends in part on maintaining a high employment rate. Policy efforts should be focused on furthering this undertaking. It is therefore worth pointing out the critical importance of maintaining good macroeconomic policy so that jobs are available, particularly for non-prime-age workers and so that adjustment costs to employing older workers are lower. Policy responses should also open up a range of alternatives, encourage greater flexibility in adjustment to economic change, focus on fostering employment rather than protecting jobs, and not drive up costs of production operation in Canada.
Shortages of labour and higher wages will make it cost-effective for firms to invest more in capital and innovation in order to raise worker productivity. Cutler et al. (1990) estimate that, in the absence of such capital deepening, U.S. per capita output would decline owing to population aging by 7 to 12 per cent over a 60-year period. But this could be offset by only a 0.15 per cent a year increase in productivity growth.
From Scarth, 2007:
Several aspects of the aging population will lower living standards:
• The higher old-age dependency ratio; • The increase in tax rates that will be necessary to maintain the public pension and
health care programs (equal to about 5 percentage points of GDP); and • The reduction in labour productivity as individuals age.
Several other dimensions of the aging population will raise living standards:
• The lower population growth rate; • The higher savings rate; and • The reduction in tax rates that can be expected as the RRSP system involves a smaller
loss in government revenue.
Scarth concludes that the aging population does represent a challenge, and that those who are concerned about it are not making “much ado about nothing”. There is some “good news” but it is not that living standards will rise. The good news is that the likely magnitude of the hit to living standards may just be manageable. National debt reduction can still offer significant relief from this threat.
One can conclude that by improving labour productivity much of the “problem” created by the aging population can be mitigated. This might lead some persons of influence to change their projection models so as to assume more productivity growth. While this is tempting, it is equally fraudulent. Any improvement in productivity must be real, not imagined.
X – THE “LUMP OF LABOUR” FALLACY It is often claimed that extending the pensionable age and thereby creating more jobs for older workers results in fewer jobs for youth. While this is intuitively persuasive, it is a fallacy. The “lump of labour” fallacy is based on the premises that there are a fixed number of jobs available,

Report May 2013
54
and that one worker can easily be substituted for another, neither of which is true. The amount of work to be done is not fixed. Indeed, the cost of a state subsidy for early retirement can result in reduced employment opportunities for younger workers.29
Meeting future pension obligations depends on economic growth, which in turn depends on having more workers and/or greater productivity. A society cannot become more prosperous if it pays more and more of its citizens not to work:
“[In Denmark a] voluntary early retirement scheme (VERP, ‘Efterlønnen’) was introduced in 1979 at a time of high unemployment, especially amongst youth. Its purpose was to change the composition of the work force, with the idea that it would allow older people to retire in order for younger people to take their place. In fact, it led to a decrease in overall employment rates, as in many other OECD countries with similar policies.’30
Participation in the VERP program was much higher than was originally anticipated. A 2006 study revealed that people who went on VERP tended to be just as healthy and vigorous as those who continued to work until retirement age. Critics claimed the state was subsidizing an expensive voluntary early retirement program. Demographic projections suggesting that in the future Denmark will lack sufficient employees to fund the pension system were also cited as reasons to reform the VERP.
Until a reform in 2011, workers who paid their VERP contribution for 30 years and were members of an unemployment insurance fund were eligible to retire at age 60. They could benefit from the scheme until the age of 65, when the universal basic old-age pension starts. The reform increased the retirement age to 67 over 2024 to 2027, shortened the early retirement period from five to three years between 2018 and 2023, and reduced the amount of pre-pension payments from the VERP.
Persons working in physically or psychologically demanding jobs, but who were not eligible for disability pensions, benefited from the VERP. The reform provides for a senior disability benefit for workers who have health problems linked to their work conditions and are within five years of eligibility for the old-age pension.
The “lump of labour” fallacy has other implications. For example, increasing the age at which Canadians retire will not alleviate labour force shortages if the shortages are in locations to which later career Canadians are unlikely to move; relate to jobs that later career workers are unlikely to seek; or require skills, education, and/or characteristics that later career workers are unlikely to possess.
29 OECD, 2010. 30 OECD, 2012.

Report May 2013
55
REFERENCES Barer, M. L., R.B. Evans, and C. Hertzman. 1995. Avalanche or Glacier? Health Care and the
Demographic Rhetoric. Canadian Journal on Aging. Vol. 14, No. 2: 193-224.
Beach, C. M. 2008. Canada’s Aging Workforce: Participation, Productivity, and Living Standards. Bank of Canada.
Brown, R. 1999. Economic Security for an Aging Canadian Population. SOA Monograph MRS99-2. Schaumburg: Society of Actuaries.
Brown, R. L. and C. Bilodeau. 1999. “The Canadian Wealth Transfer Index”. Proceedings, Canadian Institute of Actuaries, Vol. XXVIII, No. 2 (1996-97).
Brown, R. L., R. Damm, and I. Sharara. 2001. “A Macro-Economic Indicator of Age at Retirement”. North American Actuarial Journal. Vol. 5, No. 2.
Brown, R. L. and U. Suresh. 2004. “Further Analysis of Future Canadian Health Care Costs”. North American Actuarial Journal.
Canadian Institute of Actuaries. 1996. Health Care Financing Task Force on Health Care Financing.
Choi, James, David Laibson, and Brigitte Madrian. 2011. “$100 Bills on the Sidewalk: Suboptimal Investment in 401(k) Plans.” Review of Economics and Statistics 93(3): 748-763.
Denton, F. T., and B. G. Spencer. 1995. “Demographic Change and the Cost of Publicly Funded Health Care”. Canadian Journal on Aging 14(2): 174-192.
Denton, F. T., C. H. Feaver, and B. G. Spencer. 2005. Population Aging and the Maintenance of Social Support Systems. Quantitative Studies in Economics and Population (QSEP) Research Reports. #320. McMaster University.
Evans, R. G., K. M. McGrail, S. G. Morgan, M. L. Barer, and C. Hertzman. 2001. “Apocalypse No: Population Aging and the Future of the Health Care System”. Canadian Journal on Aging 20(1): 160-91.
European Commission. 2012. White Paper on adequate, safe and sustainable pensions.
Federal Government of Canada. 2012. Jobs, Growth and Long-term Prosperity – Economic Action Plan 2012.
Hering, M., and T. R. Klassen. 2010. Is 70 the New 65? Raising the Eligibility Age in the Canada Pension Plan. Mowat Centre for Policy Innovation.
Hicks, P. 2012. Later Retirement: the Win-Win Solution. Commentary No. 345. Toronto: C. D. Howe Institute.
Hogan, S., and S. Hogan. 2002. How Will the Aging of the Population Affect Health Care Needs and Costs in the Foreseeable Future? Discussion Paper no. 25 in “The Future of Health Care in Canada”. Report of the Commission on the Future of Health Care in Canada (The Romanow Report).

Report May 2013
56
Huberman, G., S. S. Iyengar, and W. Jiang. 2007. “Defined Contribution Pension Plans: Determinants of Participation and Contribution Rates.” Journal of Financial Services Research, 31(1): 1-32.
Ignaczak, L., and M. Voi. 2009. A Nonparametric Analysis of Canadian Employment Patterns.
ILO. 2008. Age discrimination and older workers: Theory and legislation in comparative context. Conditions of Work and Employment Series No. 20.
IMF. 2011. The Challenge of Public Pension Reform in Advanced and Emerging Economies.
Investment & Pensions Europe. http://www.ipe.com/news/dutch-parties-to-increase-retirement-age-sooner-than-expected_47715.php (registration required).
Kamhi, N., and D. Leung. 2005. Recent Developments in Self-Employment in Canada. Bank of Canada.
Marzouk, M. S. 1991. “Aging, Age-Specific Health Care Costs and the Future Health Care Burden in Canada”. Canadian Public Policy, University of Toronto.
McGrail, K., B. Green, M. L. Barer, R. G. Evans, C. Hertzman, and C. Normand. 2000. “Age, Costs of Acute and Long-Term Care and Proximity to Death: Evidence for 1987-88 and 1994-95 in British Columbia.” Age and Ageing 2000. 29(3): 249-53.
Mosisa, A., and S. Hipple. 2006. “Trends in Labor Force Participation in the United States”. Monthly Labor Review.
OECD. 2011. A method for calculating the average effective age of retirement. Paris: OECD.
OECD. 2011. Pensions at a Glance 2011: Retirement-Income Systems in OECD and G20 Countries.
OECD. 2011. “Paying for the Past, Providing For The Future: Intergenerational Solidarity”. Ministerial Meeting on OECD Social Policy: Building a Fairer Future: The Role of Social Policy.
OECD. 2012. Pensions Outlook 2012.
OECD. 2010. Off to a Good Start? Jobs for Youth.
OECD. 2012. OECD Economic Surveys: Denmark 2012, OECD, Box 1.4.
OECD. 2011. Statistics on average effective age and official age of retirement in OECD countries.
Office of the Chief Actuary, Office of the Superintendent of Financial Institute, Canada. 2010. The 25th Actuarial Report on the Canada Pension Plan as at 31 December 2009.
———. 2002. The 5th Actuarial Report on the Old Age Security as at 31 December 2000.
———. 2011. The 9th Actuarial Report on the Old Age Security Program as at 31 December 2009.
———. 2011. The 10th Actuarial Report supplementing the Actuarial Report on the Old Age Security Program as at 31 December 2009.
———. 2012. The 11th Actuarial Report supplementing the Actuarial Report on the Old Age Security Program as at 31 December 2009.

Report May 2013
57
Régie des rentes du Québec. 2009. Working Paper - Toward a Stronger and Fairer Québec Pension Plan.
———. 2010. Actuarial Report of the Québec Pension Plan as at 31 December 2009.
———. 2010. La transition travail-retraite – Données de 1991 à 2007.
———. 2007. Actuarial Report of the Québec Pension Plan as at 31 December 2006.
Robson, W. B. P. 2001. “Will the Baby Boomers Bust the Health Budget? Demographic Change and Health Care Financing Reform”. C. D. Howe Commentary no. 148, February.
Scarth, W. 2007. Some Macroeconomic Effects of Population Aging on Productivity Growth and Living Standards. McMaster University.
Sepehri, A., and R. Chernomas. 2004. “Is the Canadian health care system fiscally sustainable?” International Journal of Health Services, Vol. 34, No. 2: 229-243.
Statistics Canada. 1999. Catalogue no. 75-001-XPE.
———. 2001. Education Quarterly Review. Volume 7, no.3.
———. 2003. The Canadian Labour Market at a Glance.
———. 2008. Canadian Demographics at a Glance. Catalogue no. 91-003-X, Minister of Industry.
———. 2010. Population Projections for Canada, Provinces and Territories, 2009-2036. Catalogue No. 91-520-X. Minister of Industry.
———. 2011. Report on the Demographic Situation in Canada. ———. 2012. The evolution of wealth over the life cycle.
———. 2012. Pension plans in Canada, as of January 1, 2011. The Daily, May 25, 2012.

Report May 2013
58
APPENDIX I Mandate – CIA Task Force on Retirement Age Background • There has been a lot of public discussion on whether the retirement age in Canada should be
increased. • Other countries are discussing or have increased the retirement age. • Many arguments have been used to argue for this change:
– Control future increase in pension cost; – Correspond to increase in longevity; – Address the issue of the upcoming shortage of labour; and/or – Assist in funding increasing health care cost of an ageing population.
• Average effective retirement ages vary a lot for different types of employment from below 60 for public service employees to over 65 for self-employed.
• Furthermore, the notion of retirement is evolving, with many planning to work part-time after retirement.
Objective • Prepare background information in order to assist the CIA in taking a position on this issue. • Such CIA position may be limited to a view on how the issue should be presented and what
are the consequences of raising retirement age.
Deliverable • A document that discusses the consequences, the reasons, the pros and cons, and the
transition issues of raising the retirement age and this, separately for: – OAS/GIS, including the effect on projection of cost in % GDP. – C/QPP, including effect on contribution rate, and how the pension should be adjusted
according to retirement age. – DB plans, including the case of generous early retirement subsidies in public sector plans
and the legislative provisions imposing constraints on retirement age changes. Cost implications of early retirement subsidies should be illustrated. Transition issues resulting from any change in retirement age or decrease in early retirement subsidies should be discussed.
– Other employee benefit plans, such as disability and health care plans. – Capital accumulation plans (e.g., DC plans, RRSPs), including effect on the benefits or
contributions resulting from increase in longevity and any change in retirement age. – Impact on other government income programs (e.g., provincial social security and health
care plans, EI, workers’ compensation)—considering the complexity of this topic, general comments could be provided in this section.