issue no. 15 february, 2006 iauc newsletter demonstration building used to illustrate rain-water...
TRANSCRIPT

1
IAUC Newsletter INTERNATIONAL ASSOCIATION FOR URBAN CLIMATE
Issue No. 15 February, 2006.
www.urban-climate.org
President’s Column I am very pleased to announce that the sci-entific program for ICUC6 has been formal-ized and is available for review at the confer-ence website (www.gvc.gu.se/icuc6). There is an excellent selection of papers and ICUC6 promises to be a very stimulating event. All those who submitted abstracts should have been contacted by email by the local organizing committee of ICUC6 with in-formation about acceptance or rejection and the format of presentations (oral or poster). If you submitted an abstract but did not receive that email, please contact me or Pro-fessor Sven Lindqvist, Chair of the Local Or-ganizing Committee, as soon as possible. Details of the social events associated with the conference and accommodation that has been reserved for this event also are posted to the web site. Pre-registration starts Febru-ary 10th and continues until April 10th. I am also very pleased to announce that following IAUC changes, the Board have elected the next President and Secretary of the organization - both terms commence in 2007. The President-elect is Dr Matthias Roth (NUS, Singapore), the secretary-elect Dr Jennifer Salmond (U. Birmingham, Eng-land). I wish them both the very best in their new roles. For the next two years they will serve on the Board as President-elect and Secretary-elect, respectively. The first task Matthias will be taking on will be to issue a call for proposals to host ICUC7. Sue Grimmond IAUC President. [email protected]
Comprehensive Outdoor Scale Model
Experiment for Urban Climate (COSMO) A photograph of the 1/5 scaled physical model of an urban area used by the Kanda Laboratory, To-kyo Institute of Technology. A short report on COSMO was published in a previous edition of this Newsletter (6). More details and results are available at the project website:
http://www.cv.titech.ac.jp/~kandalab/COSMO/COSMO.html
Newsletter Contributions The IAUC Newsletter is published bi-monthly. The next publication will occur in early April. Any items to be considered for Issue 16 should be received by March 31, 2006.
Rainwater Harvesting A demonstration building used to illustrate rain-water harvesting techniques in Chennai, India. See p. 3

2
Urban Climate News
We welcome submissions to the “News” section. Submission materials could include but are not limited to: upcoming papers, field experiment in-formation, awards, data or document availability announcements, etc. You may submit your “news item” to Dr. J. Marshall Shepherd ([email protected]) Please note that Dr. Shepherd has joined the fac-ulty of the University of Georgia Department of Geography (after 12 years at NASA Goddard Space Flight Center), where he continues his research into urban weather and climate proc-esses, particularly precipita-tion variability.
Newsletter Contributions The IAUC Newsletter is published bi-monthly. The next publication will occur in early April. Any items to be considered for the December edition should be received by March 31, 2006. The following individuals compile submissions in various categories. Contributions should be sent to the relevant editor: News: Dr. J. Marshall Shepherd [email protected] Conferences: Jamie Voogt ([email protected]) Websites: Gerald Mills ([email protected]) Bibliography: Jennifer Salmond ([email protected]) Urban Projects: Sue Grimmond ([email protected]) General submissions should be relatively short (1-2 A4 pages of text), written in a manner that is accessible to a wide audience and incorporate figures and photographs where appropriate. In addition we would be delighted to receive any images that you think may be of interest to the IAUC community.
Contents
p1. President’s Column. p2. Urban Climate News p7. Urban Project Report: Eddy covariance
measurements p9. Conferences p11. ICUC-6 Programme at a glance. p12. Bibliography. p14. Awards & Board Information.
New York City Heat Island
A thermal satellite image of New York City captured by NASA’s Landsat satellite on August 14, 2002 at 10:30 a.m., shows the locations of the warmest air tempera-tures as seen in red. The blue indicates areas with cooler air temperatures NASA researchers have set out to recom-mend ways to reduce the urban heat island effect in New York City. They looked at strategies such as promoting light-colored surfaces such as roofs and pavements that reflect sunlight, planting "urban forests" and creating "living roofs" on top of buildings where sturdy vegetation can be planted and thrive. Using a regional climate com-puter model, the researchers wanted to calculate how these strategies lower the city’s surface and close-to-surface air temperatures and what the consequences of these strategies would be on New York's energy system, air quality and the health of its residents. The researchers conducted a city-wide case study over the summer of 2002 to measure changes in air temperatures. They also used six smaller case studies during the same period in places like Lower Manhattan, the Bronx's Ford-ham section, Brooklyn's Crown Heights section and the Maspeth section of Queens. The areas were chosen for the different ways land is used and their nearness to areas with high electrical use. They also had warmer-than-average near-surface air temperatures called "hot spots" and boasted available spaces to test ways to reduce the urban heat island effect. (www.nasa.gov/centers/goddard/news/index.html).

3
Urban Rainwater Harvesting Rainwater harvesting (RWH) refers to a variety of low-technology means by which rainfall is gathered and usefully employed, often at the scale of the dwelling. In many parts of India, RWH is state pol-icy and is incorporated into building design. The Tamilnadu Water supply and Drainage Board main-tains a website (www.aboutrainwaterharvesting.com/) that provides information of RWH practices and outlines the need for RWH: Till about thirty years back, the areas around our homes and offices used to be unpaved and the rain falling on these areas would percolate into the soil and remain there for being drawn through shal-low open wells. With the proliferation of flat com-plexes, not only have these areas been paved and percolation of rainwater into the soil almost totally stopped, the quantity of water drawn from the soil below has increased many fold. Consequently open wells and not-so-deep bore wells started dry-ing up. The reason is that no sincere attempt is made to replenish the ground watertable with rain-water during the monsoon. As individuals, groups and communities, let us all wake up before it is too late and not only un-derstand what rainwater harvesting is all about but also implement measures to harvest rainwater in our houses and flat complexes and put it into the soil for our subsequent use. These practices have been implemented at an ur-ban scale in Chennai City (the state capital), which receives much of its rainfall during North-East Mon-soon (October to December, see Figure 1 & Table 1). Metrowater (Chennai’s municipal body respon-sible for water and sewage) provides a description of Chennai’s rainfall climate and its need for RWH [3]. Although Chennai’s annual precipitation ranges from 1200-1300 mm (compared to an Indian aver-age of 800 mm), much of this is received in short, intense bursts - on average it receives rainfall for 300 hours throughout the year [3].
Urban Climate News
Figure 2. (a) A demonstration building
used to illustrate RWH techniques.
(b) A RWH system in place which collects water gath-ered on the roof surface.
(a) (b)
Figure 1. Annual rainfall in India (CNN refers to Chennia). [4]
Table 1. Climate statistics for Chennai [4].
Month Mean Temp. oC Mean Number of Rainy Days Daily Min Daily Max
Jan 20.6 28.4 16.2 1.0 Feb 21.2 29.9 3.7 0.3 Mar 23.1 31.9 3.0 0.2 Apr 25.9 33.6 13.6 0.7 May 27.6 36.4 48.9 1.6 Jun 27.2 36.6 53.7 4.1 Jul 25.9 34.7 97.8 7.3 Aug 25.3 33.9 149.7 8.5 Sep 25.3 33.5 109.1 6.6 Oct 24.3 31.4 282.7 10.2 Nov 22.8 29.2 350.3 10.1 Dec 21.6 28.1 138.2 5.5
Mean Total
Rainfall (mm)

4
Figure 4. Map of Chennai City’s aquifer zones
Table 2. table illustrating the success of the RWH project. From www.chennaimetrowater.com/.
No. of Buildings in existence and covered with
RWH till previous week upto 22.12.05
No. of Buildings in
extended water / sewer connections
with RWH from 22.12.05
to 29.12.05
Total No.of Buildings with RWH as on 29.12.05
Sl. No. A
rea
Res
iden
tial
Com
mer
cial
Inst
itutio
nal
Tota
l
Res
iden
tial
Com
mer
cial
In
stitu
tiona
l
Tota
l
Res
i.
Com
m.
Inst
i.
Tota
l 1 1 34,961 323 34 35,318 0 0 0 0 34,961 323 34 35,318
2 2 9,746 10,204 109 20,059 2 0 0 2 9,748 10,204 109 20,061
3 3 24,967 6,664 117 31,748 36 2 0 38 25,003 6,666 117 31,786
4 4 44,350 589 74 45,013 32 3 0 35 44,382 592 74 45,048
5 5 62,706 1,047 130 63,883 108 3 0 111 62,814 1,050 130 63,994
6 6 17,869 3,015 73 20,957 0 0 0 0 17,869 3,015 73 20,957
7 7 18,829 1,659 113 20,601 0 2 0 2 18,829 1,661 113 20,603
8 8 32,218 2,815 128 35,161 62 3 0 65 32,280 2,818 128 35,226
9 9 26,854 545 612 28,011 0 0 0 0 26,854 545 612 28,011
10 10A 13,497 179 24 13,700 0 0 0 0 13,497 179 24 13,700
11 10B 25,194 957 72 26,223 0 0 0 0 25,194 957 72 26,223
Total 311,191 27,997 1,486 340,674 240 13 0 253 311,431 28,010 1,486 340,927
Urban Climate News
These characteristics require that rainwater be stored, ideally for direct use but also to recharge underlying ground water (Figures 3&4). In the ab-sence of such measures, flooding and water loss occurs during the rainy season and water scarcity occurs during summer months. This is exacer-bated where land-cover changes associated with rapid urbanisation impedes the groundwater re-charge. RWH is a means of ensuring that rainfall resources are fully utilised. To illustrate, Metrowa-ter provide examples of the water potential. For example, assuming 60% of the annual average rain falling on a terraced surface of area 100 m2 can be gathered, this would provide 78,000 litres of water. To encourage the adoption of RWH, Metro-water has created a Rainwater Harvesting Cell, a unit that provides awareness on RWH and offers free technical assistance and cost effective solu-tions to Chennai residents (Figure 2). In addition, RWH is being incorporated into the regulations for new buildings. The project has achieved con-siderable success. As of the end of December 2005, over 300,000 buildings in Chennai have RWH (Table 2). Sources: 1. Tamilnadu Water supply and Drainage
Board (www.aboutrainwaterharvesting.com/)
2. www.rainwaterharvesting.org 3. Chennai Water Supply and Sewerage
Board. (www.chennaimetrowater.com/) 4. India Meteorological Department (www.
imd.ernet.in/)
Figure 3. From www.chennaimetrowater.com/.

5
Urban Climate News
The Deccan Herald published this article on Feb-ruary 3, 2006. The Herald covers news for the state of Karnataka, India (Bangalore is the state capital). The article outlines a familiar issue, that of the ubiquitous nature of some architectural types and the cost of building climate control.
Need for eco-friendly buildings Jayalakshmi K.
Gleaming in their sporty glass facades, Bangalore’s high-rise buildings boast of a city that has arrived. Take a second look at the buildings and you will realise they all look alike. In fact, they even resemble their counter-parts in Boston or London. It is almost as if the archi-tects are merely copying from some design book. Un-fortunately, it is the wrong book. In a rush to give the city a global look, builders are piling up large quantities of high energy steel and aluminium. Says Chandrashekar Hariharan, director, Biodiversity Conservation India Ltd (BCIL), “It is all about what adds on to your building value, whether you use glass, aluminium or steel. Glass is being used lib-erally as it takes less time to put up a building, is easy to build and is sold as a lasting material that needs no painting etc, over time. Nobody realises what a high energy material glass is. You just need to stand outside one of those buildings in Koramangala or Bannerghatta road and you can feel the blast of heat. But who ca-res?” Concrete and glass help retain heat inside the building, adding on to the cooling load of air condition-ers. The more of the sun’s heat you let in, the more overtime your AC has to work and the more heat it spits out into the outside environment. This is one of the main causes of islands of urban heat around the cities of the world. A plush office is not always a healthy office. Shilpa, who works in one of the steel and glass mono-liths in the city knows that. Like many who work in air-conditioned workplaces, she has noticed that the cold bug seems to stay on and on! Blame it on the AC. “Did you know that the air conditioners we have, work with a mere eight percent fresh air while the rest is the same stale air circulated over and over again?” asks Hariha-ran. At any given point in time, air quality inside the average air-conditioned building is 2-5 times worse than the air outside and most of us spend 90 percent of our time indoors. The other issue around ACs is the undesirable degree of cooling that most offices resort to. Instead of 23-26 degrees, what is usually experienced is a cold 17-18 degrees. All this finally means more power con-sumed. More power consumed means more coal burnt. In India, over 50 percent of power requirements are met through coal and will be for quite some time to come. Coal is one of the most prolific emitters of green-house gases.
So is anyone asking for a return to the dark ages? Not at all! Much can be done without sacrificing personal comfort. In fact, the gains are not only in terms of energy savings but also in terms of overall health and employee performance….. Here in Banga-lore, we have a few work areas that have adopted the ‘green building’ concept. … “You simply need to stop using technology blindly. How did our ancestors live? Did they live without comfort? We studied ancient ar-chitecture as also some of our palaces and buildings to seek alternative ways of providing fresh air and sunlight. We do not use a single AC in our office.’’ The initial cost in creating a ‘green building’ is a bit high but, operating cost drops drastically and makes up for the high cost incurred at the beginning, in just a couple of years. Green buildings increases the occu-pant’s performance by 6-26 percent and reduces respi-ratory diseases by 9-20 percent, according to a CII study. A perfect solution for both the employer and the employee.
One of Bangalore’s new office buildings (Source: grhuth.tripod.com/ bangalore.htm).
Map of India (Source: www.indianembassy.org/indiainfo/india_map.jpg)
6
Urban Climate News
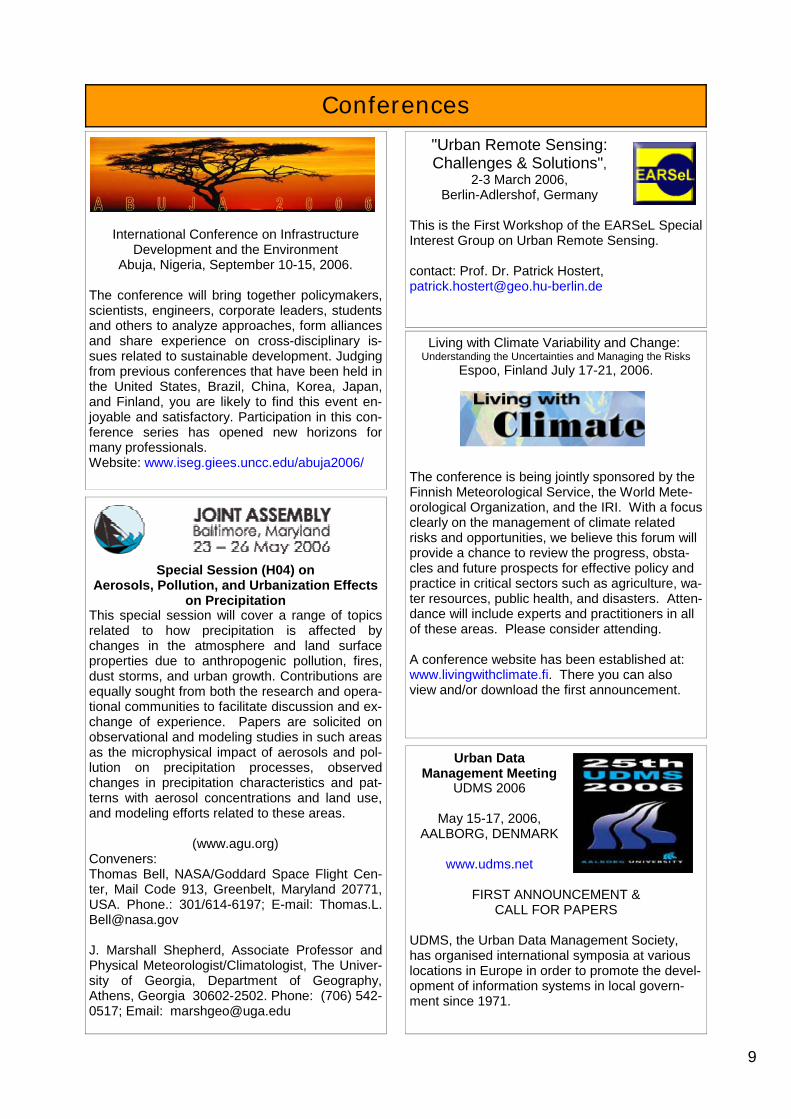
Hurricane Katrina There are a great number of resources on Hurricane Katrina and its impact on New Orleans, particularly. A data clearinghouse on this topic is available at the Louisiana Geographic Information Center (http://lagic.lsu.edu/hurricanes.htm). Included among the materials is an electronic atlas that provides detailed maps of the path and impact of the storm. A four part lecture series on ‘Assessing Katrina: Eco-systems, Urbanization and the Real Costs of Recla-mation’ is being held in Stanford School of Earth Sci-ences. Two lectures remain: • "Rebuild or Abandon?" Monday, Feb. 27, chaired by Barton "Buzz" Thompson, co-director of the
Stanford Institute for the Environment. • "Dealing with Disasters," Monday, March 6, chaired by Pamela Matson, dean of the School of
Earth Sciences. The lecture series is sponsored by the School of Earth Sciences, the Stanford Institute for the Environ-ment, the Freeman Spogli Institute and Stanford Continuing Studies. For online maps and directions, visit http://pangea.stanford.edu/outreach/about/maps.html.
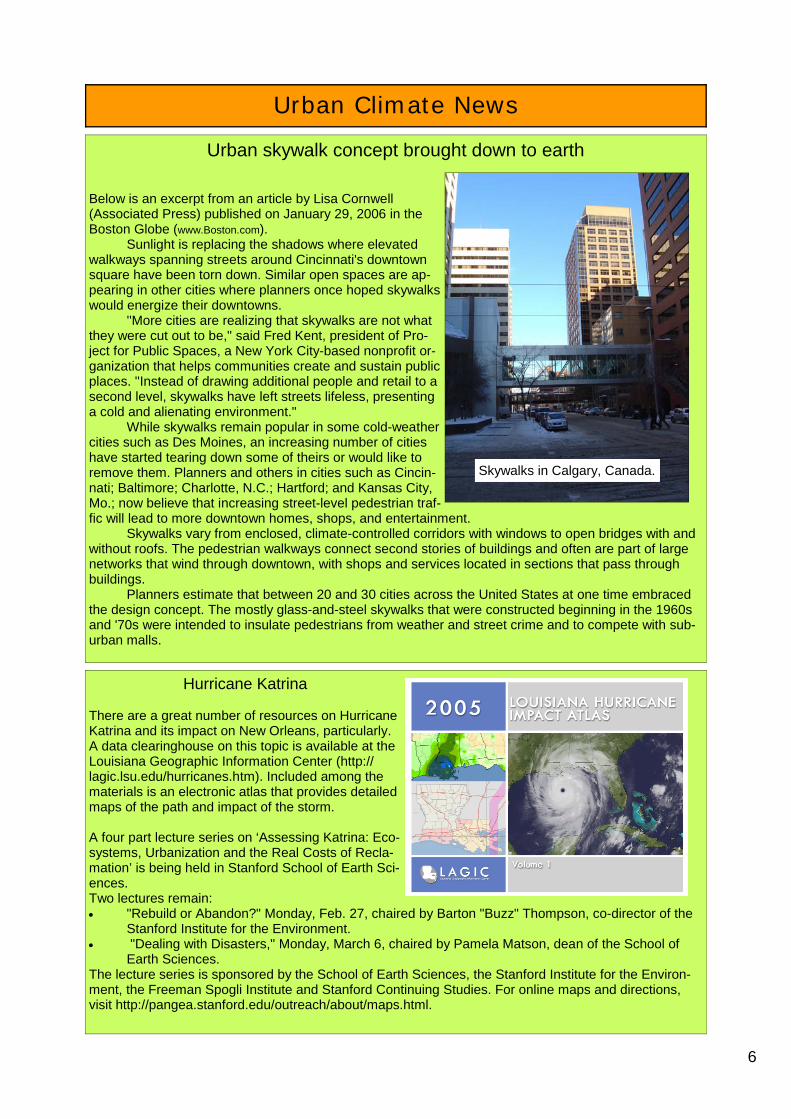
Urban skywalk concept brought down to earth Below is an excerpt from an article by Lisa Cornwell (Associated Press) published on January 29, 2006 in the Boston Globe (www.Boston.com). Sunlight is replacing the shadows where elevated walkways spanning streets around Cincinnati's downtown square have been torn down. Similar open spaces are ap-pearing in other cities where planners once hoped skywalks would energize their downtowns. ''More cities are realizing that skywalks are not what they were cut out to be," said Fred Kent, president of Pro-ject for Public Spaces, a New York City-based nonprofit or-ganization that helps communities create and sustain public places. ''Instead of drawing additional people and retail to a second level, skywalks have left streets lifeless, presenting a cold and alienating environment." While skywalks remain popular in some cold-weather cities such as Des Moines, an increasing number of cities have started tearing down some of theirs or would like to remove them. Planners and others in cities such as Cincin-nati; Baltimore; Charlotte, N.C.; Hartford; and Kansas City, Mo.; now believe that increasing street-level pedestrian traf-fic will lead to more downtown homes, shops, and entertainment. Skywalks vary from enclosed, climate-controlled corridors with windows to open bridges with and without roofs. The pedestrian walkways connect second stories of buildings and often are part of large networks that wind through downtown, with shops and services located in sections that pass through buildings. Planners estimate that between 20 and 30 cities across the United States at one time embraced the design concept. The mostly glass-and-steel skywalks that were constructed beginning in the 1960s and '70s were intended to insulate pedestrians from weather and street crime and to compete with sub-urban malls.
Skywalks in Calgary, Canada.

7
Urban Project Report
Eddy covariance measurements of urban fluxes of VOCs and CO2
from a Mexican neighborhood
As part of the MCMA-2003 field campaign in Mexico City, we deployed an eddy covariance (EC) flux system on a tall tower (37 m) at the CE-NICA super site (see Fig. 1) to perform direct measurements of fluxes of CO2 and selected volatile organic compounds (VOCs) from sources in an urban neighborhood (Velasco et al., 2005a; 2005b). We employed a chemiluminescent iso-prene analyzer (Guenther and Hills, 1998) cali-brated to measure fluxes of olefins (Fast Olefin Sensor, FOS) with the EC technique, a Proton Transfer Reaction-Mass Spectrometer (PTR-MS) to measure fluxes of acetone, methanol, toluene and C2-benzenes using the disjunct eddy covari-ance method (DEC), and an open path infrared gas analyzer (IRGA) to measure fluxes of CO2 by EC. Flux measurements were collected during April 2003, with the main goal of demonstrate the feasibility of making eddy flux measurements of trace gases, in particular of VOCs in an urban en-vironment, where the spatial variability of emis-sion sources, surface cover and roughness is very complex.
The flux data were evaluated to confirm that
the measured fluxes met stationary conditions and comprised turbulent signals at sufficiently high and low frequencies in the unstable surface layer. The footprint of the measured flux was also evaluated using a hybrid model based upon Lagrangian stochastic simulations and similarity theory (Hsieh et al., 2000). The results indicated that the footprint was large enough to character-ize fluxes from a typical neighborhood and fluxes were representative of emissions at a scale that is quite useful for the evaluation of urban emis-sion inventories. With this in mind, we examined the Mexican VOCs emissions inventory for the neighborhood around the flux measurement site. Figure 2 shows good agreement between the di-urnal profiles for measured and calculated olefin fluxes. The measured flux of olefins was slightly higher than predicted by the emissions inventory during early morning hours, but during the rest of the day, the inventoried olefinic emissions exceed the measured fluxes by no more than 30%. Note that the diurnal profile of measured olefin fluxes (Figure 2) remained positive, which indicates that the urban surface is always a net source of ole-fins. The highest fluxes were recorded after sun-
rise, between 6:30 and 8 am coinciding with rush hour traffic, and the lowest fluxes were observed during late night and early morning. Overall, fluxes of CO2 and VOCs showed similar diurnal patterns and were strongly correlated to vehicular traffic.
In summary, the flux measurements obtained
during MCMA-2003 demonstrated the use of EC and DEC techniques to perform VOC flux meas-urements in an urban area using state of the art VOC sensors. The capability to evaluate emis-sion inventories using these techniques, as we have described in this work, is a valuable new tool for improving air quality management. How-ever, flux measurements in other locations from the city, including a larger number of VOC spe-cies, are required to confirm the representative-ness of the 2003 flux measurements in terms of the magnitude, composition, and overall distribu-tion of urban emissions.
Figure 1. Flux tower erected at the CENICA su-per-site during the MCMA-2003 field campaign. Dimensions are in meters.

8
With that goal in mind, VOC flux measure-ments will be collected from a new site in Mexico City during March 2006 as part of the MILAGRO campaign. We will extend the list of VOC com-pounds measured by increasing the number of aromatic and oxygenated species analyzed by the PTR-MS, and by using a disjunct eddy accu-mulation (DEA) system coupled with VOC gas chromatography / flame ionization detection (GC-FID). We also plan to measure CO2 fluxes using and IRGA and CO fluxes using spectroscopic techniques. Since VOCs, CO and CO2 in urban environments are strongly related to combustion sources, it will be very useful to compare ratios of fluxes among these different species as well as to compare the absolute magnitudes of the fluxes. Lastly, we will attempt to measure fluxes of pri-mary aerosol (organics, sulfate and nitrate) using an Aerodyne Aerosol Mass Spectrometer (AMS).
This work will be conducted by Washington
State University (WSU) in collaboration with the Molina Center for Energy and Environment (MCE2), the Pacific Northwest National Labora-tory (PNNL) and the local air quality monitoring agency (SIMAT). Results will be important for modeling analyses of the MILAGRO field cam-paign and for future air quality management within Mexico City and other megacities. Erik Velasco2, Shelley Pressley1, Brian Lamb1, Hal Westberg1, Eugene Allwine1, Tom Jobson1, Michael Alexander3, Luisa Molina2, Mario Molina2
Urban Project Report
Figure 2. Average diurnal pattern of olefin fluxes meas-ured via EC during the MCMA-2003 field campaign and the sum of olefinic emissions reported in the emissions inventory for the grid where the flux system was lo-cated. The shadow represents ±1 stan-dard deviation from the total flux aver-age, and gives an indication of the day-to-day variabil-ity.
1. Laboratory for Atmospheric Research, Depart-ment of Civil and Environmental Engineering, Washington State University, Pullman Washing-ton,USA 2. Molina Center for Energy and Environment, DF, Mexico. 3. Battelle Pacific Northwest Nacional Laboratory, Richland Washington, USA
References
Guenther, A.B. & Hills, A. Eddy covariance meas-urement of isoprene fluxes, J. Geophys. Res. – Atmos. 103, 13145-13152 (1998).
Hsieh, C.I., Katul, G. & Chi, T. An approximate analytical model for footprint estimation of scalar fluxes in thermally stratified atmospheric flows, Advances in Water Resources 23, 765-772 (2000).
Velasco, E., Lamb, B., Pressley, S., Allwine, E., Westberg, H., Jobson, B.T., Alexander, M., Prazeller, P., Molina, L. & Molina, M. Flux meas-urements of volatile organic compounds from an urban landscape, Geophys. Res. Lett., Vol 32, L20802, doi:10.1029/2005GL023356 (2005a).
Velasco, E., Pressley, S., Allwine, E., Westberg, H. & Lamb, B. Measurements of CO2 fluxes from the Mexico City urban landscape, Atmos. Envi-ron.39, 7433–7446 (2005b).
9
"Urban Remote Sensing: Challenges & Solutions",
2-3 March 2006, Berlin-Adlershof, Germany
This is the First Workshop of the EARSeL Special Interest Group on Urban Remote Sensing. contact: Prof. Dr. Patrick Hostert, [email protected]
Conferences
Urban Data Management Meeting
UDMS 2006
May 15-17, 2006, AALBORG, DENMARK
www.udms.net
FIRST ANNOUNCEMENT &
CALL FOR PAPERS UDMS, the Urban Data Management Society, has organised international symposia at various locations in Europe in order to promote the devel-opment of information systems in local govern-ment since 1971.
Living with Climate Variability and Change: Understanding the Uncertainties and Managing the Risks
Espoo, Finland July 17-21, 2006. The conference is being jointly sponsored by the Finnish Meteorological Service, the World Mete-orological Organization, and the IRI. With a focus clearly on the management of climate related risks and opportunities, we believe this forum will provide a chance to review the progress, obsta-cles and future prospects for effective policy and practice in critical sectors such as agriculture, wa-ter resources, public health, and disasters. Atten-dance will include experts and practitioners in all of these areas. Please consider attending. A conference website has been established at: www.livingwithclimate.fi. There you can also view and/or download the first announcement.
Special Session (H04) on Aerosols, Pollution, and Urbanization Effects
on Precipitation This special session will cover a range of topics related to how precipitation is affected by changes in the atmosphere and land surface properties due to anthropogenic pollution, fires, dust storms, and urban growth. Contributions are equally sought from both the research and opera-tional communities to facilitate discussion and ex-change of experience. Papers are solicited on observational and modeling studies in such areas as the microphysical impact of aerosols and pol-lution on precipitation processes, observed changes in precipitation characteristics and pat-terns with aerosol concentrations and land use, and modeling efforts related to these areas.
(www.agu.org) Conveners: Thomas Bell, NASA/Goddard Space Flight Cen-ter, Mail Code 913, Greenbelt, Maryland 20771, USA. Phone.: 301/614-6197; E-mail: [email protected] J. Marshall Shepherd, Associate Professor and Physical Meteorologist/Climatologist, The Univer-sity of Georgia, Department of Geography, Athens, Georgia 30602-2502. Phone: (706) 542-0517; Email: [email protected]
International Conference on Infrastructure Development and the Environment
Abuja, Nigeria, September 10-15, 2006. The conference will bring together policymakers, scientists, engineers, corporate leaders, students and others to analyze approaches, form alliances and share experience on cross-disciplinary is-sues related to sustainable development. Judging from previous conferences that have been held in the United States, Brazil, China, Korea, Japan, and Finland, you are likely to find this event en-joyable and satisfactory. Participation in this con-ference series has opened new horizons for many professionals. Website: www.iseg.giees.uncc.edu/abuja2006/

10
Conferences
ICUC-6 Sixth International
Conference on Urban Climate Göteborg, Sweden
June 12th - 16th, 2006 www.gvc.gu.se/icuc6,
Registration starts:
10th of February 2006
Registration and submission of preprint: 10th of April 2006
ICUC-7 We would like to start the process to identify the lo-cation and host of the next ICUC meeting which will probably be held in 2009. Those interested in host-ing the next conference need to prepare a proposal. The proposal must address the following points: 1. Organizer's name and institutional affiliation 2. Location for conference, facilities available
(conference, hotels) 3. Proposed timing of conference 4. Proposed registration or other fees for con-
ference, and an indication of how surpluses or deficits are to be handled.
5. Whether there will be a preprint volume or conference proceedings (printed or on CD-ROM).
6. Institutional/private/government support for holding the conference at
this location. This might include suggestions for a joint conference with another society or organiza-tion. Previous organizers of ICUC conferences are: Professor Y. Nakamura, Japan ([email protected]) Professor W. Kuttler, University of Essen, Germany ([email protected]) Dr Richard DeDear, Macquarie University, Australia ([email protected]) Professor K. Klysik, University of Lodz, Poland [email protected]) (ICUC-5) Professor S. Lindqvist, Göteborg University, Swe-den ([email protected]) (ICUC-6) These people can provide insight into the necessary financial and institutional support that is needed to run a successful conference. It must be appreciated that ICUC of itself has no funds, its main resource is the enthusiasm of its members the knowledge that designated ICUC meetings attract the best of the international urban climate community, and that our past success has created mutually beneficial inter-organizational linkages. Proposals should be submitted in electronic format to Dr. Matthias Roth ([email protected]) by 10 April 2006. We will have initial evaluations with the Board of the IAUC and then ask finalists to pre-pare a presentation for the Board Meeting at ICUC-6. If you have any queries or would like to see what a full previous proposal looked like please contact Matthias Roth.
Topics include: a. Application of cool materials in urban regions b. Performance characteristics of existing and
emerging urban materials c. Materials case studies d. Material optimization models and life cycle cost-
ing e. National and international financing of urban
infrastructure projects f. Regulatory program considerations and incen-
tives g. Outreach and education opportunities In addition, we will also be providing attendees with a tour of the new Interdisciplinary Science and Technol-ogy Building II (the new home of the National Center of Excellence SMART Materials laboratories) and a tour of the 3-D 270 degree Decision Theater (one of only two in the United States). Registration and exhibitor information can be found at www.asusmart.org/smart/coolpavements/conference.jsp. This one day conference will be in con-junction with the two-day conference on "Pavements/Materials Today and Tomorrow" also hosted by ASU on April 25 and 26, 2006.

11

12
IAUC Committee Reports
Bibliography
This has been a great year for urban climate pub-lications. We have seen a wide range of interest-ing papers spanning the breadth of the subject from cities around the world. Thanks to everyone who has collected and sent in references. Look out for the complete 2003 and 2004 bibliogra-phies on the IAUC website in the near future! Please send any further papers published since January 1 2004 for inclusion in the next newslet-ter to [email protected]. As before, please mark the header of your email with 'IAUC Publica-tions 2006'. In order to facilitate entering the infor-mation into the data base please use the follow-ing format: Author: Title: Journal: Volume: Pages: Dates: Keywords: Language: We look forward to hearing from you soon! Heather Thompson, on behalf of Jennifer Salmond University of Birmingham [email protected]
Recent publications in Urban Climatology (Languages are specified where the publication is known to be in a language other than in English.) 1. Ali-Toudert, F. and Mayer, H. (2006). "Numerical study on the effects of aspect ratio and orientation of an urban street canyon on outdoor thermal comfort in hot and dry climate." Building and Environment 41: 94-108. 2. Baklanov, A., Sorensen, J. H., Hoe, S. C. and Amstrup, B. (2006). "Urban meteorological model-ling for nuclear emergency preparedness." Journal of Environmental Radioactivity 85: 154-170. 3. Beevers, S. D. and Carlsaw, D. C. (2005). "The impact of congestion charging on vehicle speed and its implications for assessing vehicle emissions." Atmospheric Environment 39(36): 6875-6884. 4. Berkowitz, C. M., Christopher Doran, J., Shaw, W. J., Springston, S. R. and Spicer, C. W. (2006). "Trace-gas mixing in isolated urban boundary lay-
ers: Results from the 2001 Phoenix sunrise experi-ment." Atmospheric Environment 40(1): 50-57. 5. Bessagnet, B., Hodzic, A., Blanchard, O., Lattuati, M., Le Bihan, O., Marfaing, H. and Rouil, L. (2005). "Origin of particulate matter pollution episodes in wintertime over the Paris Basin." Atmospheric Envi-ronment 39(33): 6159-6174. 6. D Amato, G. (2004). "Urban air pollution and aller-gic bronchial asthma." Internista - MILAN- 12(1): 18-33. 7. Eliasson, I., Offerle, B., Grimmond, C. S. B. and Lindqvist, S. (2006). "Wind fields and turbulence sta-tistics in an urban street canyon." Atmospheric Envi-ronment 40(1): 1-16. 8. Ereitas, E. D., Martins, L. D., Dias, P. L. and Andrade, M. D. (2005). "A simple photochemical module implemented in RAMS for tropospheric ozone concentration forecast in the metropolitan area of San Paulo, Brazil: Coupling and validation." Atmospheric Environment 39(34): 6352-6361. 9. Fisher, B. (2005). "Sensitivity of urban dispersion calculations to urban meteorology (COST 715)." In-ternational Journal of Environment and Pollution 25(1/4 The 9th International Conference on Harmoni-sation within Atmospheric Dispersion Modelling for Regulatory Purposes): 71-79. 10. Jauregui, E. (2005). "Possible impact of urbani-zation on the thermal climate of some large cities in Mexico." Atmosfera 18: 249-252. 11. Jericevic, A. and Grisogono, B. (2006). "The critical bulk Richardson number in urban areas: veri-fication and application in a numerical weather pre-diction model." Tellus Series A: Dynamic Meteorol-ogy and Oceanography 58(1): 19-27. 12. Kanda, M., Kawai, T., Kanega, M., Moriwaki, R., Narita, K. and Hagishima, A. (2005). "A Simple En-ergy Balance Model for Regular Building Arrays." Boundary Layer Meteorology 116(3): 423-443. 13. Kondo, H., Genchi, Y., Kikegawa, Y., Ohashi, Y., Yoshikado, H. and Komiyama, H. (2005). "Development of a Multi-Layer Urban Canopy Model for the Analysis of Energy Consumption in a Big City: Structure of the Urban Canopy Model and its Basic Performance." Boundary Layer Meteorology 116(3): 395-421. 14. Kono, H. and Kusunoki, K. (2005). "3D stream and vortexes in the urban canopy layer and trans-port of motor vehicles exhaust gas." International

13
IAUC Awards Committee
Journal of Environment and Pollution 25(1/4 The 9th International Conference on Harmonisation within Atmospheric Dispersion Modelling for Regulatory Purposes): 177-190. 15. Koutsourakis, N., Neofytou, P., Venetsanos, A. G. and Bartzis, J. G. (2005). "Parametric study of the dispersion aspects in a street canyon area." In-ternational Journal of Environment and Pollution 25(1/4 The 9th International Conference on Harmoni-sation within Atmospheric Dispersion Modelling for Regulatory Purposes): 155-263. 16. Li, L., Hu, F., Cheng, X.-L., Jiang, J.-H. and Ma, X.-G. (2006). "Numerical simulation of the flow within and over an intersection model with Rey-nolds-averaged Navier-Stokes method." Chinese Physics 15: 149-155. 17. Matsumoto, J., Imai, H., Kosugi, N. and Kajii, Y. (2005). "In situ measurement of N2O5 in the urban atmosphere be thermal decomposition/laser-induced flourescence technique." Atmospheric Envi-ronment 39(36): 6802-6811. 18. Middleton, D. R. and Davies, F. (2005). "Evaluation of dispersion model parameters by dual Doppler lidars over West London, England." Interna-tional Journal of Environment and Pollution 25(1/4 The 9th International Conference on Harmonisation within Atmospheric Dispersion Modelling for Regula-tory Purposes): 80-94. 19. Moussiopoulos, N., Ossanlis, I. and Barmpas, P. (2005). "A study of heat transfer effects on air pollu-tion dispersion in street canyons by numerical simu-lations." International Journal of Environment and Pollution 25(1/4 The 9th International Conference on Harmonisation within Atmospheric Dispersion Mod-elling for Regulatory Purposes): 131-144. 20. Offerle, B., Jonsson, P., Eliasson, I. and Grim-mond, C. S. B. (2005). "Urban modification of the surface energy balance in the west African Sahel: Ouagadougou, Burkina Faso." Journal of Climate 18: 3983-3995. 21. O'Neill, M. S., Hajat, S., Zanobetti, A., Ramirez-Aguilar, M. and Schwartz, J. (2005). "Impact of con-trol for air pollution and respiratory epidemics on the estimated associations of temperature and daily mortality." International Journal of Biometeorology 50(2): 121-129. 22. Pilidis, C. A., Karakitsios, S. P. and Kas-somenos, P. A. (2005). "BTX measurements in a medium sized European City." Atmospheric Environ-ment 39(33): 6051-6065.
23. Sasaki, K. and Sakamoto, K. (2005). "Vertical differences in the composition of PM10 and PM2.5 in the urban atmosphere of Osaka, Japan." Atmos-pheric Environment 39(38): 7240-7250. 24. Sharma, M. and Maloo, S. (2005). "Assessment of ambient air PM10 and PM2.5 and characteriza-tion of PM10 in the city of Kanpur, India." Atmos-pheric Environment 39(33): 6015-6026. 25. Svane, M., Janhall, S., Hagstrom, M. and Hallquist, M. (2005). "On-line alkali analysis of indi-vidual aerosol particles in urban air." Atmospheric Environment 39(36): 6919-6930. 26. Vassilakos, C., Saraga, D., Maggos, T., Micho-poulos, J., Pateraki, S. and Helmis, C. G. (2005). "Temporal variations of PM2.5 in the ambient air of a suburban site in Athens, Greece." Science of the Total Environment 349(1-3): 223-231. 27. Velasco, E., Pressley, S., Allwin, E., Westberg, H. and Lamb, B. (2005). "Measurements of CO2 fluxes from Mexico City urban landscape." Atmos-pheric Environment 39(38): 7433-7446. 28. Weber, S. (2006). "Comparison of in-situ meas-ured ground heat fluxes within a heteorogeneous urban ballast layer." Theoretical and Applied Clima-tology 83(1-4): 169-179. 29. Yin, J., Allen, A. G., Harrison, R. G., Jennings, S. G., Wright, E., Fitzpatrick, M., Healy, T., Barry, E., Ceburnis, D. and McCusker, D. (2005). "Major component composition of urban PM10 and PM2.5 in Ireland." Atmospheric Research 78(3-4): 149-165. 30. Zawar-Reza, P., Kingham, S. and Pearce, J. (2005). "Evaluation of a year-long dispersion model-ling of PM10 using the mesoscale model TAPM for Christchurch, New Zealand." Science of the Total Environment 349(1-3): 249-259.
Bibliography

14
The Landsberg Award
AWARDS Committee
Non-Voting members of the Board: Past Secretary: John Arnfield, USA. Past President: Tim Oke, Canada. Local Organizer ICUC5: Kazimierz Klysik Poland. Local Organizer ICUC6: Sven Lindqvist, Sweden.
IAUC Committee Chairs Editor IAUC Newsletter: Gerald Mills Chair Bibliography Committee: Jennifer Salmond Chair Membership Committee: Janet Barlow Chair Teaching Resources: Gerald Mills Chair Awards Committee: Bob Bornstein WebMasters: James Voogt
Board Members & Terms
President: Sue Grimmond (USA), 2007 Secretary: Matthias Roth (Singapore), 2007 Janet Barlow (UK), 2007 Arieh Bitan (Israel), 2006 Jennifer Salmond (UK), 2009. Krzysztof Fortuniak (Poland), 2007 Wilhelm Kuttler (Germany), 2008 Gerald Mills (Ireland), 2007 Manabu Kanda (Japan), 2009 James Voogt (Canada), 2006
Board Information
"The American Meteorologi-cal Society's Helmut E. Landsberg Award is a new award that has just been es-tablished to recognize contri-butions to increased under-standing of the urban envi-ronment. With this new award, the AMS supports the growing recognition of the importance of meteorology,
climatology, and hydrology in urban areas, and the associated impacts on urban societies and on the general atmospheric environment. This Award will recognize an individual for exemplary contributions to the fields of urban meteorology, climatology, or hydrology, including, but not re-stricted to, achievements through measurements or modeling that provide an improved under-standing of atmospheric processes in urban envi-ronments, enhanced urban meteorological or air quality forecasting capabilities, advances in iden-tifying and quantifying beneficial and adverse im-pacts in urban areas, or in recognition of service or applications in the field. Contributions may ei-ther be for a singular achievement or in recogni-tion of sustained contributions over a period of many years. The inaugural award will be pre-sented at the AMS 2007 Annual Meeting. Nominations for this Award is open to the interna-tional community. You are invited to submit a documentation package for your nomination; the package should consists of the following: A nomination letter not to exceed three pages in-cluding the (a) name of the Award, (b) description of the nominee's major accom-
plishments and contribution, (c) a two page CV (and if appropriate, a bibli-
ography of no more than three pages, (d) up to three letters of recommendation of
not more than two pages each, and (e) a proposed citation of no more than 30
words that highlights the major accomplish-ments of the nominee.
The deadline for nomination packages is 1 May and should be sent to the Chair, Awards Over-sight Commitee, American Meteorological Soci-ety , 45 Beacon Street, Boston Massachusetts 02108. (To avoid disappointment in the event of failure of selection, the nominee should not be informed that she/he is being nominated.)"
IAUC Nominations Board
The IAUC is to create a Nomination Board, with the responsibility of this group will be to solicit and encourage nominations for positions within the IAUC, for Awards etc. Such a committee ex-ists in many organizations. One of the first tasks of the committee, with the Board, will be to draft a statement of responsibilities. Ideally this will just be a small group, I will suggest three people with wide geographic representation and composed of urban climatologists who are active participants in the community and responsive to requests made of them. If you would like to stand for this commit-tee, and/or have people you would like to nomi-nate (I will happily contact them), please email me by March 1, 2006. If any who have not ex-pressed comments to date on this idea, or if you have further comments, I encourage you to share them with the full Board. Sue Grimmond IAUC President. [email protected]