issn: applied share your innovations through jacs...
TRANSCRIPT
XXXX-XXXX / JACS Directory©2017. All Rights Reserved
Cite this Article as: G. Lakshmi, C. Gopinathan, S.P.M. Deborrah, Tennyson Daniel, Estimation and prediction of global solar radiation at selected cities in Tamilnadu, India, J. Adv. Phy. Sci. 1(1) (2017) 13–17.
J. Adv. Phy. Sci. - Volume 1 Issue 1 (2017) 13–17
Share Your Innovations through JACS Directory
Journal of Advanced Physical Sciences
Visit Journal at http://www.jacsdirectory.com/japs
Estimation and Prediction of Global Solar Radiation at Selected Cities in Tamilnadu, India
G. Lakshmi1, C. Gopinathan1, S.P.M. Deborrah2, Tennyson Daniel3,* 1Department of Solar Energy, School of Energy Sciences, Madurai Kamaraj University, Madurai – 625 021, Tamil Nadu, India. 2Department of Physics, The American College, Madurai – 625 002, Tamil Nadu, India. 3Regional Test Centre (Solar Thermal), Madurai Kamaraj University, Madurai – 625 021, Tamil Nadu, India.
A R T I C L E D E T A I L S
A B S T R A C T
Article history: Received 18 July 2017 Accepted 01 August 2017 Available online 07 August 2017
Studies on solar radiation have become important for renewable energy issues stemming from oil crises and other environmental problems, thus increasing the need of reliable measurements of surface solar radiation. Six locations in Tamil Nadu were chosen for the study and global solar radiation was measured continuously for a period of one year along with relevant meteorological parameters. It was observed that the levels of solar radiation varied from a minimum of 1.9 kWh/m2/day during post monsoon season to a maximum of 6.6 kWh/m2/day during pre-monsoon season. Metronome and Bird clear sky models were validated for the selected locations. Results of the statistical indicators – Root Mean Square Error (RMSE) and Index of Agreement (D) showed that the models had excellent performance accuracy.
Keywords: Solar Radiation Meteonorm Model Bird Clear Sky Model Statistical Analysis
1. Introduction
Solar radiation data is the primary and vital requirement for solar energy installations at any location. The solar radiation intensity at any location varies throughout the year based on variations in solar declination angle, solar hour angle and geographical angles such as latitude and longitude and other climatic conditions such as wind, dust, air temperature and air pressure [1]. Therefore, it is necessary to analyze the climatic parameters which influence global solar radiation. Global solar radiation is an essential and important variable to agriculture, environment, hydrology and ecology models. Despite its significance, global solar radiation data is not widely available due to the cost and difficulty in maintenance of the measuring equipment [2]. Lack of sufficient radiation data has been reported in many countries worldwide [3]. In the present study, global solar radiation was measured continuously at six selected locations in Tamil Nadu, India along with relevant meteorological parameters for a period of one year. Global solar radiation was also predicted at these locations using theoretical models that use meteorological parameters as inputs. The predicted and measured results were statistically analyzed to find the accuracy of the models.
2. Experimental Methods
Six cities in the state of Tamil Nadu, namely Chennai, Madurai, Erode, Tiruchirappalli, Ramanathapuram and Tirunelveli were selected for the global solar radiation measurements. The geographical locations of the study area are depicted in Table 1. Table 1 Geographical features of the locations under study
Location Latitude (N) Longitude (E) Altitude (m)
Location 1 13.08 80.27 6.7
Location 2 9.92 78.12 101
Location 3 11.34 77.72 183
Location 4 10.79 78.70 85
Location 5 9.41 78.70 2
Location 6 8.71 77.76 47
It can be observed from Table 1 that the latitude of the different locations varied from 8.71 N to 13.08 N and the longitude of the locations varied between 77.72 E and 80.27 E. The altitude varied from 2 metres at Ramanathapuram to 183 metres at Erode. A brief description about the study locations is given below.
2.1 Chennai (Location 1)
Chennai, formerly known as Madras is the capital of Tamil Nadu. Located on the Coromandel Coast off the Bay of Bengal, it is one of the biggest cultural, economic and educational centers in South India [4]. According to the 2011 Indian census, it is the sixth largest city and the fourth most populous urban agglomeration in India. The city, together with the adjoining regions constitutes the Chennai Metropolitan Area, which is the 36th largest urban area by population in the world [5]. The city is located on the south–eastern coast of India in the north–eastern part of Tamil Nadu on a flat coastal plain known as the Eastern Coastal Plains. Its average elevation is around 6.7 metres (22 ft) and its highest point is 60 m (200 ft) [6].
2.2 Madurai (Location 2)
Madurai is a major city in Tamil Nadu. It is the administrative headquarters of Madurai District. Madurai is the second largest city by population in Tamil Nadu and is the 25th populated city in India. Located on the banks of River Vaigai, Madurai has been a major settlement for two millennia. Madurai is located at 9.93° N 78.12° E. It has an average elevation of 101 metres [7].
2.3 Erode (Location 3)
Erode is the seventh largest urban agglomeration in Tamil Nadu and is the administrative headquarters of Erode District. Erode is located at 11.21° N 77.44° E [8]. The city is located in Erode district of Tamil Nadu, at a distance of 400 km (250 mi) from Chennai. Erode has a hilly terrain with undulating topography.
2.4 Tiruchirappalli (Location 4)
Tiruchirappalli is the administrative headquarters of Tiruchirappalli District. It is the fourth largest municipal corporation and the fourth largest urban agglomeration in the state. Located 322 kilometres (200 mi) south of Chennai and 379 kilometres (235 mi) north of Kanyakumari, Tiruchirappalli sits almost at the geographic centre of the state. Tiruchirappalli is located at 10.8050° N 78.6856° E. The topology of Tiruchirappalli is almost flat, with an average elevation of 88 metres (289 ft) [9].
*Corresponding Author Email Address: [email protected] (Tennyson Daniel)
ISSN: APPLIED

14
G. Lakshmi et al. / Journal of Advanced Physical Sciences 1(1) (2017) 13–17
Cite this Article as: G. Lakshmi, C. Gopinathan, S.P.M. Deborrah, Tennyson Daniel, Estimation and prediction of global solar radiation at selected cities in Tamilnadu, India, J. Adv. Phy. Sci. 1(1) (2017) 13–17.
2.5 Ramanathapuram (Location 5)
Ramanathapuram, also known as Ramnad, is a city and a municipality in Ramanathapuram district in Tamil Nadu. It is the administrative headquarters of Ramanathapuram district and the second largest town (by population) in Ramanathapuram district. Ramanathapuram is located at 9.38° N 78.83° E and has an average elevation of 2 metres (6 feet) [10].
2.6 Tirunelveli (Location 6)
Tirunelveli, also known as Nellai, is the administrative headquarters of the Tirunelveli District. It is the sixth-largest municipal corporation in the state. The city is located on the west bank of the Thamirabarani River; its twin city Palayamkottai is on the east bank. Tirunelveli is located at 8.73° N 77.7° E and its average elevation is 47 metres (154 ft) [11].
Solar radiation data was continuously monitored at these six locations for a period of one year using calibrated pyranometers. Meteorological parameters such as ambient temperature, relative humidity, wind speed, atmospheric pressure and precipitation were also monitored simultaneously using calibrated instruments.
3. Results and Discussion
3.1 Estimation of Global Solar Radiation
Location 1 receives global solar radiation in the range of 3.7 to 5.7 kWh/m2 during winter, 6.3 to 6.6 kWh/m2 during pre-monsoon, 4.7 to 5.4 kWh/m2 during south west monsoon and 3.8 to 4.8 kWh/m2 during post monsoon. The hottest part of the year is in late April to early June, with maximum temperatures reaching 40° C to 42° C. The coolest part of the year is during January and February with minimum temperatures of around 19° C to 20° C. The average annual rainfall is about 25.3 mm. The city gets most of its seasonal rainfall from the north–east monsoon winds, from mid–October to mid–December. The highest of 252 mm is recorded during the month of November. The average relative humidity observed ranges between 64% during south-west monsoon and 89% during north-east monsoon. Prevailing winds in Chennai are southwesterly between April and October and north-easterly during the rest of the year. The average wind speed ranges from 2.0 m/s during November and 4.5 m/s during June. The atmospheric pressure varies between 1004 mbar in the south west monsoon and 1014 mbar in the winter.
Location 2 receives global solar radiation in the range of 4.7 to 6.2 kWh/m2 during winter, 6.0 to 6.5 kWh/m2 during premonsoon, 4.8 to 5.5 kWh/m2 during south west monsoon and 4.2 to 5.6 kWh/m2 during post monsoon. Temperatures during pre-monsoon generally reach a maximum of 40° C and a minimum of 25° C, although temperatures upto 42° C are not uncommon. Winter temperatures range between 18° and 31° C. Fog and dew are rare, occurring occasionally only during the winter season. Being equidistant from mountains and the sea, it experiences similar monsoon pattern with Northeast monsoon and Southwest monsoon, with the former providing more rain during October to December. The average annual rainfall of Madurai city is about 64.6 mm with the highest value of 377.9 mm recorded in the month of November. The relative humidity of the city ranges from 53% during south west monsoon to 85% during post monsoon. The atmospheric pressure varies between 1006 mbar during south west monsoon and 1013 mbar during late post monsoon and winter.
Location 3 receives global solar radiation in the range of 3.9 to 6.0 kWh/m2 during winter, 4.8 to 6.5 kWh/m2 during pre-monsoon, 3.0 to 4.1 kWh/m2 during south west monsoon and 2.1 to 4.3 kWh/m2 during post monsoon. The temperature during pre-monsoon ranges from a maximum of 37° C to a minimum of 22° C. Erode receives an annual average rainfall of 48.8 mm with the highest value of 323.8 mm observed in the month of November. The northeast monsoon sets in vigorously only during October–November and by December the rains disappear, rendering the climate clear and cold. The temperature observed during winter ranges from a maximum of 32 C and a minimum of 17° C. The relative humidity of the city ranges from 53% during winter to 82% during post monsoon. The atmospheric pressure varies between 1007 mbar during south west monsoon and 1014 mbar during winter.
Location 4 receives global solar radiation in the range of 3.8 to 6.4 kWh/m2 during winter, 4.5 to 6.6 kWh/m2 during pre-monsoon, 5.1 to 5.4 kWh/m2 during south west monsoon and 2.3 to 4.7 kWh/m2 during post monsoon. Tiruchirappalli experiences a tropical savanna climate designated ‘Aw’ under the Koppen climate classification, with no major change in temperature between summer and winter. The climate is generally characterized by high temperature and low humidity. With an annual mean temperature of 29.7° C and monthly average temperatures ranging between 26.5° C and 32° C, the city is one of the hottest in the state. The annual average precipitation observed is 29.6 mm with the highest
precipitation of 118.4 mm recorded during October. The maximum and minimum temperatures recorded during the winter season are 34 C and 18° C respectively. Fog and dew are rare and occur only occasionally during the winter season. The relative humidity of the city ranges from 53% during south west monsoon to 85% during post monsoon season. The atmospheric pressure varies between 1006 mbar during south west monsoon and 1014 mbar during winter.
Location 5 receives global solar radiation in the range of 3.3 to 5.1 kWh/m2 during winter, 4.2 to 6.3 kWh/m2 during pre-monsoon, 4.7 to 5.4 kWh/m2 during south west monsoon and 1.9 to 4.1 kWh/m2 during post monsoon. This city has a tropical climate. In winter, there is much less rainfall than in summer. The Koppen-Geiger climate classification is ‘Aw’. The average annual temperature is 29.6°C. With an annual average of 43 mm, most precipitation is received in November with the highest value of 321.4 mm. The temperatures are highest on average in April, at around 41° C. The maximum and minimum temperatures during winter are 32 C and 18 C respectively. The relative humidity of the city ranges from 53% during south west monsoon to 85% during post monsoon. The atmospheric pressure varies between 1006 mbar during south west monsoon and 1013 mbar during winter.
Location 6 receives global solar radiation in the range of 3.4 to 5.9 kWh/m2 during winter, 5.1 to 6.2 kWh/m2 during pre-monsoon, 4.6 to 6.0 kWh/m2 during south west monsoon and 1.9 to 5.2 kWh/m2 during post monsoon. The climate of Tirunelveli is generally hot and humid. The average temperature during pre-monsoon (March to May) ranges from 24° C to 35° C, and during the rest of the year the temperature varies from 21° C to 33° C. The average annual rainfall is 35.4 mm. Maximum precipitation occurs during the post monsoon (October–December) with the highest value of 232.8 mm recorded during the month of November. The relative humidity of the city ranges from 69% during winter to 89% during post monsoon. The atmospheric pressure varies between 1009 mbar during late summer and early south west monsoon season and 1012 mbar during late winter and early pre monsoon season.
The estimated global solar radiation along with climatic data is presented in Figs. 1-6.
Fig. 1 Global solar radiation profile of the six locations
Fig. 2 Temperature profile of the six locations
Fig. 3 Wind speed profile of the six locations
15
G. Lakshmi et al. / Journal of Advanced Physical Sciences 1(1) (2017) 13–17
Cite this Article as: G. Lakshmi, C. Gopinathan, S.P.M. Deborrah, Tennyson Daniel, Estimation and prediction of global solar radiation at selected cities in Tamilnadu, India, J. Adv. Phy. Sci. 1(1) (2017) 13–17.
Fig. 4 Humidity profile of the six locations
Fig. 5 Atmospheric pressure profile of the six locations
Fig. 6 Precipitation profile of the six locations
3.2 Prediction of Global Solar Radiation
Models that predict solar radiation are necessary because in most cases the density and number of solar radiation measuring stations cannot describe the necessary variability [12]. Therefore new models and improvements to existing modelling techniques are continually proposed which intend to improve estimates of solar radiation values with the use of more readily available meteorological variables [13-15]. For the present study, the Meteonorm model and the Bird clear sky model have been validated for the selected six locations in Tamil Nadu.
3.2.1 Meteonorm Model
Meteonorm is a comprehensive climatological database for solar energy applications. It is a meteorological database containing climatological data for solar engineering applications at every location on the globe. The results are stochastically generated typical years from interpolated long term monthly means. They represent an average year of the selected climatological time period based on the user’s settings. As such the results do not represent a real historic year but a hypothetical year which statistically represents a typical year at the selected location. Meteonorm’s orderly facade conceals not only numerous databases from all parts of the world but also a large number of computational models developed in international research programs.
Meteonorm is primarily a method for the calculation of solar radiation on arbitrarily orientated surfaces at any desired location. The method is based on databases and algorithms coupled according to a predetermined scheme. It commences with the user specifying a particular location for which meteorological data are required, and terminates with the delivery of data of the desired structure and in the required format. Depending on user requirements, the calculation procedure employs between one and four computation models. In addition to the monthly values, Meteonorm provides maximum radiation values under clear sky conditions.
3.2.2 Bird Clear Sky Model
The Bird Clear Sky Model, authored by Richard Bird, is a broadband algorithm which produces estimates of clear sky direct beam,
hemispherical diffuse and total hemispherical solar radiation on a horizontal surface [16]. The model is based on comparisons with results from rigorous radiative transfer codes. It is composed of simple algebraic expressions with 10 user provided inputs. Model results can be expected to agree within ±10% with rigorous radiative transfer codes [17]. The model computes hourly average solar radiation for every hour of the year, based on the input parameters. However variable atmospheric parameters such as aerosol optical depth, ozone and water vapour are fixed for the entire year [18]. The model has been constructed based on comparisons with the SOLTRAN 3 and SOLTRAN 4 direct insolation models and the BRITE Monte Carlo global model. Formalisms in the previous models that were considered to be optimum are adopted in this model [19].
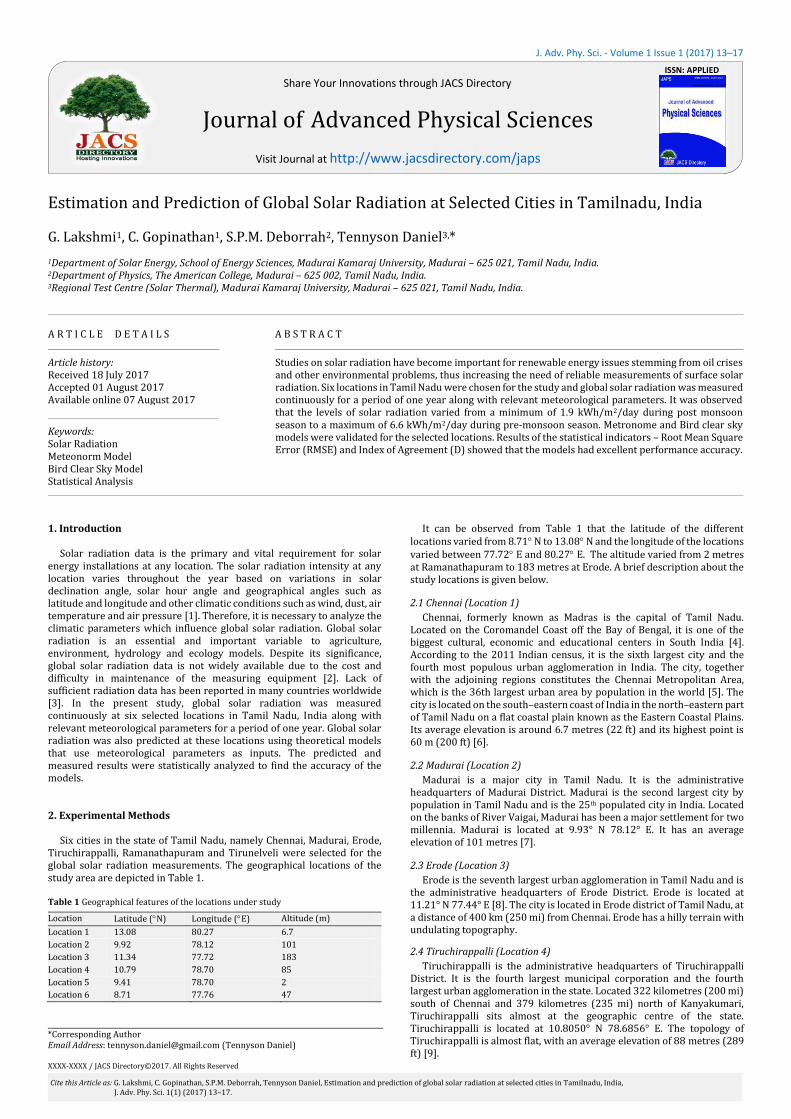
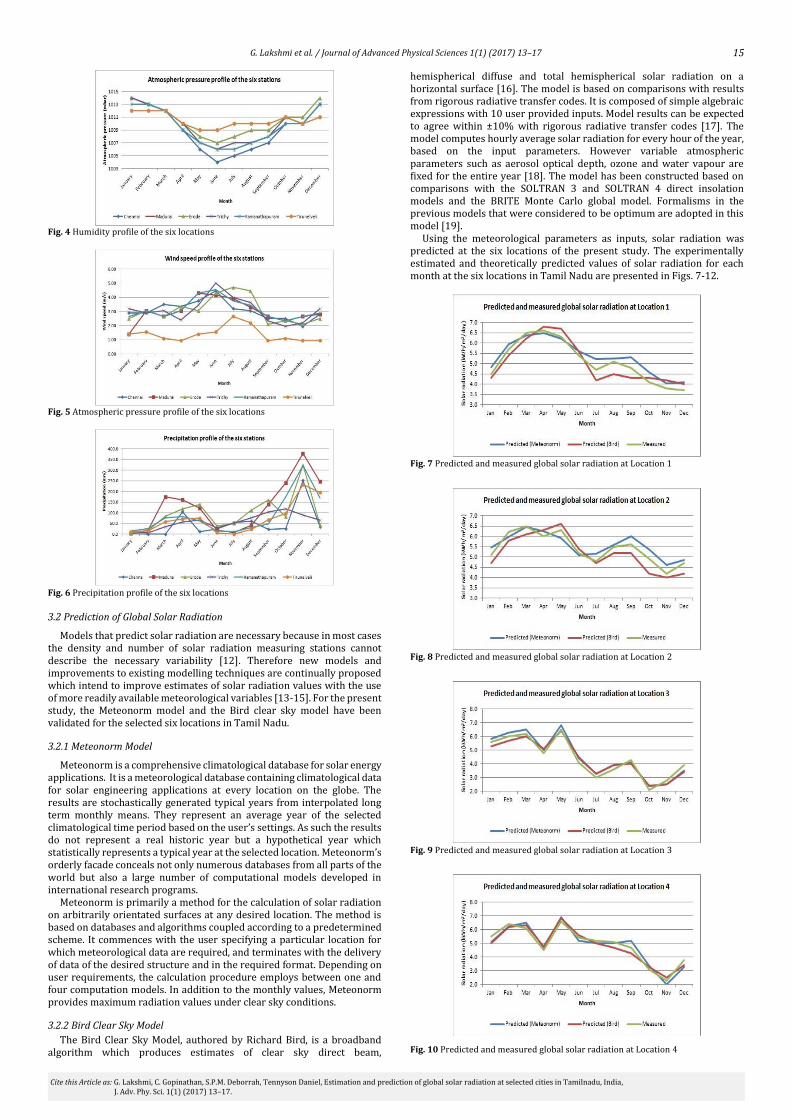
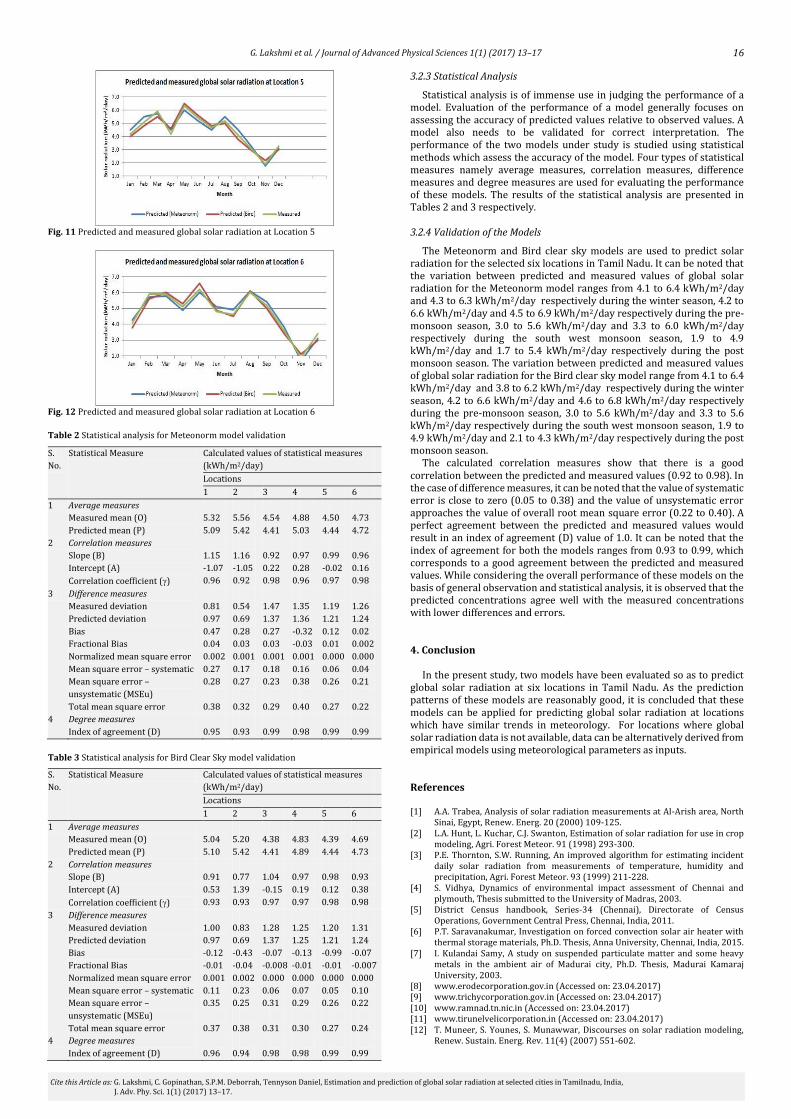
Using the meteorological parameters as inputs, solar radiation was predicted at the six locations of the present study. The experimentally estimated and theoretically predicted values of solar radiation for each month at the six locations in Tamil Nadu are presented in Figs. 7-12.
Fig. 7 Predicted and measured global solar radiation at Location 1
Fig. 8 Predicted and measured global solar radiation at Location 2
Fig. 9 Predicted and measured global solar radiation at Location 3
Fig. 10 Predicted and measured global solar radiation at Location 4
16
G. Lakshmi et al. / Journal of Advanced Physical Sciences 1(1) (2017) 13–17
Cite this Article as: G. Lakshmi, C. Gopinathan, S.P.M. Deborrah, Tennyson Daniel, Estimation and prediction of global solar radiation at selected cities in Tamilnadu, India, J. Adv. Phy. Sci. 1(1) (2017) 13–17.
Fig. 11 Predicted and measured global solar radiation at Location 5
Fig. 12 Predicted and measured global solar radiation at Location 6
Table 2 Statistical analysis for Meteonorm model validation
S.
No.
Statistical Measure Calculated values of statistical measures
(kWh/m2/day)
Locations
1 2 3 4 5 6
1 Average measures
Measured mean (O)
Predicted mean (P)
5.32
5.09
5.56
5.42
4.54
4.41
4.88
5.03
4.50
4.44
4.73
4.72
2 Correlation measures
Slope (B)
Intercept (A)
Correlation coefficient ()
1.15
-1.07
0.96
1.16
-1.05
0.92
0.92
0.22
0.98
0.97
0.28
0.96
0.99
-0.02
0.97
0.96
0.16
0.98
3 Difference measures
Measured deviation
Predicted deviation
Bias
Fractional Bias
Normalized mean square error
Mean square error – systematic
Mean square error –
unsystematic (MSEu)
Total mean square error
0.81
0.97
0.47
0.04
0.002
0.27
0.28
0.38
0.54
0.69
0.28
0.03
0.001
0.17
0.27
0.32
1.47
1.37
0.27
0.03
0.001
0.18
0.23
0.29
1.35
1.36
-0.32
-0.03
0.001
0.16
0.38
0.40
1.19
1.21
0.12
0.01
0.000
0.06
0.26
0.27
1.26
1.24
0.02
0.002
0.000
0.04
0.21
0.22
4 Degree measures
Index of agreement (D)
0.95
0.93
0.99
0.98
0.99
0.99
Table 3 Statistical analysis for Bird Clear Sky model validation
S.
No.
Statistical Measure Calculated values of statistical measures
(kWh/m2/day)
Locations
1 2 3 4 5 6
1 Average measures
Measured mean (O)
Predicted mean (P)
5.04
5.10
5.20
5.42
4.38
4.41
4.83
4.89
4.39
4.44
4.69
4.73
2 Correlation measures
Slope (B)
Intercept (A)
Correlation coefficient ()
0.91
0.53
0.93
0.77
1.39
0.93
1.04
-0.15
0.97
0.97
0.19
0.97
0.98
0.12
0.98
0.93
0.38
0.98
3 Difference measures
Measured deviation
Predicted deviation
Bias
Fractional Bias
Normalized mean square error
Mean square error – systematic
Mean square error –
unsystematic (MSEu)
Total mean square error
1.00
0.97
-0.12
-0.01
0.001
0.11
0.35
0.37
0.83
0.69
-0.43
-0.04
0.002
0.23
0.25
0.38
1.28
1.37
-0.07
-0.008
0.000
0.06
0.31
0.31
1.25
1.25
-0.13
-0.01
0.000
0.07
0.29
0.30
1.20
1.21
-0.99
-0.01
0.000
0.05
0.26
0.27
1.31
1.24
-0.07
-0.007
0.000
0.10
0.22
0.24
4 Degree measures
Index of agreement (D)
0.96
0.94
0.98
0.98
0.99
0.99
3.2.3 Statistical Analysis
Statistical analysis is of immense use in judging the performance of a model. Evaluation of the performance of a model generally focuses on assessing the accuracy of predicted values relative to observed values. A model also needs to be validated for correct interpretation. The performance of the two models under study is studied using statistical methods which assess the accuracy of the model. Four types of statistical measures namely average measures, correlation measures, difference measures and degree measures are used for evaluating the performance of these models. The results of the statistical analysis are presented in Tables 2 and 3 respectively.
3.2.4 Validation of the Models
The Meteonorm and Bird clear sky models are used to predict solar radiation for the selected six locations in Tamil Nadu. It can be noted that the variation between predicted and measured values of global solar radiation for the Meteonorm model ranges from 4.1 to 6.4 kWh/m2/day and 4.3 to 6.3 kWh/m2/day respectively during the winter season, 4.2 to 6.6 kWh/m2/day and 4.5 to 6.9 kWh/m2/day respectively during the pre-monsoon season, 3.0 to 5.6 kWh/m2/day and 3.3 to 6.0 kWh/m2/day respectively during the south west monsoon season, 1.9 to 4.9 kWh/m2/day and 1.7 to 5.4 kWh/m2/day respectively during the post monsoon season. The variation between predicted and measured values of global solar radiation for the Bird clear sky model range from 4.1 to 6.4 kWh/m2/day and 3.8 to 6.2 kWh/m2/day respectively during the winter season, 4.2 to 6.6 kWh/m2/day and 4.6 to 6.8 kWh/m2/day respectively during the pre-monsoon season, 3.0 to 5.6 kWh/m2/day and 3.3 to 5.6 kWh/m2/day respectively during the south west monsoon season, 1.9 to 4.9 kWh/m2/day and 2.1 to 4.3 kWh/m2/day respectively during the post monsoon season.
The calculated correlation measures show that there is a good correlation between the predicted and measured values (0.92 to 0.98). In the case of difference measures, it can be noted that the value of systematic error is close to zero (0.05 to 0.38) and the value of unsystematic error approaches the value of overall root mean square error (0.22 to 0.40). A perfect agreement between the predicted and measured values would result in an index of agreement (D) value of 1.0. It can be noted that the index of agreement for both the models ranges from 0.93 to 0.99, which corresponds to a good agreement between the predicted and measured values. While considering the overall performance of these models on the basis of general observation and statistical analysis, it is observed that the predicted concentrations agree well with the measured concentrations with lower differences and errors.
4. Conclusion
In the present study, two models have been evaluated so as to predict global solar radiation at six locations in Tamil Nadu. As the prediction patterns of these models are reasonably good, it is concluded that these models can be applied for predicting global solar radiation at locations which have similar trends in meteorology. For locations where global solar radiation data is not available, data can be alternatively derived from empirical models using meteorological parameters as inputs.
References
[1] A.A. Trabea, Analysis of solar radiation measurements at Al-Arish area, North Sinai, Egypt, Renew. Energ. 20 (2000) 109-125.
[2] L.A. Hunt, L. Kuchar, C.J. Swanton, Estimation of solar radiation for use in crop modeling, Agri. Forest Meteor. 91 (1998) 293-300.
[3] P.E. Thornton, S.W. Running, An improved algorithm for estimating incident daily solar radiation from measurements of temperature, humidity and precipitation, Agri. Forest Meteor. 93 (1999) 211-228.
[4] S. Vidhya, Dynamics of environmental impact assessment of Chennai and plymouth, Thesis submitted to the University of Madras, 2003.
[5] District Census handbook, Series-34 (Chennai), Directorate of Census Operations, Government Central Press, Chennai, India, 2011.
[6] P.T. Saravanakumar, Investigation on forced convection solar air heater with thermal storage materials, Ph.D. Thesis, Anna University, Chennai, India, 2015.
[7] I. Kulandai Samy, A study on suspended particulate matter and some heavy metals in the ambient air of Madurai city, Ph.D. Thesis, Madurai Kamaraj University, 2003.
[8] www.erodecorporation.gov.in (Accessed on: 23.04.2017) [9] www.trichycorporation.gov.in (Accessed on: 23.04.2017) [10] www.ramnad.tn.nic.in (Accessed on: 23.04.2017) [11] www.tirunelvelicorporation.in (Accessed on: 23.04.2017) [12] T. Muneer, S. Younes, S. Munawwar, Discourses on solar radiation modeling,
Renew. Sustain. Energ. Rev. 11(4) (2007) 551-602.

17
G. Lakshmi et al. / Journal of Advanced Physical Sciences 1(1) (2017) 13–17
Cite this Article as: G. Lakshmi, C. Gopinathan, S.P.M. Deborrah, Tennyson Daniel, Estimation and prediction of global solar radiation at selected cities in Tamilnadu, India, J. Adv. Phy. Sci. 1(1) (2017) 13–17.
[13] S. Younes, T. Muneer, Improvements in solar radiation models based on cloud data, Build. Services Engg. Res. Technol. 27(1) (2007) 41-54.
[14] M. Donatelli, G. Bellocchi, F. Fontana, RadEst3.00: Software to estimate daily radiation data from commonly available meteorological variables, Europ. J. Agronomy 18(3-4) (2003) 363-367.
[15] S. Safi, A. Zeroual, M. Hassani, Prediction of global daily solar radiation using higher order statistics, Renew. Ener. 27(4) (2002) 647-666.
[16] R.L. Annear, S.A. Wells, A comparison of five models for estimating clear-sky solar radiation, Water Resour. Res. 43(10) (2007) 1-8.
[17] S.A.M. Maleki, H. Hizam, Chandima Gomes, Estimation of hourly, daily and monthly global solar radiation on inclined surfaces: models re-visited, Energy 10(134) (2017) 1-28.
[18] C. Gueymard, Critical analysis and performance assessment of clear sky solar irradiance models using theoretical and measured data, Sol. Energy 51(2) (1993) 121-138.
[19] S. Pattarapanitchai, S. Janjai, A semi-empirical model for estimating diffuse solar irradiance under a clear sky condition for a tropical environment, Procedia Engg. 32 (2012) 421-426.