issn: 1992-8645 iot wireless home automation …
TRANSCRIPT

Journal of Theoretical and Applied Information Technology 31st July 2018. Vol.96. No 14
© 2005 – ongoing JATIT & LLS
ISSN: 1992-8645 www.jatit.org E-ISSN: 1817-3195
4597
IOT WIRELESS HOME AUTOMATION TECHNOLOGIES AND THEIR RELATION TO SPECIFIC ABSORPTION RATE
NIDAL M. TURAB
Al-Ahliyya Amman University Amman-Jordan
[e-mail : [email protected]]
ABSTRACT Home automation is one of the most promising Internet of Things domains; it involves the control and automation of the human surrounding environment such as ventilation and heating. The automated home has evolved to include the use of a large number of wireless devices that transmit radio frequency power and that can negatively affect the human body when such devices exceed the standard maximum allowable Whole-Body Absorption Rate (SAR). This paper provides an overview of the most important home automation technologies as well as calculates and compares the total transmitted power of these technologies.
KEYWORDS: SAR, Wavenis, Z-wave, ZigBee, Bluetooth, EnOcean, Insteon , and KNX-RF.
1. INTRODUCTION
Home automation is a promising IoT domain that involves the control and automation of home appliances such as ovens, freezers/refrigerators, and washers/dryers as well as environmental control of elements such as lightening, Heating/Cooling/Ventilating (VAC) [1]. It can also detect gas and water leaks as well as levels of smoke and carbon monoxide [2]. Smart homes with occupancy detection are able to detect occupants’ presence and efficiently control the energy/HVAC usage accordingly [3-5]. Additionally, remote home surveillance involves use of remote controlled cameras, break-in (burglar) alarms [6] and the ability to lock all doors and windows remotely to secure the home.
The history of home automation began in 1975, where X10 was developed as the as the first wireless communication protocol for home automation devices [1] which used electrical power lines to send bursts of digital signals to control home appliances. By 1978, X10 vendors developed more computer-controlled technologies such as lightening switches and thermostat controllers. In 1984, smart home technologies included garage door controllers, entertainment devices, remote controllers, and security systems [2]. In 1998, home automation gained more popularity and different technologies emerged and became viably integrated with new household technologies, home instruments, and networking [7]. By the end of 2012, the number of smart houses in the United States exceeded 1.5 million [8].
The main components of home automation are wireless technologies, including Wavenis, Z-
Wave, ZigBee, Bluetooth, DECT-ULE, EnOcean, Insteon , KNX, Thread, and WI-FI. These technologies share common RF frequency bands, have long battery life, long distance connection, low bit rate, and transmit RF energy signals in all directions. The issue of radiated power omitted by wireless devices due to its effect on human health has been a concern for a long time. To address these concerns, several authorities such as the European Committee for Electro Technical Standardization (CENELEC), Federal Communications Commission (FCC), Institution of Electrical and Electronic Engineers (IEEE) International Committee on Electromagnetic Safety (SCC39), and the World Health Organization (WHO) developed a guideline called the Specific Absorption Rate (SAR). SAR is used for exposure restrictions at frequencies lower than 6 GHz as specified in the IEEE International Commission on Electromagnetic Safety (ICES) standard (IEEE-C95.1,2005; EEE-C95.1234,2014) guidelines for safety levels of human exposure to RF energy in the frequency range 3 kHz to 300 GHz [9] and International Commission on Non-Ionizing Radiation Protection (ICNIRP) for frequencies around 10 GHz [10].
SAR is defined as the radio power absorbed by human tissue when a wireless device is held close to human body. SAR is usually measured over the whole body, or over small volume of tissue (typically 1 g or 10 g) [11].
For the frequency bands 10 KHz to 10 GHz, the maximum allowed value for Whole SAR is 0.4 W/Kg in occupational/controlled environments and 0.08 W/Kg for population/uncontrolled environments. Occupational/Controlled environments are defined such that persons exposed

Journal of Theoretical and Applied Information Technology 31st July 2018. Vol.96. No 14
© 2005 – ongoing JATIT & LLS
ISSN: 1992-8645 www.jatit.org E-ISSN: 1817-3195
4598
to the RF present in the environment have full awareness of the health effects of continued RF exposure and can control the exposure time and duration of such exposure. Population/uncontrolled environments are defined as situations where persons do not have full awareness of the health effects of continued RF exposure or cannot control the duration of the exposure [10, 12, 13].
The information about home automation technologies reported in this paper was obtained from search engines, online databases, Google Scholar, FCC, IEEE website, and the websites of each technology. Keywords and expressions used for the search included Specific Absorption Rate (SAR), Wavenis, Z-wave, ZigBee, Bluetooth, Digital Enhanced Cordless Telecommunications-Ultra Low Energy (DECT-ULE), EnOcean, Insteon, KNX, Thread, and WI-FI. The technical details of each technology were obtained. Finally, the whole-body SAR of each technology was computed.
The paper is organized as follows: section 1 is an introduction to IoT wireless home automation technologies; related work is summarized in section 2. The existing home automation technologies were summarized in section 3. While section4 is for the results obtained in this study. Finally, the paper is concluded in section 5.
2. RELATED WORK
Several studies of RF exposure health effects were performed to investigate if radio waves harm the human body. [14] studied the parameters that affect SAR—such as distance, frequency, electric field—and concluded that the main parameters which affect SAR are distance and power density; the SAR and the distance are inversely proportional, while SAR and the power density are linearly proportional. [15] studied the standard International Electro technical Commission standard for determining the SAR to human body in the frequency range 30 MHz to 6 GHz ( EC/EN 62209-2:2010) and concluded that IEC/EN 62209-2:2010 standard is generic, harmonized, and can adapt methods and procedures to new technologies. [16] proposed a formula for predicting whole-body average SAR from the height and weight of human models based on Japanese models, and observed a statistically significant correlation between body surface area and absorption cross section of human body. [17] concluded that RF exposure of biological systems can be specified in terms of RF wave frequency, power density strength of electric and magnetic fields, near/far field exposure, and the duration of exposure. [18] studied wireless
microphone performances at high frequencies compared to low frequencies. They quantified the performances degradation accordingly and concluded that at low frequencies the human body absorbs energy, while at higher frequencies the human body reflects it. [19] studied the interaction between incident electrical and magnetic fields with the human body and concluded that long periods of continuous exposure to radiation leads to energy absorption by the human body and can lead to negative biological effects on human health. [20] discussed the effect of electromagnetic waves of smart phones and handheld device on human health, and found no evidence of negative health effects for short duration usage of smart phones, but suggested that there is some potential risks on human health due to addiction to and dependence on cell phones. [21] studied the relationship between incident power density and the area where the power is averaged and found different values for the area depending on frequency.
The smart home contains numerous wireless devices (e.g. sensors, transceivers, routers) that work together in environments where humans live daily and that expose them to varying levels of incident power, which is accumulative—the summation of power omitted by all existing wireless devices [22, 23]. This research paper begins by summarizing and comparing the technical specifications of several wireless home automation technologies. Then, the Whole-Body SAR of all wireless home automation technologies is calculated and compared with the reference values for Occupational/Population environments. These calculations depend on the no. of concurrent devices and the distance from the device. The aim of the study is to illustrate the factors that might have significant influence overall body SAR in terms of the number of concurrent wireless devices and the distance form those devices.
3. WIRELESS HOME AUTOMATION
TECHNOLOGIES
In present times, many home automation technologies either are wired or wireless. This paper focuses on wireless technologies as they omit RF energy which can affect humans [9]. This section includes a comparison of popular wireless home automation technologies: Wavenis, Z-wave, ZigBee, Bluetooth, DECT-ULE, EnOcean, Insteon, KNX, Thread, and WI-FI.

Journal of Theoretical and Applied Information Technology 31st July 2018. Vol.96. No 14
© 2005 – ongoing JATIT & LLS
ISSN: 1992-8645 www.jatit.org E-ISSN: 1817-3195
4599
3.1 Wavenis – Coronis Systems developed Wavenis technology to provide ultra-low power (ULP) battery consumption and long-range wireless devices. Wavenis supports a wide variety of wireless devices that form Wireless Personal Area Networks (WPAN), Wireless Local Area Network WLAN and Wireless Wide Area Network WWANs with both tree and star topologies. It also extends the standard Bluetooth to build ad hoc networks (Peer-to-Peer), extended range with ULP devices [24].
WavenIs operates in Unlicensed ISM frequency bands of 868, 915, and 433 MHz, with data rates between 2.4 and 100 kbps (typical 19.20 kbps), the RF range is between 100, 200 m, with a transmitted power of 14 dBm. [25]. Examples of the applications of Wavenis in home automation include lighting control systems, carbon Monoxide reading systems, and water metering [26, 27]. 3.2 ZigBee – ZigBee is a family of low power and low data rate devices; based on IEEE 802.15.4, wireless standards, that build WPANs for home automation. ZigBee operates in Unlicensed ISM frequency bands of 868, 915, and 2400 MHz, with data rates between 20, 40 and 250 kbps, the RF range is between 10 and 20 m with transmitted power of 8 dBm. The ZigBee supports Star, Peer-to-Peer, Mesh, and Tree networks. Every ZigBee network has one coordinator device [28].
One of the ZigBee family members is ZigBee Home Automation (ZigBee HA) that is used for a variety of home automation applications such as window/doors locks, thermostat control, lighting, and various sensors. There are three modes of operation for this device: ZigBee Coordinator (ZC), ZigBee Router (ZR), and the ZigBee End Device (ZED) [29]. The ZigBee Light Link is member of the ZigBee family follows a global standard that ensures intermobility between lighting and control products. Some of the applications of ZigBee in home automation are smart lightning, climate control, safety and security, smoke and burglar control alarm, dimmers. and occupancy sensors [24, 30].
3.3 Near Filed Communication (NFC) – NFC, developed by NXP, Infineon and Sony, is set of protocols to enable two wireless devices to establish connection within short range. NFC utilizes ISO/IEC 14443 A&B and JIS-X 6319-4 contactless technology. NFC operates in the 13.56 MHz frequency band, with data rates between 106, 212, 424 kbps and 848 Kbps, the RF range is less than 10cm with transmitted power of 20-23 dBm. The operating modes of NFC are device, reader/writer, Peer-to-Peer, and card emulation. Typical NFC
applications in home automation are secure home access, computer login, lock/unlock car doors, and secure data transfer between different NFC enabled devices [31, 32]. 3.4 Insteon – The home automation technology Insteon was developed by American company Smart Labs Inc. All Insteon devices operate in Peer-to-Peer and mesh network modes. The peer devices can either send messages (controller), receive messages (responder), or relay message to other devices (repeater). Insteon operates in the 13.56 MHz frequency band, with data rates between 106, 212 and 424 kbps and 848 Kbps, and the RF range is less than 10cm with transmitted power of 20-238 dBm. The operating modes of NFC are device, reader/writer, Peer-to- Peer and card emulation [33]. Wireless Insteon devices operate in Unlicensed ISM frequency bands of 868 and 915 MHz, with data rates between 13.165, 2.880 and 38.4 kbps, and uses Frequency Shift Keying for modulation. The RF range is approximately 46 m, with transmitted power of 14 dBm. Insteon typical applications in home automation are remote home monitoring, various sensors, HVAC control, as well as a component of security and lighting systems [34]. 3.5 Z-Wave – Developed by ZenSys, Z-Wave is an international standard (ITU-T G.9959) for home automation applications. Z-Wave operates in Unlicensed ISM frequency bands of 868, 915, and 2400 MHz, with data rates between 9.6 and 40Kbps, and RF range is between 0 and 30 m with transmitted power of 0 dBm. Z-Wave has two basic types of device: controllers and slaves [35, 36]. Z-Wave applications in home automation include thermostat regulation, lighting, windows/door locks, as well as motion and smoke detectors [8, 37]. 3.6 Thread – The thread stack, developed by Thread group, is an open standard for Machine-to-Machine (M2M) communication protocols that run over IPv6 Low-Power Wireless Personal Area (6LoWPAN) to enable low-power home automation devices to connect wirelessly to the Internet. Thread devices works ether in Peer-to- Peer or mesh networks. Thread devices operate in Unlicensed ISM frequency bands of 868, 915, and 2400 MHz, with a data rate of 252 Kbps, and the RF range is approximately 10 m with transmitted power of 0 dBm[36, 37]. Typical Thread applications are safety, lighting, climate and access control, as well as for energy, home appliances, and energy management

Journal of Theoretical and Applied Information Technology 31st July 2018. Vol.96. No 14
© 2005 – ongoing JATIT & LLS
ISSN: 1992-8645 www.jatit.org E-ISSN: 1817-3195
4600
products. The three Thread device types are Border Routers, Router-Eligible End Devices, and Sleepy End Devices [38, 39]. 3.7 Bluetooth – Bluetooth, invented by Ericson and managed by Bluetooth Special Interest Group (SIG), is a wireless technology standard for exchanging data between short range mobile devices to build WPANs. There exist many profiles of Bluetooth: 1.0, 1.1, 1.2, 2, 2.1, 3, 4, 4.1, 4.2 and 5.0. Bluetooth versions 4.2 and 5 are members of the Bluetooth Low Energy family (Bluetooth Smart) and are designed for low power, low data rates, and support 6LoWPAN. This research will focus on these versions, as they are targeted for IoT home automation [40, 41]. Bluetooth operates in Unlicensed ISM frequency 2.4 GHz band, with data rates between 25Mbps (Bluetooth V4.2) to 50 Mbps (Bluetooth V5). The RF range is between 60 m (Bluetooth V4.2) and 240 m (Bluetooth V5) with transmitted power of 20dBm [42, 43].] Bluetooth supports star, mesh, Peer-to-Peer, mesh, and tree networks. Every ZigBee network have one master node and up to seven slave nodes. There are several applications of Bluetooth in home automation: to control thermostats, lighting, door/windows locks, smoke detectors, and more [40, 41, 43].
3.8 KNX-RF – KNX-RF was developed by the KNX Association. It operates in Unlicensed ISM frequency band 868MHz with a data rate of 16.384 Kbps. Its RF range is 150 m with transmitted power of 14 dBm. KNX has three basic types of device: sensors, actuators, and system devices. KNX application areas include lighting control, climate control, and security [44, 45].
3.9 EnOcean – EnOcean was developed by Siemens Inc. This technology is based on energy harvesting: it efficiently utilizes any slight variation in the environment—either thermal, mechanical or illumination—and then implements proper converters to transform these variations into electrical power. Thus, EnOcean devices are self-powered (battery free) [46, 47]. EnOcean operates in Unlicensed ISM frequency bands of 868 and 915MHz, with a data rate of 125 Kbps, and the RF range is approximately 30 m with transmitted power of 5 dBm. Typical applications of EnOcean in home automation include lighting and occupancy sensors, HVAC control, and environment sensors for temperature, humidity, and carbon monoxide [46, 48].
3.10 Digital Enhanced Cordless Telecommunications-Ultra Low Energy (DECT-ULE) – DECT-ULE is the standard used for cordless phone communications. The addition of the Ultra-Low Energy (ULE) features (low power consumption, long rage) to DECT makes it a competitor with other wireless home automation technologies. DECT-ULE operates in Unlicensed ISM frequency band 1900 MHz, with a data rate of 1Mbp, the RF range is approximately 70 m with transmitted power of 25 dBm [49, 50]. DECT-ULE uses star network topology; there is one base device and a number of node devices. Typical DECT-ULE applications are actuators, smart energy meters, door locks, as well as motion and carbon monoxide detectors [51]. 3.11 Wireless Fidelity (WI-FI) –is a set of wireless local area network (WLAN) standards. IEEE created the first WLN standard (802.11b) that supports 11 Mbps data rate and works in the ISM 2.4 GHz unlicensed band. The second standard was 802.11a with 54 Mbps data rate and works in the 5GHz band. The third successor standard was the 802.11g that supports 54 Mbps data rate and works in the 2.4 GHz band [52, 53]. IEEE 802.11n is the forth WLAN standard, which has a 300 Mbps data rate and works in the 2.4/5 GHz dual band [54, 55]. The latest standard is 802.11 ac, that works in the in 2.4/5 GHz dual band; it supports 1300 Mbps data rate in the 5GHz band and 450 Mbps data rate on 2.4 GHz band [56, 57]. The WLAN RF range is approximately 100m with 20dBm output power. WLAN operates in either Peer-to-Peer (ad hoc networks) or infrastructure with one root (access point) and wireless nodes (clients) [58].
Table 1 provides a Summary of key technical specifications of wireless home automation technology. From Table 1, the rank of output power for the home automation technologies reviewed in the current paper are: DECT-ULE, WI-FI, Bluetooth, NFC, Inetson, WavenIs, KNX, ZigBee, EnOcean, Z-wave, and finally Thread. The transmitted output power is examined in this research paper because it relates directly to SAR. This relationship is described in the following sections.
4. THE OUTPUT RF POWER AND SAR
Home automation technologies employ large numbers of wireless devices simultaneously in the same domestic area. Thus, over time, occupants are exposed to varying levels of RF electromagnetic
Journal of Theoretical and Applied Information Technology 31st July 2018. Vol.96. No 14
© 2005 – ongoing JATIT & LLS
ISSN: 1992-8645 www.jatit.org E-ISSN: 1817-3195
4601
signals spread in all directions. These signals penetrate into the human body, which can cause negative health risks. The rate at which this electromagnetic energy is absorbed by the tissues of the human body is quantified by the Specific Absorption Rate value. SAR is defined as [19] as follows:
𝑆𝐴𝑅∗
(W/Kg) (1)
Where E: incident electric field (V/m), md: mass density of human body (kg/m3
), σ: the conductivity of human body (S/m). In addition, the power density (Pd) is given by [59]:
Pd
W/m2 2
Where G: gain of the transmitting antenna, Pt: transmitted power (Watts), r: distance between the transmitter and the human body (m). Furthermore, the electrical power density E is related to magnetic field H by Poynting's theorem [60]:
Pd= E*H (W/m2) (3)
E and H are related linearly [23] :
E/H =Z0 (4)
Z0 is the impedance of free space with value 120 π
H= E/ 120 π (5)
Pd = E2/120 π ----- E2 = 120 π Pd (6)
Substituting eq. (2), (6) into eq. (1) yields:
SAR
(7)
Consequently, if the power transmitted from one device is Pt and there is N devices, the total power is N* Pt, which results in:
SAR N ∗
(8)
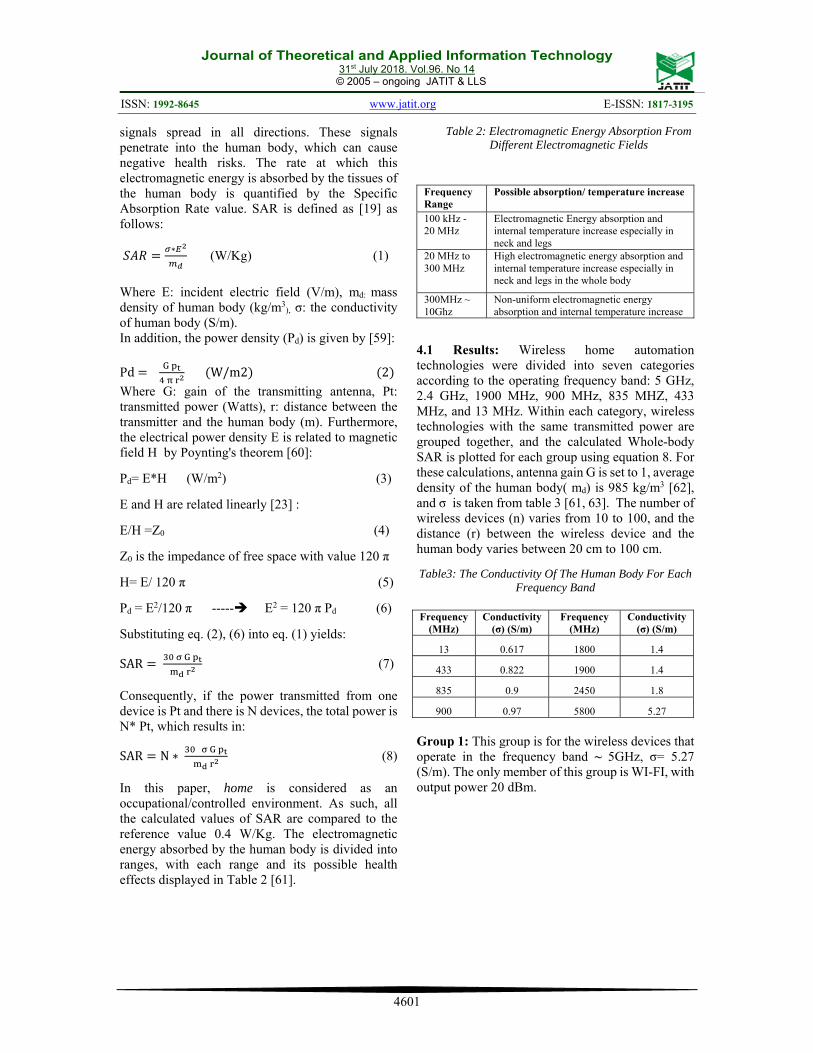
In this paper, home is considered as an occupational/controlled environment. As such, all the calculated values of SAR are compared to the reference value 0.4 W/Kg. The electromagnetic energy absorbed by the human body is divided into ranges, with each range and its possible health effects displayed in Table 2 [61].
Table 2: Electromagnetic Energy Absorption From Different Electromagnetic Fields
4.1 Results: Wireless home automation technologies were divided into seven categories according to the operating frequency band: 5 GHz, 2.4 GHz, 1900 MHz, 900 MHz, 835 MHZ, 433 MHz, and 13 MHz. Within each category, wireless technologies with the same transmitted power are grouped together, and the calculated Whole-body SAR is plotted for each group using equation 8. For these calculations, antenna gain G is set to 1, average density of the human body( md) is 985 kg/m3 [62], and σ is taken from table 3 [61, 63]. The number of wireless devices (n) varies from 10 to 100, and the distance (r) between the wireless device and the human body varies between 20 cm to 100 cm.
Table3: The Conductivity Of The Human Body For Each Frequency Band
Group 1: This group is for the wireless devices that operate in the frequency band ~ 5GHz, σ= 5.27 (S/m). The only member of this group is WI-FI, with output power 20 dBm.
Frequency Range
Possible absorption/ temperature increase
100 kHz - 20 MHz
Electromagnetic Energy absorption and internal temperature increase especially in neck and legs
20 MHz to 300 MHz
High electromagnetic energy absorption and internal temperature increase especially in neck and legs in the whole body
300MHz ~ 10Ghz
Non-uniform electromagnetic energy absorption and internal temperature increase
Conductivity (σ) (S/m)
Frequency (MHz)
Conductivity (σ) (S/m)
Frequency (MHz)
1.4 1800 0.617 13
1.4 1900 0.822 433
1.8 2450 0.9 835
5.27 5800 0.97 900

Journal of Theoretical and Applied Information Technology 31st July 2018. Vol.96. No 14
© 2005 – ongoing JATIT & LLS
ISSN: 1992-8645 www.jatit.org E-ISSN: 1817-3195
4602
Figure 1. SAR for WI-FI (5GHz)
From Figure 1 it is clear that this group has values higher than the maximum allowable SAR (plotted in red) if the distance is less than 60 cm or the no of wireless devices is greater than 20. Group 2: This group contains the wireless devices that operate in the frequency band ~ 2.4 GHz, σ = 1.8 (S/m). In this group, WI-FI and Bluetooth have output power of 20 dBm, displayed in Figure 2. ZigBee has output power of 8 dBm (Figure 3), while both Thread and Z-Wave have output power of 0 dBm (Figure 4).
Figure 2. SAR for WI-FI & Bluetooth The most extreme case of this group is WI-FI & Bluetooth (Figure 2); they exceed the maximum allowable value of SAR if the distance is less than 30 cm or if the number of wireless devices is greater than 10.
Figure 3. SAR for ZigBee
Figure 3 shows that the SAR values for ZigBee devices exceeds the maximum allowable value if the distance is less than 20 cm or if the number of wireless devices is more than 50.
Figure 4. SAR for Thread, Z-Wave
From figure 4 it is clear that Thread and Z-Wave devices have SAR values that are below allowable maximum. Group 3: This group comprises the wireless devices that operate in the frequency band ~ 1900 MHz, σ= 1.4 (S/m). The only member of this group is DECT-ULE which has output power of 25 dBm (Figure 5).

Journal of Theoretical and Applied Information Technology 31st July 2018. Vol.96. No 14
© 2005 – ongoing JATIT & LLS
ISSN: 1992-8645 www.jatit.org E-ISSN: 1817-3195
4603
Figure 5. SAR for DECT-ULE
Figure 5 shows that DECT-ULE exceeds the maximum allowable value of SAR if the distance is less than 50 cm or if the number of wireless devices is more than 10. Group 4: This group is for wireless devices that operate in the frequency band ~ 900 MHz, σ= 0.97 (S/m). Here, both WavenIs and Insteon devices have an output power of 14 dBm (Figure 6), ZigBee has output power of 8 dBm (Figure 7), EnOcean has output power of 5dBm (Figure 8)., while both Thread and Z-Wave have output power of 0 dBm (Figure 9) .
Figure 6. SAR for Waveenis, Insteon
Figure 6 is the most extreme case of this group is for WavenIs and Insteon that exceed the maximum allowable value of SAR if the distance is less than 30 cm or if the number of wireless devices is greater than 50.
Figure 7. SAR for ZigBee
Figure 7 shows that ZigBee SAR values exceed the maximum allowable value if the distance is less than 20 cm or if the number of wireless devices exceeds 90.
Figure 8. SAR for EnOcean
Figures 8 and 9 show that Thread, Z-Wave and EnOcean devices yield SAR values that are below the allowable maximum.

Journal of Theoretical and Applied Information Technology 31st July 2018. Vol.96. No 14
© 2005 – ongoing JATIT & LLS
ISSN: 1992-8645 www.jatit.org E-ISSN: 1817-3195
4604
Figure 9. SAR for Thread, Z-Wave
Group 5: This group is for wireless devices that operate in the frequency band ~ 868 MHz, σ= 0.9 (S/m). Here WavenIs, KNX, and Insteon devices have output power of 14 dBm, ZigBee has output power of 8 dBm, EnOcean has output power of 5dBm, while both Thread and Z-Wave have output power of 0 dBm. Figures 10 and 11 show that Thread, Z-Wave and EnOcean devices yield SAR values that are below the allowable maximum. Figure 12 shows that ZigBee SAR values exceed the maximum allowable value if the distance is less than 20 cm or if the number of wireless devices exceeds 90. The most extreme cases in this group are WavenIs, KNX, and Insteon (Figure 13), which exceed the maximum allowable value of SAR if the distance is less than 20 cm or the if number of wireless devices is greater than 30.
Figure 10. SAR for Thread, Z-Wave
Figure 11. SAR for EnOcean
Figure 12. SAR for ZigBee
Figure 13. SAR for Insteon , Knx, Wavenis

Journal of Theoretical and Applied Information Technology 31st July 2018. Vol.96. No 14
© 2005 – ongoing JATIT & LLS
ISSN: 1992-8645 www.jatit.org E-ISSN: 1817-3195
4605
Group 6: This group consists of wireless devices that operate in the frequency band ~ 433 MHz, σ= 0.822 (S/m) WavenIs is the only member of this group and has an output power of 14 dBm. Figure 14 shows that WavenIs exceeds the maximum allowable value of SAR if the distance is less than 30 cm or if the number of wireless devices is greater than 60.
Figure 14. SAR for WavenIS
Group 7: This group is for wireless devices that operate in the frequency band ~ 13.6 MHz, σ= 0.617 (S/m). NFC, the only member of this group, has output power of 23 dBm.
Figure 15. SAR for NFC
Figure 15 shows that NFC exceeds the maximum allowable value of SAR if the distance is less than 30 cm or if the number of wireless devices is greater than 10.
The overall results obtained above show that, the wireless technology the number of devices can be increased and the distance can decreased as the operating frequency decreased. For example, ZigBee at the 2.4 GHz frequency band exceed the maximum allowable value of SAR for number of devices n > 50, distance r < 30 cm; while at the frequency band 900 MHz n can be increased to 90 and the distance can be as close as 20 cm. The same situation is applied to WavenIs, at 900 MHZ n > 50, r < 30 cm and at the 800 MHz the number of devices can be increased to 60. Another example is WI-FI at 5 5GHz the number of devices n is > 10 and the distance is < 60 cm, while at 2.4 GHz for the same number of devices the distance can be as close as 30 cm. Thread, Z-Wave and EnOcean devices do not exceed the maximum allowable value of SAR regardless of the operating frequency, number of devices or the distance. Finally, as the output transmitted power increased, the SAR value is increased for all operating frequencies and technologies.
The emerging home automation technologies finding their path throughout our daily life, aiming to easing the control of our surrounding home appliances and environmental devices. Overall, the home automation technologies would automate every device around us. This paper summarized and compared the existing wireless home automation form technologies application domains point of view. The Specific Absorption Rate (SAR) was calculated for each technology focusing on the effect of the distance and the number of coexisting wireless devices. Finally, a summary of the Wireless home automation technology and their calculated SAR with relation with the distance and the no of devices was presented.
5. CONCLUSIONS The results obtained in this paper provide
evidence that there are potential negative effects of wireless home automation technologies for humans’ health as the number of wireless devices increases or as the distance from the human body decreases. Table 4 summarizes the calculated values of SAR for each group of wireless devices.
Table 4 indicates that Z-Wave, EnOcean, and Thread wireless technologies do not exceed the maximum allowable SAR level regardless of frequency band. ZigBee, WavenIs, and Insteon technologies could be considered safe as long as the number of wireless devices is less than 50 or if the

Journal of Theoretical and Applied Information Technology 31st July 2018. Vol.96. No 14
© 2005 – ongoing JATIT & LLS
ISSN: 1992-8645 www.jatit.org E-ISSN: 1817-3195
4606
distance of these devices from the human body is greater than 30 cm. The technologies that pose the greatest health risk with respect to SAR values are NFC, DET-ULE, WI-FI and Bluetooth; SAR values exceed 0.4 W/Kg if the number of devices is greater than 10 and the distance is less than 40 cm. Generally speaking, 20 cm is the closest distance after which SAR values indicate a potentially elevated risk for human health. In addition, table 4 shows that for the same technology, as the operating frequency increased the number of devices can be increased and the distance can be decreased.
Future work and extension of his paper is to study the relation between SAR as a function of time exposure. In addition, a possible expansion of this paper is to propose a mathematical model of the human body as an antenna and study the absorbed power and in turn the resultant SAR. Finally, a study of partial SAR (for specific human body organs) is another extension of this paper. Acknowledgment. The author acknowledges Al-Ahliyya Amman University for supporting this work. Also, grateful acknowledge is dedicated to the helpful comments and suggestions of the reviewers, which have improved the presentation
REFERENCES
[1] 1. Li, R.Y.M., et al., Sustainable smart home and home automation: Big data analytics approach. 2016.
[2] 2. Brush, A., et al. Home automation in the wild: challenges and opportunities. in proceedings of the SIGCHI Conference on Human Factors in Computing Systems. 2011. ACM.
[3] 3. Brown, E., 21 Open Source Projects for IoT. Linux. com. Retrieved, 2016. 23.
[4] 4. Jin, M., R. Jia, and C.J. Spanos, Virtual occupancy sensing: Using smart meters to indicate your presence. IEEE Transactions on Mobile Computing, 2017. 16(11): p. 3264-3277.
[5] 5. Jin, M., et al., Occupancy detection via environmental sensing. IEEE Transactions on Automation Science and Engineering, 2016.
[6] 6. Venkatakrishnan, N., et al., Energy smart system. 2013, Google Patents.
[7] 7. Nisar, S. and M. Asadullah. Home automation using spoken Pashto digits recognition. in Innovations in Electrical Engineering and Computational Technologies (ICIEECT), 2017 International Conference on. 2017. IEEE.
[8] 8. Pătru, I.-I., et al. Smart home IoT system. in RoEduNet Conference: Networking in Education and Research, 2016 15th. 2016. IEEE.
[9] 9. Committee, I.S.C., IEEE standard for safety levels with respect to human exposure to radio frequency electromagnetic fields, 3kHz to 300GHz. IEEE C95. 1-1991, 1992.
[10] 10. Protection, I.C.o.N.-I.R., Guidelines for limiting exposure to time-varying electric and magnetic fields (1 Hz to 100 kHz). Health physics, 2010. 99(6): p. 818-836.
[11] 11. Madjar, H.M., RF Human Hazards. 2015.
[12] 12. Fields, R.E., Evaluating compliance with FCC guidelines for human exposure to
[13] \radiofrequency electromagnetic fields. OET bulletin, 1997. 65: p. 10.
[14] 13. District, N. and G. Shenzhen, FCC SAR Test Report. 2017.
[15] 14. Naif, H., Study the effects of specific absorption rate in electromagnetic energy radiated from mobile phones on human body. Al-mustansiriya j. Sci, 2010. 21: p. 119-130.
[16] 15. Cozza, A., B. Derat, and J.-C. Bolomey. Theoretical analysis of the exponential approximation for SAR assessment in a flat-phantom. in Antennas and Propagation Society International Symposium, 2007 IEEE. 2007. IEEE.
[17] 16. Hirata, A., et al. Correlation between absorption cross section and body surface area of human for far-field exposure at GHz bands. in Electromagnetic Compatibility, 2007. EMC 2007. IEEE International Symposium on. 2007. IEEE.
[18] 17. Lin, J.C., Dosimetric comparison between different quantities for limiting exposure in the RF band: rationale and implications for guidelines. Health physics, 2007. 92(6): p. 547-553.
[19] 18. Kühn, S., et al., Assessment of the radio-frequency electromagnetic fields induced in the human body from mobile phones used with hands-free kits. Physics in Medicine & Biology, 2009. 54(18): p. 5493.
[20] 19. Kottou, S., et al., How Safe is the Environmental Electromagnetic Radiation? Journal of Physical Chemistry & Biophysics, 2014. 4(3): p. 1.
[21] 20. Agrawal, Y.K. and D. Hande, Effect of activation of deep neck flexor muscle exercise on neck pain due to smartphone addiction. 2017.

Journal of Theoretical and Applied Information Technology 31st July 2018. Vol.96. No 14
© 2005 – ongoing JATIT & LLS
ISSN: 1992-8645 www.jatit.org E-ISSN: 1817-3195
4607
[22] 21. Hashimoto, Y., et al., On the averaging area for incident power density for human exposure limits at frequencies over 6 GHz. Physics in Medicine & Biology, 2017. 62(8): p. 3124.
[23] 22. Ahlbom, A., et al., Guidelines for limiting exposure to time-varying electric, magnetic, and electromagnetic fields (up to 300 GHz). Health physics, 1998. 74(4): p. 494-521.
[24] 23. Seybold, J.S., Introduction to RF propagation. 2005: John Wiley & Sons.
[25] 24. Gomez, C. and J. Paradells, Wireless home automation networks: A survey of architectures and technologies. IEEE Communications Magazine, 2010. 48(6).
[26] 25. Nugent, C.D., et al., Editorial home automation as a means of independent living. IEEE Transactions on Automation Science and Engineering, 2008. 5(1): p. 1-9.
[27] 26. Huang, C.-F. and Y.-C. Tseng, The coverage problem in a wireless sensor network. Mobile Networks and Applications, 2005. 10(4): p. 519-528.
[28] 27. Ho, C.K., et al., Overview of sensors and needs for environmental monitoring. Sensors, 2005. 5(1): p. 4-37.
[29] 28. Frenzel, L., What's The Difference Between ZigBee And Z-Wave. Electronic design, 2012.
[30] 29. Alliance, Z., Zigbee specification FAQ. ZigBee Alliance,[Online]. Available: http://www. zigbee. org/Specifications/ZigBee/FAQ. aspx.[Acedido em 26 07 2012], 2014.
[31] 30. Wang, C., T. Jiang, and Q. Zhang, ZigBee® network protocols and applications. 2014: CRC Press.
[32] 31. Coskun, V., K. Ok, and B. Ozdenizci, Near field communication (NFC): from theory to practice. 2011: John Wiley & Sons.
[33] 32. Want, R., An introduction to RFID technology. IEEE pervasive computing, 2006. 5(1): p. 25-33.
[34] 33. Khan, M.S.K.A.A., Redefining Insteon home control networking protocol. 2015: California State University, Long Beach.
[35] 34. Darbee, P., INSTEON: compared. White Paper, 2006. 2.
[36] 35. Paetz, C., Z-Wave Basics. 2015: Dr. Christian Paetz.
[37] 36. Rovsing, P.E., et al., A reality check on home automation technologies. Journal of Green Engineering, 2011. 1(3): p. 303-327.
[38] 37. Reiter, G., Wireless connectivity for the Internet of Things. Europe, 2014. 433: p. 868MHz.
[39] 38. Group, I.W., IEEE standard for information technology–Telecommunications and information exchange between systems–Local and metropolitan area networks–Specific requirements–Part 11: Wireless LAN Medium Access Control (MAC) and Physical Layer (PHY) specifications Amendment 6: Wireless Access in Vehicular Environments. IEEE Std, 2010. 802(11).
[40] 39. Gopalsamy, B.N., Communication Trends in Internet of Things. Developments and Trends in Intelligent Technologies and Smart Systems, 2017: p. 284.
[41] 40. Bluetooth, S., Bluetooth 4.2 core specification. Bluetooth SIG, 2009.
[42] 41. Bluetooth, S., Bluetooth R O Core Specification 5.0, 2016. 2016.
[43] 42. Bluetooth, S., How Bluetooth Technology Works. 2006.
[44] 43. Siekkinen, M., et al. How low energy is bluetooth low energy? comparative measurements with zigbee/802.15. 4. in Wireless Communications and Networking Conference Workshops (WCNCW), 2012 IEEE. 2012. IEEE.
[45] 44. Weinzierl, T., KNX-RF Wireless alternative in KNX. KNX Journal, 2006: p. 1-2006.
[46] 45. Reinisch, C., et al. Wireless communication in knx/eib. in KNX Scientific Conference. 2006.
[47] 46. Alliance, E., Enocean technology–energy harvesting wireless. 2011.
[48] 47. Anders, A., Enocean technology energy harvesting wireless. EnOcean GmbH, Tech. Rep., 2011.
[49] 48. Hamel, M.J., et al., Energy harvesting for wireless sensor operation and data transmission. 2006, Google Patents.
[50] 49. Mariager, P., et al., Transmission of IPv6 Packets over Digital Enhanced Cordless Telecommunications (DECT) Ultra Low Energy (ULE). 2017.
[51] 50. Dickinson, S., N. Kalfus, and E. Shiri, Digital enhanced cordless telecommunication call management. 2017, Google Patents.
[52] 51. Shiri, E., et al., DECT Home Networking–The Next Step in Home Automation. 2011, California: DSP Group.
[53] 52. Vassis, D., et al., The IEEE 802.11 g standard for high data rate WLANs. IEEE network, 2005. 19(3): p. 21-26.
[54] 53. Committee, I.C.S.L.M.S., IEEE 802.11: Wireless LAN medium access control and physical layer specifications. 1999, August.

Journal of Theoretical and Applied Information Technology 31st July 2018. Vol.96. No 14
© 2005 – ongoing JATIT & LLS
ISSN: 1992-8645 www.jatit.org E-ISSN: 1817-3195
4608
[55] 54. Perahia, E. and R. Stacey, Next generation wireless LANs: 802.11 n and 802.11 ac. 2013: Cambridge university press.
[56] 55. Alliance, W.-F., Wi-Fi CERTIFIED n: Longer-Range, Faster-Throughput, Multimedia-Grade Wi-Fi® Networks. White Paper, 2009.
[57] 56. Gast, M.S., 802.11 ac: A Survival Guide: Wi-Fi at Gigabit and Beyond. 2013: " O'Reilly Media, Inc.".
[58] 57. Van Nee, R., Breaking the gigabit-per-second barrier with 802.11 ac. IEEE Wireless Communications, 2011. 18(2).
[59] 58. Hasan, S.F., N.H. Siddique, and S. Chakraborty. Femtocell versus WiFi-A survey and comparison of architecture and performance. in Wireless Communication, Vehicular Technology, Information Theory and Aerospace & Electronic Systems Technology, 2009. Wireless VITAE 2009. 1st International Conference on. 2009. IEEE.
[60] 59. Strength, F. and P. Estimator, Application Note 1MA85, Rohde & Schwarz GmbH &Co. KG 1MA85, 2016.
[61] 60. Poynting, J.H., XV. On the transfer of energy in the electromagnetic field. Philosophical Transactions of the Royal Society of London, 1884. 175: p. 343-361.
[62] 61. Cocherova, E., et al. Dependence of the RF field absorption on the human body dimensions. in Radioelektronika, 2009. RADIOELEKTRONIKA'09. 19th International Conference. 2009. IEEE.
[63] 62. Ling, S.J., et al., University Physics Volume 2. 2016.
[64] 63. Durney, C.H., H. Massoudi, and M.F. Iskander, Radiofrequency radiation dosimetry handbook. 1986, UTAH UNIV SALT LAKE CITY DEPT OF ELECTRICAL ENGINEERING.

Journal of Theoretical and Applied Information Technology 31st July 2018. Vol.96. No 14
© 2005 – ongoing JATIT & LLS
ISSN: 1992-8645 www.jatit.org E-ISSN: 1817-3195
4609
Table 1: Summary Of Key Technical Specifications Of Wireless Home Automation Technology
Technology Data rate Frequency Transmitted Power
Approximate Range
Wavenis 2.4 ,100, 10 kbps
900, 868, 433 MHz
14 dBm 100-200 m
ZigBee 20, 40, and 250 kbps 2400, 900, 868 MHz
8 dBm 10-20 m
NFC 106, 212, 424 and 848 Kbps
13.56 MHz 20-23 dBm < 10 cm
Insteon 13,165, 2,880. 38,400 Kbps)
915, 869.85 MHz 14 dBm 46 m
Z-Wave 9.6, 40 kbps 868.42, 908.42. 2400 MHz
0 dBm 30m
Thread 250 kbps 868.42, 908.42, 2400MHz
0 dBm 10-30
Bluetooth (V4.2), (v5)
25 Mbps 2400 20 dBm 200 m
KNX 16.384 Kbps 868.3 MHz
14 dBm 150 m
EnOcean 125 kbps 868.300, 902.875MHz
5dBm ~30 m
DECT-ULE 1 Mbps 1900 MHz 25 dBm, ~70 m WI-FI 54, 600 Mbps 2.4, 5GHz 20 dBm 35-100m
Table 4 Wireless Home Automation Technology And Their Calculated SAR
Frequency band Wireless technologies SAR > 0.4 W/Kg
5GHz Wi-Fi N >10 R < 60 cm
2.4 GHz
Thread and Z-Wave No ZigBee N >50
R < 20cm
Wi-Fi & Bluetooth N >50 R < 10cm
1900 MHz DECT-ULE N >10 R < 50 cm
900 MHz
Z-Wave, EnOcean & Thread No ZigBee N >90
R < 20 cm WavenIs & Insteon N >50
R < 30 cm 800 MHz
Z-Wave, EnOcean & Thread No ZigBee N >90
R < 20 cm WavenIs, KNX, & Insteon N >60
R < 20 cm 433 MHz WavenIs N >30
R < 60 cm 13.6 MHz NFC N >10
R < 30 cm