issn 1745-8587 ers in economics & finance · birkbeck workin g pa p ... viale...
TRANSCRIPT

ISSN 1745-8587 B
irkbe
ck W
orki
ng P
aper
s in
Eco
nom
ics
& F
inan
ce
School of Economics, Mathematics and Statistics
BWPEF 1102
A View on Global Imbalances and their Contribution to the Financial
Crisis
Georg Dettmann Birkbeck, University of London
and University of Verona
July 2011
▪ Birkbeck, University of London ▪ Malet Street ▪ London ▪ WC1E 7HX ▪

1
A View on Global Imbalances and their Contribution to the Financial Crisis
Georg Dettmann*
Department of Economics Birkbeck College, University of London
Department of Economic Science
University of Verona
Abstract
The Global Imbalances that contributed to the financial crisis (2007-2010) are still present, and the world still hasn’t fully recovered from recession. There is no consistent explanation of the Global Imbalances and their interaction with simultaneous events yet. The current state of the literature is that papers contradict each other and the main questions remain unsolved. This paper aims to provide a coherent story of the economic environment that laid the ground for the financial crisis, focusing on the evolution of Global Imbalances. It will reconcile the discrepancies of the different strands of existing literature and hypotheses. Hypotheses which can be rejected will be discarded. The paper will try to explain what mechanisms (inside and outside of the US) worked within these Imbalances, how they were motivated and if these mechanisms are sustainable. The single most important result will be that there is no obvious reason why China and the other emerging Asian economies finance the US. Further, the US finance themselves by means that are not fully understood yet and can only partially be explained. One important factor appears to be the use of the Exorbitant Privilege via Seigniorage. Other factors remain unknown.
JEL codes: E50, E66, F15, F32, F34 Keywords: Global Imbalances, Financial Crisis, Bretton Woods II, Saving Glut, Seigniorage, Foreign Asset Positions, Exorbitant Privilege
* Birkbeck College, University of London, Malet Street, London WC1E 7HX, United Kingdom, e-mail: [email protected] University of Verona, Viale dell’Universita’ 3, 37131, Verona, e-mail: [email protected]

2
1. Introduction Over the last decade political attention was drawn more and more to the growing imbalances between surplus countries on the one side and deficit countries on the other side. Surplus countries are mainly comprised of China, the Oil exporting countries, Japan and Germany, whilst deficit countries contain the US, the UK and southern Europe. Since China became the largest surplus country in bilateral US trade over the last few years, I will focus on the relationship between the high Chinese savings and the low American ones, being the most important sources of Global Imbalances. By 2009, the Chinese central bank held more than 2000 billion of USD reserves, composed of US-treasuries mainly. The main questions on the Global Imbalances are still unanswered. What were the driving forces behind these imbalances and to what extend did they contribute to the financial crisis that hit the world economy in 2007-2010. Even though they peaked in late 2008, the Global Imbalances still haven’t gone away. Some argue that the decline in the US savings rate and the Current Account deficits were mainly due to external factors, such as the Global Savings Glut (Bernanke, 2005) or the Bretton Woods II system, whilst others consider internal factors like the expansionary monetary policy stance of the Federal Reserve Bank the driving factor behind a monetary glut inside the US. Figure 1 shows the different strands of literature that try to explain the capital flows preceding the events starting in 2007. Figure 1 Global Imbalances are not something bad per se. They are a natural by-product of free trade (Haldane, 2010). Global Imbalances reflect differences in the level of development, demography or other factors, but they can also reflect distortions, externalities and risk (Blanchard and Milesi-Ferretti, 2009). In the current case they resulted from a high public and private expenditure and a low saving rate in the US combined with a high saving rate in the emerging Asian economies which furthermore pegged their currency to the US Dollar (USD). Was there a widening of Global Imbalances preceding the crisis? Did the US banking system actually collapse, before the system of “financial terror” collapsed, as Costabile (2009) mentioned? The understanding of the topic is still incomplete. There have been several papers focusing on single aspects of it which in part contradicted each other. The purpose of this paper is to provide a coherent story of the link between the Global Imbalances and the financial crisis. It will be structured as follows. Section 2 will provide definitions of Global Imbalances and discuss the question whether they were growing in the decade preceding the crisis and what
International Capital Flows
External Factors - GSG - BW II
Internal Factors - Mon. Glut - Exorbitant
Privilege

3
makes them different from imbalances in former times. A closer look will be taken on the deregulation of the American financial sector. Section 3 develops the argument that the global imbalances (external and internal of the US) were the fundamental driver of the financial crisis and examines possible explanations for the imbalances. It discusses the Monetary Glut hypothesis and the Global Saving Glut hypothesis, considers the Bretton Woods II system with it’s relative merits of the mercantilist and precautionary motives for the surge in Chinese savings. Section 4 elaborates the Exorbitant Privilege of the US and how it has been possible for them to maintain a positive rate of return on their foreign assets. Section 5 will conclude. 2. Global Imbalances Global Imbalances mirror the difference between gross capital inflows and outflows. As we will see, the current Global Imbalances mainly reflect an excess of US absorption over domestic savings on the deficit side and a large accumulation of US financial assets in the portfolios of the emerging Asian economies on the surplus side, where savings exceed investment. In section 3 we discuss what makes these economies willing to finance the US deficit and if this situation will be sustainable in the Future. Approaching the questions of how to measure Global Imbalances and whether a widening of current account positions can be observed, we follow Bracke et al. (2010), using the simplest approach to measure Global Imbalances by taking the sum of the absolute values of all current account positions as percentage of GDP. These Imbalances remained stable in the 80s and early 90s and doubled since mid 90s. Figure 2 shows the evolution of Global Imbalances from the mid 90s reaching their peak above 5 per cent in 2006. Figure 2
Data: IMF From 1996 to 2000, the deficit widened what, according to Blanchard and Milesi-Ferretti (2009) mainly reflects an excess of US investment over savings (during a period of strong economic growth in the US). Table 1 only partly confirms this
1
2
3
4
5
6
1996
1997
1998
1999
2000
2001
2002
2003
2004
2005
2006
2007
2008
2009
2010
Cur
rent
Acc
ount
Pos
ition
/ GD
P (a
bsol
ute
valu
es)

4
position. There was a widening of the US current account deficit in that period, but it did not start before 1999 and 2000, the two years preceding the dot-com crisis. Simultaneously there was a collapse in investment in Emerging Asia, as a consequence of the Asian crisis1 in the late 1990s. Table 1: US Gross National Savings and Investment as Percentage of GDP Investment Savings S-I Investment Savings S-I 1996 18.94 17.15 -1.79 2003 18.72 13.94 -4.78 1997 19.70 18.31 -1.39 2004 19.73 14.53 -5.20 1998 20.17 18.81 -1.36 2005 20.29 15.06 -5.23 1999 20.62 18.26 -2.36 2006 20.54 16.23 -4.31 2000 20.87 18.09 -2.78 2007 19.57 14.32 -5.25 2001 19.29 16.49 -2.80 2008 18.04 12.42 -5.62 2002 18.7 14.67 -4.04 2009 14.82 10.86 -3.96 Standard Deviation 1.72 2.44
Source: International Monetary Fund, World Economic Outlook, October 2010 The unwinding of the dot-com bubble led to a recession in the advanced economies so that imbalances narrowed in 2001 (even though the US deficit remained at the pre crisis level), but expanded again from 2002 onwards, now mainly caused by a fall in domestic savings in the US, also shown in table 1. Between 2002 and the beginning of the crisis, there was a boom in economic activity and international capital flows, with widening imbalances2. The US current account increased further. Blanchard and Milesi-Ferretti (2009) suggest that in the first part of this period (2000-2004), a deterioration of US public saving was the dominant factor, whilst private saving remained broadly stable. Figure 3 confirms this view. Figure 3
13
14
15
16
17
18
19
2000 2001 2002 2003 2004 2005 2006 2007
Gross national savings as % of GDP
0.0
0.4
0.8
1.2
1.6
2.0
2.4
2.8
2000 2001 2002 2003 2004 2005 2006 2007
Household net savings as % of disposable income
Source: International Monetary Fund, World Economic Outlook Database, October 2010 (Gross National Savings); OECD Factbook 2009 (Houshold Savings) When around 2004 public savings started to increase, the household saving rate dropped massively and investment increased. Consequently, the US current account deficit increased even further until 2005. The effect of a weakening USD was offset by a sharp increase in Oil prices. Figure 4 shows the development of the exchange rate and the oil price over time.
1 Investment fell by about 16% between 1996 and 2000, according to IMF data. 2 World trade grew by an average of about 7.3 per cent per annum, from 2002 to 2007. Data: IMF, World Economic Outlook Database, October 2010

5
Figure 4: Trade weighted exchange index of the USD vs. the major currencies3 and Oil price
0
40
80
120
16070
80
90
100
110
120
2002 2003 2004 2005 2006 2007 2008 2009
Oil price X rate
Oil
pric
e in
USD
Exchabge index of USD
vs. majorcurrencies
Data: Board of Governors of the Federal Reserve System Table 2: Chinese Current Account balance
In Billion USD
In per cent of GDP
In Billion USD
In per cent of GDP
1996 7.2 0.8 2003 45.9 2.8 1997 37.0 3.9 2004 68.7 3.6 1998 31.5 3.1 2005 160.9 7.1 1999 15.7 1.4 2006 253.3 9.3 2000 20.5 1.7 2007 371.8 10.6 2001 17.4 1.3 2008 436.1 9.6 2002 35.4 2.4 2009 297.1 6.0
Data: International Monetary Fund, World Economic Outlook, October 2010 In 2006, some smoothing was on its way, until another drop in the saving rate let the current account deficit reach its maximum. The main counterpart during this period was China4, with a 12-fold increase of its current account surplus between 2002 and 2008 (see Table 2). China used these surpluses to accumulate vast amounts of US foreign exchange reserves. Treasury, corporate and agency bonds accounted for the major part of U.S. external financing. The Chinese holdings of US treasuries increased almost 8-fold, from 95,200 to 757,112 million USD5, between 2002 and 2009. According to Blanchard and Milesi-Ferretti (2009), the Chinese surpluses originated in faster growing savings than investment in China. In section 3.2, we will go deeper into
3 Major currency index includes the Euro Area, Canada, Japan, United Kingdom, Switzerland, Australia, and Sweden. 4 Besides the oil exporters and Germany 5 Data: U.S. Department of Treasury

6
analysing the factors behind that increase of Chinese savings, which contributed to the phenomenon which Ben Bernanke called the Global Savings Glut (GSG). When the crisis became more severe in 2008, cross-border capital flows declined6 and the deleveraging American companies repatriated some of their funds. Nevertheless, for the whole year 2008, Global Imbalances did not decline, mainly because the high Oil price did not allow the US current account deficit to decrease (see figure 4)7. 2009 was a year of narrowing current accounts around the world, and thus falling Global Imbalances. The Chinese surplus and the US deficit decreased. Nevertheless, the US savings rate dropped to a low of 10.86 per cent, offset by an even bigger fall in Investment. This drop in the savings rate came from a sharp increase in government spending, offsetting the increase in the private saving rate8. After the shock related to the collapse of Lehman brothers, investors around the world considered the US as a safe haven. The net capital inflows to the US were a stabilising factor and the US never experienced an external funding problem (Caballero, 2010). Hence the fear of a “sudden stop” (of financing the US) in case of a crisis, turned out to be unjustified. To summarise, the Global Imbalances increased prior to the crisis, especially after 2001. Prime mover behind the widening imbalances over the observed period was the US saving behaviour. The standard deviation of the saving rate was somewhat higher than the one of the investment rate (Table 1). Haldane (2010) reasons that imbalances resulting from this savings behaviour could just be reflecting differences on countries’ time preferences. Aging countries should save and run current account surpluses in anticipation of the dissaving that occurs once the workforce shrinks and the number of retirees rises. In addition to the savings behaviour, Blanchard and Milesi-Ferretti (2009) name two more examples where Global Imbalances would lead to a better allocation of capital across time or space: The investment behaviour and the portfolio behaviour. The investment behaviour implies that a country with attractive investment opportunities will finance a part of them from abroad and thus run a current account deficit. Portfolio behaviour means that a country with a deeper and more liquid financial market will attract investors, which leads to a current account deficit. The savings and portfolio behaviour seem to describe part of the current situation quite well. We find aging societies not only in the classical surplus countries of Germany and Japan, but also in China (Population Reference Bureau, 2010). This gives support the GSG hypothesis. Furthermore, the US financial market is deeper compared to other countries (especially compared to the Chinese one), attracting capital inflows from abroad. Considering the investment behaviour, on the one hand a reason for the rising Global Imbalances might just be that they are the result of a change in the Feldstein-Horioka coefficient. This coefficient measures the correlation between savings and investment (Haldane, 2010). Historically, there has been high correlation between national savings and investment. During the last two decades this correlation has weakened9. Thus the rising imbalances could just be a result of financial liberalisation and
6 From the year 2008 to 2009 by about 11 per cent, according to the IMF, World Economic Outlook Database, October 2010. 7 In theory, the devaluation of the USD could even be responsible for the increase in the oil price (Campanella 2009). Consequently, after an appreciation of the USD in late 2008, we would observe a decreasing oil price. 8 Data: BEA, National Economic Accounts 9 The coefficient was close to 1 from 1930 to 1980 and dropped to almost 0 ahead of the crisis.

7
increased capital flows in recent years. But on the other hand, a fact that is at odds with theory in the current situation is, that capital seems to be flowing from the emerging economies “uphill” into the US, and not as economic theory suggests “downhill” from the US into the emerging economies where the expected returns would be higher. Widening current account balances only reflect an efficient allocation of capital if relative prices (e.g. exchange rates) are not distorted. Section 3 will show in which ways the exchange rate between the Chinese Renminbi and the US-Dollar has been subject to political interventions and in how far this affected Global Imbalances. What makes the development of recent years different from former times of widening Global Imbalances (such as the interwar period or the time after the collapse of the Bretton-Woods System)? Bracke et al. (2010) name three differences. First, there is more dispersion on the surplus side this time. Besides the usual surplus countries Japan and Germany, there are a number of new players. China, the most important, followed by the other emerging Asian economies and the commodity exporters. On the deficit side we find less dispersion compared to former periods, reflecting the growing US deficit10. This means that the world economy is more and more dependent on a single countrie’s ability to absorb the excess savings of the world. Second the recent growing Global Imbalances fell in a period, preceded by a time of favourable macroeconomic and financial development with high growth and low volatility, the “great moderation” (Bernanke, 2004). The decline in business cycle volatility led to lower precautionary savings in the US. At the same time we observe a rise in precautionary savings in Asia, after the experiences made in the Asian crisis in the late 90s. And third the financial globalisation that happened during the last decade and led to an increase in international capital flows which were not everywhere accompanied by an approximation of the level of development in the respective financial markets. In the US, we saw 20 years of deregulation of financial markets. It is worth having a closer look at the main steps of deregulation. According to Skidelsky (2010), it’s main flaws were the repeal of the Glass-Steagall Act, the decision of the Clinton Administration not to regulate Credit Default Swap (CDS) and the decision to allow banks to increase their leverage ratio from 10:1 to 30:1 by the by the US Securities and Exchange Commission (SEC). In 1999, the Gramm-Leach-Bliley Act (GLBA) repealed parts of the Glass-Steagall Act from 1932 that separated commercial banking from insurance business. It widened the range of activities that banks can conduct and permits single holding companies to offer banking, securities and insurance services (Barth, Brumbaugh, Wilcox, 1999). The reasons for the repeal were manifold11, but in a way just ratified developments that were already there12. The repeal led to a convergence of banks and securitisation firms. Broad banking emerged and banks were permitted to perform many additional activities. Subsidiaries 10 Bracke et al (2010) mention that the U.S. absorbed 75% of worlds net savings during the 2000s. 11 There seemed to be empirical evidence that securities activities of commercial banks were not responsible for the Great Depression. The regulators allowed banks to undertake limited securities and insurance activities with few problems at the end of the 1990s. Finally, the technological advance made it more profitable to sell insurance and security products, because of a cost reduction in data processing. 12 MBS were already exempt from Glass-Steagall Act and investment banks were also not subject to it. In 1996, operating subsidies (“op subs”) of national banks were permitted to engage in activities not allowed for banks. Also since the early 1980s, there were “Nonbank banks” which were not qualified as banks and less restricted.

8
of banks were allowed to conduct most financial activities. State regulators were prohibited from restricting any financial activities permitted by GLBA. The market for derivatives is organised as exchange or Over the Counter (OTC). Whilst the Exchange at the Chicago Board of Trade is regulated, OTC is unregulated. In 2000 the congress eliminated oversight by Commodity Futures Trading Commission (CFTC) and the United States Securities and Exchange Commission (SEC) over the OTC derivatives market. The key OTC derivative was the CDS. The purchaser of a CDS transferred default risk, but made periodic payments to the seller. The seller in return offered protection. These swaps were not regulated. The Purchaser could even speculate on a loan he does not own (“naked credit default swaps”), which inflates potential losses (FCIC, 2010). In 2000, the New York State insurance department determined “naked” CDS as not being an insurance, so they were not subject to regulation. In contrast to an insurance, these CDS could be sold by firms with no reserves or collateral. The CDS risk was concentrated in few very large banks and other companies (such as AIG). Finally, in 2004, the SEC allowed banks to increase their leverage ratio from 10:1 to 30:1 which further multiplied potential losses. The Basel agreements for a maximum leverage ratio could be circumvented by the banks by including Mortgage Backed Securities (MBS) into their definition of capital. In China, on the contrary, financial markets did not keep the pace of deregulation of the industrial sector, and are still considered as underdeveloped13. Bracke et al. (2010) call it an incomplete financial globalisation. This incomplete financial globalisation was laying the ground for the transformation of incoming financial flows into an asset price bubble, as the next section will show.
13 For example are interest rates not market oriented. Deposit rates are subject to ceiling, which limits the income of lenders.

9
3. Global Imbalances played the primary role for the financial crisis This chapter will show how the Global Imbalances contributed directly and indirectly to the financial crisis. What made China and the East Asian emerging economies over-fund the US? How did the US economy adapt? Was this driven by factors inside the US (monetary glut) or were the current account deficits in US just a passive response to external dynamics (savings glut, Bretton Woods II) where savings were pushed into the US, mainly by foreign purchases of US government bonds? Figure 5 shows how the cumulative amount of US treasury bonds held by China increased from 2002. How did these capital inflows affect the US economy? First there was an impact on the US external position by allowing the US to finance their deficit easily. Warnock and Warnock (2009) argue that in the absence of substantial foreign inflows into US government bonds, the 10-year treasury yield might be 80 basis points higher. As a consequence, the US had to pay less interest than expected to finance their debt. Second, this had an impact on internal actions, which will be discussed below. Figure 5: Chinese holdings of US treasuries in million US dollar
Source: U.S. Department of Treasury 3.1 Internal Factors Capital inflows depressed the long-term interest rate in the United States which led to a credit boom and thus increased borrowing for investment and consumption (Corden, 2009). Some authors question this view, by arguing that the “US bond yield conundrum” (Alan Greenspan, 2005) of the long term interest rate was not surprising but could be mainly explained by macro economic dynamics14 and the effect was only augmented by the rising share of foreign treasury holdings. Nevertheless, there is some evidence that the increasing purchase of US government bonds did have a 14 Bandholz, Clostermann, Seitz (2007) particularly name monetary policy, the business cycle and inflation expectations as reasons.
0
100,000
200,000
300,000
400,000
500,000
600,000
700,000
800,000
2001 2002 2003 2004 2005 2006 2007 2008 2009
Treasury bondsMillion USD
10
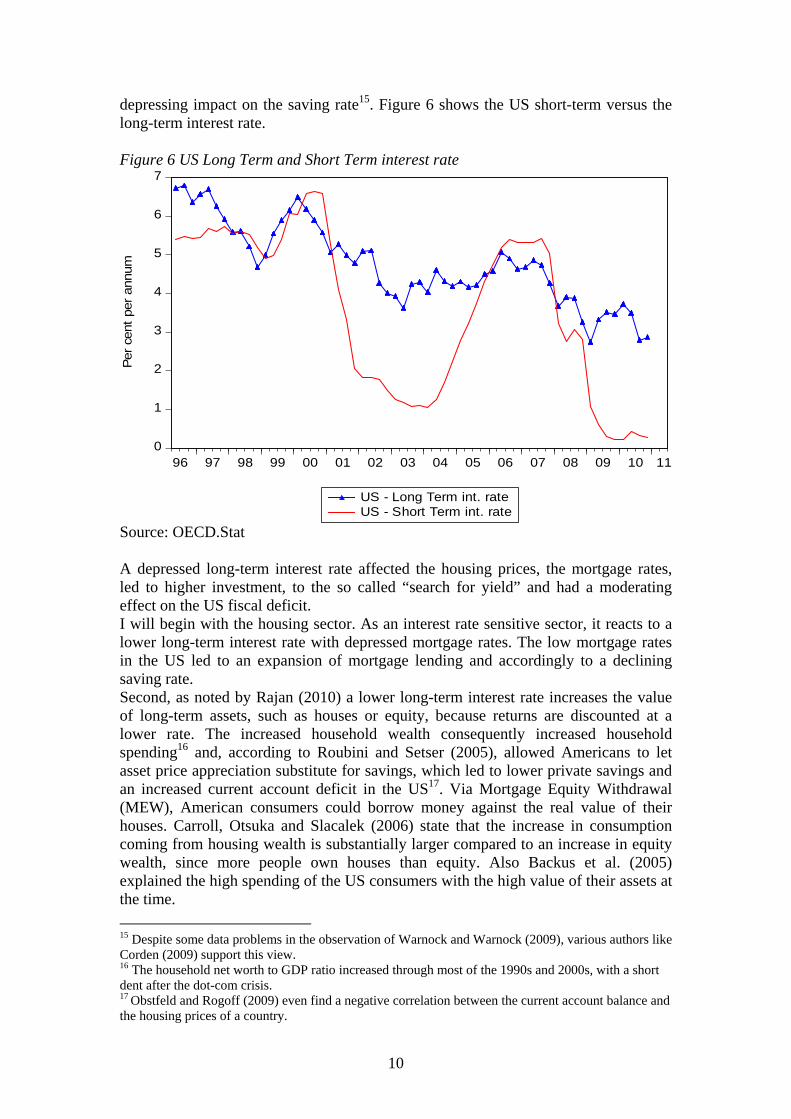
depressing impact on the saving rate15. Figure 6 shows the US short-term versus the long-term interest rate. Figure 6 US Long Term and Short Term interest rate
0
1
2
3
4
5
6
7
96 97 98 99 00 01 02 03 04 05 06 07 08 09 10 11
US - Long Term int. rateUS - Short Term int. rate
Per c
ent p
er a
nnum
Source: OECD.Stat A depressed long-term interest rate affected the housing prices, the mortgage rates, led to higher investment, to the so called “search for yield” and had a moderating effect on the US fiscal deficit. I will begin with the housing sector. As an interest rate sensitive sector, it reacts to a lower long-term interest rate with depressed mortgage rates. The low mortgage rates in the US led to an expansion of mortgage lending and accordingly to a declining saving rate. Second, as noted by Rajan (2010) a lower long-term interest rate increases the value of long-term assets, such as houses or equity, because returns are discounted at a lower rate. The increased household wealth consequently increased household spending16 and, according to Roubini and Setser (2005), allowed Americans to let asset price appreciation substitute for savings, which led to lower private savings and an increased current account deficit in the US17. Via Mortgage Equity Withdrawal (MEW), American consumers could borrow money against the real value of their houses. Carroll, Otsuka and Slacalek (2006) state that the increase in consumption coming from housing wealth is substantially larger compared to an increase in equity wealth, since more people own houses than equity. Also Backus et al. (2005) explained the high spending of the US consumers with the high value of their assets at the time. 15 Despite some data problems in the observation of Warnock and Warnock (2009), various authors like Corden (2009) support this view. 16 The household net worth to GDP ratio increased through most of the 1990s and 2000s, with a short dent after the dot-com crisis. 17 Obstfeld and Rogoff (2009) even find a negative correlation between the current account balance and the housing prices of a country.

11
In a purely theoretical economic view, it remains doubtful whether a lower interest rate actually leads to lower savings by making saving relatively less attractive and e.g. consumption more attractive (which implies a strong substitution effect), or if the income effect would offset this. According to Guidolin and La Jeunesse (2007), the US household saving rate remains a puzzle. But the US saving rate did decrease steadily, as can be seen in figure 8, and also the argument that increased household wealth led to a higher absolute indebtedness of households appears striking. Third, a lower long-term interest rate gives corporations incentives to invest more, by making today’s value of future investments higher, which also provides them with a greater ability to borrow. Obstfeld and Rogoff (2009) stated that investments rose with real estate prices. Forth, it led to the “search for yield”. Astley et al. (2009) describe how the lower interest rates put pressure on banks’ margins and encouraged investors to buy riskier assets. Focussing only on data of the “great moderation” caused a false sense of security. This “myopic” behaviour led to the assumption that financial market risk had declined and thus to an underpricing of risk. This led to credit expansion (Asteley et al., 2009) and reduced the discrimination between assets of different credit quality which corresponded with a lower risk premium. As Corden (2009) states, lending took place for more risky purposes, especially housing and consumption. Finally, there was the moderating effect of the fall of the world real interest rate on the US fiscal deficit. This kept the US government from introducing more restrictive fiscal policies. The US fiscal deficit (resulting from tax cuts and the Iraq war) filled the gap in the world demand for funds, but might have shifted the demand for foreign savings upward and increased the current account deficit, as Dooley, Folkerts-Landau and Garber (2005) show. In any way, it helped the US to sustain their Current Account deficit. So we find a situation in the US of high consumption and investment and low savings. At the same time, the US government used easy housing credit as a tool for income redistribution (Rajan, 2010)18. This easy borrowing was not driven by demand, but by a greater willingness to supply credit to low income households. President Clinton announced in 1995 to boost homeownership in America to an all time high. Any increases in the value of houses could be withdrawn (MEW) and used for consumption. Since the housing prices increased between 1999 and 2007, low income households were able to indebt themselves more and more (See figure 7). 18 Rajan explicates how a stagnancy in the proportion of College graduates led to stagnating or falling incomes for most Americans. The US government tried to compensate for this by allowing low income families to buy mortgage financed houses.

12
Figure 7:
60
80
100
120
140
160
180
200
96 97 98 99 00 01 02 03 04 05 06 07 08 09 10
Nominal Home Price IndexReal Home Price Index
Quarterly real and nominal housing price dataIn
dex
Source: Online Data Robert Shiller Simultaneously, the Fed pursued expansionary policies (monetary glut) throughout most of the 1990s and 2000s (Fiorentini and Montani, 2010). This was caused by an overestimation of deflation risk in a low inflation environment19. Thus the Fed focused on it’s second target, to stimulate employment (unemployment was relatively high after the dot-com crisis) and drove up the prices of assets and housing with its expansionary monetary policy (Rajan, 2010). Focusing on low core inflation kept the Fed from tightening monetary policy20 encouraged excessive risk taking and increased leverage. A low short-term interest rate also signals easy borrowing conditions to the markets. Roubini and Setser (2005) explicate this should encourage corporate investment, but as long as this is a by product of central bank intervention to maintain an undervalued currency they hardly encourage investment in the tradable sector. The intervention encourages over-investment in sectors like housing and under-investment in the production of tradable goods. Even more immediate than the long-term interest rate, the low short-term interest rate affected the economy via adjustable-rate mortgages, which fall with this interest rate and leave more household money for consumption. The flat yield curve preceding the crisis implied that markets required a lower term premium21 (Figure 6), which means that interest rates were expected to remain low or to decrease even further. When the Fed in 2004 started to increase the short-term interest rate, households struggled to repay their loans and banks had problems to finance themselves. The events that followed have been widely discussed. Further cyclical drivers of an increase in household wealth were an increase in permanent income due to a positive productivity shock associated with the investment
19 Core inflation remained low, due to cheap imports from China. 20 Taylor (2009) mentions that according to the Taylor rule, the Fed should have started raising interest rates by early 2002 21 In fact, in the 1 ½ years directly before the crisis, the yield curve was even inverted, which is a good indicator for an upcoming crisis.

13
in the ICT sector (Bracke et al., 2010)22 and financial innovation, which relaxed individuals’ financial constraint, favouring consumption. To summarise, we observe a declining saving rate and it seems that the savings inflow into the US led to a lower risk and term premium and the depressed interest rates led to high levels of leveraging, investment and consumption and riskier investments in the US financial system. The deregulated financial sector transformed the increasing money supply into an asset price bubble (via securitisation). As the former US Treasury Secretary Hank Paulson mentioned: “…super-abundant savings from fast-growing emerging nations such as China and oil exporters –at a time of low inflation and booming trade and capital flows- put downward pressure on yields and risk spreads everywhere”23. The question of a Fed induced monetary glut or an external cause cannot be answered at this stage, since there is a link between the long-term interest rate (determined by capital inflows) and the short-term interest rate, determined by the Fed. If the US would not have responded this way to absorb the inflowing savings, the US deficit might have been moderated, but the worldwide decline of the interest rate and the credit boom would have been even bigger (Asteley et al., 2009/ Corden, 2009). Next to these cyclical determinants of imbalances, there are also structural ones, the external factors. 3.2 External Factors Why were foreign investors willing to finance the American economy? Current Literature offers us two explanations for this phenomenon, the so-called Global Saving Glut (GSG) and a reestablished Bretton Woods system, called the Bretton Woods II (BW II) (Dooley/ Folkerts-Landau/ Garber, 2003), between the Asian countries (mainly China) and the US. Whilst the GSG is considered an international disequilibrium, the BW II system is considered a sustainable equilibrium (Portes, 2009). Some authors would even call it a benign phenomenon. I will begin by analysing the GSG.
- The Global Saving Glut - The Chairman of the US Federal Reserve, Ben Bernanke stated in his famous speech on 14th April, 2005 that the US current account deficit and the low level of long-term interest rate in the world can both be explained by the increase in global savings, the global saving glut. These savings were transformed into large inflows of foreign capital into the US24 through mainly Chinese purchases of (existing) US treasury bonds, which show a superior performance to domestic assets. Were these capital flows actually caused by a glut of savings in the emerging economies or a shortage of savings in the US (Haldane, 2008)? 22 They also show how a productivity differential between tradable and non-tradable sector might have triggered a widening in the US current account deficit. 23 Valedictory interview to the FT, January 1, 2009 24 Dooley/ Folkerts-Landau/ Garber (2005) state that all additional world savings were absorbed by the US.

14
Figure 8: Gross National savings as per cent of GDP
10
20
30
40
50
60
82 84 86 88 90 92 94 96 98 00 02 04 06 08
Developing Asia USA WorldHigh Income China
Source: World Development Indicators (World Bank) Is there support for Bernanke’s view? On the global level, there was no savings glut. Figure 8 shows that world savings remained fairly constant. The increase of savings in the emerging economies has been compensated by slightly lower savings in high income countries (Wolf, 2008). This rise of savings in the emerging economies, first and foremost in China25, has been directed into the US. Looking at the Chinese savings rate, two observations can be made. First, the Chinese savings have continuously been very high, in the last thirty years and second, they increased by 17 percentage points between 1999 and 2007. Where did this surge after 1999 come from? According to Yang, Zhang and Zhou (2011), the highest contribution came from government savings which rose by 8.2 percent to 10.8 percent of GDP in 2007. A fiscal reform in 1994 and the high GDP growth in that period led to higher tax revenues. Since the state consumption remained stable, government savings increased. The household sector rose by 5.5 percentage points to 22.2 percent of GDP during this period. The biggest share, coming from the wealthiest quartile of the population which experienced the fastest growth of the saving rate and had a 27 percentage points higher saving rate than the poorest quartile. Thus increased household savings might just reflect a growing inequality in China. The demographic changes also contributed to higher household saving. Since the Chinese society is aging and there is the one child policy, households substituted children (as old age provision) by savings. The lack of a social security system and the privatisation of state-owned enterprises (SOEs) after 1998, which de-linked the provision of social services from the employers, led to higher household savings, as well. Finally, corporate sector savings rose by 4.2 percentage points to 18.8 percent of GDP, coming from an increased profitability within the sector. Two factors were
25 Caballero, Farhi and Gourinchas (2008) showed in a simple model that these increased savings can result from an underdeveloped domestic financial market.

15
responsible for this. The increased productivity, and the continuously low costs of production. Both, the privatisation of the SOEs and the growth of private enterprises contributed to higher profitability, as well as the Labour market reforms26. After the Asian crisis, China initiated trade promoting policies in 1998. Tax rebates for exports were implemented, which remained high and further increased earnings and profitability of the Chinese firms. In addition, SOEs were given loans with interest below market rates. This in connection with the control of labour compensation and the fact that SOEs were not asked to pay dividends helped them to maintain a production at low costs. The higher productivity and the maintained low costs resulted in higher corporate savings. Even though the surge between 1999 and 2007 was caused by Chinese government savings mostly, if one takes into account the last two decades, the core of the Chinese savings story was the rise in corporate savings. Haldane (2010) observes around 2/3 of Chinese savings derive from the corporate sector. As stated above, the Chinese government has not drawn the increased profits of the corporate sector as dividends or used it to finance a safety net for displaced workers, but left the money with corporate insiders (Wolf, 2008). Consequently, also precautionary private savings increased as a response to reduced social welfare and a lack of public pensions in China (Corden, 2009). All three factors contributed to a rise in Chinese savings from 35 percent of GDP in the 80s to 53 percent of GDP in 2007. Since China was the largest surplus country in the last ten years, the GSG hypothesis would require a strict time sequence between a high Chinese net saving rate and a low American one (Fiorentini and Montani, 2010). But, as the Governor of the People’s Bank of China, Zhou Xiaochuan (2009) mentioned, US savings declined before the surge in Chinas current account surplus. Tables 1 and 2 confirm this view. The US saving rate reached its peak (for the last two decades) in 1998 and steadily declined afterwards27, whilst the Chinese savings soared only after 2001 and experienced another upward jump from 2005 on. Has the US deficit just filled the lack of demand for funds for fruitful investment as Corden (2009) mentions? The returns on US assets held by foreigners are not particularly high, compared to those earned by US owners of foreign assets. Thus, the GSG assumption that foreign investors prefer to invest in the US because of the better performance of US assets does not hold (Wolf, 2008). USD assets do not fully compensate for expected future devaluations (Roubini and Setser, 2005). So the view of Fiorentini and Montani (2010) that the GSG hypothesis alone cannot explain the sharp decline in the US saving rate appears to be reasonable. So what made the surplus countries finance the US, if it is more a burden than an opportunity? Many authors like Fiorentini and Montani (2010) or Caballero (2010) mention the superior efficiency of the American financial market as the reason for the capital inflows28. But what makes this market more efficient than e.g. the Chinese one? Since there is no superior performance of US assets (Wolf, 2008 and Forbes, 2008), there must be other reasons to invest in the American market. The most common reasons suggested in current literature are the Risk and Liquidity aspect. The sheer 26 The relaxation of worker mobility restrictions, the progressing urbanisation and the implementation of labour incentive schemes resulted in higher profitability of the corporate sector. 27 The US personal saving rate shows a clear downward trend even from 1982. 28 Forbes (2008) finds that a country with a less developed financial market invests a larger share of its portfolio in the US.

16
size and deepness of the US financial market provides e.g. bond investors with liquidity (Blanchard and Milesi-Ferretti, 2009) and safety that they cannot find in their own countries’ financial markets or in European countries. The emerging market economies especially consider the US assets as a safe haven for their savings. The explanation of the Bretton Woods II system will provide further insight into the mechanism of money circulation driven by a flow of Asian savings into the US.
- Bretton Woods II - The Bretton Woods II hypothesis is based on the assumption of an implicit bargain between the emerging Asian countries and the US, which states that several East Asian countries pegged their currency to the USD, to support their export led growth strategy by undervalued and heavily managed exchange rates, capital controls and official capital outflows in the form of accumulation of reserve asset claims on the centre country (Dooley, Folkerts-Landau and Garber, 2003). The unilateral pegging to the dollar led to a regime of quasi fixed exchange rates in the pacific area and implied current account surpluses in Asia, with deficits and low long-run interest rates in the US. According to Fiorentini and Montani (2010), the Asian countries had high savings but their financial sectors were not efficient enough to transform savings into domestic investment. Yang, Zang and Zhou (2011) find that despite development and commercialisation in China, financing through bank loans is still limited. The importance of domestic loans even declined further in the last decade, whilst Foreign Direct Investment (FDI) contributed 7 percent of fixed asset investment in 2008. Figure 9 By-pass effect The growth strategy of these countries relied on development through the inflow of FDI and retained savings within the enterprises. The role of the US financial sector in this system would be to transform the incoming Asian savings into an outflow of FDI to the originating countries. China and other emerging market countries are net importers of FDI and net exporters of financial capital (by-pass effect). Ju and Wei (2007) confirm that the large volume of FDI inflow is rather a reflection of China’s inability to allocate its household savings efficiently through its financial sector, than of its economic strength. Thus, FDI is a tool for Chinese private firms to circumvent the inefficient domestic financial sector. To maintain this mechanism, the surplus countries kept foreign currency, as collateral for FDI29 and to sustain solvency in case of a sudden stop. Referring to Astley et al. (2009) this policy is sustainable, because there is no fundamental constraint to the amount of foreign exchange reserves a
29 So the US could expropriate these reserves in case of expropriation of their FDI (Portes, 2009)
US financial sector transforms savings
into FDI
Emerging Asian Economies
peg their currencies to USD

17
country can accumulate. Dooley, Folkerts-Landau and Garber (2003) also consider this system as fundamentally stable30. Caballero (2010) states that the excess demand for safe assets from the periphery added to the US economy’s own imbalance and put an enormous pressure on the US financial system. Current literature provides several driving factors behind this mechanism which can be summarised as the mercantilist views.
- Mercantilist views -
a) Asset shortage hypothesis Related to by-pass hypothesis is the hypothesis of an asset shortage in the emerging Asian economies, which sees Global Imbalances as a corollary of their backward financial markets. The hypothesis states that the emerging market countries were constrained to purchase US government bonds, because there was a shortage of safe and liquid assets in their domestic financial markets, which only the US market could offer. Weak bankruptcy procedures, chronic macroeconomic volatility or ex-propriation risk reduced the quality of the domestic assets. If China had an open capital account, citizens would seek assets abroad directly. Since it has not, the government accumulates international assets and issues implicitly collateralised sterilization bonds to its citizens (Caballero, 2006). Caballero (2010) concludes that the Global Imbalances observed in the capital accounts were just a consequence of the Global Imbalances in the ability of supplying safe assets. Or as Bracke et al. (2010) put it: The insufficient supply of safe assets in some countries trigger net capital flows to regions where safe assets are produced. If a country with a weak domestic financial sector experiences high productivity growth, the increased savings will lead to financial outflows. This is in accordance with the portfolio behaviour in section 2. Thus, the fall in the real interest rate in the US was just a market mechanism to overcome the asset gap (Caballero, 2006). By 2001, the demand for safe assets began to rise above what the US financial sector could naturally provide. Since the demand for safe debt instruments from foreign central banks could not be met, financial institutions began to search for mechanism to generate triple-A assets from riskier sources via the securitisation of payment streams31. b) Parking theory Corden (2009) refers to the “parking theory” which he already mentioned in his 2007 paper. This theory says that Chinese savings are just parked in the US (safe haven), awaiting improvements in the capital market, before the accumulated funds could be invested efficiently in the domestic market. If a country with an intermediate level of property rights and an underdeveloped financial sector integrates into the world economy, this causes capital flows and imbalances. The country becomes simultaneously a net exporter of financial capital and a net importer of FDI. Thus, the economic integration of China might have led to a lower saving rate in the US. As Bracke et al. (2010) mention, a deeper financial market allows lower domestic savings. 30 Even after the Outbreak of the financial crisis, the purchase of US government bonds remained positive (Astley et al., 2009). 31 The problems arising from these kind of assets have been broadly discussed.

18
c) Exchange rate policy If a country runs a continuous current account surplus, this puts an upward pressure on its exchange rate. China offsets this pressure by selling domestic assets and accumulating foreign currency reserves, mainly US bonds. If the monetary policy of the anchor country is too lose (as in the case of the US), there is an upward pressure on inflation since it requires an increase in money supply in the surplus country. This was of no concern in China, because regarding Astley et al. (2009), the upward pressure on wages could be limited by the rapid increase in the workforce and productivity growth was sufficiently fast to keep inflation low32. Corden (2009) on the contrary describes that the primary goal of Chinese policy has been low inflation rather than the exchange rate. He shows how the increase in productivity and the WTO accession in 2001 improved the competitiveness and increased the savings of China33. This raised the potential for inflation34 (which would be equivalent to an indirect appreciation of the currency), so China imposed monetary controls to reduce bank lending which induced a reduction in expenditure and thus improved the current account balance. Roubini and Setser (2005) share this view and state that the inflation fueled by only partially sterilized reserve accumulation and the resulting liquidity creation led to an investment bubble in China which was tried to be slowed down by controls on bank lending by China. Thus, for Corden the surpluses since 2005 are rather a by-product of inflation limiting. Nevertheless, he confirms that besides inflation limiting, the prevention of excessive (nominal) appreciation of the Chinese currency has been a goal of intervention in the foreign exchange market. Beside the obvious purpose of maintaining profitability and employment in the export sector, it aims to create a stable exchange rate to avoid speculation and keep pressure from the fragile Chinese financial system35. d) Misallocation of capital hypothesis Song, Storesletten and Zilibotti (2009) use another approach based on the inefficient Chinese financial sector, which states a misallocation of capital in China. Their hypothesis is that the combination of high returns to capital and a foreign surplus arises from the reallocation of capital and labour from less productive externally financed firms to more productive firms with less access to external financing. They create a model with firms, heterogeneous in productivity and access to financial markets. Since the high productivity firms crowd out the low productivity firms which have access to the financial markets, fewer and fewer domestic investment opportunities remain and domestic savings are invested in foreign assets. There is a number of problems, arising from these mercantilist theories. Portes (2009) mentions that surplus countries’ savings went into all kind of assets with different quality. Thus it is hard to justify why these savings went into the US with the superior risk aspect of American assets. As Obstfeld and Rogoff (2009) pointed out, the “win- 32 The inflation rate in China was moderate with about 2 per cent on average. Data: IMF WEO 2010 33 Roubini and Setser (2005) state that apart from the exchange rate and the current account, China looks like East Asia before the 1997 crisis, with high levels of investment, a credit/ asset bubble and investment surge. 34 In combination with a fixed exchange rate, it will also attract speculative capital which puts additional upward pressure on inflation. 35 The undervalued currency allowed China to defer rebalancing its own economy (Obstfeld and Rogoff, 2009). Roubini and Setser (2005) name the interest of well-connected Chinese business man, who are heavily invested in the export sector as another possible reason for sustaining the peg.

19
win” situation of easier borrowing for the US, and the provision of safety and liquidity to the emerging markets seems to be flawed by the assumption that the US financial market functioned perfectly36. All the explanations set the focus on the accumulation of reserve assets via capital outflow from China. They lack an understanding of the FDI flow from the US to China. In fact, the US gross capital outflows went primarily to other advanced countries which contradicts the by-pass effect hypothesis. Moreover, the gross flows into the US did not primarily come from the private sector but from foreign central banks. Finally, the mechanism was not “benign”, because the inflows into the US financed consumption and government deficits, instead of financing investment (Portes, 2009). Since high export growth has been the story of East-Asia during the last 50 years (Aizenman and Lee, 2005), the BW II story seems to be specific to the USA-China link, rather thank global (Wolf, 2008). Portes (2009) states that the whole exchange rate based analysis misunderstood the motivation for these surpluses. The holding of USD as collateral appears arguable. Roubini and Setser (2005) explicate how the Argentinian example has shown that foreign equity investors have not been able to establish a legal claim on the reserves. He is in line with authors like Aizenman and Lee (2005) who question the whole mercantilist view on reserve accumulation and refer to a precautionary approach.
- Precautionary savings - The precautionary approach states that these surpluses were intended to build up precautionary reserves to deal with “sudden stops”. In the aftermath of the Asian crisis, the emerging economies started to accumulate foreign exchange reserves, as insurance against “sudden stops”. Empirical literature names the vulnerability of the capital account and the current account to “sudden stops” of capital inflow as the main reason to build up reserves37. Following the argument that China accumulated reserve assets for precautionary reasons, Jeanne (2007) raises the question if this level of accumulation was justified, or excessive in emerging market economies. The optimal level of reserve accumulation is defined by the costs of holding them (such as opportunity costs or the costs related to valuation effects of the USD denominated reserves), the probability of a current account crisis and the degree of risk aversion in a country holding reserves. The opportunity costs of holding reserves are e.g. the difference in returns on these reserve assets, compared to the returns on other assets. Since the return on US assets was rather low in the observed period, this differential would be negative in the case of China38. Apart from the costs Jeanne (2007) states that it is not clear whether high reserves would actually prevent a crisis in the case of a “sudden stop” or just mitigate the fall in output that corresponds with it. Reserves could be used for mitigation through two channels. First, they could be sold to avoid the deterioration of the own currency and provide liquidity to the domestic financial markets. Since the Asian
36 After the financial crisis we know that the US financial sector also has difficulties with financial intermediation. 37 A “sudden stop”, according to Jeanne (2007) is a year in which the inflow of capital drops by more than five per cent of GDP. 38 Jeanne (2007) estimates the costs of holding reserves for China as one per cent of GDP. Roubini and Setser (2005) state that a 33% depreciation of the renminbi/ USD would generate losses of roughly 10% of China’s GDP. The next section will go deeper into the topic of valuation effects.

20
surplus countries rely on an export led growth model, they tend to be more concerned about appreciation of their currencies, thus this point does not seem convincing. Second, they could be used to buffer the impact on domestic absorption. Since the current account equals the capital and financial account plus the net reserve assets, a buffer of reserve assets could mitigate the impact on the current account and thus keep pressure from domestic absorption. Jeanne (2007) mentions that empirically in a year of a “sudden stop”, the decline in domestic absorption is mitigated to only three per cent. He concludes that the emerging economies accumulate reserves in good times, to deccumulate them in bad times. Jeanne (2007) states that the opportunity costs, as well as the probability of a crisis rather suggest that reserve accumulation during the 2000’s in China has been excessive. The probability of a current account crisis in China (or other emerging market countries) is rather low, taking into account their continuous current account surpluses. The opportunity costs of holding reserves on the contrary are rather high compared to other countries, given the profitable investment opportunities in China and possible alternative arrangements (Blanchard and Milesi-Ferretti, 2009). Jeanne (2007) mentions that expected costs of a current account crisis amounting to 60% of GDP would be needed to justify this level of reserve assets and thus considers the view of reserve asset accumulation on a precautionary basis as rejected. Nevertheless, it is worth to have a closer look at the shift in the degree of risk aversion as a possible explanation. Fiorentini and Montani (2010) state that China and other Asian countries were importers of savings before the severe economic and financial crisis in 1997. Subsequently these countries became positive net savers. As mentioned above, the savings increased rapidly after 1999. The conclusion might just be that higher precautionary savings are a response to an increased risk aversion after the Asian crisis. This raised demand of safe assets, which the Chinese market could not provide. So savings were redirected into the US market. This view is consistent with the observed shift from equity towards bonds in the Chinese US portfolio, after the dot-com crisis (Caballero, 2010). At the same time, the US experienced a decline in business cycle volatility, which led to lower pre-cautionary savings in the US and made capital flowing “uphill” (Bracke et al., 2010). This does not justify the whole increase and there would have been other insurance mechanisms39 but it contributed to it. I support the view of Portes (2009) and other authors that this whole explanation is too focused on China. But since China accounts for most of the world’s savings40, and the hypothesis that the underdeveloped financial market and a shortage of appropriate domestic assets in China can not be neglected it surely contributed to the Global Imbalances. The inflow of FDI combined with the rising Chinese exports after the WTO accession in 2001 made the corporate sector more profitable and further increased Chinese savings, which then came back as FDI. Thus the mechanism was self enforcing. It is also important to state that the combination of a high marginal product to investment and a low return from safer external assets is dynamically inefficient. It creates a natural source of bubbles, in the case of capital repatriation (Caballero, 2006). Also, as Roubini and Setser (2005) state, the Bretton Woods II system implies that the continued imports from Asia will lead resources to flow out of
39 Central Bank swap-lines e.g. 40 The Chinese share of global saving increased from less than 5% in 1980 to about one fifth today. That makes China the single largest source of global saving (Haldane, 2010).

21
import competing sectors into sectors that are favoured by a low interest rate, what will additionally enhance the effects, studied in section 3.1 in the US. To explain the whole international flows from the less developed countries to the US, we will need to focus on the role of the USD in the current international monetary system and the so called “Exorbitant Privilege” of the US. 4. The Exorbitant Privilege The term “Exorbitant Privilege” refers to the benefits of the US connected with it’s unique role of the issuer of the international reserve currency41. The USA is capable to borrow abroad by issuing assets in its own domestic money, so the debt burden does not depend on the exchange rate. Consequently, the US net foreign liabilities were growing at a rate, smaller than the US current account deficit (Campanella, 2009), which reduced the pressure of adjusting the US current account deficit and thus contributed to the evolution of Global Imbalances. The “Exorbitant Privilege” translates into a soft external constraint. The US can finance a significant amount of its imports through increases of low-income liquid liabilities held by foreign monetary authorities (Alessandrini and Fratianni, 2009). The higher the privilege, the bigger Trade Balance deficit can be run (long run), and the smaller adjustment is needed (Meissner and Taylor, 2006). Figure 10 shows the development of the US foreign asset position measured in millions of USD. Figure 10
-4,000,000
-3,000,000
-2,000,000
-1,000,000
0
1,000,000
1980 1985 1990 1995 2000 2005
US Net International Investment Position
Source: U.S. Department of Commerce, BEA
41 The term was used by Valéry Giscard d'Estaing to describe the ability of the US to purchase imports by issuing their own currency in the Bretton Woods system. After the end of Bretton Woods in 1971, the USD maintained this role, because there simply were no real alternatives (Fiorentini and Montani, 2010).

22
Even when in 1986 the US turned form a net creditor to a net debtor, they continued to have a positive total return, which means they were able to indebt themselves for free42. Data from the U.S. Department of Commerce (used in figure 11) shows that during the years 2000 to 2007, the current account deficit grew by $4,592 billion whilst the net foreign debt increased by only $1,185 billion in the same period. The Privilege is determined by the total rates of return (on external wealth), which consists of two factors. First the yield privilege and second the capital gains. Both factors contributed roughly equal parts to the US total return differential between 1981 and 2000. According to Meissner and Taylor (2006), the US maintained a privilege of about 0.5 per cent of GDP in the preceding two decades. 1) Yield Privilege As Gourinchas and Rey (2005) notice, the foreign asset position of a country equals a leveraged portfolio. This portfolio is short in domestic assets and long in foreign assets. As noted by many authors, the US earn systematically higher returns on their foreign assets, than they pay for their foreign liabilities. - “Banker of the World” Due to the unique role of the USD in the Bretton Woods system, the US became the “Banker of the World” (Kindleberger, 1965), a role that was played by the UK before the First World War. They borrowed low yielding short-term and lent higher yielding long term. After the end of the Bretton Woods era, the US kept that role. But, according to Meissner and Taylor (2006), there has been a downward trend in the yield privilege since 1981. This could be compensated in two possible ways. First the leverage effect and second, the composition effect (purchase more high yield foreign assets, issue less home equity). As long as there is a positive return differential, it can be exploited by increasing the leverage ratio. This enlarging of the balance sheet has been used by the US since the 1960s and quadrupled the US foreign liability to GDP ratio between the 1980s and 2003 up to 99 percent of GDP (Gourinchas and Rey, 2007). This was mainly offsetting the narrowing yield differentials. The use of the leverage effect is only possible to a certain extent. If the differential keeps shrinking, an explosion in leverage would be needed. Thus, to maintain their positive yield differential, the US made use of the composition effect. They shifted their assets position from lending long-term, to FDI and buying equity. As Gourinchas and Rey (2005) stated, since the 1990s, the US changed from being the World Banker to being the World Venture Capitalist. This means they issued short-term and fixed income liabilities and invested direct and in equity abroad. Gourinchas and Rey (2005) observe that the total return differential between US foreign assets and liabilities increased from 0.26% during the Bretton Woods period, to 3.32% after 1973, despite the downward trend in the yield privilege. The increase results from a shift in assets (composition effect), whilst liabilities broadly remained the same. On the contrary, Meissner and Taylor (2006) state that the yield differential has fallen from 3% to 1% since 1960, despite the rise in risky FDI and was only offset by vastly expending the external balance sheet of the US. Since this is only possible until a 42 Hausmann and Sturzenegger (2005) show how the US earned the same 30 billion return in 2005 than they did in 1980, even though they accumulated 4,5 trillion of current account deficit during that period, what change them to be a net debtor.

23
certain level of leverage, they conclude that since the Privilege consists of the yield differential and capital gains, the latter must have compensated for declining yields. Even if the yield differential is falling and cannot be offset, there may be no consequence for the long-run budget constraint. The capital gains can come from price effects, exchange rates effects and other effects. These capital gains must have grown enormously, since in the Bretton Woods era there has been a negative capital gain for the US which improved every year, until reaching zero in 2000 (Meissner and Taylor, 2006). 2) Capital gains With the end of the Bretton Woods era came also the initiation of a regime of floating exchange rates which left room for exchange range adjustments. Nevertheless, the US kept their role as the issuer of the Key Currency (KC). The KC country usually has its liabilities in its own currency. Thus the country (the US in this case) shifts the exchange rate exposure to the rest of the world. Gourinchas and Rey (2005) describe the mechanism as follows. A decrease in the value of the USD has two consequences. First, in the medium and long run, it fosters the exports via the trade channel43. Second, in the short run, there is an impact via the valuation channel. The value of the US liabilities in USD remains the same, whilst the value of US assets in foreign currencies increases (measured in USD). Thus, there is a wealth transfer towards the US and the US net foreign liabilities grow at a rate below the one of the cumulative current account deficit. Figure 4 showed the devaluation of the USD in the last decade. Alessandrini and Fratianni (2009) show that in 2001-2007, the USD exchange rate depreciation increased the dollar value of US foreign assets by $950 billion. Figure 11 Components of Changes in the NFA position
Data: U.S. Department of Commerce, BEA Figure 11 on the contrary shows how during the strong dollar periods of the mid 1990s and the early 2000s, Valuation effects were negative and the US Net Foreign
43 Section three has shown how this mechanism works.
-1,600,000
-1,200,000
-800,000
-400,000
0
400,000
800,000
90 92 94 96 98 00 02 04 06 08
Price changes Other Change in NFA poitionFinancial flows Exchange rate

24
Asset (NFA) position fell at a rate bigger then the current account deficit44. Looking at figure 11 reveals some interesting facts. The decrease in the NFA position went always slower then the current account deficit (indicated by the solid line being above the dotted line), meaning the US always profited from positive capital gains. The only exceptions are the year of the Asian crisis 1997, the years after the dot-com crisis and 2008, the most severe year of the financial crisis. One can see that the negative impact in 1997 resulted from negative price changes (due to a deterioration of the American equity in Asia) and from negative valuation effects, due to a peak in the value of the USD. In the early 2000s the negative effect resulted from valuation effects only, when the USD reached its 15 year peak (see also figure 4). Finally, in 2008 there was a huge impact of the negative price effects, resulting from a slump in world equity markets mainly. The massive impact on the US NFA position can be reasoned by the shift towards equity in the American portfolio in preceding years. Despite these findings, the exchange rate channel is, according to Meissner and Taylor (2006), weak as an explanation in the long run. As seen above, it can also work in the opposite direction and thus there was hardly any valuation effect over the total last two decades. The price effect also accounted only for a small amount. The majority was indeed contributed by other effects. Focusing on two periods separately shows a more differentiated picture and supports Alessandrini and Fratianni (2009)’s view. In the years before 2001, the price and valuation effect were negative and offset by very strong other effects. This changed after 2001. The weight of the other effects declined drastically, whilst valuation effects and price effects increased. In the years preceding the crisis, the dollar depreciation (as seen in figure 4) and the gain on foreign asset prices each contributed almost the same to capital gains now as other effects. Thus, the US benefited from exchange rate effects not only through the trade channel, but also through the valuation channel. The price effects are in line with the fast recovery of the emerging Asian countries’ assets after the Asian crisis, with a little dent in the two years following the dot-com crisis and the deterioration of the equity dominated US portfolio in 2008 (“World Venture Capitalist”). It remains contentious in literature, what the other effects consist of. One explanation might be the so called “Dark Matter” Hypothesis.
- Dark Matter - Hausmann and Sturzenegger (2005) introduced the hypothesis of Dark matter. They assume, that if the US foreign income flows remained fairly stable over the last 25 years (before 2005), then consequently (from an accounting point of view), the NFA also should not have changed. This contradicts with the continuous current account deficits of the US. Thus, they conclude that the current account deficits were not measured correctly, the NFA position did not turn negative and the US are still a net creditor. The discrepancy to the official NFA position equals to what they call the Dark matter. The Dark matter reflects a three fold service transfer, hidden, but not reflected, in the capital account: First, there is the knowledge service transfer. This is the most important factor, according to Hausmann and Sturzenegger (2005). They state that the value of American FDI is much higher than its booking value, because it generates a higher return. They consider this return as a kind of premium for a know-how transfer from
44 It is also important to notice that any devaluation of the USD reduces the value of US assets owned by foreigners and might impair the willingness the purchase of USD nominated bonds.

25
the US abroad. Thus the American FDI yields higher returns than those made by foreigners in the US. Second, there is the transfer of an Insurance service. This hypothesis states that the difference in the rates of return is an insurance premium the world pays to swap a safe American bond against riskier emerging market bond. This means that there is an unaccounted insurance service sold to the world, which generates a premium. Finally, Hausmann and Sturzenegger state the hypothesis that there is an unaccounted value in the form of liquidity services provided to the world by the US (Seigniorage). The US earn a significant premium on the provision of liquidity45. They provide their currency as a superior store of value for countries with unstable domestic currencies46. The Hausmann and Sturzenegger paper is based on some odd assumptions. They set the net income rate of return at 5% and derive a NFA position based on that assumption, ignoring the well established fact that the US can exploit a return differential in favour of their assets. Taking into account the return differential, the Dark Matter would shrink considerably. Buiter (2006) further analyses each of the three service transfers. First, even if the US had unique technical and managerial skills and knowledge, foreign investors in the US should profit from this as well. He explicates that this view is not supported by data. Further he questions the reliability of FDI market value measure, since FDI is typically unlisted and not traded, and raises the assumption that also FDI in the US could be understated. Thus, the knowledge transfer hypothesis does not hold. Buiter (2006) mentions secondly that it is only possible that US banks offer a return below risk adjusted market rates to foreigners47 if some additional banking services are not priced in. These services could consist of a continued association with the bank. Considering the development of the financial sector since the 1980s, this association seems less important. Even if the world pays a premium for lowering risk, the risk adjusted return should not be different than elsewhere. He concludes that the opposite seems to be true. The ex-ante spreads between US treasuries and emerging market debt are barely sufficient to compensate for the likelihood of default. Thus, there rather seems to be negative dark matter, considering the insurance service aspect. But, according to Buiter (2006), 2/3 of all Dollar notes in circulation were held abroad. US currency held abroad is in no sense a liability. Printing money equals an interest free loan to the US authorities. The US then use the proceeds from printing money (Seigniorage), to buy assets that generate returns. Buiter (2006) confirms the contribution of liquidity services to Dark Matter, but states that it accounts for only a small amount. The reserve currency is a public good, provided by a single country, so there is an inherent conflict between the national dimension of economic policy and the global economy (Campanella 2009).Two severe consequences may arise. First the issuer of the key currency could make use of valuation effects, as seen above. Second, issuing the key currency helps the anchor country to easily finance an ongoing deficit through excessive use of Seigniorage. According to Fiorentini and Montani (2010) this has been the case, preceding the crisis. After almost half a century in which foreign central banks financed 45 According to Gourinchas and Rey (2005) this ability has even strengthened over time. 46 According to Obstfeld (2010), this can also be seen as an insurance payment for expected transfers in future crisis. 47 And likewise US loans to foreigners pay above risk adjusted market rate.

26
approximately 6.5 per cent of US imports on average, this figure increased to 12 per cent in the 2001-2008 period48. It ensured ten years of rapid growth, but contributed to Global Imbalances. To summarise, the evolution of the US privilege was as follows: During the Bretton Woods era, they simply exploited their function as the world banker. When their NFA position turned from being a net creditor into being a net debtor, they used composition effects, to gain a positive yield differential (World Venture Capitalist). When that yield differential started draining away, the US increased their leverage ratio, to magnify the declining yield differential. When the deficit reached an amount where this was not possible any further, the US compensated this by increasing capital gains through using the valuation channel (in a then floating exchange rate system) and, to a greater amount by other capital gains. Of these other capital gains, only the use of Seigniorage could be verified, but an excessive creation of dollars might erode the trust in the dollar. The rest of the other capital gains remains unknown. 5. Conclusion To conclude, there is no single explanation for the events that started in 2007 and still continue. This paper tried to provide a coherent account of interaction of several events inside and outside the United States. The US ability to finance macroeconomic imbalances through easy foreign borrowing allowed it to postpone tough policies (Campanella 2009). Whilst the original Bretton Woods system required the US to maintain the USD parity to gold, the BW II system fails to impose any limits on US policy. The excessive use of the “Exorbitant Privilege” by the US before the crisis, in combination with precautionary savings in China after the Asian crisis and a demand for (safe) assets in the fast growing, more and more integrated, emerging economy countries, which were not natural asset producers seemed to have played an important role in the evolution of the Global Imbalances that led to the financial crisis. One can conclude that China had a too closed capital account, whilst the US had a too open current account. Nevertheless, the Global Imbalances could only unfold their negative effects in connection with a deregulated American financial sector and the use of easy housing credit as a tool for income redistribution by the US government. This helped to transform the excessive money supply into an asset price bubble, increasingly indebted households and a booming consumption, which came to an end when the short-term interest rate began to rise in 2004. Households couldn’t pay their adjustable rate mortgages, and banks saw their spread between borrowing short and lending long-term draining away. The situation led to the financial meltdown of the years 2007-2010. The Global Imbalances might not have been the immediate cause of these events, but created the conditions for this development.
48 Reaching its peak at 19% in 2004.
27
Literature
• J. Aizenman, J. Lee (2005): “International Reserves: Precautionary versus Mercantilist Views, Theory and Evidence” NBER WP 11366
• P. Alessandrini, M. Fratianni (2009): “International Monies, Special Drawing Rights, and Supernational Money”
• M. Astley, J. Giese, M. Hume, C. Kubelec (2009): “Global Imbalances and the financial crisis” BoE, Bank’s Monetary Analysis Division
• D. Backus et al. (2005): “Current Account Fact and Fiction” • H. Bandholz, , J. Clostermann, F. Seitz, (2007): “Explaining the US bond
yield conundrum” Munich Personal RePEc Archive Paper No. 2386 • J.R. Barth, D. Brumbaugh Jr., J.A. Wilcox (1999): “The Repeal of Glass-
Steagall and the Advent of Broad Banking” • B. S. Bernanke “Remarks“, at the meetings of the Eastern Economic
Association, Washington, DC, February 20, 2004 • Bureau of Economic Analysis, International Economic Accounts, U.S.
Department of Commerce • T. Bracke, M. Bussiere, M. Fidora, R. Straub (2008): „A Framework for
Assessing Global Imbalances” ECB Occasional Paper Series NO. 78, January 2008
• W. Buiter (2006): “Dark Matter or Cold Fusion?” Goldman Sachs Economic Research Paper No: 136
• R.J. Caballero (2006): “On the Macroeconomics of Asset Shortages” • R.J. Caballero, E. Farhi, P.-O. Gourinchas (2008): “An Equilibrium Model of
“Global Imbalances” and Low Interest Rates”. American Economic Review 98:1, 358–393
• R.J. Caballero (2010): “The “Other” Imbalance and the Financial Crisis” • E. Campanella (2009): “The Triffin Dilemma Again” • C.D. Carroll, M. Otsuka, J. Slacalek (2006) “How Large Is the Housing
Wealth Effect? A New Approach”NBER Working Paper No. 12746 • W.M. Corden (2009): “China’s exchange rate policy, its current account
surplus, and the global imbalances” Economic Journal, Vol. 119 issue 541 • M.D. Dooley, D. Folkerts-Landau, P.M. Garber (2003): “An Essay on the
Revived Bretton Woods System” NBER WP 9971 • M.D. Dooley, D. Folkerts-Landau, P.M. Garber (2005): “Savings Gluts and
Interest Rates: The Missing Link to Europe” NBER • FCIC (2011): “The Financial Crisis Inquiry Report, Final Report of the
National Commission on the Causes of the Financial and Economic Crisis in the United States” Official Government Edition
• R. Fiorentini, G. Montani (2010): “Global Imbalances and the Transition to a Symmetric World Monetary System” Perspectives in Federalism, Vol. 2, issue 1
• K.J. Forbes (2008): Why do Foreigners Invest in the United States?” NBER Working Paper Series WP 13908
• P.O. Gourinchas, H. Rey (2005): “From World Banker to World Venture Capitalist: US External Adjustment and The Exorbitant Privilege”
• P.O. Gourinchas, H. Rey (2007): “International Financial Adjustment” Journal of Political Economy, 2007, vol. 115, no. 4

28
• M. Gouidolin, E.A. La Jeunesse (2007): “The Decline in the U.S. Personal Saving Rate: Is It Real and IS It a Puzzle?” Federal Reserve Bank of St. Louis Review 89(6), pp. 491-514
• A.G. Haldane (2010): “Global imbalances in retrospect and prospect” Speech in November 2010, BoE
• R. Hausmann, F. Sturzenegger (2005): “U.S. and Global Imbalances: Can Dark Matter Prevent a Big Bang?”
• International Monetary Fund: World Economic Outlook Database, October 2010
• O. Jeanne (2007): “International Reserves in Emerging Market Countries: Too Much of a Good Thing?”
• J. Ju , S.-J. Wei (2007): “Domestic Institutions and the Bypass Effect of Financial Globalization” NBER WP 13148
• Kindleberger, Charles (1965): “Balance of Payments Deficits and the International Market for Liquidity” Essays in International Finance, May 1965, 46
• E.G. Mendoza, V. Quadrini, J.-V. Rios-Rull (2009) “Financial Integration, Financial Development, and Global Imbalances” Journal of Political Economy, 2009, vol. 117, no. 3
• C.M. Meissner, A.M. Taylor (2006): “Losing Our Marbles in the New Century? The Great Rebalancing in Historical Perspective”
• M. Obstfeld, K. Rogoff (2009): “Global Imbalances and the Financial Crisis: Products of Common Causes”
• Population Reference Bureau (2010): “China's Rapidly Aging Population” • R.G. Rajan (2010): “Fault Lines” Princeton University Press • R. Skidelsky (2010): “Keynes – The Return of the Master”, Public Affairs,
New York • Z. Song, K. Storesletten, F. Zilibotti (2009): “Growing Like China” • Taylor, J. (2009): “Getting off Track: How Government Actions and
Interventions Caused, Prolonged, and Worsened the Financial Crisis”, Hoover Institution Press, Stanford
• F.E. Warnock, V.C. Warnock (2009):“International Capital Flows and U.S. Interest Rates”
• Wolf (2008): “Fixing Global Finance”, John Hopkins University Press, Baltimore
• D.T. Yang, J. Zhang. S. Zhou (2011): “Why are Saving Rates so High in China?” NBER WP 16771