issn 1473 – 3307 - business school · 2015-01-15 · issn 1473 – 3307 religious fragmentation,...
TRANSCRIPT
Economics Department Discussion Papers Series
ISSN 1473 – 3307
Religious fragmentation, social identity and
cooperation: Evidence from a artefactual field experiment in India
Surajeet Chakravarty, Miguel A. Fonseca, Sudeep Ghosh, Sugata Marjit
Paper number 15/01
URL: http://business-school.exeter.ac.uk/economics/papers/ URL Repec page: http://ideas.repec.org/s/exe/wpaper.html

Religious fragmentation, social identity and cooperation:Evidence from a artefactual field experiment in India∗
Surajeet Chakravarty, Miguel A. Fonseca, Sudeep Ghosh and Sugata Marjit
January 15, 2015
Abstract
We study the role of village-level religious fragmentation on intra- and inter-groupcooperation in India. We report on data on two-player Prisoners Dilemma and StagHunt experiments played by 516 Hindu and Muslim participants in rural India. Ourtreatments are the identity of the two players and the degree of village-level religiousheterogeneity. In religiously-heterogeneous villages, cooperation rates in the PrisonersDilemma are higher when subjects play with another in-group member for both Hindusand Muslims, but to a much lesser extent in the Stag Hunt game. This suggeststhat positive in-group biases operate primarily on the willingness to achieve sociallyefficient outcomes, rather than through beliefs about the actions by one’s counterpart.Interestingly, cooperation rates among people of the same religion are significantlylower in homogeneous villages than in fragmented villages in both games. This islikely because a sense of group identity is only meaningful in the presence of an out-group. This, together with little evidence for out-group prejudice in either game, meansreligious diversity is beneficial.
JEL – classification numbers: C93, D03, H41Keywords: Social Identity, Social Fragmentation, Artefactual Field Experiment.
∗Chakravarty: University of Exeter; Email: [email protected]. Fonseca: Universityof Exeter; Email: [email protected]. Ghosh: Hong Kong Polytechnic University; Email:[email protected]; Marjit: Center for Studies in the Social Sciences, Calcutta, [email protected] gratefully acknowledge financial support from the ESRC grant ES/J018643/1. We thank Jharna Phanda,Sujit Kumar Mondal, Ramkrishna Mondal, Naresh Chandra Mondal, Sk.Md. Basiruddin for their excellentassistance with running the sessions. We thank Avner Ben-Ner, Martin Leroch, Pushkar Maitra, KimPeters, Rohini Somanathan, participants at the 2014 THEEM workshop at the U. of Konstanz, and theIdentity, Public Goods and Development workshop at CSSS Kolkata, as well as seminars at U. of Exeter,HEC Lausanne, and U. of Paderborn for helpful comments and suggestions. All errors are ours alone. Wehave obtained approval to conduct this research from the ethics officer (IRB-equivalent) at the University ofExeter.
1
1 Introduction
Economists have established over the last two decades a negative relationship between social
fragmentation (typically defined as a function of the relative size of different social groups in
the population) and economic performance, in particular public good provision (Easterly and
Levine, 1999; Alesina et al., 1999, 2003; Alesina and La Ferrara, 2005; Banerjee et al., 2005).
There are many possible reasons for this negative relationship: different social groups may
prefer different types of public good (Poterba, 1998); restricting economic transactions to
within a group may also be useful as it reduces informational asymmetries, and increases the
scope for the punishment of transgressors (Greif, 1993; Miguel and Gugerty, 2005). Finally,
individuals may prefer to share a public good with those of their own group and/or dislike
sharing a public good with people from other social groups (Alesina and La Ferrara, 2005).
The purpose of this paper is to determine the extent to which identity-based inter-
group discrimination can explain the negative correlation between social fragmentation and
lower economic performance. We conduct an artefactual field experiment that helps identify
the role of discrimination as one of the root causes of lower economic performance. India
is an ideal setting to study our research question, having a longstanding social structure
characterized by fragmentation along religious lines, as well as a rigid caste system. Issues
such as social exclusion and public good provision (or lack thereof) along religious lines are
widely documented (de Hann, 1997; Sen 2000; Bardhan et al., 2010; Das et al., 2011).1 We
build upon existing household survey work on religious-based social exclusion in villages in
West Bengal, India, and we focus our attention to the problem of religious discrimination
among Muslim and Hindu communities in West Bengal.
When reviewing the literature on the effects of ethnic diversity on economic outcomes,
Alesina and La Ferrara (2005) identify social identity theory as a means to provide micro-
foundations to theoretical explanations for why fragmentation affects economic performance.
Social identity theory argues individuals attach utility to group membership and to the well-
being of fellow group members to the detriment of outsiders — see Akerlof and Kranton
(2000) and Basu (2007) for theoretical analyses of how social identity can affect economic
1This problem even extends to the breakdown of trade across different social groups (Anderson, 2011).
2
decisions. The missing piece to this body of literature is the identification of the underlying
causal mechanism underpinning this phenomenon. This paper presents data from an arte-
factual field experiment examining two channels through which social identity may operate
and influence the relationship between social fragmentation and public good provision.
The first channel is preferences: social identity theory argues that membership of a
social group means individuals display a higher concern for the welfare of fellow ‘in-group’
members than outsiders (Tajfel et al., 1971). Experimental evidence from the lab and field
supports this inter-group discrimination hypothesis in dictator games (Bernhard et al., 2006;
Chen and Li, 2009), distribution games (Klor and Shayo, 2010), and prisoners’ dilemma
games (Goette et al., 2006; Charness et al., 2007), using both artificial and real social groups.
Therefore, individuals should be more likely to cooperate with in-group members, even if
doing so incurs them an economic cost, and particularly so if total welfare within the group
increases as a result. Conversely, individuals may be less likely to cooperate with outsiders.
The net effect is therefore a decline in cooperation as the number of outsiders increases. To
study the role of preferences, we resort to a classic social dilemma, the prisoners’ dilemma.
In this two-player game, cooperation is a strictly dominated strategy for individuals who
care only about their own monetary payoff; but one player can unilaterally increase total
welfare (at a personal cost) by cooperating.2
The second channel concerns beliefs: individuals may only be willing to cooperate on
a common enterprise if they believe others are likely to do so as well. While transaction costs
due incomplete contracts are a feature of many economies, they are a crucial issue in many
developing countries, as in those economies either property rights are not institutionally
assured, or access to legal recourse in case of a dispute may be limited and/or costly (see
Posner, 1998 and references therein). In this context, the belief by an economic agent about
her counterpart’s willingness to abide by an informal agreement is essential for economic
activity to take place. In this context, a sense of group identity could help cooperation to
the extent that individuals believe fellow in-group members are more likely to cooperate
than outsiders. Again, experimental evidence from the lab suggests this may be the case:
2Conditional cooperation is also possible in the prisoners’ dilemma, but players must exhibit other-
regarding preferences for this to be the case in one-shot or finitely-repeated games.
3
Chen and Chen (2011) find that inducing a common group identity increases efficiency in the
minimum-effort game using artificial identities. To study the role of beliefs, we implement
the stag hunt game, in which two players must decide whether or not to cooperate. While
defecting ensures a positive payoff, cooperating only pays off if the other player cooperates
as well; otherwise the payoff from cooperation is zero. This means both players cooperating
can also be an equilibrium of the game, provided players assign high enough probability to
their counterpart doing so. Importantly, a player’s own other-regarding preferences play no
role in determining behavior in this game.
We study the effect of religious identity among Hindu and Muslim groups by varying
the way our subjects are matched with each other. We implement in-group/in-group treat-
ments where Muslim subjects play with fellow Muslim subjects and Hindu subjects play
with fellow Hindu subjects; we also implement in-group/out-group treatments where Hindu
subjects play with Muslim subjects. Finally, we have a control treatment where the iden-
tity of a subject’s match is unknown. To study the effect of fragmentation, we resort to a
quasi-experimental approach. We take religious composition of villages as fixed, based on the
village-level survey on religious fragmentation by Das et al. (2011). We select villages in two
districts in West Bengal which conform to one of three categories: Muslim-dominated, where
over 90% of the population is Muslim; Hindu-dominated, where over 90% of the population
is Hindu; and fragmented, where the Muslim and Hindu communities are roughly equal.3
Our experimental design combines identity treatments with village types to understand how
social identity interacts with fragmentation.
We find clear evidence of in-group favoritism in fragmented villages in the prisoners’
dilemma, in that cooperation rates are higher in in-group matches than in both unknown
and out-group matches. However, we detect no such difference in the stag hunt game.
This suggests that in-group biases manifest themselves more strongly via other-regarding
preferences than through beliefs. We find no evidence of out-group prejudice (defined as
lower cooperation with an out-group member than with an unknown individual) in both the
3Although the Indian census collects village-level data on religious composition, that information is clas-
sified and not available to researchers. We use data from Das et al.’s 2011 household survey in West Bengal
on religious discrimination to select villages.
4
prisoners’ dilemma and stag hunt games.
We also find diversity is largely beneficial. In both games, cooperation rates among
individuals of the same religion are lower in homogeneous villages than fragmented villages.
Furthermore, we find cooperation rates amongst individuals of the same religion in homo-
geneous villages are no different to cooperation rates between two individuals of different
religions in fragmented villages. We attribute this to the fact that diversity makes sub-
jects’ religious identity salient, therefore triggering positive in-group favoritism. In other
words, diversity increases the rate of cooperation within groups, while not triggering lower
cooperation rates across groups.
The rest of the paper is organized as follows. Section 2 gives a brief background
to Hindu-Muslim relations which motivate our study. Section 3 describes the experimental
design and procedures, Section 4 outlines the results and Section 5 discusses the results and
concludes the paper.
2 Background to Hindu-Muslim Relations in India
Studying social identity is complex, especially given the difficulty in isolating the different
identities which play a role in social and economic contexts. A key social institution which
forges an individual’s identity in India is religion. Recent Indian history has witnessed several
episodes which have stoked traditionally tense relations between Hindus and Muslims. The
partition on Bengal along Hindu-Muslim lines in 1905 and the second partition of Bengal into
West Bengal and East Pakistan (now Bangladesh) in 1947, when the modern Indian state
was formed are particularly relevant to our study. In both cases, the mass displacements
of people led to numerous episodes of inter-religious violence (Akbar, 2003; Brass, 2003).
Turner and Brown (1978) suggest that the insecure relationship between Hindus and Muslims
may be because post-partition India is demographically Hindu-dominant and the fact that
politically there has been a reversal of roles, as Muslims provided most of the ruling elite a
couple of centuries earlier. The underlying division between the two religious groups have
often manifested itself in conflict and violence in regular intervals between 1950 and 2000
(Mitra and Ray, 2013). Such regular conflicts suggest that the religious differences are
5
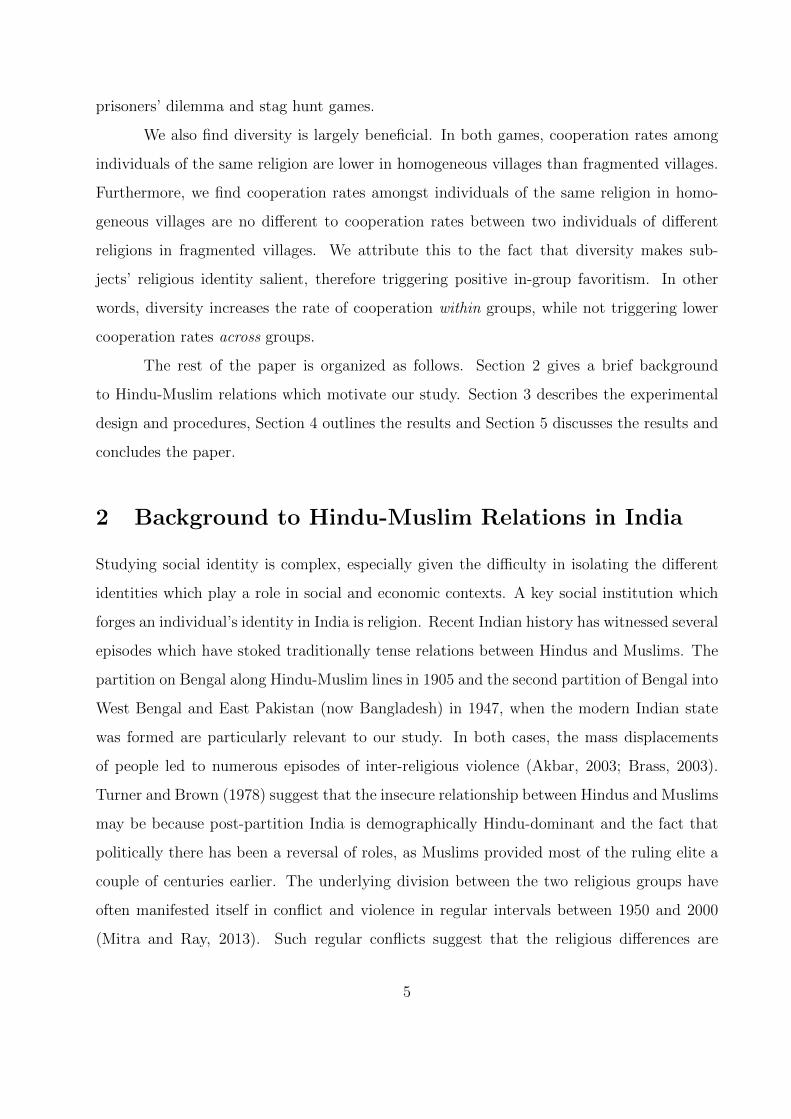
C D C D
C 60, 60 30, 70 C 80, 80 0, 40
D 70, 30 40, 40 D 40, 0 40, 40
PD Game SH Game
Table 1: Payoff matrices for the PD and SH games.
socially entrenched in India. Recently, religious riots have been recorded in 2002 in the state
of Gujarat, as well as in 2010 in West Bengal, the state in which we conduct our study.4
According to the Census of India 2001, 81% of the total Indian population is Hindu
and 13% is Muslim. In West Bengal, the state in which we conduct our study, five districts
have significant Muslim population, two of which are Murshidabad and Burdawan, where we
carry out our experiments. In West Bengal, 65% of the rural population is Hindu and 33%
is Muslim; in urban areas, the proportions are 85% and 13%, respectively. The economic
and social indicators are marginally worse for Muslims in India. In rural areas, there is a
marginal difference in poverty ratios between Muslims and Hindus, but this difference is
larger in urban areas (John and Mutaktar, 2005).5
3 Experimental Design, Procedures and Hypotheses
3.1 The Games
We report data from two games, each of which captures an important feature of social
behavior: the Prisoners’ Dilemma (PD) game and the Stag Hunt (SH) game. We now
briefly describe each game as it was implemented in our experiments, and our approach in
analyzing and interpreting behavior in each of the games.
4See New York Times, 2014 and Times of India, 2010, respectively.5The marginal per capita expenditure index for Muslims (Hindu = 100) for across India is 96.3 and West
Bengal is 87% (Rural) and 91% (Urban). According to the head count data on poverty (Census of India,
2001) in rural West Bengal 37% of Muslims and 29% of Hindus are counted as poor (West Bengal 32%
are poor, while the India head count is 27%). The Hindu-Muslim literacy gap in rural West Bengal is 11%
(Hindus 67% and Muslims 55.6%) and in urban West Bengal it is 18% (Hindus 84%, and Muslims 66%).
6
The PD game is the quintessential social dilemma, in which private incentives run
against the welfare of the group. It is one of the most widely studied games by scholars
investigating the determinants of cooperation. While it is a dominant strategy to defect,
both players achieve the joint payoff-maximizing outcome if they cooperate. The left payoff
matrix in Table 1 reproduces the formulation of the PD game used in our experiment, where
payoffs are denoted in Indian rupees (INR). There are two available strategies, C and D,
which we will denote henceforth as ‘cooperate’ and ‘defect’.6
The experimental economics literature on the PD game reports a non-trivial share
of observations recording the (dominated) strategy of cooperation in one-shot or finitely
repeated interactions (Dawes, 1980; Roth, 1988; Sally, 1995). Cooperation in one-shot or
finitely-repeated PD games has been attributed to other-regarding preferences, such as ef-
ficiency preferences (Reuben and Riedl, 2013; Capraro et al. 2014), or impure altruism
(Andreoni, 1990).7 In our analysis of behavior in the PD game, rather than focusing on
the proportion of Nash equilibrium strategy play, we focus on the proportion of individuals
who chose to cooperate, taking it as a proxy for social preferences, and how that proportion
changes as a function of village fragmentation, in-group/out-group matching and measures
of social identity.
The SH game looks at a different aspect of cooperation: the role of beliefs.8 Unlike
the PD game, cooperation among two self-interested players is a possible Nash equilibrium of
the game. The payoff matrix on the right-hand side of Table 1 reproduces the SH game used
in our experiment, where payoffs are in INR. If a player believes the probability his/her coun-
terpart will cooperate is higher than 1/2, then it is a best-reply to cooperate; if in contrast
6This was not the nomenclature used in the experiment; we employ it in the paper for ease of exposition.
See the Appendix for copies of the instructions and materials.7Reuben and Riedl (2013) and Andreoni (1990) discuss the role of efficiency preferences and impure
altruism in the linear public good game, which is an N-player, continuous version of the prisoners’ dilemma
if b/N < c < b, where b is the marginal per capita return to the public good and c is the cost of contribution.
Kreps et al. (1992) show that cooperation can be attained by rational, self-interested players if there is
incomplete information about player types. However, we can rule out such motivations in our case, since
our experiment only entails one-shot interactions.8The stag hunt game can also be interpreted as the long run payoffs of two players playing particular
infinitely-repeated prisoners’ dilemma games using grim trigger strategies (Skyrms, 2001).
7
the player believes the probability of the counterpart cooperating is lower than 1/2, then it
is a best-reply to defect. These beliefs form the basis of two pure-strategy Nash equilibria:
(C,C) and (D,D). A third mixed-strategy Nash equilibrium exists when both players believe
the probability of cooperation is exactly 1/2.9 The key aspect of this game is that the only
determinant of players’ optimal choice is their belief about their counterpart’s action. Play-
ers’ best reply correspondences in the game may change if players believe their counterpart
has other-regarding preferences, by shifting the threshold probability which defines the mixed
strategy equilibrium. However, they do not shift with changes in their own other-regarding
preferences. Unlike the PD game, off-equilibrium behavior is not efficiency-increasing: co-
operating when the other player does not cannot benefit one’s counterpart. Furthermore,
both equilibria are the only outcomes which minimize income inequality. When analyzing
behavior in the SH game, we focus on the fraction of individuals who choose to cooperate,
taking it as a proxy for beliefs about the likelihood the other player will also cooperate,
and how those beliefs change as a function of village fragmentation and in-group/out-group
matching.
3.2 Experimental Design
To study the effect of religious fragmentation on behavior in our two games, and our partic-
ipants from three different types of villages, based on their religious composition: “Homo-
geneous - Muslim” and “Homogenous - Hindu” villages, where 90% or more of the village’s
population was of one religion, and “Fragmented” villages, where no more than 60% of the
village’s population was of one religion. Village-level data on religious composition is not
publicly available data — the Indian Census data only provides religious composition data
at the district level. To circumvent this problem, we selected our villages based on data from
Das et al. (2011), who conducted a large-scale household survey on the effects of religious
fragmentation in West Bengal villages.10
9Note that while our game retains the payoff structure which defines a stag hunt (i.e. πi(C,C) >
πi(D,C) ≥ πi(D,D) > πi(C,D)), in our case (C,C) is both the risk-dominant and payoff-dominant equilib-
rium.10The village selection was further restricted by whether or not a given village would have an appropriate
building for the running of sessions — we opted for villages that had a primary school. The villages that
8
In order for this quasi-experimental design to be valid, we require village composition
to be exogenous. If people self-select into different villages on the basis of their religious
breakdown, we would not be able to identify the causal mechanism between fragmentation
and behavior. We are confident that our assumption about the exogeneity of villages’ reli-
gious composition holds. In India, rural-rural migration is predominantly due to marriage,
whereby women move to their husband’s village; other motives include family reasons, em-
ployment and education (Bhattacharya, 2000). All of these motives are uncorrelated with a
village’s religious composition. About 70% of our participants reported having been born in
the village or their father being born in the village. Another potential concern with using a
quasi-experimental design is that the participant sample systematically differs on the basis
of the type of village (i.e. homogeneous vs. fragmented) we sampled. We are confident
that this is not the case on the basis of data on observable characteristics we collected from
participants, including gender, age, caste, profession, marital status, place of birth, land
ownership and literacy — see Table 4 in the appendix for details.
In the fragmented villages, we conducted four different types of treatments, each of
which refers to a matching protocol. The M-M treatment consisted of sessions in which all
participants were Muslim. Likewise, the H-H treatment was such that the only participants
were Hindu. The H-M treatment consisted of sessions in which half of the participants were
Hindu and the other half were Muslim, and participants knew they were playing someone
from another religion. Finally, the MIX treatment consisted of sessions with both Hindu
and Muslim participants, but where the religious identity of their match was uncertain. We
elaborate on how we accomplished this when we describe the experimental procedures below.
Table 2 describes the experimental design.
3.3 Participant Recruitment and Experimental Procedures
We employed a mixed-gender, mixed-religion team of local research assistants to recruit
participants and conduct the sessions, so as to minimize any possible experimenter demand
fit our demographic criteria, had a primary school, and whose local authority would allow us to use it were
the following: Alampur, Bhurkunda, Char Mathurapur, Chupi, Domohani, Ganfulia, Gokarno, Hasanpur,
Jhikra, Kanakpara, Kirtipur, Pilsowa, Roshanpur, Shuhari, Sridharpur and Tungi.
9
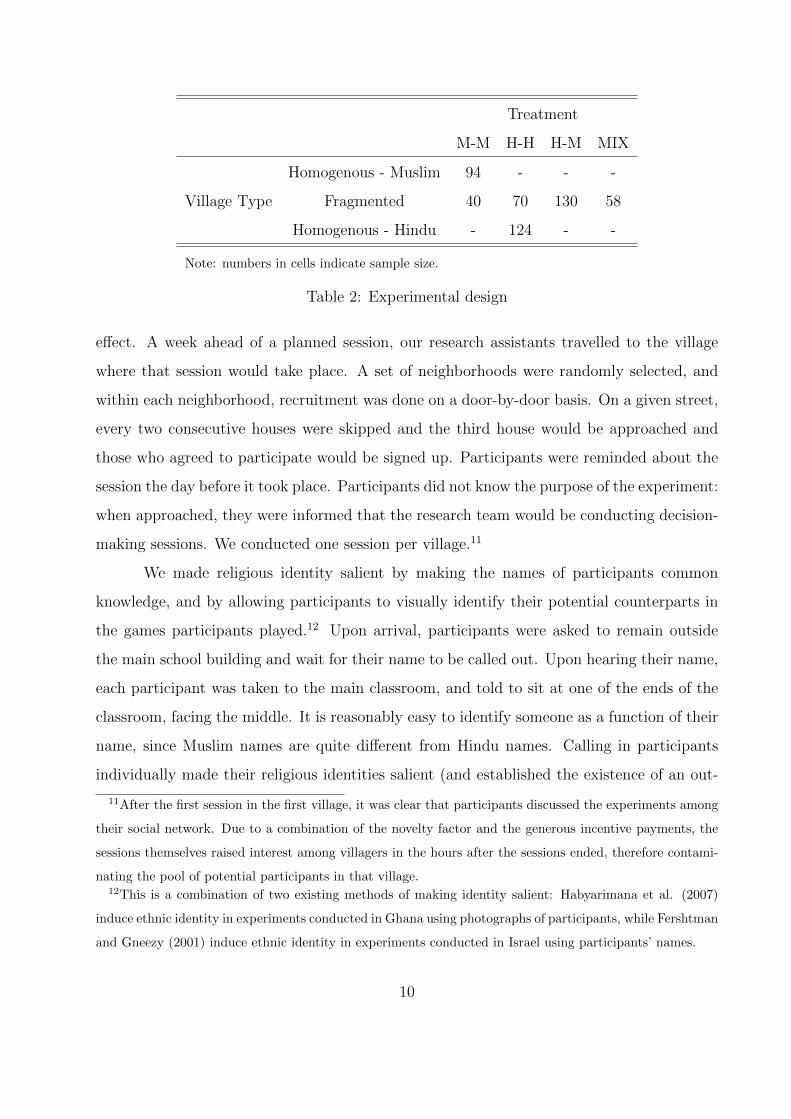
Treatment
M-M H-H H-M MIX
Village Type
Homogenous - Muslim 94 - - -
Fragmented 40 70 130 58
Homogenous - Hindu - 124 - -
Note: numbers in cells indicate sample size.
Table 2: Experimental design
effect. A week ahead of a planned session, our research assistants travelled to the village
where that session would take place. A set of neighborhoods were randomly selected, and
within each neighborhood, recruitment was done on a door-by-door basis. On a given street,
every two consecutive houses were skipped and the third house would be approached and
those who agreed to participate would be signed up. Participants were reminded about the
session the day before it took place. Participants did not know the purpose of the experiment:
when approached, they were informed that the research team would be conducting decision-
making sessions. We conducted one session per village.11
We made religious identity salient by making the names of participants common
knowledge, and by allowing participants to visually identify their potential counterparts in
the games participants played.12 Upon arrival, participants were asked to remain outside
the main school building and wait for their name to be called out. Upon hearing their name,
each participant was taken to the main classroom, and told to sit at one of the ends of the
classroom, facing the middle. It is reasonably easy to identify someone as a function of their
name, since Muslim names are quite different from Hindu names. Calling in participants
individually made their religious identities salient (and established the existence of an out-
11After the first session in the first village, it was clear that participants discussed the experiments among
their social network. Due to a combination of the novelty factor and the generous incentive payments, the
sessions themselves raised interest among villagers in the hours after the sessions ended, therefore contami-
nating the pool of potential participants in that village.12This is a combination of two existing methods of making identity salient: Habyarimana et al. (2007)
induce ethnic identity in experiments conducted in Ghana using photographs of participants, while Fershtman
and Gneezy (2001) induce ethnic identity in experiments conducted in Israel using participants’ names.
10
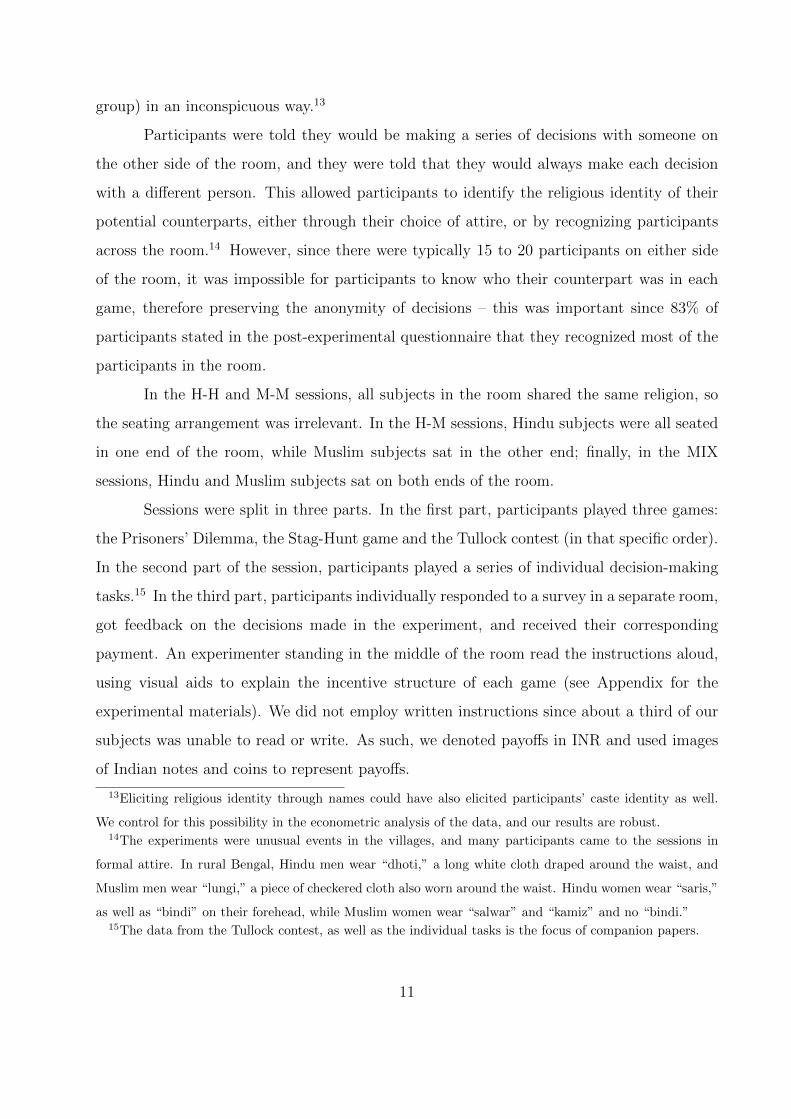
group) in an inconspicuous way.13
Participants were told they would be making a series of decisions with someone on
the other side of the room, and they were told that they would always make each decision
with a different person. This allowed participants to identify the religious identity of their
potential counterparts, either through their choice of attire, or by recognizing participants
across the room.14 However, since there were typically 15 to 20 participants on either side
of the room, it was impossible for participants to know who their counterpart was in each
game, therefore preserving the anonymity of decisions – this was important since 83% of
participants stated in the post-experimental questionnaire that they recognized most of the
participants in the room.
In the H-H and M-M sessions, all subjects in the room shared the same religion, so
the seating arrangement was irrelevant. In the H-M sessions, Hindu subjects were all seated
in one end of the room, while Muslim subjects sat in the other end; finally, in the MIX
sessions, Hindu and Muslim subjects sat on both ends of the room.
Sessions were split in three parts. In the first part, participants played three games:
the Prisoners’ Dilemma, the Stag-Hunt game and the Tullock contest (in that specific order).
In the second part of the session, participants played a series of individual decision-making
tasks.15 In the third part, participants individually responded to a survey in a separate room,
got feedback on the decisions made in the experiment, and received their corresponding
payment. An experimenter standing in the middle of the room read the instructions aloud,
using visual aids to explain the incentive structure of each game (see Appendix for the
experimental materials). We did not employ written instructions since about a third of our
subjects was unable to read or write. As such, we denoted payoffs in INR and used images
of Indian notes and coins to represent payoffs.
13Eliciting religious identity through names could have also elicited participants’ caste identity as well.
We control for this possibility in the econometric analysis of the data, and our results are robust.14The experiments were unusual events in the villages, and many participants came to the sessions in
formal attire. In rural Bengal, Hindu men wear “dhoti,” a long white cloth draped around the waist, and
Muslim men wear “lungi,” a piece of checkered cloth also worn around the waist. Hindu women wear “saris,”
as well as “bindi” on their forehead, while Muslim women wear “salwar” and “kamiz” and no “bindi.”15The data from the Tullock contest, as well as the individual tasks is the focus of companion papers.
11
A potential pitfall of running experiments in which subjects do multiple tasks is that
there may be contamination of behavior across games, such as order effects, wealth effects,
behavioral spillovers or hedging. Order effects are certainly possible in our experiment; while
they would affect cooperation levels, the hypotheses of interest are on differences in behavior
across villages and/or treatments, all of which were exposed to the same order of play. We
minimized the scope for wealth, spillover and hedging effects in our experiment by (a) not
informing subjects of the games they were about to play ahead of time; (b) not providing
feedback between games; (c) implementing a turnpike matching scheme, whereby subject i
was never matched with the same person twice, and any of i’s matches would never play
each other. Subjects were reminded of these features at the start of each game. To check
that subjects may have hedged their decisions in the two games, we computed the Spearman
correlation coefficient of behavior in the PD and SH games using the full sample, which
equalled 0.06 (p = 0.161); the Fisher’s exact test also did not reject the null hypothesis of
independence of behavior in the two games (p = 0.186).16
The first part of the session took approximately 60 minutes and sessions as a whole
lasted on average 3 hours. Average payment for the PD game was INR 53.26 ($0.86), average
payment for the SH game was INR 43.17 ($0.70) and average payment for the whole session
was INR 598.70 ($9.65).17
3.4 Hypotheses
We are primarily interested in studying how fragmentation along religious lines affects coop-
eration.18 Even though each game measures a different motive for cooperation (i.e. prefer-
ences and beliefs), we will pool our hypotheses for both games into one hypothesis for ease of
exposition. Note that in both games, social identity has the same predicted effect on cooper-
16We found similar results when analyzing the Muslim and Hindu sub-samples. In the Muslim (Hindu)
sample, the Spearman correlation coefficient on cooperation in the PD and SH games equalled 0.063, p =
0.337(0.059, p = 0.316); the Fisher’s exact test on the null of independence yielded a p-value of 0.391 (0.379).17The average daily wage for a rural worker in West Bengal in 2011 ranged from INR 105 ($1.74) for
an unskilled female worker to INR 297.50 ($4.93) for a male well digger; in most agricultural occupations
average daily wages were approximately INR 130 ($2.15), Government of India (2012).18Please see the Appendix for a brief theoretical outline underpinning the hypotheses.
12
ation. First, we fix village-level religious fragmentation, and we examine in-group/out-group
differences in behavior. Second, we restrict interactions to be only among in-group members
and we study the effect of village-level fragmentation by comparing fragmented villages to
homogenous ones. We will now state our alternative hypotheses, given that our general null
hypothesis is that behavior will not differ either by treatment or by village type.
Our first hypothesis follows from a well-established literature in social psychology
and experimental behavioral economics, which establishes that individuals display favoritism
towards members of their social group relative to an out-group (Tajfel et al., 1971). Chen
and Li (2009) propose a stricter definition of in-group favoritism which is a higher concern for
the welfare of an in-group member than for the welfare of someone of an unknown affiliation.
Hypothesis 1a (weak form of in-group favoritism): In fragmented villages, there will
be higher frequencies of cooperation in H-H/M-M than in H-M.
Hypothesis 1b (strong form of in-group favoritism): In fragmented villages, there will
be higher frequencies of cooperation in H-H/M-M than in MIX.
The existence of in-group biases does not necessarily mean that there will be negative
out-group biases, either theoretically (Allport, 1954; Brewer, 1999), or empirically (Morita
and Servatka, 2013). Nevertheless, Chen and Li’s taxonomy defines out-group prejudice as
a lower degree of concern for the welfare of an out-group member than that of someone of
an unknown affiliation. In our experiment, the relevant treatments for this comparison are
the H-M and MIX treatments, respectively. On that basis, we state our next hypothesis.
Hypothesis 2 (out-group prejudice): In fragmented villages, there will be higher fre-
quencies of cooperation in MIX than in H-M.
We now turn to the test of whether or not social identity can account for the effect
of fragmentation. Brewer (1991) theorizes that in-group identification is a function of two
competing needs. On the one hand, individuals have a need for inclusion: an isolated
individual would seek to identify herself with a collective. On the other hand, people require
a degree of distinctiveness: members of very large groups may search for alternative identities
through which they can affirm their uniqueness. It follows that subjects’ sense of religious
13
identity should be less salient in villages where one religion dominates: individuals ought
to identify with groups which provide them with a better sense of uniqueness. In contrast,
in-group identification should be strongest in fragmented villages, since not only there is
an out-group to provide a comparison, but also because both religious groups are equally
numerous within the village. Therefore, we should find more evidence of in-group biases in
fragmented villages than in homogeneous villages. This is our third and final hypothesis.
Hypothesis 3: There will be higher frequencies of cooperation in fragmented villages than
in homogeneous villages in both H-H and M-M treatments.
4 Results
We start by examining behavior in the PD game, which will measure the extent to which re-
ligious identity affects individuals’ preferences for efficiency. We then analyze the data from
the SH game, which measures the extent to which identity affects beliefs about counterparts’
cooperation intentions. We complete the analysis by combining our behavioral data with
post-experimental survey data which includes measures of attitudes towards out-group mem-
bers and socio-economic characteristics at both individual and village level. In our analysis,
we use each individual’s decision as an independent variable and we report two-sided tests
throughout.
4.1 The PD Game
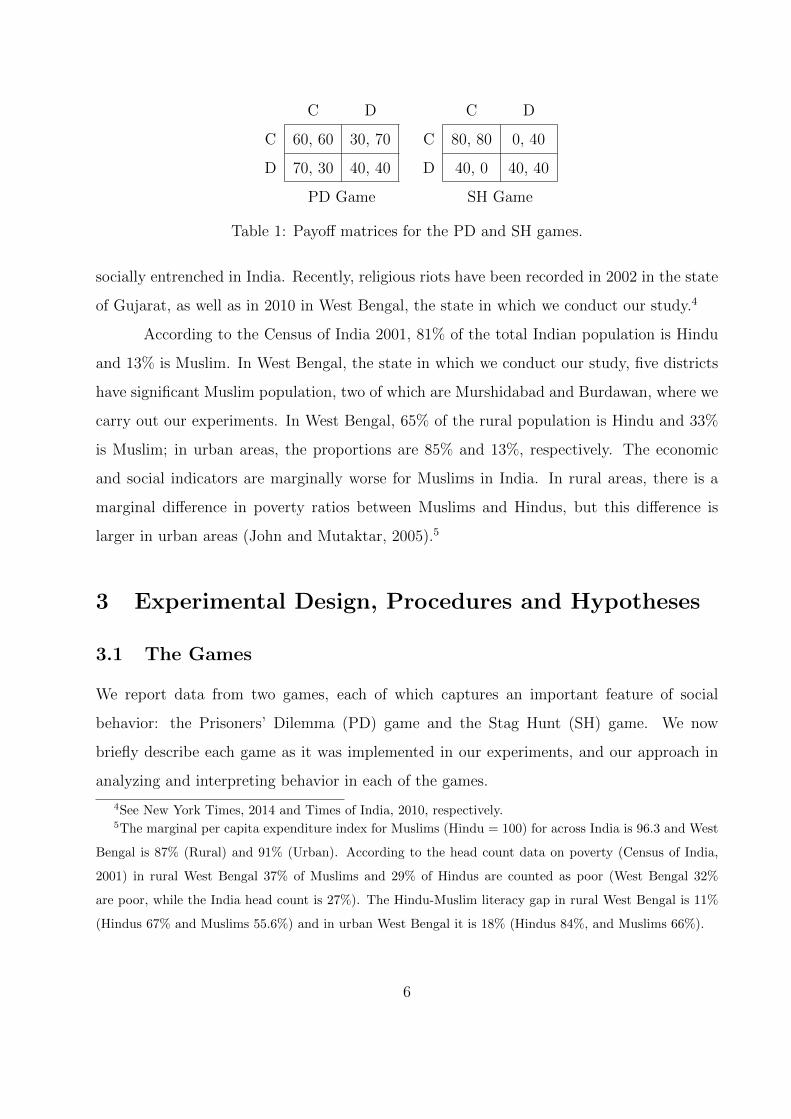
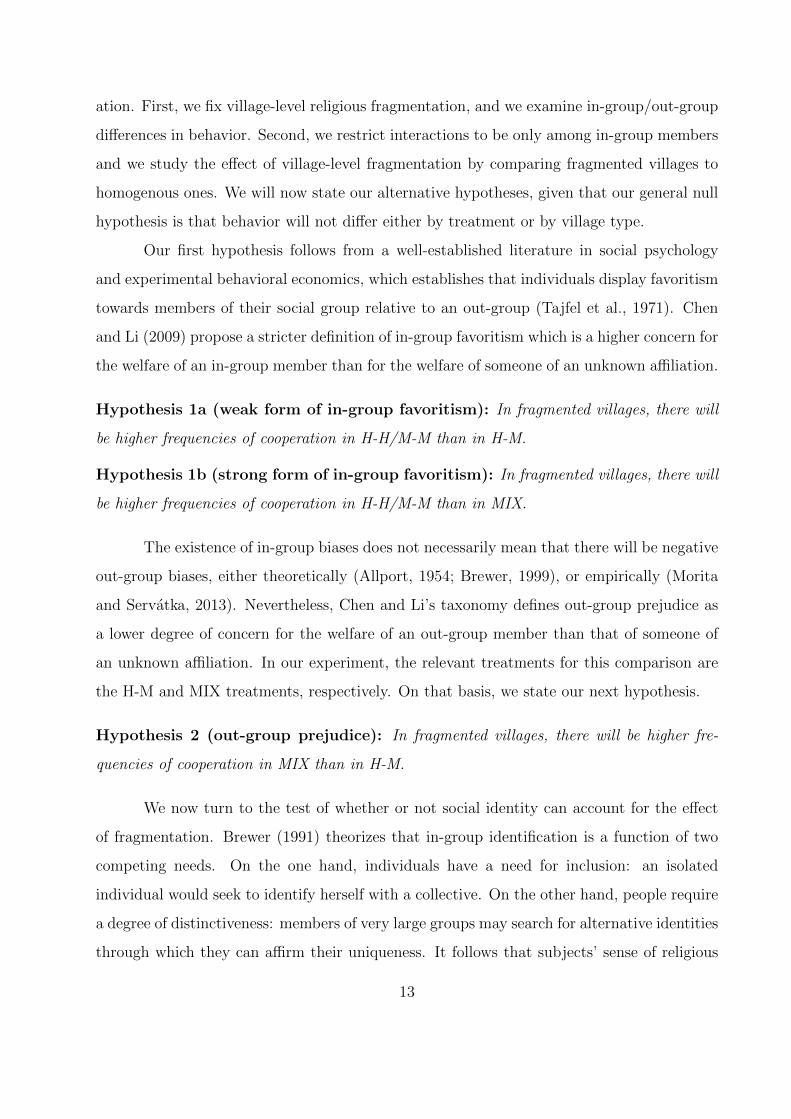
Figure 1 displays the fraction of cooperation decisions in the PD game in fragmented villages
as a function of the identity of the decision-maker’s counterpart. In order to make the ap-
propriate comparisons, we divide the H-M treatment data into H-M - Muslim, corresponding
to the Muslim participants’ decisions, and H-M - Hindu, referring to the Hindu participants’
decisions (likewise for MIX).
We start by examining the existence of in-group biases. As predicted, the average
cooperation rates are higher when subjects play an in-group member than when they play an
out-group member. Cooperation rates by Muslim subjects are 34 percentage points higher
14
when playing an in-group member (M-M, 0.95) than when playing an out-group member
(H-M, 0.64), p = 0.001, Fisher’s exact test (henceforth FET); cooperation rates by Hindu
subjects are higher in H-H (0.80) than H-M (0.66) by 14 percentage points (p = 0.023, FET).
Average cooperation in the in-group/in-group matches (H-H or M-M) is also higher than that
0.2
.4.6
.81
Fra
ctio
n o
f C
oo
pe
ratio
n D
eci
sio
ns
M−M H−M − Muslim MIX − Muslim H−H H−M − Hindu MIX − Hindu
Figure 1: Fraction of cooperation decisions in the PD game – fragmented villages.
in the case where the identity of the counterpart is uncertain (MIX). The cooperation rate
among Muslim participants is 37 percentage points lower in MIX than in M-M (p < 0.001,
FET), while among Hindu participants the cooperation rate is 30 percentage points lower in
MIX than in H-H (p = 0.004, FET).
Observation 1: Cooperation rates in the PD game are higher when Hindu or Muslim
participants play with an in-group member than when they play with an out-group member
or with an unknown group member.
We now turn to out-group biases, and we compare cooperation rates between the
H-M and MIX treatment. While the rates of cooperation are nominally higher in H-M than
MIX for both religious groups, in neither case are these differences statistically significant
(Muslim: p = 0.477; Hindu: p = 0.383, FET). Finally, we compare behavior across the two
religious identities: while we observe higher cooperation rates among Muslims than Hindus
when they are playing an in-group subject (p = 0.047, Fisher’s exact test), we observe no
15
0.2
.4.6
.81
Fra
ctio
n o
f C
oo
pe
ratio
n D
eci
sio
ns
M−M H−H
Homogeneous Villages
Fragmented Villages
Homogeneous Villages
Fragmented Villages
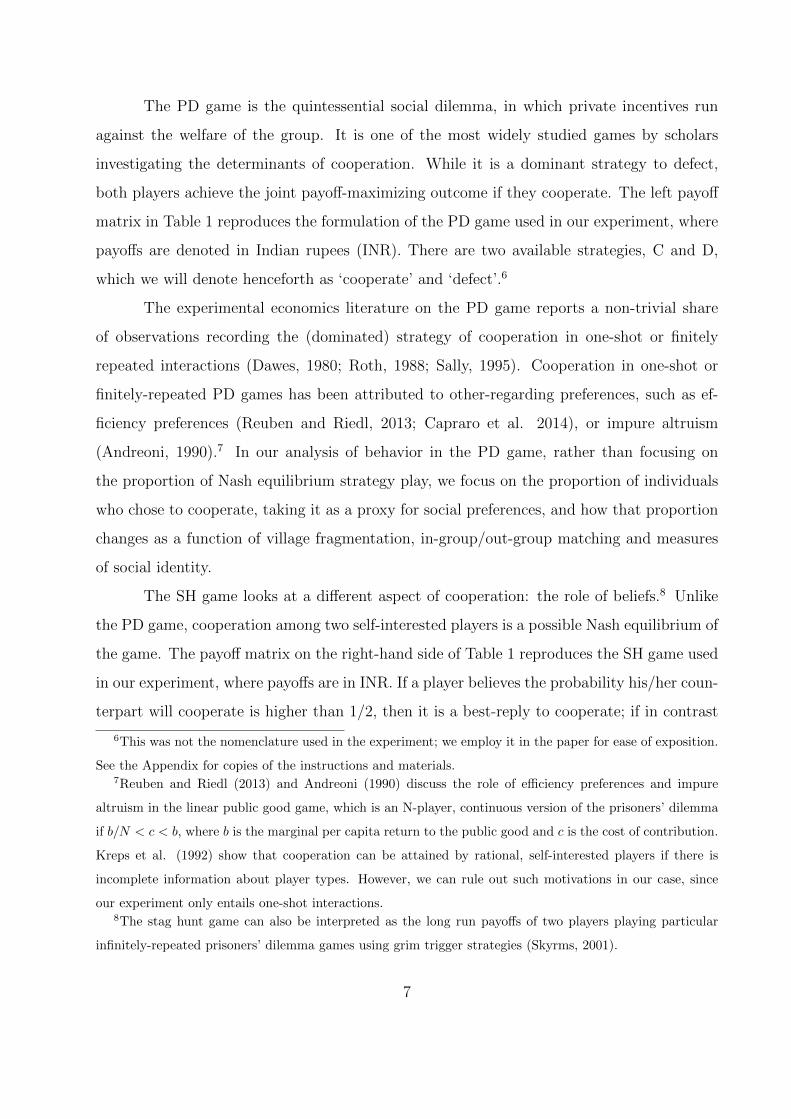
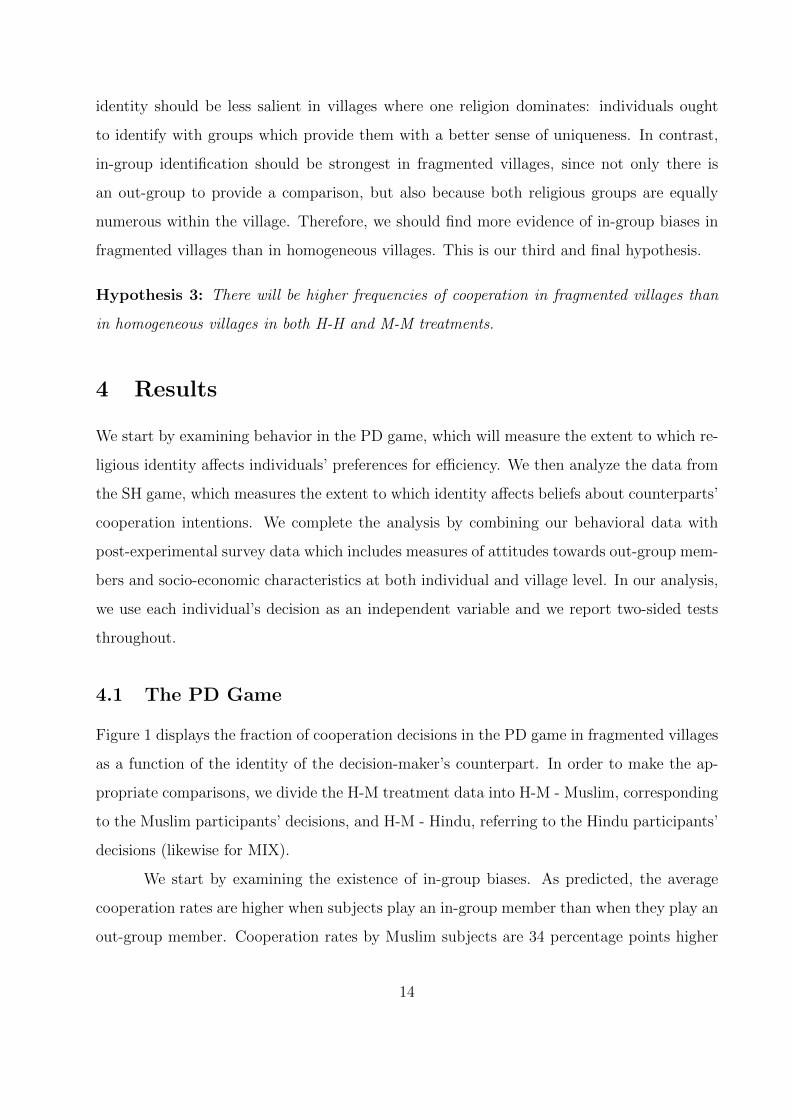
Figure 2: Fraction of cooperation decisions in the PD game – homogeneous vs. fragmented
villages.
differences in cooperation rates between the two religious group in either the H-M (p = 0.586,
FET) or MIX (p = 0.605, FET) treatments.
Observation 2: Cooperation rates in the PD game are the same when Hindu or Muslim
participants play either with an out-group member or with an unknown group member.
We now turn to the effect of village-level fragmentation on behavior within in-group
members. Recall that we hypothesized that group identities should be more salient in frag-
mented villages, which in turn should mean higher cooperation rates in fragmented villages.
Figure 2 displays the fraction of cooperation decisions in the PD game among in-group/in-
group matches, comparing fragmented villages to homogeneous villages.19 Among Muslim
subjects, there is a significantly higher rate of cooperation in fragmented villages (0.95) than
in homogeneous villages (0.62, p < 0.001, FET). Among Hindu subjects, there is a smaller
difference in cooperation rates between fragmented (0.80) and homogeneous (0.66) villages,
which is only marginally significant (p = 0.099, FET).
Observation 3: Cooperation rates in the PD game are higher in fragmented villages than
19Recall that we could not collect data on H-M or MIX treatments in homogeneous villages, since there
were very few or no members of the minority group in those villages.
16
homogeneous villages, both among Muslim and Hindu participants.
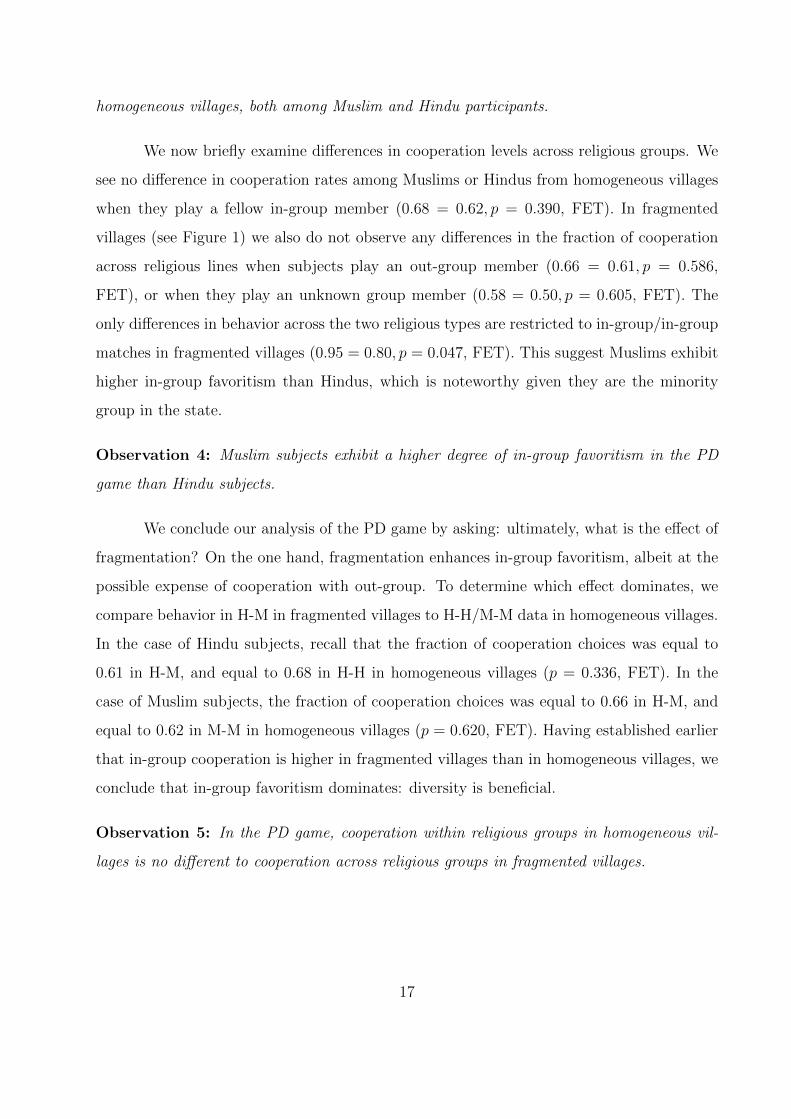
We now briefly examine differences in cooperation levels across religious groups. We
see no difference in cooperation rates among Muslims or Hindus from homogeneous villages
when they play a fellow in-group member (0.68 = 0.62, p = 0.390, FET). In fragmented
villages (see Figure 1) we also do not observe any differences in the fraction of cooperation
across religious lines when subjects play an out-group member (0.66 = 0.61, p = 0.586,
FET), or when they play an unknown group member (0.58 = 0.50, p = 0.605, FET). The
only differences in behavior across the two religious types are restricted to in-group/in-group
matches in fragmented villages (0.95 = 0.80, p = 0.047, FET). This suggest Muslims exhibit
higher in-group favoritism than Hindus, which is noteworthy given they are the minority
group in the state.
Observation 4: Muslim subjects exhibit a higher degree of in-group favoritism in the PD
game than Hindu subjects.
We conclude our analysis of the PD game by asking: ultimately, what is the effect of
fragmentation? On the one hand, fragmentation enhances in-group favoritism, albeit at the
possible expense of cooperation with out-group. To determine which effect dominates, we
compare behavior in H-M in fragmented villages to H-H/M-M data in homogeneous villages.
In the case of Hindu subjects, recall that the fraction of cooperation choices was equal to
0.61 in H-M, and equal to 0.68 in H-H in homogeneous villages (p = 0.336, FET). In the
case of Muslim subjects, the fraction of cooperation choices was equal to 0.66 in H-M, and
equal to 0.62 in M-M in homogeneous villages (p = 0.620, FET). Having established earlier
that in-group cooperation is higher in fragmented villages than in homogeneous villages, we
conclude that in-group favoritism dominates: diversity is beneficial.
Observation 5: In the PD game, cooperation within religious groups in homogeneous vil-
lages is no different to cooperation across religious groups in fragmented villages.
17
0.2
.4.6
.81
Fra
ctio
n o
f C
oo
pe
ratio
n D
eci
sio
ns
M−M H−M − Muslim MIX − Muslim H−H H−M − Hindu MIX − Hindu
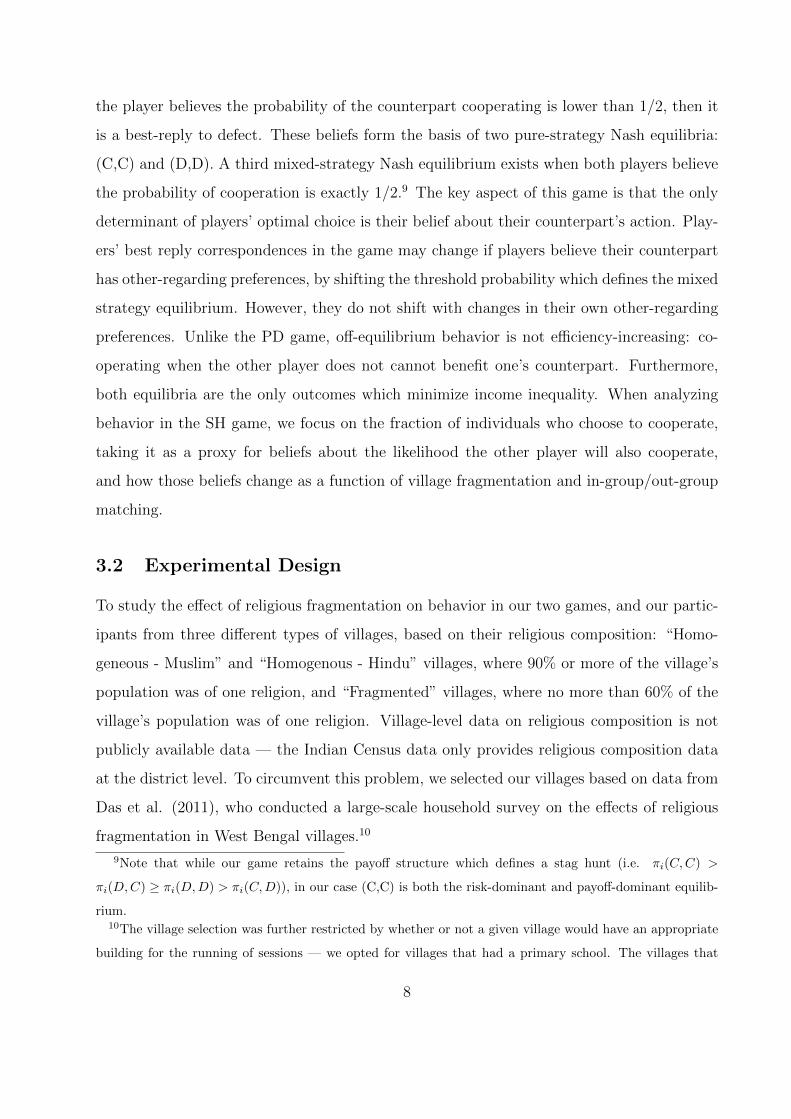
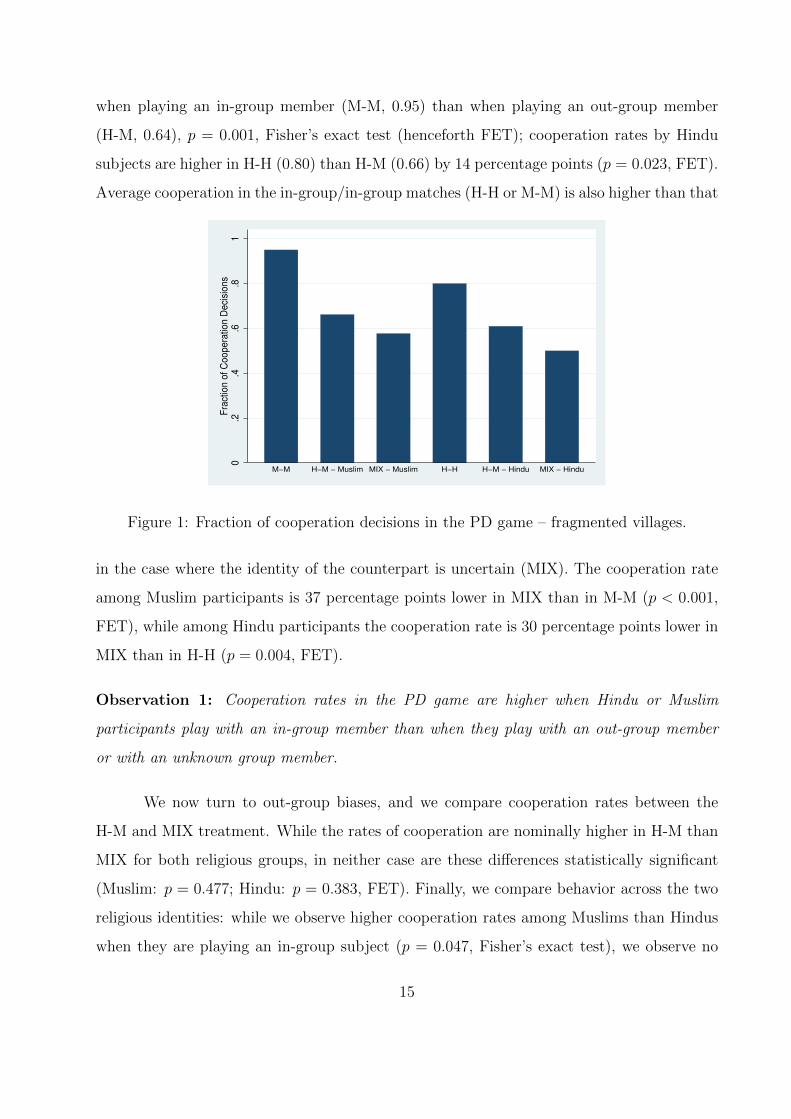
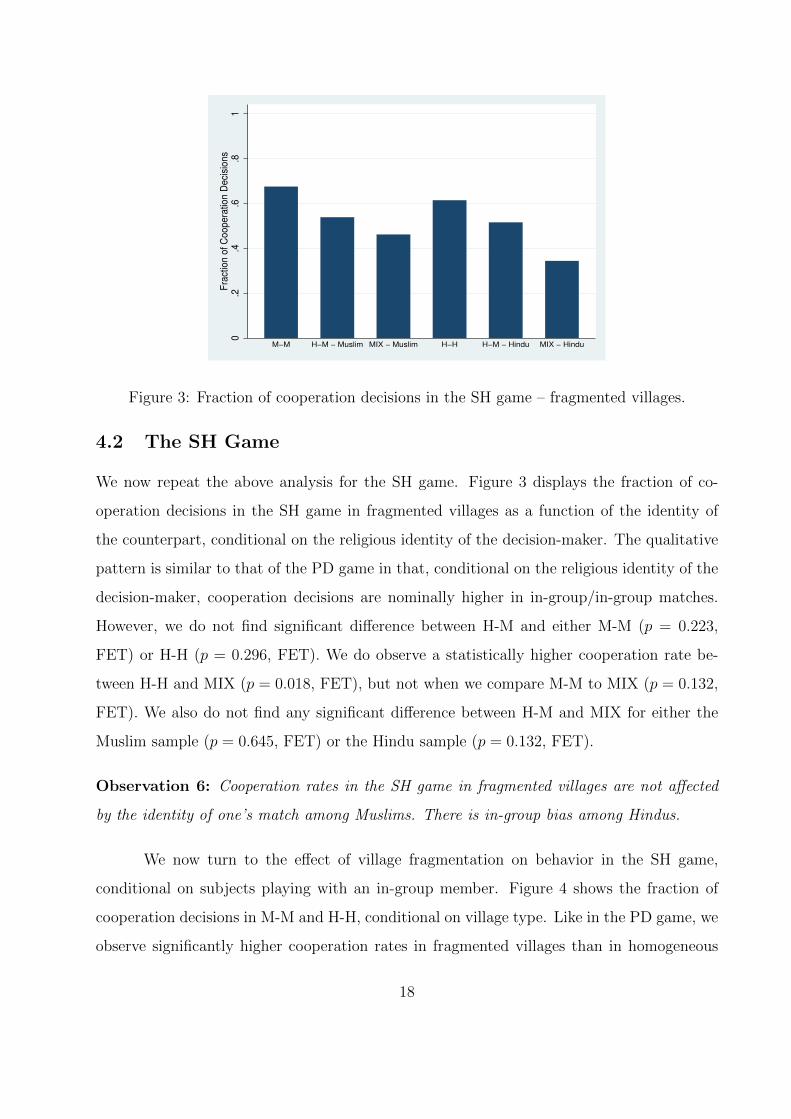
Figure 3: Fraction of cooperation decisions in the SH game – fragmented villages.
4.2 The SH Game
We now repeat the above analysis for the SH game. Figure 3 displays the fraction of co-
operation decisions in the SH game in fragmented villages as a function of the identity of
the counterpart, conditional on the religious identity of the decision-maker. The qualitative
pattern is similar to that of the PD game in that, conditional on the religious identity of the
decision-maker, cooperation decisions are nominally higher in in-group/in-group matches.
However, we do not find significant difference between H-M and either M-M (p = 0.223,
FET) or H-H (p = 0.296, FET). We do observe a statistically higher cooperation rate be-
tween H-H and MIX (p = 0.018, FET), but not when we compare M-M to MIX (p = 0.132,
FET). We also do not find any significant difference between H-M and MIX for either the
Muslim sample (p = 0.645, FET) or the Hindu sample (p = 0.132, FET).
Observation 6: Cooperation rates in the SH game in fragmented villages are not affected
by the identity of one’s match among Muslims. There is in-group bias among Hindus.
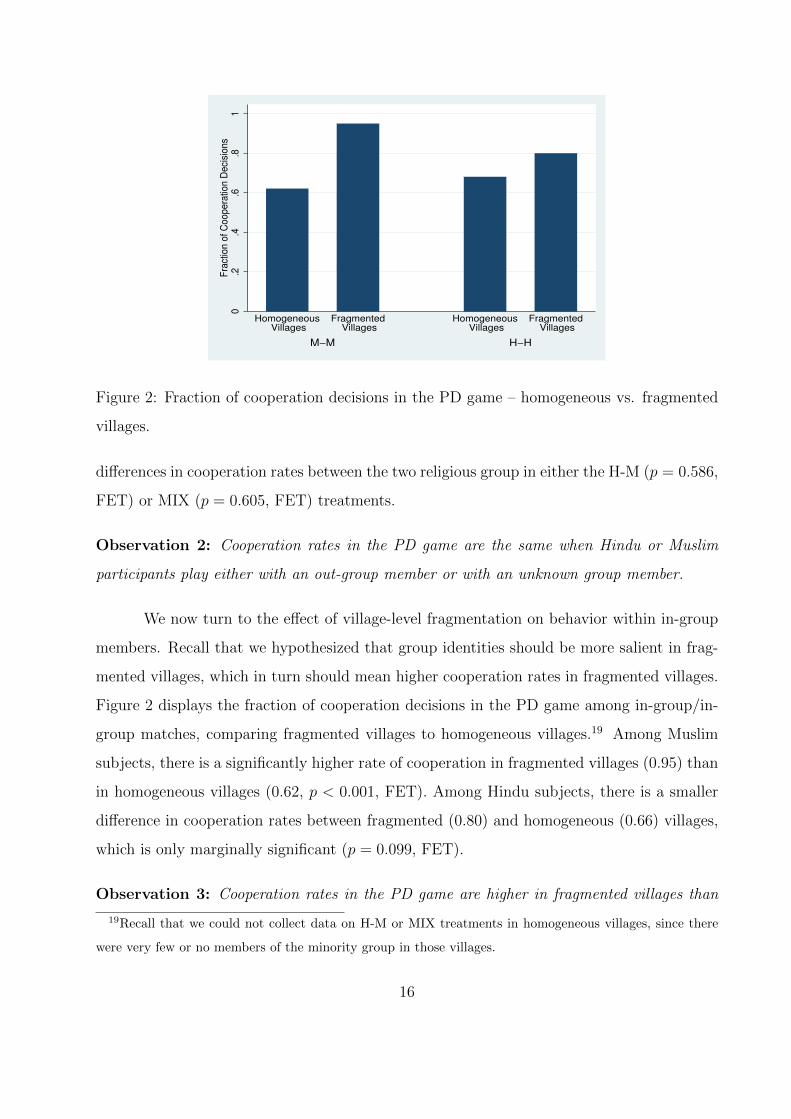
We now turn to the effect of village fragmentation on behavior in the SH game,
conditional on subjects playing with an in-group member. Figure 4 shows the fraction of
cooperation decisions in M-M and H-H, conditional on village type. Like in the PD game, we
observe significantly higher cooperation rates in fragmented villages than in homogeneous
18
0.2
.4.6
.81
Fra
ctio
n o
f C
oo
pe
ratio
n D
eci
sio
ns
M−M H−H
Homogeneous Villages
Fragmented Villages
Homogeneous Villages
Fragmented Villages
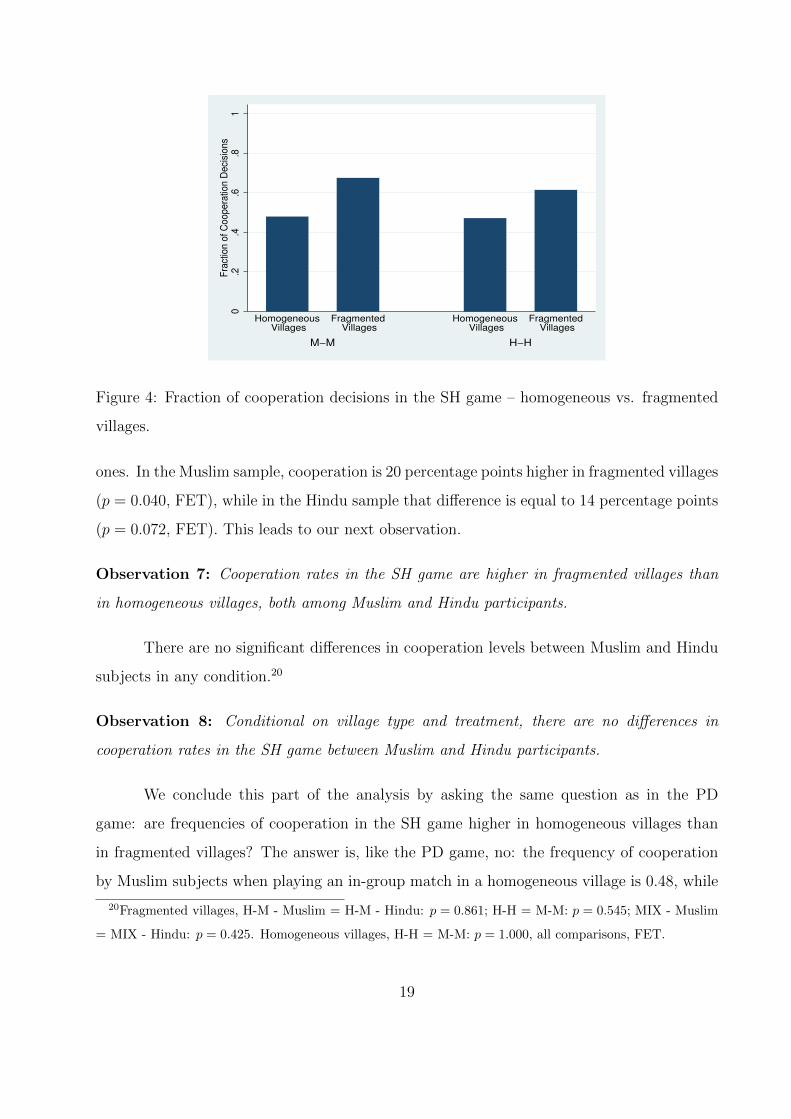
Figure 4: Fraction of cooperation decisions in the SH game – homogeneous vs. fragmented
villages.
ones. In the Muslim sample, cooperation is 20 percentage points higher in fragmented villages
(p = 0.040, FET), while in the Hindu sample that difference is equal to 14 percentage points
(p = 0.072, FET). This leads to our next observation.
Observation 7: Cooperation rates in the SH game are higher in fragmented villages than
in homogeneous villages, both among Muslim and Hindu participants.
There are no significant differences in cooperation levels between Muslim and Hindu
subjects in any condition.20
Observation 8: Conditional on village type and treatment, there are no differences in
cooperation rates in the SH game between Muslim and Hindu participants.
We conclude this part of the analysis by asking the same question as in the PD
game: are frequencies of cooperation in the SH game higher in homogeneous villages than
in fragmented villages? The answer is, like the PD game, no: the frequency of cooperation
by Muslim subjects when playing an in-group match in a homogeneous village is 0.48, while
20Fragmented villages, H-M - Muslim = H-M - Hindu: p = 0.861; H-H = M-M: p = 0.545; MIX - Muslim
= MIX - Hindu: p = 0.425. Homogeneous villages, H-H = M-M: p = 1.000, all comparisons, FET.
19
the frequency of cooperation by Muslim subjects when playing with a Hindu counterpart in
a fragmented village is 0.53 (p = 0.522, FET). Likewise, the cooperation frequency by Hindu
subjects when playing the SH game in homogeneous villages is 0.47, while their cooperation
frequency when playing Muslim subjects in fragmented villages is 0.52 (p = 0.644, FET). In
short, fragmented villages have higher cooperation rates when players belong to the same
religious group, and no worse cooperation rates when players are from different groups.
Diversity is again beneficial.
Observation 9: In the SH game, cooperation rates within religious groups in homogeneous
villages are no different to cooperation rates across religious groups in fragmented villages.
4.3 Individual Heterogeneity and Strength of Affiliation
We now extend our analysis of behavior by introducing individual-level and village-level
heterogeneity as potential drivers of behavior, using data from our post-experimental sur-
vey. In addition to socio-demographic information, we also collected several measures which
proxy a sense of affiliation to different social groups. These included national-level iden-
tity, village-level identity, and religious identity. We also collected a number of measures of
individual attitudes towards out-group members, where out-groups are defined along caste
or religious lines. These included questions on attitudes towards inter-religious marriage,
or how participants would feel if their neighbor would profess another religion or is of a
different caste.21 We also measured attitudes towards religious integration in school, and
perceptions of religious diversity in their village. For details on the questionnaire, please see
the Appendix.
Interestingly, our measures of in-group affiliation were remarkably consistent across
our sample: over 90% of participants identified themselves along national and religious lines,
and less than 5% identified themselves with their village (despite almost 70% of our partici-
pants stating being born in their village). Ideally, we would have wanted to have two distinct
measures of affiliation, one regarding the in-group, and the other regarding the out-group,
since the existence of an in-group bias does not imply a negative out-group bias (Brewer,
21Muslims and Hindus typically reside in different areas of a given village, as do Hindus of different castes.
20

1991). The lack of heterogeneity in in-group attitudes does not allow us to measure econo-
metrically their effect on behavior, so we are left with measures of out-group bias. We did,
however, get some variation on our measures of out-group attitudes, which allows us to ana-
lyze how they correlate with behavior when subjects are matched with an out-group player.
We estimated the Logit model outlined in equation (1):
Pr(Cgi = 1|X) = exp(X)/[1 + exp(X)] (1)
where our dependent variable, Cgi , is the decision by player i to cooperate in game g. In the
PD and SH game, this variable equals one if participant i chose C and zero otherwise, while
X is the vector of independent variables.
We consider two specifications of this model. The restricted version of our econometric
model replicates the analysis done so far, and X only includes treatment dummies M-M, H-
H and H-M (MIX is the omitted category), plus the variable Muslim, which equals one if
subject i is Muslim, and its interaction with H-M.
In the unrestricted version of our econometric model, X also encompasses a number
of different variables from our post-experimental survey, which we now describe. Our first
variable, DisOGi measures attitudes towards those of a different religion; it equals one if
participant i stated disliking members of another religion (either Hindu or Muslim) and 0
otherwise. We interact it with the H-M treatment dummy to measure the effect of out-group
attitudes on behavior towards the out-group.
Subjects also reported if they belonged to one of the following categories: SC (Sched-
uled Classes, sometime denoted in contemporary literature as ‘Dalits’), ST (Scheduled
Tribes) and OBC (Other Backward Classes). These social groups encompass historically
disadvantaged people, who have recognition in the Indian Constitution and benefit from
widespread affirmative action policies and assured political representation. These groups,
particularly OBCs, exist across religious lines (Sachar Committee Report, 2006).22 Based
on this information, we constructed the variable PropMyCastei, which is the proportion
22The Census has collected data on OBCs among Muslim in response to the Mandal Commission Report
in 1980 that recommended the inclusion of scheduled classes (SCs) and other backward classes (OBCs) from
the Muslim communities in Government of Indias affirmative action programs. The 1901 Census of India
classified the Muslims in India in three categories: the Ashrafs, Muslims who could trace their lineage to
21
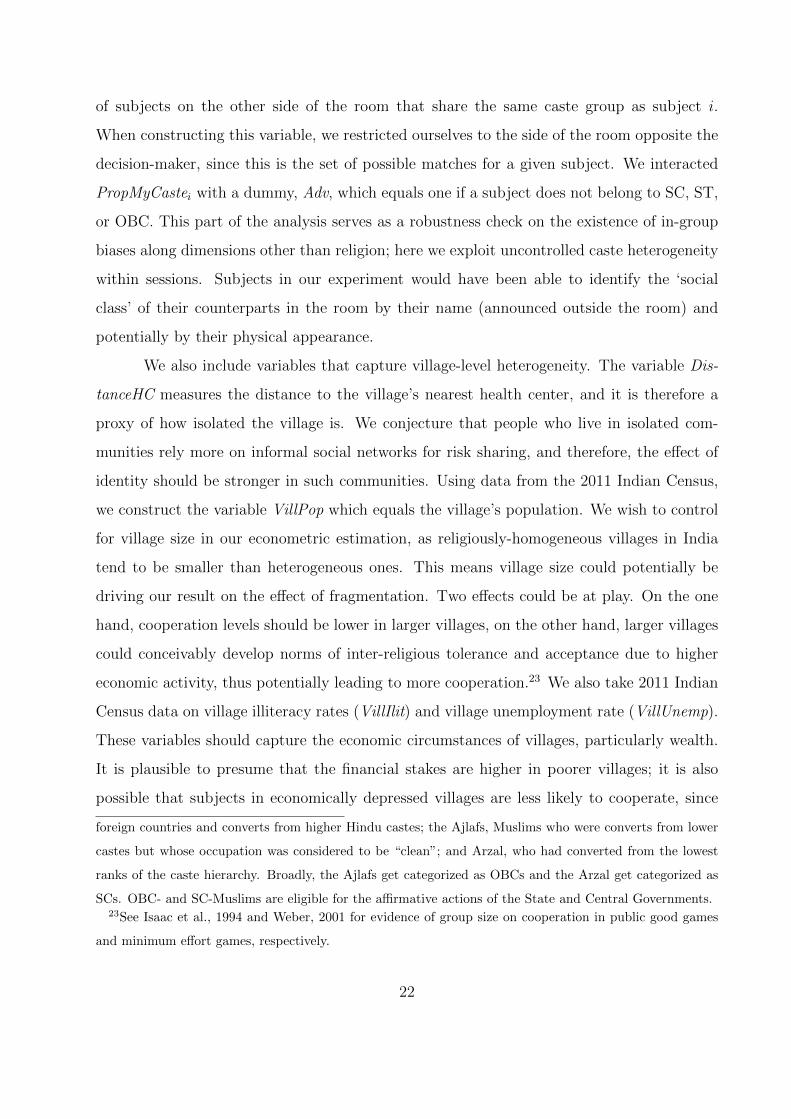
of subjects on the other side of the room that share the same caste group as subject i.
When constructing this variable, we restricted ourselves to the side of the room opposite the
decision-maker, since this is the set of possible matches for a given subject. We interacted
PropMyCastei with a dummy, Adv, which equals one if a subject does not belong to SC, ST,
or OBC. This part of the analysis serves as a robustness check on the existence of in-group
biases along dimensions other than religion; here we exploit uncontrolled caste heterogeneity
within sessions. Subjects in our experiment would have been able to identify the ‘social
class’ of their counterparts in the room by their name (announced outside the room) and
potentially by their physical appearance.
We also include variables that capture village-level heterogeneity. The variable Dis-
tanceHC measures the distance to the village’s nearest health center, and it is therefore a
proxy of how isolated the village is. We conjecture that people who live in isolated com-
munities rely more on informal social networks for risk sharing, and therefore, the effect of
identity should be stronger in such communities. Using data from the 2011 Indian Census,
we construct the variable VillPop which equals the village’s population. We wish to control
for village size in our econometric estimation, as religiously-homogeneous villages in India
tend to be smaller than heterogeneous ones. This means village size could potentially be
driving our result on the effect of fragmentation. Two effects could be at play. On the one
hand, cooperation levels should be lower in larger villages, on the other hand, larger villages
could conceivably develop norms of inter-religious tolerance and acceptance due to higher
economic activity, thus potentially leading to more cooperation.23 We also take 2011 Indian
Census data on village illiteracy rates (VillIlit) and village unemployment rate (VillUnemp).
These variables should capture the economic circumstances of villages, particularly wealth.
It is plausible to presume that the financial stakes are higher in poorer villages; it is also
possible that subjects in economically depressed villages are less likely to cooperate, since
foreign countries and converts from higher Hindu castes; the Ajlafs, Muslims who were converts from lower
castes but whose occupation was considered to be “clean”; and Arzal, who had converted from the lowest
ranks of the caste hierarchy. Broadly, the Ajlafs get categorized as OBCs and the Arzal get categorized as
SCs. OBC- and SC-Muslims are eligible for the affirmative actions of the State and Central Governments.23See Isaac et al., 1994 and Weber, 2001 for evidence of group size on cooperation in public good games
and minimum effort games, respectively.
22
public good provision in those villages may be lower. Finally, Malei is a gender dummy and
Agei is the reported age of subject i.
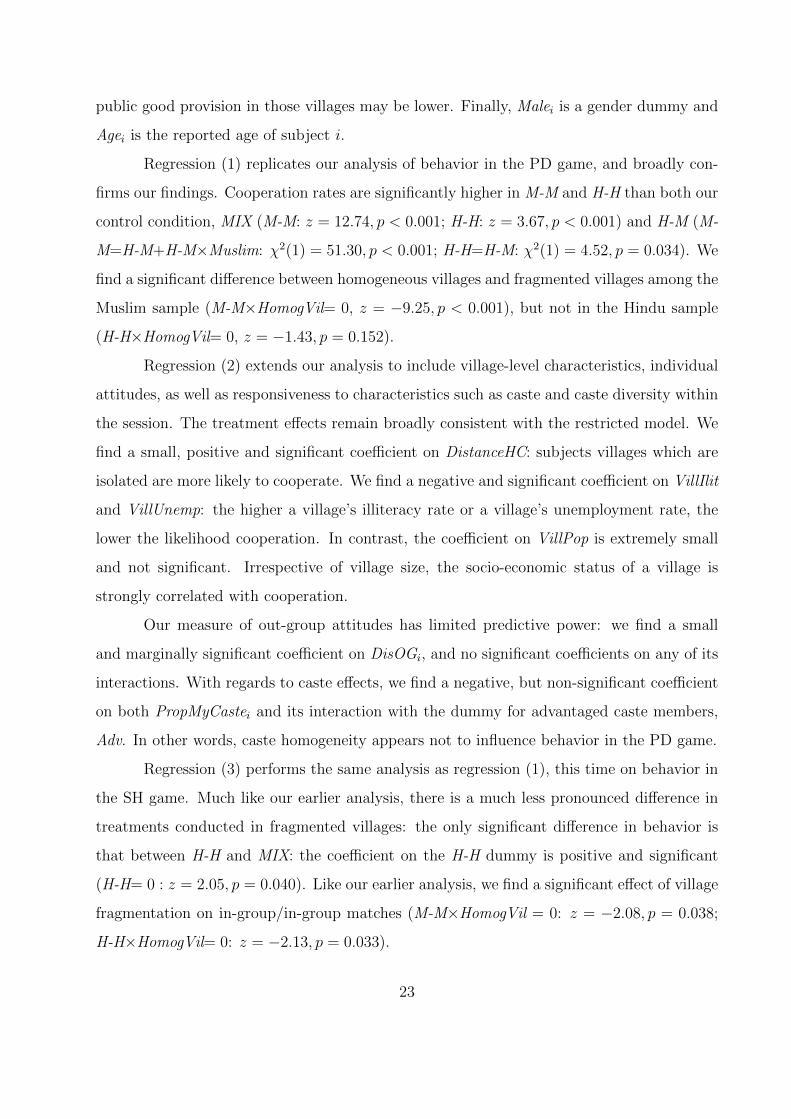
Regression (1) replicates our analysis of behavior in the PD game, and broadly con-
firms our findings. Cooperation rates are significantly higher in M-M and H-H than both our
control condition, MIX (M-M: z = 12.74, p < 0.001; H-H: z = 3.67, p < 0.001) and H-M (M-
M=H-M+H-M×Muslim: χ2(1) = 51.30, p < 0.001; H-H=H-M: χ2(1) = 4.52, p = 0.034). We
find a significant difference between homogeneous villages and fragmented villages among the
Muslim sample (M-M×HomogVil= 0, z = −9.25, p < 0.001), but not in the Hindu sample
(H-H×HomogVil= 0, z = −1.43, p = 0.152).
Regression (2) extends our analysis to include village-level characteristics, individual
attitudes, as well as responsiveness to characteristics such as caste and caste diversity within
the session. The treatment effects remain broadly consistent with the restricted model. We
find a small, positive and significant coefficient on DistanceHC: subjects villages which are
isolated are more likely to cooperate. We find a negative and significant coefficient on VillIlit
and VillUnemp: the higher a village’s illiteracy rate or a village’s unemployment rate, the
lower the likelihood cooperation. In contrast, the coefficient on VillPop is extremely small
and not significant. Irrespective of village size, the socio-economic status of a village is
strongly correlated with cooperation.
Our measure of out-group attitudes has limited predictive power: we find a small
and marginally significant coefficient on DisOGi, and no significant coefficients on any of its
interactions. With regards to caste effects, we find a negative, but non-significant coefficient
on both PropMyCastei and its interaction with the dummy for advantaged caste members,
Adv. In other words, caste homogeneity appears not to influence behavior in the PD game.
Regression (3) performs the same analysis as regression (1), this time on behavior in
the SH game. Much like our earlier analysis, there is a much less pronounced difference in
treatments conducted in fragmented villages: the only significant difference in behavior is
that between H-H and MIX: the coefficient on the H-H dummy is positive and significant
(H-H= 0 : z = 2.05, p = 0.040). Like our earlier analysis, we find a significant effect of village
fragmentation on in-group/in-group matches (M-M×HomogVil = 0: z = −2.08, p = 0.038;
H-H×HomogVil= 0: z = −2.13, p = 0.033).
23

(PD) (SH)
DV: Ci (1) (2) (3) (4)
M-M 2.59∗∗∗ (0.20) 3.39∗∗∗ (0.52) 0.95 (0.58) -0.67 (0.42)
M-M×HomogVil -2.45∗∗∗ (0.26) -3.34∗∗∗ (0.42) -0.81∗∗ (0.39) 0.43 (0.37)
H-H 1.41∗∗∗ (0.38) 0.88∗∗∗ (0.23) 1.05∗∗ (0.51) 1.09∗∗∗ (0.26)
H-H×HomogVil -0.62 (0.44) -1.14∗∗∗ (0.36) -0.57∗∗ (0.27) -0.88∗∗∗ (0.28)
H-M 0.48 (0.34) 0.55 (0.43) 0.66 (0.58) 1.16∗∗∗ (0.29)
H-M×Muslim -0.17 (0.58) -0.86 (0.59) -0.29 (0.25) -0.84∗∗ (0.36)
Muslim 0.39 (0.38) 0.99∗∗∗ (0.35) 0.38∗∗ (0.15) 0.41∗ (0.24)
DistanceHC - 0.05∗∗∗ (0.02) - 0.04∗∗ (0.02)
VillPop - -15×10−6 (14×10−6) - 4×10⁻⁶ (2×10⁻⁵)
VillIlit - -8.32∗∗ (3.55) - 7.51∗∗∗ (2.14)
VillUnemp - -5.66∗∗∗ (2.00) - -2.95∗∗ (1.71)
DisOGi - 0.30∗ (0.18) - 0.32 (0.24)
DisOGi×Muslim - -0.58 (0.50) - 0.32 (0.39)
DisOGi×H-M - -0.20 (0.62) - -1.02∗∗∗ (0.38)
DisOGi×H-M×Muslim - 1.30 (1.00) - 0.59 (0.59)
PropMyCastei - -0.26 (1.01) - 0.79∗∗ (0.40)
PropMyCastei×Adv - -1.03 (0.98) - -0.58 (0.42)
Malei - 0.23 (0.26) - -0.33 (0.20)
Agei - 0.01 (0.01) - -0.01 (0.01)
Constant -0.04 (0.18) 6.41∗∗∗ (1.17) -0.59 (0.51) -1.84 (1.52)
N 514 513 516 515
Pseudo-R2 0.05 0.10 0.02 0.07
Village-level clustered standard errors in parentheses. ∗∗∗, ∗∗, ∗: significance at 1%, 5% and 10% level.
Table 3: Logit estimates of the determinants of cooperation in the PD and SH games.
24
Regression (4) extends the analysis of SH behavior in the same way as regression
(2) did for behavior in the PD game. Again, the treatment effects remain consistent with
regression (3). We replicate the effects in the PD game analysis in that there is a positive
and significant coefficient on DistHC, a negative and significant coefficient on VillUnemp, as
well as a very small and non-significant coefficient on VillPop – we can therefore rule out,
insofar as our sample is concerned, that village size is driving our results. Surprisingly, we
find a positive and significant coefficient on VillUnemp.
While the coefficient on DisOG is not significant, its interaction with H-M is negative
and significant, though not its interaction with the Muslim dummy variable: subjects who
express disliking their religious out- group are less likely to cooperate when matched with
an out-group, irrespective of their actual religion. Finally, with regards to caste, we find
a positive and significant coefficient on PropMyCastei, though not on PropMyCastei×Adv.
The bigger the proportion of people in the other side of the room (i.e. the set of potential
matches) of the same caste as the decision-maker, the higher the likelihood of cooperation,
irrespective of the decision-maker belonging to the advantages castes or not. This reinforces
our findings that the mechanism through which identity operates in preferences is different
to that in beliefs.
Observation 10: In both the PD and SH game, the likelihood of a subject cooperating
decreases with village unemployment. There is no effect of village size on behavior in either
game. Caste breakdown in a session is only correlated with behavior in the SH game.
5 Conclusion
Social identity theory has been identified as a potential cause for the negative correlation
between the degree of social fragmentation and economic performance, particularly the pro-
vision of public goods (Alesina and La Ferrara, 2000; 2005). The argument is that individuals
derive benefit from membership of social groups and display favoritism towards members of
their group at the potential detriment of outsiders. As societies become more fragmented,
discrimination along group lines means less cooperation with a larger number of outsiders,
leading to lower economic performance.
25
However, there is still a lack of micro-level data which establishes the extent to which
social identity drives this correlation, and what are the underlying mechanisms through which
it operates. Our paper fills this gap by reporting data from an artefactual field experiment in
which we test the effect of religious fragmentation on behavior in a region of the world where
religion is an integral part of society and inter-religious conflict is well documented. We
sample our participants from villages whose populations are predominantly of one religion,
as well as villages whose populations are roughly equally split between the two religions.
We study two simple two-player games in order to understand two important, and
conceptually distinct, mechanisms driving behavior in strategic interactions. We study the
prisoners’ dilemma, through which we can infer the effect of preferences over the size of
surplus; and the stag hunt game, which captures the role of beliefs about the opposing
player’s behavior. By varying the religious identity of the opposing player, as well as the
type of village, we understand how social identity can affect either individual preferences for
surplus, or individuals’ beliefs about the actions of their counterpart.
Our first main result is that in both prisoners’ dilemma and stag hunt games, the effect
of group identity is only triggered in fragmented villages. Cooperation rates in homogeneous
villages among individuals of the same religion are no different than cooperation rates in our
control treatment where the identity of matches is unknown. This evidence supports the
idea that a sense of identity is meaningful only when an out-group exists. Without it, that
particular category ceases to be meaningful.
Introducing religious fragmentation leads to higher levels of cooperation than our
control condition when subjects play someone of the same religion – more so in the prison-
ers’ dilemma than in the stag hunt game. This suggests that group identity triggers greater
concerns over the welfare of in-group members, rather than triggering the belief that an
in-group member is more likely to be a cooperator. This vindicates the modeling approach
by Chen and Li (2009) and Chen and Chen (2011), who model the effect of social iden-
tity through other-regarding preferences, and apply them to distribution and coordination
games, respectively. We find that Muslim subjects exhibit higher in-group favoritism than
Hindus. This may be because Muslims are a significant minority in India, which reinforces
the importance of their religious identity. This is consistent with evidence from trust exper-
26

iments ran in India and Bangladesh with Muslim and Hindu subjects (Gupta et al., 2013),
as well as survey evidence (Tripathi and Srivastava, 1981).
Interestingly, the existence of positive favoritism towards one’s group does not mean
prejudice towards out-group members — cooperation rates when subjects play with out-
group members are not lower than those in the control treatment in either game. This
leads to the intriguing finding of our experiment: religiously-diverse villages exhibit higher
cooperation rates. In other words, despite finding strong evidence for social identity-driven
behavior, our data (particularly our final result) suggest that social identity per se may
not be the root cause for the negative relationship between fragmentation and public good
provision. At the very least, our data shows that religious homogeneity does not lead to the
highest cooperation levels in our simple 2× 2 games.
It is possible that the explanation for the negative relationship between fragmentation
and economic performance lies in institutions. These include the ability of social groups not
only to monitor compliance more effectively, but also to punish non-compliant individuals
more effectively (Greif, 1993). In small communities, mechanisms like ostracism are likely to
be easier to enforce. Miguel and Gugerty (2005) find that schools in ethnically-fragmented
communities in Kenya have significantly lower local funding that schools in homogeneous
areas. They attribute this to effective social sanctioning of free-riders in the latter case.
Central to this argument is a repeated-game argument, in which sanctions work not only as
a punishment for past and present actions, but also as a deterrent to bad behavior in the
future.
This is not to say that the harsher punishment of norm violators is not consistent
with a sense of identity. It is certainly possible that the social sanctions towards free-riders
by Kenyan parents were driven by a strong sense of community belonging — in itself a
powerful identity. Goette et al. (2006) show that Swiss army personnel are willing to punish
defectors in a prisoners’ dilemma game with third-party punishment, particularly so when
the victim of defection is a fellow platoon member. Social identity preferences likely work
through institutions, amplifying the effect of social sanctions by reducing the utility cost of
punishing someone, as well as increasing the cost of being punished by one’s peers. The
net effect should be that cooperation is more appealing in the long run. This is consistent
27

with the fact that in smaller communities, ostracism and exclusion are common punishment
mechanisms. Understanding how identity interacts with such institutions is a promising
future line of inquiry.
References
[1] Akbar, M. J. 2003. Riot after riot: Reports on caste and communal violence in India.
New Delhi: Roli Books
[2] Akerlof, G.A., and Kranton, R.E. 2000. Economics and identity. Quarterly Journal of
Economics 115(3), 715-753.
[3] Alesina, A., Baqir, R., and Easterly, W., 1999. Public goods and ethnic divisions. Quar-
terly Journal of Economics 114(4), 1243-1284.
[4] Alesina, A., Devleeschauwer, A., Easterly, W., Kurlat, S., and Wacziarg, R., 2003. Frac-
tionalization. Journal of Economic Growth 8(2), 155-194.
[5] Alesina, A., and La Ferrara, E., 2000. Participation in heterogeneous communities. Quar-
terly Journal of Economics 115(3), 847-904.
[6] Alesina, A., and La Ferrara, E., 2005. Ethnic diversity and economic performance. Jour-
nal of Economic Literature 43, 762-800.
[7] Allport. G. 1954. The Nature of Prejudice. Cambrige, Mass: Addison-Wesley.
[8] Anderson, S. 2011. Caste as an impediment to trade. American Economic Journal: Ap-
plied Economics 3(1), 239-263.
[9] Andreoni, J., 1990. Impure altruism and donations to public goods: A theory of warm-
glow giving. Economic Journal 100, 464-477.
[10] Banerjee, A., Iyer, L., and Somanathan, R., 2005. History, social divisions, and public
goods in rural India. Journal of the European Economic Association 3(2-3), 639-647.
28
[11] Bardhan, P.K., Mookherjee, D., and Torrado, M.P., 2010. Impact of political reserva-
tions in West Bengal local governments on anti-poverty targeting. Journal of Globalization
and Development 1(1), 1-38.
[12] Basu, K. 2007. Participatory Equity, Identity, and Productivity: Policy Implications
for Promoting Development. Cornell University Center for Analytic Economics Working
Paper 0605. http://ssrn.com/abstract=956080.
[13] Bernhard, H., Fehr, E., Fischbacher, U., 2006. Group affiliation and altruistic norm
enforcement. American Economic Review 96(2), 217-221.
[14] Bhattacharya, P.C., 2000. An analysis of rural-to-rural migration in India. Journal of
International Development 12, 655-667.
[15] Brass, P. R. 2003. The production of HinduMuslim violence in contemporary India.
Seattle: University of Washington Press.
[16] Brewer, M.B. 1991. The Social Self: On Being the Same and Different at the Same
Time. Personality and Social Psychology Bulletin 17(5), 475-482.
[17] Brewer, M.B. 1999. The Psychology of Prejudice: Ingroup Love or Outgroup Hate?
Journal of Social Issues 55(3), 429-444.
[18] Capraro, V., Jordan, J.J., and Rand, D.G. 2014. Heuristics guide the implementation of
social preferences in one-shot Prisoner’s Dilemma experiments. Nature Scientific Reports
4, doi:10.1038/srep06790.
[19] Charness, G., Rigotti, L. and Rustichini, A. 2007. Individual behavior and group mem-
bership. American Economic Review 97(4), 1340-1352.
[20] Chen, Y., Chen, R. 2011. The potential of social identity for equilibrium selection.
American Economic Review 101(6), 2562-2589.
[21] Chen, Y., Li, S.X. 2009. Group identity and social preferences. American Economic
Review 99(1), 431-457.
29

[22] Das. P.K., Kar, S., Kayal, M., 2011. Religious Minorities and Provision of Public Goods:
Evidence from Rural West Bengal. IZA Discussion Paper No. 6154.
[23] Dawes, R.M. 1980. Social dilemmas. Annual Review of Social Psychology 31, 169-193.
[24] Easterly, W. and Levine, R. 1999. Africa’s growth tragedy: Policies and ethnic divisions.
Quarterly Journal of Economics 112(4), 1203-1250.
[25] Fershtman, C., Gneezy, U., 2001. Discrimination in a segmented society: An experi-
mental approach. Quarterly Journal of Economics 116(1), 351-377.
[26] Goette, L., Huffman, D., Meier, S., 2006. The Impact of Group Membership on Co-
operation and Norm Enforcement: Evidence Using Random Assignment to Real Social
Groups. American Economic Review 96(2), 212-216.
[27] Greif, A. 1993. Contract enforceability and economic institutions in early trade: The
Maghribi traders’ coalition. American Economic Review 83(3), 525-548.
[28] Habyarimana, J., Humphreys, M., Posner, D.N., Weinstein, J.M., 2007. Why does ethnic
diversity undermine public goods provision? American Political Science Review 101(4),
709-725.
[29] de Hann, A. 1997. Poverty and Social Exclusion: A Comparison of Debates on Depriva-
tion, PRUS Working Papers, No.2, Poverty Research unit at Sussex, University of Sussex,
Falmer, Brighton, U.K.
[30] Isaac, R.M., Walker, J.M., Williams, A.W. 1994. Group size and the voluntary provision
of public goods: Experimental evidence using large groups. Journal of Public Economics
54, 1-36.
[31] John, R.M., and Mutaktar, R. 2005. Statewise estimates of poverty among religious
groups in India. Economic and Political Weekly 40(13), 1337+1339-1345.
[32] Klor, E.F., Shayo, M. 2010. Social identity and preferences over redistribution. Journal
of Public Economics 94(3-4), 269-278.
30
[33] Kreps, D.M., Milgrom, P., Roberts, J., and Wilson, R. 1992. Rational cooperation in
the finitely repeated prisoners’ dilemma. Journal of Economic Theory 27, 245-252.
[34] Gupta, G., Mahmud, M., Maitra, P., Mitra, S., and Neelim, A. 2013. Religion, Minority
Status and Trust: Evidence from a Field Experiment. Monash Economics Working Papers
28-13.
[35] Miguel, E., and Gugerty, M.K. 2005. Ethnic Diversity, Social Sanctions, and Public
Goods in Kenya. Journal of Public Economics 89 (11-12), 2325-2368.
[36] Mitra, A., Ray, D., 2013. Implications of an economic theory of conflict: Hindu-Muslim
violence in India. Journal of Political Economy 122(4), 719-765.
[37] Morita, H. and Servatka, M. 2013. Group identity and relation-specific investment: An
experimental investigation. European Economic Review 58, 95-109.
[38] New York Times, 6th June 2014. Timeline of the Riots in Modis Gujarat.
http://www.nytimes.com/interactive/2014/04/06/world/asia/modi-gujarat-riots-
timeline.html?. Last retrieved, 15th January, 2015.
[39] Poterba, J., 1998. Demographic change, intergenerational linkages, and public educa-
tion. American Economic Review 88(2), 315-320.
[40] Posner, R.A., 1998. Creating a legal framework for economic development. World Bank
Research Observer 13(1), 1-11.
[41] Reuben, E., and Riedl, A. 2013. Enforcement of contribution norms in public good
games with heterogeneous populations. Games and Economic Behavior 77(1), 122-137.
[42] Roth, A.E., 1988. Laboratory Experimentation in Economics: A Methodological
Overview. Economic Journal 98, 974-1031.
[43] Sachar Committee Report. 2006. Social, Economic and Educational Status of the Mus-
lim Community of India: A Report. Prime Ministers High Level Committee, Cabinet
Secretariat, Government of India.
31
[44] Sally, D., 1995. Conversation and cooperation in social dilemmas: A meta-analysis of
experiments from 1958 to 1992. Rationality and Society 7, 58-92.
[45] Sen, A.K. 2000. Social Exclusion: Concept, Application and Scrutiny. Office of Envi-
ronment and Social Development, Asian Development Bank, Social Development Papers.
[46] Skyrms, B. 2001. The Stag Hunt. Proceedings and Addresses of the American Philo-
sophical Association 75(2), 31-41.
[47] Tajfel, H., Billig, M.G., Bundy, R.P., Flament, C., 1971. Social categorization in inter-
group behavior. European Journal of Social Psychology 1(2), 149-178.
[48] Times of India. 8th September 2010. Communal clash near Bangla border,
Army deployed. http://timesofindia.indiatimes.com/india/Communal-clash-near-Bangla-
border-Army-deployed/articleshow/6516123.cms?referral=PM. Last retrieved, 15th Jan-
uary, 2015.
[49] Tripathi, R.C, and Srivastava, R. 1981. Relative deprivation and intergroup attitudes.
European Journal of Social Psychology 11(3), 313-318.
[50] Turner, J.C. and Brown, R. J. 1978. Social Status, Cognitive Alternatives and In-
tergroup Relations. In Tajfel, H. (ed.) Differentiation between Social Groups. London:
Academic Press.
[51] Weber, R.A. 2006. Managing growth to achieve efficient coordination in large groups.
American Economic Review 96(1), 114-126.
A Appendix — For Online Publication
A.1 Subject Characteristics
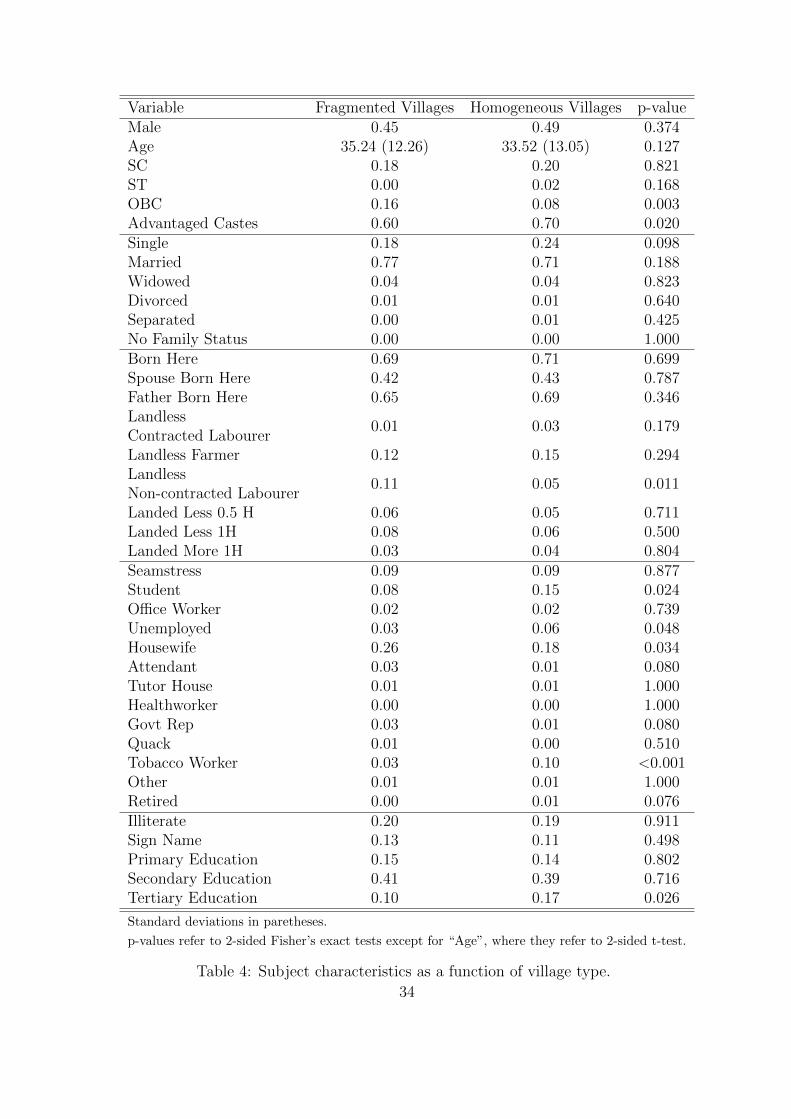
In this section, we outline the basic characteristics of our sample. In particular, we wish
to understand whether the participant subsample from homogeneous villages differs in a
systematic way than the subsample from fragmented villages. To this effect, we compare
32

the two types of villages, pooling the two types of homogeneous villages on a number of
characteristics, including caste, marital status, place of birth (both the subjects and their
next-of-kin), land ownership, profession, and literacy level.
Table 4 displays the proportion of subjects in each type of village that belong to each
of 37 categories. We do not find large discrepancies on any category, although some of the
differences are statistically significant using Fisher’s exact test. The two differences that are
worthy of note are the proportion of advantaged caste subjects, which is ten percentage points
higher in Homogeneous villages, while OBC subjects are more prevalent by eight percentage
points in Fragmented villages. We also sampled more subjects who either finished or were
enrolled in tertiary education in Homogeneous villages. Nevertheless, we reiterate that we
do not find systematic differences across multiple categories; even those categories where we
there are significant differences, these are not sufficiently large to warrant concern.
A.2 Methodological Note
Before reproducing the experimental materials, a methodological note is warranted. A large
proportion of our participant sample was unable to read and/or write to a satisfactory level
of proficiency. Around a third of our sample was completely unable to read or write and a
further 17% only had basic primary education. As such, we had to describe the different
games in a different way than that used in typical laboratory experiments. We took a number
of design decisions, which we describe and justify in turn.
We opted not to present any payoff matrix to participants. Based on early pilots, we
felt that a payoff matrix (even in simple 2× 2 games) would be too confusing and abstract
to many participants. Instead, we presented the game to participants using a simple, but
familiar framing. We then enumerated the actions available to participants, and we described
each contingency in the game in turn using visual aids. To circumvent the illiteracy problem,
payoffs were described using rupee notes and coins, since all participants were familiar with
currency.
We framed the Prisoners’ Dilemma game as a two-player voluntary contribution game
in which any contribution to a common pool is multiplied by 1.5 and divided equally among
both players. We felt this was the most natural way to explain the game. We framed the
33
Variable Fragmented Villages Homogeneous Villages p-valueMale 0.45 0.49 0.374Age 35.24 (12.26) 33.52 (13.05) 0.127SC 0.18 0.20 0.821ST 0.00 0.02 0.168OBC 0.16 0.08 0.003Advantaged Castes 0.60 0.70 0.020Single 0.18 0.24 0.098Married 0.77 0.71 0.188Widowed 0.04 0.04 0.823Divorced 0.01 0.01 0.640Separated 0.00 0.01 0.425No Family Status 0.00 0.00 1.000Born Here 0.69 0.71 0.699Spouse Born Here 0.42 0.43 0.787Father Born Here 0.65 0.69 0.346Landless
0.01 0.03 0.179Contracted LabourerLandless Farmer 0.12 0.15 0.294Landless
0.11 0.05 0.011Non-contracted LabourerLanded Less 0.5 H 0.06 0.05 0.711Landed Less 1H 0.08 0.06 0.500Landed More 1H 0.03 0.04 0.804Seamstress 0.09 0.09 0.877Student 0.08 0.15 0.024Office Worker 0.02 0.02 0.739Unemployed 0.03 0.06 0.048Housewife 0.26 0.18 0.034Attendant 0.03 0.01 0.080Tutor House 0.01 0.01 1.000Healthworker 0.00 0.00 1.000Govt Rep 0.03 0.01 0.080Quack 0.01 0.00 0.510Tobacco Worker 0.03 0.10 <0.001Other 0.01 0.01 1.000Retired 0.00 0.01 0.076Illiterate 0.20 0.19 0.911Sign Name 0.13 0.11 0.498Primary Education 0.15 0.14 0.802Secondary Education 0.41 0.39 0.716Tertiary Education 0.10 0.17 0.026
Standard deviations in paretheses.
p-values refer to 2-sided Fisher’s exact tests except for “Age”, where they refer to 2-sided t-test.
Table 4: Subject characteristics as a function of village type.
34
Stag Hunt game in the vein of Rousseau’s original fable which originated the game itself. We
used fish, since fishing is a more common activity in West Bengal than hunting and therefore
the analogy would be more meaningful.
We piloted these framings in a study with a group of participants in the Birbhum
district who had the same socio-economic background as our main subject pool. The feed-
back we obtained from post-session interviews suggested that our choice of framing led to
participants understanding the incentive structure of each game without leading to experi-
menter demand effects. It is possible that our choice of framing could have led participants
to interpret games in unintended ways, but we feel that participant confusion would be a
worse outcome. Furthermore, since we are interested in differences in cooperation levels
across village-types, rather than cooperation levels per se, we think this issue is of limited
importance.
A.3 Instructions
The following instructions are the English translations from Bengali. Experimenters read
them aloud to participants as a fixed script. The team of experimenters used large A1-sized
sheets mounted in the middle of the room to assist them in explaining every contingency of
each game. The text in bold inside square brackets indicates an action by the experimenter,
and was not part of the script. We include the example sheets along with the main text for
ease of exposition. We also include the decision forms in separate sub-sections.
A.3.1 Preamble
Welcome to our session. In this session, we will ask you to make series of decisions.
This session is part of a large study sponsored by a university. The purpose of this study
is to understand how people make decisions in a typical Indian village. The objective is to
better understand how to improve the welfare of villagers in India.
The decisions you will make are not a test of your knowledge. There is no right or wrong
way to decide. What we want to know is how you decide when faced with slightly different
problems. These problems give you the chance of earning a significant amount of money, so
35

please think carefully before making your decisions.
Please do not talk either to the people sitting next to you or the people across the room
about the task. If you have any questions about the experiment, or if something does not
make sense, please raise your hand, and one of my colleagues will take your question.
The money you earn will depend on what you choose, on what other people in the room
choose and sometimes depending on chance.
We will first explain to you carefully the nature of each decision, and how your payment is
determined in each decision. This will involve some examples. Please pay attention to the
rules. If you have any question or if the rules are difficult to understand, please ask. It is
very important to us that you understand how each decision works.
You will make your decisions on a piece of paper, which we will provide. Please make sure
you fill all the necessary decisions, since these will be what determines your payment for the
session.
The pieces of paper you will receive will have a number. This number is unique to you. We
will pay you based on your number. Please do not write your name on the piece of paper.
That way, no one will ever be able to link the decisions you make in this session to you.
Your payment for each task will be determined at the end of the session. You will then be
paid in cash. While you are collecting your cash we will also do a brief questionnaire with
each of you individually.
A.3.2 PD Game Instructions
In this task you will be paired with someone across the room. You will only be paired with
that person for this decision; you will never be paired with that person again in this session.
In this task, we will give you 40 rupees. The person with whom you are paired will also
receive 40 rupees. You can either keep the 40 rupees or put them in a joint account with the
other person. The person with whom you are paired has to make the same choice as you.
We will put an additional 20 rupees for each 40 rupees you or the other person puts in the
joint account. You will receive half of what is in the joint account, regardless of how much
you put in.
• If you put 40 rupees in the joint account and the other person also puts 40 rupees in
36
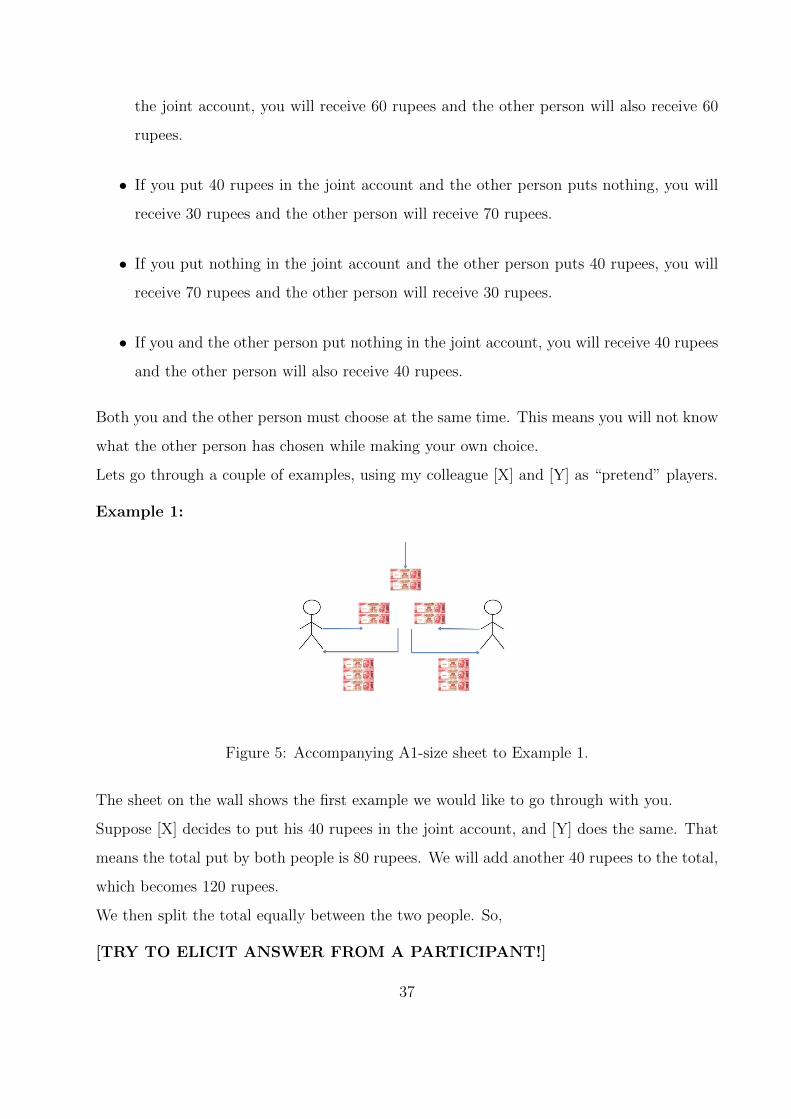
the joint account, you will receive 60 rupees and the other person will also receive 60
rupees.
• If you put 40 rupees in the joint account and the other person puts nothing, you will
receive 30 rupees and the other person will receive 70 rupees.
• If you put nothing in the joint account and the other person puts 40 rupees, you will
receive 70 rupees and the other person will receive 30 rupees.
• If you and the other person put nothing in the joint account, you will receive 40 rupees
and the other person will also receive 40 rupees.
Both you and the other person must choose at the same time. This means you will not know
what the other person has chosen while making your own choice.
Lets go through a couple of examples, using my colleague [X] and [Y] as “pretend” players.
Example 1:
Figure 5: Accompanying A1-size sheet to Example 1.
The sheet on the wall shows the first example we would like to go through with you.
Suppose [X] decides to put his 40 rupees in the joint account, and [Y] does the same. That
means the total put by both people is 80 rupees. We will add another 40 rupees to the total,
which becomes 120 rupees.
We then split the total equally between the two people. So,
[TRY TO ELICIT ANSWER FROM A PARTICIPANT!]
37

[X] gets 60 rupees and [Y] gets 60 rupees.
Example 2:
Figure 6: Accompanying A1-size sheet to Example 2.
The sheet on the wall shows the second example we would like to go through with you.
Suppose [X] decides to put his 40 rupees in the joint account, but [Y] does not do the same.
That means the total put by both people is 40 rupees. We will add another 20 rupees to the
total, which becomes 60 rupees.
We then split the total equally between the two people. So,
[TRY TO ELICIT ANSWER FROM A PARTICIPANT!]
[X] gets 30 rupees and [Y] gets 70 rupees: 30 from the joint account, plus the 40 rupees she
kept.
Example 3:
Figure 7: Accompanying A1-size sheet to Example 3.
The sheet on the wall shows the third example we would like to go through with you.
38
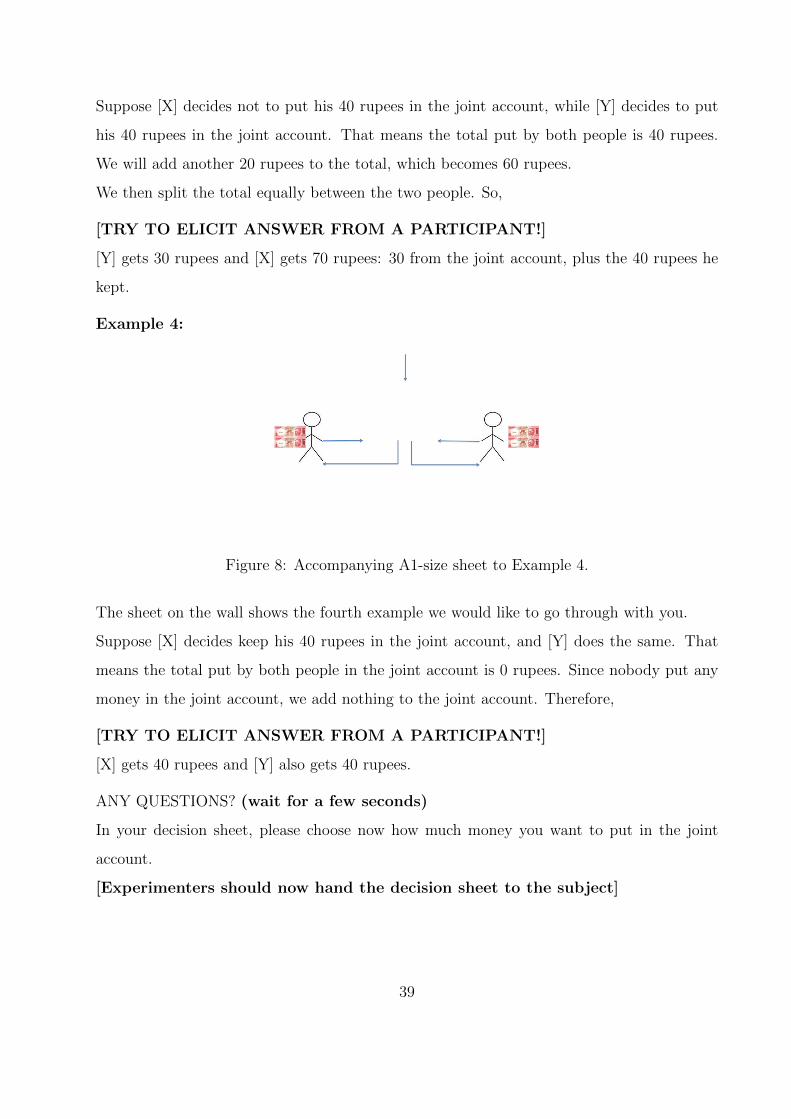
Suppose [X] decides not to put his 40 rupees in the joint account, while [Y] decides to put
his 40 rupees in the joint account. That means the total put by both people is 40 rupees.
We will add another 20 rupees to the total, which becomes 60 rupees.
We then split the total equally between the two people. So,
[TRY TO ELICIT ANSWER FROM A PARTICIPANT!]
[Y] gets 30 rupees and [X] gets 70 rupees: 30 from the joint account, plus the 40 rupees he
kept.
Example 4:
Figure 8: Accompanying A1-size sheet to Example 4.
The sheet on the wall shows the fourth example we would like to go through with you.
Suppose [X] decides keep his 40 rupees in the joint account, and [Y] does the same. That
means the total put by both people in the joint account is 0 rupees. Since nobody put any
money in the joint account, we add nothing to the joint account. Therefore,
[TRY TO ELICIT ANSWER FROM A PARTICIPANT!]
[X] gets 40 rupees and [Y] also gets 40 rupees.
ANY QUESTIONS? (wait for a few seconds)
In your decision sheet, please choose now how much money you want to put in the joint
account.
[Experimenters should now hand the decision sheet to the subject]
39
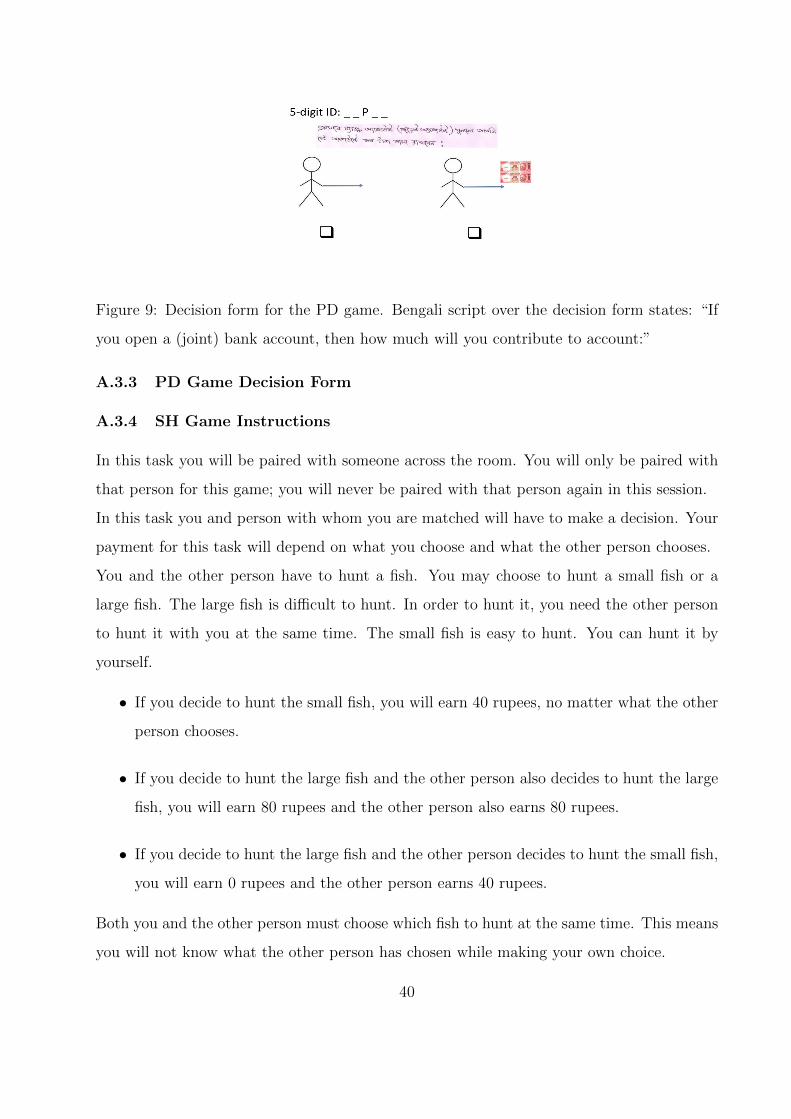
Figure 9: Decision form for the PD game. Bengali script over the decision form states: “If
you open a (joint) bank account, then how much will you contribute to account:”
A.3.3 PD Game Decision Form
A.3.4 SH Game Instructions
In this task you will be paired with someone across the room. You will only be paired with
that person for this game; you will never be paired with that person again in this session.
In this task you and person with whom you are matched will have to make a decision. Your
payment for this task will depend on what you choose and what the other person chooses.
You and the other person have to hunt a fish. You may choose to hunt a small fish or a
large fish. The large fish is difficult to hunt. In order to hunt it, you need the other person
to hunt it with you at the same time. The small fish is easy to hunt. You can hunt it by
yourself.
• If you decide to hunt the small fish, you will earn 40 rupees, no matter what the other
person chooses.
• If you decide to hunt the large fish and the other person also decides to hunt the large
fish, you will earn 80 rupees and the other person also earns 80 rupees.
• If you decide to hunt the large fish and the other person decides to hunt the small fish,
you will earn 0 rupees and the other person earns 40 rupees.
Both you and the other person must choose which fish to hunt at the same time. This means
you will not know what the other person has chosen while making your own choice.
40

Lets go through a few examples using my colleagues.
Example 1:
Figure 10: Accompanying A1-size sheet to Example 1.
The sheet on the wall shows the first example we would like to go through with you.
Suppose [X] hunts the small fish and [Y] hunts the small fish. In that case,
[TRY TO ELICIT ANSWER FROM A PARTICIPANT!]
[X] gets 40 rupees and [Y] gets 40 rupees.
Example 2:
Figure 11: Accompanying A1-size sheet to Example 2.
The sheet on the wall shows the second example we would like to go through with you.
Suppose [X] hunts the small fish and [Y] hunts the large fish. In that case,
[TRY TO ELICIT ANSWER FROM A PARTICIPANT!]
[X] gets 40 rupees and [Y] gets 0 rupees.
41

Figure 12: Accompanying A1-size sheet to Example 3.
Example 3:
The sheet on the wall shows the third example we would like to go through with you.
Suppose [X] hunts the large fish and [Y] hunts the small fish. In that case,
[TRY TO ELICIT ANSWER FROM A PARTICIPANT!]
[X] gets 0 rupees and [Y] gets 40 rupees.
Example 4:
Figure 13: Accompanying A1-size sheet to Example 4.
The sheet on the wall shows the fourth example we would like to go through with you.
Suppose [X] hunts the large fish and [Y] hunts the large fish. In that case,
[TRY TO ELICIT ANSWER FROM A PARTICIPANT!]
[X] gets 80 rupees and [Y] gets 80 rupees.
ANY QUESTIONS? (wait for a few seconds)
42
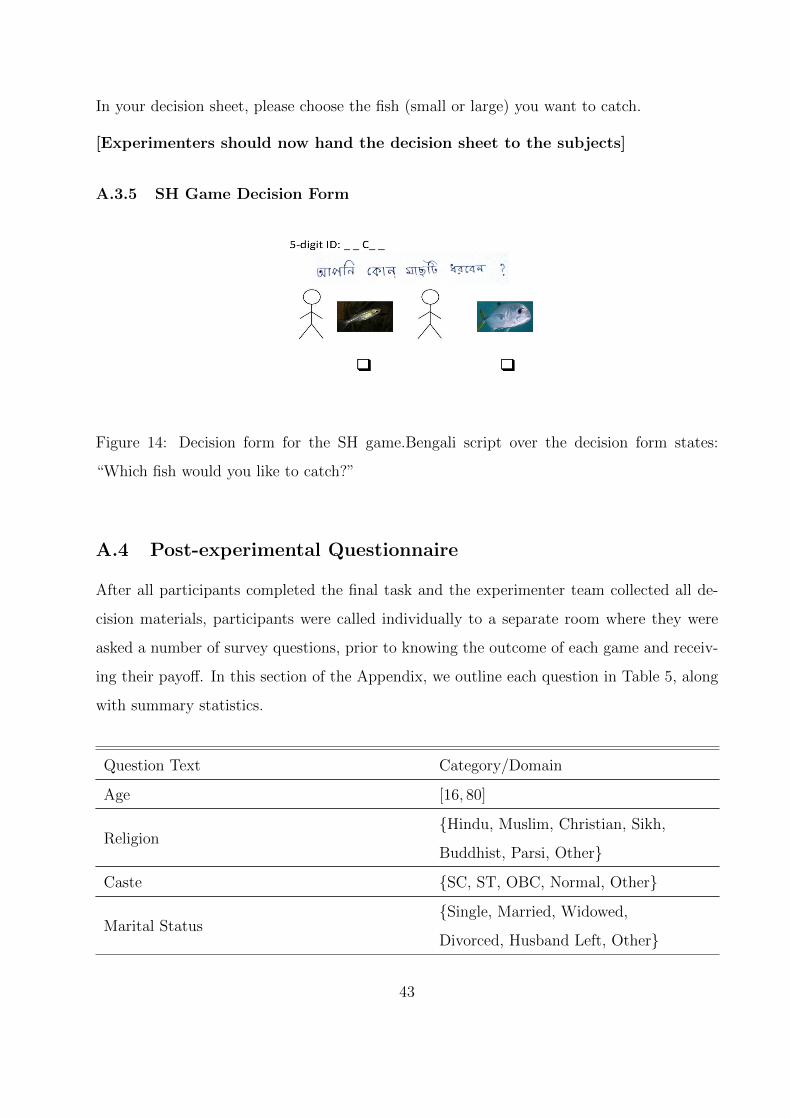
In your decision sheet, please choose the fish (small or large) you want to catch.
[Experimenters should now hand the decision sheet to the subjects]
A.3.5 SH Game Decision Form
Figure 14: Decision form for the SH game.Bengali script over the decision form states:
“Which fish would you like to catch?”
A.4 Post-experimental Questionnaire
After all participants completed the final task and the experimenter team collected all de-
cision materials, participants were called individually to a separate room where they were
asked a number of survey questions, prior to knowing the outcome of each game and receiv-
ing their payoff. In this section of the Appendix, we outline each question in Table 5, along
with summary statistics.
Question Text Category/Domain
Age [16, 80]
Religion{Hindu, Muslim, Christian, Sikh,
Buddhist, Parsi, Other}
Caste {SC, ST, OBC, Normal, Other}
Marital Status{Single, Married, Widowed,
Divorced, Husband Left, Other}
43

Born in Village? {Yes, No, Don’t Know}
If not, how long have you lived here?
Spouse Born in Village? {Yes, No, Don’t Know}
If not, how long has (s)he lived here?
Father Born in Village? {Yes, No, Don’t Know}
If not, how long has he lived here?
Grandfather Born in Village? {Yes, No, Don’t Know}
If not, how long has he lived here?
Education Level
{Illiterate, Sign Name, Dropped
out at grade x, Completed grade x,
Currently sitting grade x }
Profession
{Landless contract laborer, Landless
farmer, Landless non-contract
laborer, Attendant,
Small-property farmer (< 0.5 Ha),
Medium-property farmer (< 1 Ha),
Big-property farmer > 1 Ha),
Quarry worker, Student, Office worker,
Unemployed, Housewife, Tutor House,
Health Worker, Gov’t employment
program, Village quack, Village tobacco
factory, Other}
Does your village have a pond? {Yes, No, Don’t Know}
Who owns it? {Gov’t, NGO, Village}
Do you use it? {Yes, No, Don’t Know}
Has it been appropriated/expropriated? {Yes, No, Don’t Know}
If yes, by whom?
{Higher caste, Land-owning villagers,
Rich families, Political party,
Panchayat, Other}
44
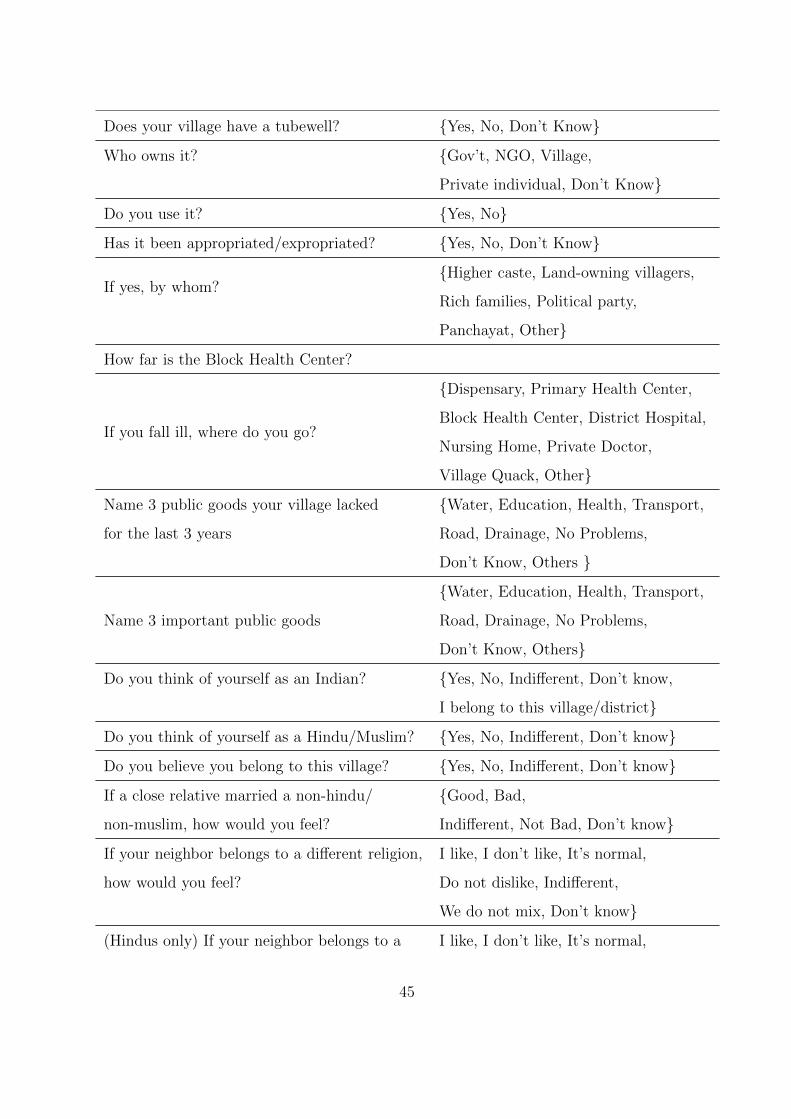
Does your village have a tubewell? {Yes, No, Don’t Know}
Who owns it? {Gov’t, NGO, Village,
Private individual, Don’t Know}
Do you use it? {Yes, No}
Has it been appropriated/expropriated? {Yes, No, Don’t Know}
If yes, by whom?{Higher caste, Land-owning villagers,
Rich families, Political party,
Panchayat, Other}
How far is the Block Health Center?
If you fall ill, where do you go?
{Dispensary, Primary Health Center,
Block Health Center, District Hospital,
Nursing Home, Private Doctor,
Village Quack, Other}
Name 3 public goods your village lacked {Water, Education, Health, Transport,
for the last 3 years Road, Drainage, No Problems,
Don’t Know, Others }
Name 3 important public goods
{Water, Education, Health, Transport,
Road, Drainage, No Problems,
Don’t Know, Others}
Do you think of yourself as an Indian? {Yes, No, Indifferent, Don’t know,
I belong to this village/district}
Do you think of yourself as a Hindu/Muslim? {Yes, No, Indifferent, Don’t know}
Do you believe you belong to this village? {Yes, No, Indifferent, Don’t know}
If a close relative married a non-hindu/ {Good, Bad,
non-muslim, how would you feel? Indifferent, Not Bad, Don’t know}
If your neighbor belongs to a different religion, I like, I don’t like, It’s normal,
how would you feel? Do not dislike, Indifferent,
We do not mix, Don’t know}
(Hindus only) If your neighbor belongs to a I like, I don’t like, It’s normal,
45
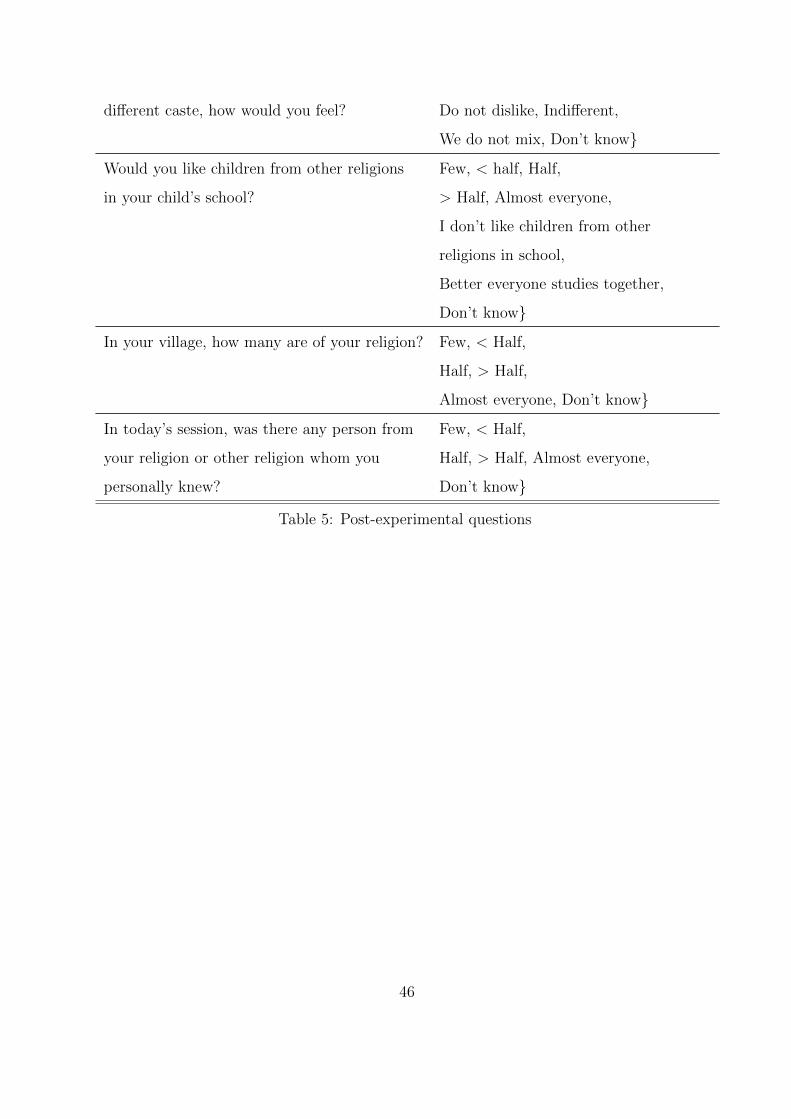
different caste, how would you feel? Do not dislike, Indifferent,
We do not mix, Don’t know}
Would you like children from other religions Few, < half, Half,
in your child’s school? > Half, Almost everyone,
I don’t like children from other
religions in school,
Better everyone studies together,
Don’t know}
In your village, how many are of your religion? Few, < Half,
Half, > Half,
Almost everyone, Don’t know}
In today’s session, was there any person from Few, < Half,
your religion or other religion whom you Half, > Half, Almost everyone,
personally knew? Don’t know}
Table 5: Post-experimental questions
46

C D
C 60(1 + αgi ), 60(1 + αgj ) 30 + 70αgi , 70 + 30αgj
D 70 + 30αgi , 30 + 70αgj 40(1 + αgi ), 40(1 + αgj )
Table 6: Modified payoff matrix for the PD game.
A.5 The Effect of Identity Preferences
In this section, we outline a simple behavioral model which underpins the hypotheses dis-
cussed in the main paper. We use Chen and Chen (2011)’s utility function in which player
i assigns some deterministic weight αgi ∈ [−1, 1], g ∈ {I, O,N} to the financial welfare of
the other player, where that weight is a function of the identity of both players: in-group
(I), out-group (O) or none (N). As per Chen and Chen (2011), we assume the values of αgi
are known to all players (therefore players are playing a complete information game). The
utility function for player i is:
ui(πi, πj) = πi + αgi πj (2)
Applying this utility function to the PD game yields the following payoff matrix in
Table 6. In the PD game, D remains a strictly dominant strategy if αgi < 1/3. For αgi ≥ 1/3,
cooperating is the strictly dominant strategy. As such, the only consideration in determining
behavior is a player’s concern for the welfare of his counterpart.
Table 7 displays the payoff matrix for the SH game with social identity utility. This
game has three Nash equilibria. The first is a mixed strategy Nash equilibrium; let q denote
the probability that player i (the row player) plays C, and p denote the probability that
player j (the column player) plays C. The following two conditions define the mixed strategy
Nash equilibrium:
80p(1 + αgi ) + (1− p)40αgi = 40p+ (1− p)40(1 + αgi ) (3)
80q(1 + αgj ) + (1− q)40αgj = 40q + (1− q)40(1 + αgj ) (4)
The Nash equilibrium is defined by the equilibrium probabilities p∗ = 12(1+αg
i )and
q∗ = 12(1+αg
j ). Note that the equilibrium probability for player j only depends on αgi , while
47
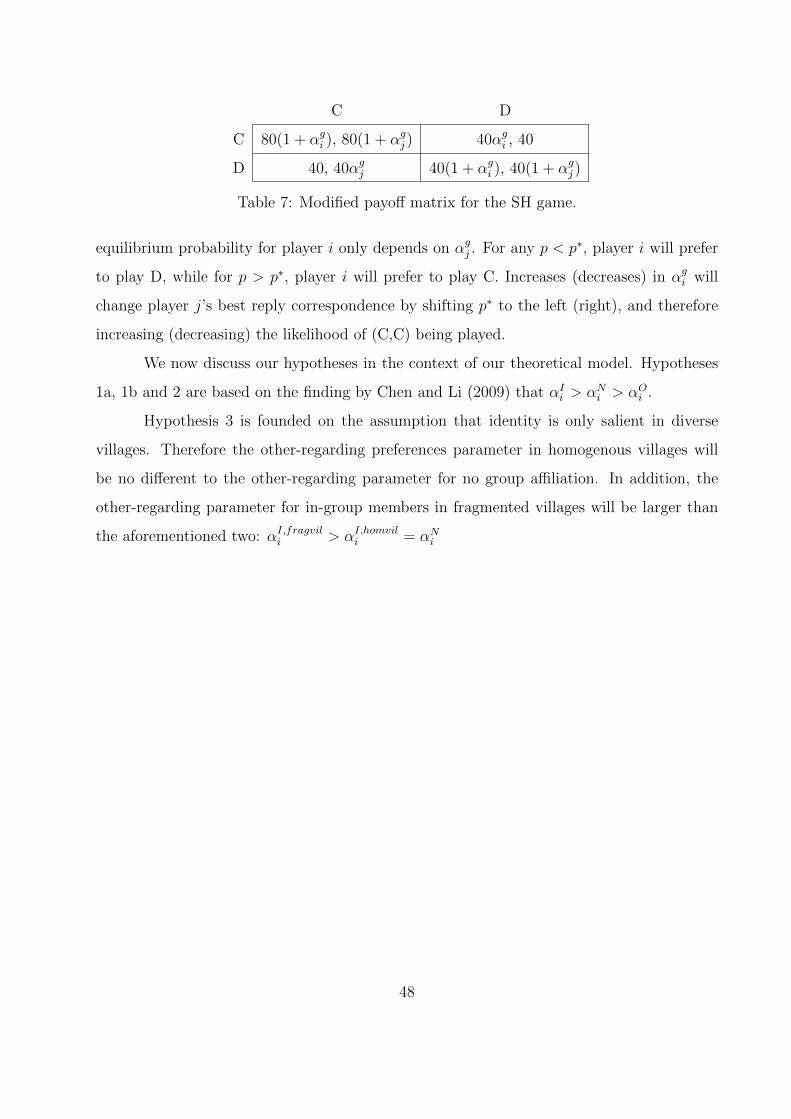
C D
C 80(1 + αgi ), 80(1 + αgj ) 40αgi , 40
D 40, 40αgj 40(1 + αgi ), 40(1 + αgj )
Table 7: Modified payoff matrix for the SH game.
equilibrium probability for player i only depends on αgj . For any p < p∗, player i will prefer
to play D, while for p > p∗, player i will prefer to play C. Increases (decreases) in αgi will
change player j’s best reply correspondence by shifting p∗ to the left (right), and therefore
increasing (decreasing) the likelihood of (C,C) being played.
We now discuss our hypotheses in the context of our theoretical model. Hypotheses
1a, 1b and 2 are based on the finding by Chen and Li (2009) that αIi > αNi > αOi .
Hypothesis 3 is founded on the assumption that identity is only salient in diverse
villages. Therefore the other-regarding preferences parameter in homogenous villages will
be no different to the other-regarding parameter for no group affiliation. In addition, the
other-regarding parameter for in-group members in fragmented villages will be larger than
the aforementioned two: αI,fragvili > αI,homvili = αNi
48