issn: 0975-833x research article - journalcra.com filem is the mass of the substance altered at an...
TRANSCRIPT

–– z
RESEARCH ARTICLE
EVOLUATION OF DENDRITIC PATTERN IN ELECTRODEPOSITION
1Pathan, J. M., 1Gulam Rabbani, 1Khan, A. R. and 2,*Yusuf H. Shaikh
1Dr. Rafiq Zakria Campus, Maulana Azad College, Aurangabad, India-431001
2*Shivaji College Kannad., Aurangabad, India-431103
ARTICLE INFO ABSTRACT
Dendritic Pattern grown in electrode position under suitable working conditions gives rise to fractal pattern with complexity of shape, structure and texture. Such dendritic patterns exhibit interesting characteristics and in most of the cases fractals obey scale invariance over a wide range of length scale. The study of the dendritic patterns grown in a cell with circular geometry, with a view to explore the growth rate of different electrode position patterns. It is found that the dendritic patterns with few branches, when closely examined exhibit microstructures that are of interest from the point of material science and newer materials with non conventional characteristics. The rate of growth is studied from the point of linear growth, volume gained and mass added as a function of time.
Copyright © 2015 Pathan et al. This is an open access article distributed under the Creative Commons Attribution License, which permits unrestricted use, distribution, and reproduction in any medium, provided the original work is properly cited.
INTRODUCTION Diffusion controlled pattern formation have been recent topic of interest, amongst them the Electro deposition, viscous fingering, dendritic crystal growth, and DLA (Diffusion Limited Aggregation) (Sander Leonard, 1987; Sander, 2000 and Witten and Sander, 1981) have received the major attention. The concept of fractal and non fractal aggregation is applicable in physics especially in turbulence (Meron Ehud, 1992 and Cross and Hohenberg, 1993), polymerization, (Family and Landau, 1984 and Starzyk, 1992). Flocculation, coagulation, dendritic growth, crystallization. Gelation process also exhibit self-similarity and fractal character in many cases. The practical importance and fundamental principle of Diffusion limited growth processes has motivated extensive studies in the past years. Electro-deposition processes (Heinz et al., 1992; Pablo et al., 2002; Shaikh et al., 2011 and Yusuf et al., 2014) are well suited for experimental studies of growth of fractals and dendritic patterns (Yusuf Hanif Shaikh, 2012). For the purpose of forecasting the trends of the random events like prices of shares in the share market, the concept of Fractal model is being effectively used (Razdan Ashok, 2002; Mandelbrot, 1997 and Yusuf H Shaikh et al., 2014). We studied growth of dendritic patterns in electrode position using circular cell geometry the development of different branches is
*Corresponding author: Yusuf H. Shaikh, Shivaji College Kannad., Aurangabad, India-431103
monitored and rate of growth analysed. It was found that the complexity of the shape of the growth and the branching patterns depend more on the electric field conditions under a given set of conditions. It was also found that the concentration of the solution strongly influences the structure and textures of electro deposition (Shaikh, 2001). Few dendritic patterns obtained under different cell operating conditions and their characterization is presented. We also studied the time course of evolution (Jason Larkin et al., 2009) of the fractal patterns grown by electro deposition using CuSO4 solution. Basics of Electrodeposition Growth of dendritic patterns using circular cell geometry is basically electrolysis that is governed by Faradays laws of electrolysis. The electro deposition under study is governed by Faradays laws of electrolysis, however, there are two competing processes i.e. the ionic motion due to applied electric field and the random motion of the molecules at room temperature that tend to make it DLA like situation. Faraday's first law of electrolysis states that the mass of a substance altered at an electrode during electrolysis is directly proportional to the quantity of electricity transferred at that electrode. Quantity of electricity refers to electrical charge, typically measured in coulomb. The second law states that for a given quantity of electricity (electric charge), the mass of an elemental material altered at an electrode is directly proportional to the element's equivalent weight. The equivalent
ISSN: 0975-833X
Available online at http://www.journalcra.com
International Journal of Current Research Vol. 7, Issue, 05, pp.15649-15653, May, 2015
INTERNATIONAL JOURNAL OF CURRENT RESEARCH
Article History:
Received 09th February, 2015 Received in revised form 20th March, 2015 Accepted 15th April, 2015 Published online 25th May, 2015 Key words:
Electrodeposition, Dendritic patterns, Electrolysis, Faraday’s laws.

weight of a substance is its molar mass divided by an integer that depends on the reaction undergone by the material. Faraday's laws can be summarized by
ZF
MQm
……(1) where m is the mass of the substance altered at an electrode Q is the total electric charge passed through the substance F = 96,485 C mol-1 is the Faraday constant M is the molar mass of the substance z is the valency number of ions of the substance (electrons transferred per ion) M / z is the same as the equivalent weight of the substance deposited. For Faraday's first law, M, F, and z are constants, so that the larger the value of Q the larger m will be. For Faraday's second law, Q, F, and z are constants, so that the larger the value of M / z (equivalent weight) the larger m will be. In the simple case of constant-current electrolysis, Q = It leading to
zF
MtIm
and then to
zF
tIn
……...(2)
Where n is the amount of substance ("number of moles") altered: n = m / M t is the total time for which the constant current was applied. In the more-complicated case of a variable electrical current, the total charge Q is the electric current I(τ) integrated over time τ:
t
dIQ0
)(
Here t is the total electrolysis time and I(τ) is the current as a function of time, τ. In simplified form it the mass deposited
can be written as tIZm Where m is the mass of metal deposited, Z is the electrochemical equivalent, I is the constant current passing through the electrolyte for a time t. EXPERIMENTAL SETUP For the purpose of electrode position study the electro deposition cell was mounted providing leveling arrangement with suitable arrangement for illumination from both the sides. Three milky lamps were used on hind side and one on the top side of the electro deposition cell. A video camera was
mounted right at the top of the cell for video recording of the growth of the electro deposition. A still camera was also kept ready for photographing the growth at suitable stages for high resolution images for further processing. The power supply used was a regulated power supply with a adjustable range from 0 – 30 V DC. The power-supply was capable of delivering a maximum current of 2 A Dc. During most of the experiment we used constant voltage conditions for electro deposition. To study time course of evolution of the dendritic patterns, real time videos were recorded during the electrode position process and selected frames at definite time interval were extracted for analysis. The time course of evolution of the dendritic patterns presented here is for growth at a cell operating voltage of 6 V DC and molarity of CuSO4 solution was 0.5. The movie was recorded for 20 minutes. The video file was then processed and frames were separated at intervals of 3 minutes. Figure 1 below shows these frames indicating different stage of growth of the electro deposition. The first frame at t = 0 is not included. After separating the frames, the images were converted to 2 bit black and white images, selecting suitable threshold. After converting the images to 1 bit images, the images were independently edited to remove the image of outer anode for further analysis of the images. As can be seen from the fully grown pattern at t = 18 minutes, there are primary and secondary branches are seen, however six prominent main primary branches could be identified. In fact these branches appear to be smooth and linearly growing branches however a closer examination under higher resolution reveals the branching is almost continuous at different length scale. Primary branches have secondary and tertiary branches that in turn possess lot of complex and intricate branching pattern that makes the deposit more or less porous with low bulk density. It is clearly seen that there are branch tips with size of a micron or less and a crowd of such fine branches makes the main primary branch of the deposit shown in Fig. 1. Fig.3 below is similar to the earlier one except in that this deposit was not fully washed to remove copper sulphate solution which in turn got crystallized at the tip of the fine branches. It is interesting to note that there are sub micron size (nano crystals) of copper attached to the tip of the dendritic pattern grown. We measured the length of all the six main branches in each of the 6 frames selected. The method used was to find the x and y coordinates of the tip of the selected branch and knowing the coordinates
Fig. 1. Electrodeposition Cell
15650 Pathan et al. Evoluation of dendritic pattern in electrodeposition

of the centre, the length was calculated using the distance formula:
2122
12 yyxxd ………(3)
During the video recording the camera was slightly disturbed in position as is seen from the movie recorded. This shifted the coordinates of the centre of cathode (in terms of pixels) from (165,121) to (162,116), this is equivalent to a net change in position by about 5.8 pixels. For the purpose of calculation of the size of the branches at different stages this has been taken into account. From the coordinates of the tip of branch and centre of deposit, the length of the six different branches were calculated at the interval of 3 minutes using the distance formula shown in equation 3. From the length of the branches so calculated in pixels, the lengths were converted in to mm using the resolution of the picture which was 96 pixels per inch. Using the information of the length of each branch at
different stages of growth (at an interval of 3 minutes) the growth velocity was estimated in mm / minute. Table1 shows the length of different branches in pixels and Table 2 shows the distance in mm for all the six branches at different stages of progress of the growth of the dendritic pattern. Table 3 shows the growth velocity (in mm/minute) at different stages of growth. Table below gives the length of the six branches (in pixels) at interval of 3 minutes. It is seen from the figure that during initial phase, up to about 6 minutes, growth velocity is increasing with time. After about six minutes of growth the gross growth velocity is around 1 mm per minute, however different branches have deviations on either side as discussed earlier. The growth velocity averaged over all the branches decreases slowly form a value of about 1.1 to a value of 0.9 mm / minute during the rest of the growth i.e. from 6 minutes to 18 minutes as is seen in the plot of figure 5. The slow growing and fast growing branches are better identified in this plot.
Fig.2. Actual Photographs of different stages of growth of the electro-deposited dendrite at intervals of 5minutes. First frame is for 5 minutes and the last 6th frame is for 30 minutes of growth
Fig.3. Different stages of growth of the electrodeposited dendrite at intervals of 5 minutes from Fig 2 after converting into two colour bitmap format
15651 International Journal of Current Research, Vol. 7, Issue, 05, pp.15649-15653, May, 2015

Fig. 4. SEM image of a typical tip of branch of copper dendrite
Fig.5. SEM image of a typical tip of branch of copper dendrite
Table 1. Showing the growth of various branches in Pixels
Time Branch Length for Branch (Pixel) min 1 2 3 4 5 6 7
0 0.0 0.0 0.0 0.0 0.0 0.0 0.0 5 23.5 18.8 17.5 20.8 22.2 20.4 17.2
10 43.1 37.2 41.9 44.1 42.5 40.6 33.4 15 60.1 50.5 64.8 57.6 58.2 55.1 49.2 20 72.1 61.3 83.2 79.2 75.6 74.2 58.8 25 85.3 77.4 101.4 96.8 90.4 91.1 65.7 30 99.6 92.4 126.2 107.7 105.2 103.8 69.9
Table below gives the length of the six branches (in mm) at interval of 3 minutes.
Table 2. Showing the growth of various branches in mm
Time (Min)
Branch Length for Branch (mm)
1 2 3 4 5 6 7 0 0 0 0 0 0 0 0 5 6.2 5.0 4.6 5.5 5.9 5.4 4.6
10 11.4 9.8 11.1 11.7 11.2 10.7 8.8 15 15.9 13.4 17.1 15.2 15.4 14.6 13.0 20 19.1 16.2 22.0 21.0 20.0 19.6 15.6 25 22.6 20.5 26.8 25.6 23.9 24.1 17.4 30 26.4 24.5 33.4 28.5 27.8 27.5 18.5
Table below gives the growth velocity of the six branches (in mm/min) at interval of 3 minutes.
Table 3. Showing the growth velocity of various branches in mm/min
Time (Min) Growth Velocity for Branch (mm/min) 1 2 3 4 5 6 7 Mean 0 0.00 0.00 0.00 0.00 0.00 0.00 0.00 0.00 5 1.25 0.99 0.93 1.10 1.17 1.08 0.91 1.06
10 1.14 0.98 1.11 1.17 1.12 1.07 0.88 1.07 15 1.06 0.89 1.14 1.02 1.03 0.97 0.87 1.00 20 0.95 0.81 1.10 1.05 1.00 0.98 0.78 0.95 25 0.90 0.82 1.07 1.02 0.96 0.96 0.70 0.92 30 0.88 0.82 1.11 0.95 0.93 0.92 0.62 0.89
Fig. 6. Showing the progress of length (mm) of various branches with time
Fig. 7. Growth velocity of the six branches of electro deposition of Fig 2 as a function of time
The growth velocity discussed above is the average growth velocity of individual branches calculated on the basis of the total length of the branch at a certain stage and the time corresponding to that stage. However it was found of interest
Table 4. Showing the growth of area, volume and mass of the deposit with me
Time (min)
Area Pixels
Area Volume Mass
mm2 cm2 mm3 cm3 G 0 0 0 0 0 0 0 5 611 42.8 0.43 31.7 0.03165 0.2833
10 1255 87.9 0.88 65 0.06501 0.5819 15 1838 129 1.29 95.2 0.09521 0.8522 20 2462 172 1.72 128 0.12754 1.1415 25 3123 219 2.19 162 0.16178 1.4479 30 3666 257 2.57 190 0.18991 1.6997
15652 Pathan et al. Evoluation of dendritic pattern in electrodeposition
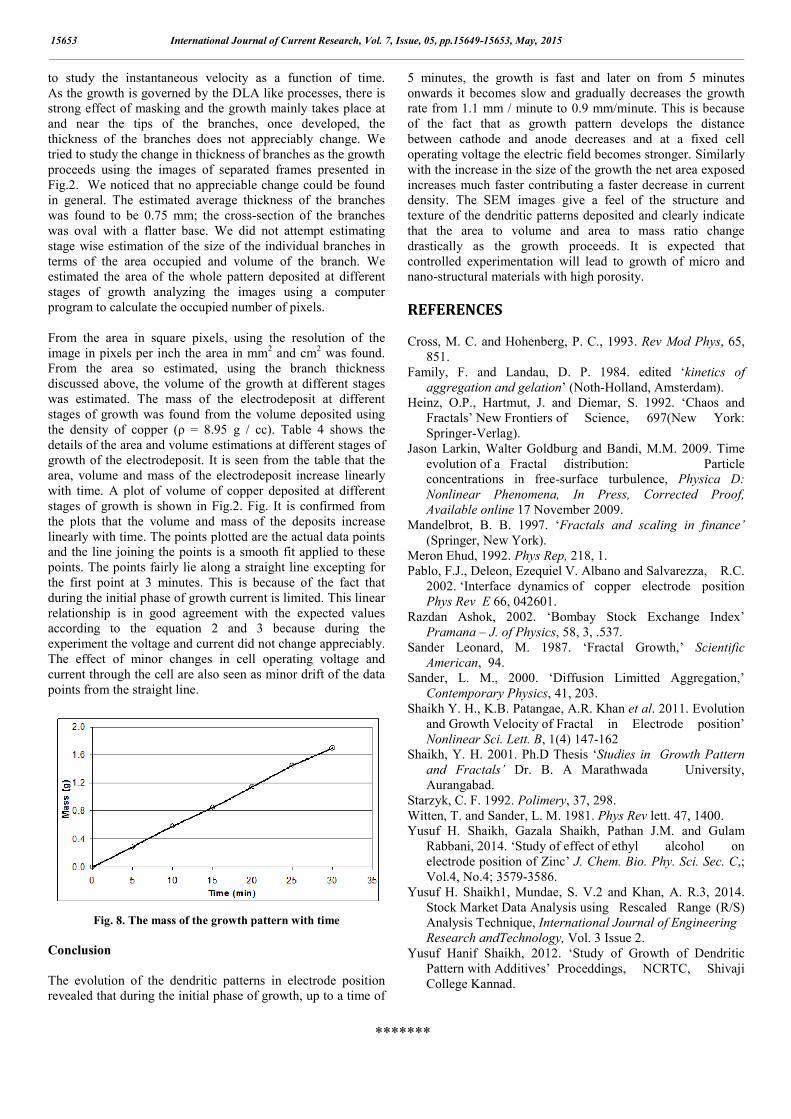
to study the instantaneous velocity as a function of time. As the growth is governed by the DLA like processes, there is strong effect of masking and the growth mainly takes place at and near the tips of the branches, once developed, the thickness of the branches does not appreciably change. We tried to study the change in thickness of branches as the growth proceeds using the images of separated frames presented in Fig.2. We noticed that no appreciable change could be found in general. The estimated average thickness of the branches was found to be 0.75 mm; the cross-section of the branches was oval with a flatter base. We did not attempt estimating stage wise estimation of the size of the individual branches in terms of the area occupied and volume of the branch. We estimated the area of the whole pattern deposited at different stages of growth analyzing the images using a computer program to calculate the occupied number of pixels. From the area in square pixels, using the resolution of the image in pixels per inch the area in mm2 and cm2 was found. From the area so estimated, using the branch thickness discussed above, the volume of the growth at different stages was estimated. The mass of the electrodeposit at different stages of growth was found from the volume deposited using the density of copper (ρ = 8.95 g / cc). Table 4 shows the details of the area and volume estimations at different stages of growth of the electrodeposit. It is seen from the table that the area, volume and mass of the electrodeposit increase linearly with time. A plot of volume of copper deposited at different stages of growth is shown in Fig.2. Fig. It is confirmed from the plots that the volume and mass of the deposits increase linearly with time. The points plotted are the actual data points and the line joining the points is a smooth fit applied to these points. The points fairly lie along a straight line excepting for the first point at 3 minutes. This is because of the fact that during the initial phase of growth current is limited. This linear relationship is in good agreement with the expected values according to the equation 2 and 3 because during the experiment the voltage and current did not change appreciably. The effect of minor changes in cell operating voltage and current through the cell are also seen as minor drift of the data points from the straight line.
Fig. 8. The mass of the growth pattern with time Conclusion The evolution of the dendritic patterns in electrode position revealed that during the initial phase of growth, up to a time of
5 minutes, the growth is fast and later on from 5 minutes onwards it becomes slow and gradually decreases the growth rate from 1.1 mm / minute to 0.9 mm/minute. This is because of the fact that as growth pattern develops the distance between cathode and anode decreases and at a fixed cell operating voltage the electric field becomes stronger. Similarly with the increase in the size of the growth the net area exposed increases much faster contributing a faster decrease in current density. The SEM images give a feel of the structure and texture of the dendritic patterns deposited and clearly indicate that the area to volume and area to mass ratio change drastically as the growth proceeds. It is expected that controlled experimentation will lead to growth of micro and nano-structural materials with high porosity.
REFERENCES Cross, M. C. and Hohenberg, P. C., 1993. Rev Mod Phys, 65,
851. Family, F. and Landau, D. P. 1984. edited ‘kinetics of
aggregation and gelation’ (Noth-Holland, Amsterdam). Heinz, O.P., Hartmut, J. and Diemar, S. 1992. ‘Chaos and
Fractals’ New Frontiers of Science, 697(New York: Springer-Verlag).
Jason Larkin, Walter Goldburg and Bandi, M.M. 2009. Time evolution of a Fractal distribution: Particle concentrations in free-surface turbulence, Physica D: Nonlinear Phenomena, In Press, Corrected Proof, Available online 17 November 2009.
Mandelbrot, B. B. 1997. ‘Fractals and scaling in finance’ (Springer, New York).
Meron Ehud, 1992. Phys Rep, 218, 1. Pablo, F.J., Deleon, Ezequiel V. Albano and Salvarezza, R.C.
2002. ‘Interface dynamics of copper electrode position Phys Rev E 66, 042601.
Razdan Ashok, 2002. ‘Bombay Stock Exchange Index’ Pramana – J. of Physics, 58, 3, .537.
Sander Leonard, M. 1987. ‘Fractal Growth,’ Scientific American, 94.
Sander, L. M., 2000. ‘Diffusion Limitted Aggregation,’ Contemporary Physics, 41, 203.
Shaikh Y. H., K.B. Patangae, A.R. Khan et al. 2011. Evolution and Growth Velocity of Fractal in Electrode position’ Nonlinear Sci. Lett. B, 1(4) 147-162
Shaikh, Y. H. 2001. Ph.D Thesis ‘Studies in Growth Pattern and Fractals’ Dr. B. A Marathwada University, Aurangabad.
Starzyk, C. F. 1992. Polimery, 37, 298. Witten, T. and Sander, L. M. 1981. Phys Rev lett. 47, 1400. Yusuf H. Shaikh, Gazala Shaikh, Pathan J.M. and Gulam
Rabbani, 2014. ‘Study of effect of ethyl alcohol on electrode position of Zinc’ J. Chem. Bio. Phy. Sci. Sec. C,; Vol.4, No.4; 3579-3586.
Yusuf H. Shaikh1, Mundae, S. V.2 and Khan, A. R.3, 2014. Stock Market Data Analysis using Rescaled Range (R/S) Analysis Technique, International Journal of Engineering Research andTechnology, Vol. 3 Issue 2.
Yusuf Hanif Shaikh, 2012. ‘Study of Growth of Dendritic Pattern with Additives’ Proceddings, NCRTC, Shivaji College Kannad.
*******
15653 International Journal of Current Research, Vol. 7, Issue, 05, pp.15649-15653, May, 2015