isprs benchmark for multi-platform photogrammetry · isprs benchmark for multi-platform...
TRANSCRIPT

ISPRS BENCHMARK FOR MULTI-PLATFORM PHOTOGRAMMETRY
F. Nexa, M. Gerkeb, F. Remondinoa, H.-J. Przybillac, M. Bäumkerc, A. Zurhorstd
a 3D Optical Metrology (3DOM) unit, Bruno Kessler Foundation (FBK), Italy
[email protected], [email protected] b University of Twente, Faculty of Geo-Information Science and Earth Observation (ITC),
Department of Earth Observation Science, The Netherlands [email protected] c Hochschule Bochum, Faculty of Geodesy, Bochum, Germany, [email protected]
d Aerometrics GmbH, Werne, Germany, [email protected]
Commission III, WG III/1
KEY WORDS: Photogrammetry, Matching, Orientation, Data, Integration, Multisensor, Accuracy, Estimation
ABSTRACT:
Airborne high resolution oblique imagery systems and RPAS/UAVs are very promising technologies that will keep on influencing
the development of geomatics in the future years closing the gap between terrestrial and classical aerial acquisitions. These two
platforms are also a promising solution for National Mapping and Cartographic Agencies (NMCA) as they allow deriving
complementary mapping information. Although the interest for the registration and integration of aerial and terrestrial data is
constantly increasing, only limited work has been truly performed on this topic. Several investigations still need to be undertaken
concerning algorithms ability for automatic co-registration, accurate point cloud generation and feature extraction from multi-
platform image data. One of the biggest obstacles is the non-availability of reliable and free datasets to test and compare new
algorithms and procedures.
The Scientific Initiative “ISPRS benchmark for multi-platform photogrammetry”, run in collaboration with EuroSDR, aims at
collecting and sharing state-of-the-art multi-sensor data (oblique airborne, UAV-based and terrestrial images) over an urban area.
These datasets are used to assess different algorithms and methodologies for image orientation and dense matching. As ground truth,
Terrestrial Laser Scanning (TLS), Aerial Laser Scanning (ALS) as well as topographic networks and GNSS points were acquired to
compare 3D coordinates on check points (CPs) and evaluate cross sections and residuals on generated point cloud surfaces. In this
paper, the acquired data, the pre-processing steps, the evaluation procedures as well as some preliminary results achieved with
commercial software will be presented.
1. INTRODUCTION
1.1 Motivations
In the last years we are witnessing a closer integration of multi-
platform and multi-perspective aerial and close-range
photogrammetry. This is due to the great developments of
imaging sensors and software solutions and to the awareness of
the potentials of data integration methods. The introduction of
UAV platforms and multi-head oblique image systems mounted
on manned airplanes allow the collection of more detailed and
complete information compared to traditional image acquisition
flights. These new types of data are closing the gap between
terrestrial and traditional aerial imaging, becoming the starting
point for new research and the development of new
applications. The integration will be helpful for a broad range of
applications, like city modelling, where a seamless geometric
representation at different resolutions is desired. Another
example is cultural heritage documentation, where for instance
a selection of buildings is modelled in very high detail from
terrestrial and multi-view oblique UAV-images, but the larger
surrounding area is covered by airborne high resolution multi-
view images.
Although a combination of these different kinds of images
seems attractive, a fully automatic and rigorous geometric
processing of datasets captured from different imaging
platforms, at different scale and covering different perspectives
of the target object, is so far sporadically treated (Shan et al.,
2013; Frahm et al., 2012; Wendel et al., 2012; Agarwal et al.,
2011; Gruen et al., 2005).
In the research community a common way to evaluate new
platforms, data and algorithm is to prepare and share
benchmarks. The success and visibility of some benchmark
activities like the Middlebury test on dense image matching
(http://vision.middlebury.edu/stereo), the ISPRS WGIII/4 test
on urban object detection and 3D building reconstruction
(Rottensteiner et al., 2013), the KITTI suite for mobile robotics
and autonomous driving research (Geiger et al., 2013) or the
image matching benchmark promoted by EuroSDR (Haala,
2014), show that the provision of common datasets, in
combination with a scientific task, allow researchers to
objectively compare their own methods with those of others and
to identify common problems and open challenges.
1.2 Objectives of the proposed benchmark
Inspired by these concepts, within an ISPRS Scientific Initiative
and in collaboration with EuroSDR, a benchmark was proposed
with the aims of creating and managing a new image dataset for
the research community, consisting of different typologies of
images over the same (built-up) area. In particular the project
consists of acquisitions and processing of three datasets (on two
test areas) that will be provided to participants (together with
ground truth data): airborne oblique images, covering all 4
cardinal and the nadir directions; UAV images, consisting of
nadir and oblique images; convergent and redundant terrestrial
images (of some selected buildings).
The aims of the Scientific Initiative (SI) are primarily two:
(1) to provide data on different areas, focusing on different
terrain and building style and epochs;
ISPRS Annals of the Photogrammetry, Remote Sensing and Spatial Information Sciences, Volume II-3/W4, 2015 PIA15+HRIGI15 – Joint ISPRS conference 2015, 25–27 March 2015, Munich, Germany
This contribution has been peer-reviewed. The double-blind peer-review was conducted on the basis of the full paper. doi:10.5194/isprsannals-II-3-W4-135-2015
135
(2) to assess the accuracy and reliability of the current methods
in the calibration/orientation as well as integration of those data
for dense point clouds generation and feature extraction.
Since the data will be open, other research topics, like
investigation into radiometry of multi-view images (BRDF) or
semantic analysis is expected and appreciated as well, but in the
beginning it is not part of the benchmark as such. The
evaluation of the orientation results are performed using
primarily check points (CKs). The point clouds delivered by
participants will be compared to ground truth data (plane fitting,
cross-sections, etc.).
In order to minimize problems in conjunction with multi-
temporal acquisitions, data were capture within a short time
difference. On the other hand, some already existing data were
used as ground truth (i.e. ALS).
The project has been defined in collaboration with EuroSDR
and in particular with the research activity on dense image
matching (Cavegn, 2014) undertaken by EuroSDR Commission
II.
An open benchmark dataset with these properties does not exist
yet and it is targeted to the ISPRS and the Computer Vision
communities. Moreover, this project will contribute to assess
the potential of this data and their benefit and integration for
mapping purposes, for instance pushing their use by public
administration, NMCA or other researchers in neighbouring
domains.
In this paper, a detailed description of the acquired data over the
test areas will be given first. The evaluation procedures and
some preliminary tests performed on the selected dataset will be
then shown. A final discussion about the future benchmark
developments will conclude the article.
2. BENCHMARK AREAS AND DATA ACQUISITIONS
Two different test areas have been surveyed over the city of
Dortmund (Fig. 1 and 2). These areas have been chosen
according to different criteria, such as:
(i) different types of buildings;
(ii) safety for people and instruments during the acquisitions;
(iii) easy accessibility to the whole area;
(iv) technical support and availability of local surveying
companies such as the company Aerometrics
(http://www.aerometrics.de) for the UAV image acquisition and
the Bochum University of Applied Sciences for TLS and
control point surveying by GNSS and total station;
(iv) possibility to get flight permission over build-up areas (for
UAV flights).
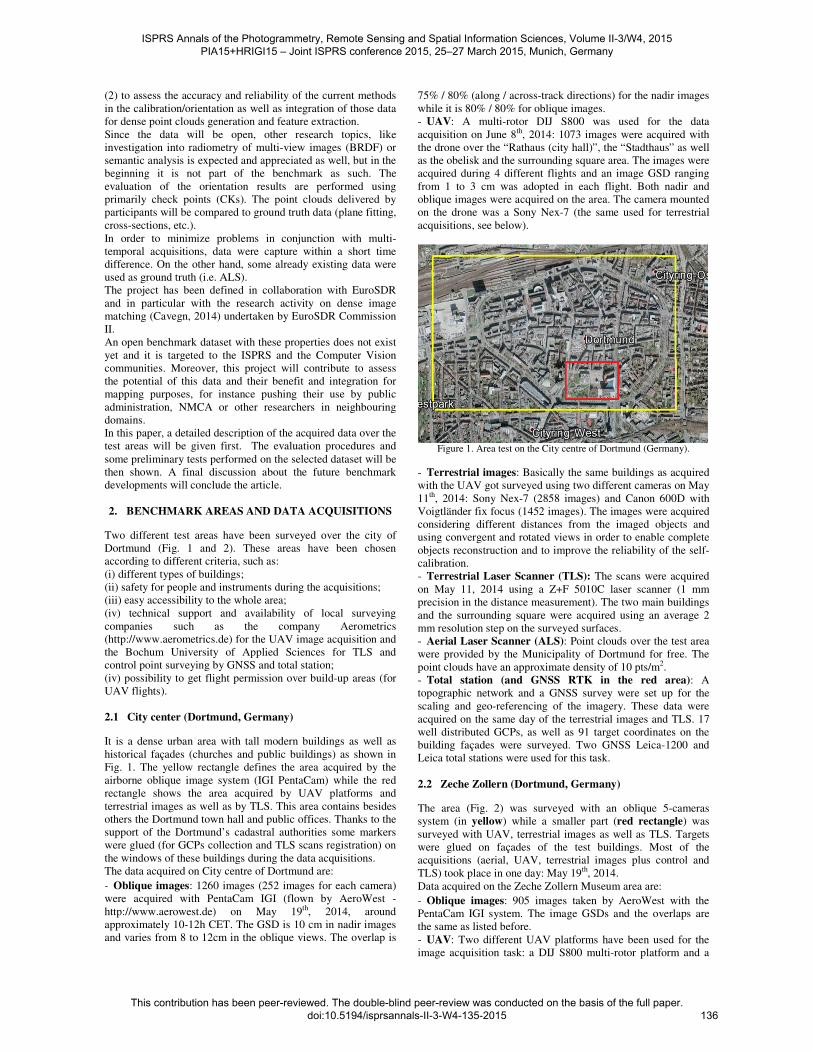
2.1 City center (Dortmund, Germany)
It is a dense urban area with tall modern buildings as well as
historical façades (churches and public buildings) as shown in
Fig. 1. The yellow rectangle defines the area acquired by the
airborne oblique image system (IGI PentaCam) while the red
rectangle shows the area acquired by UAV platforms and
terrestrial images as well as by TLS. This area contains besides
others the Dortmund town hall and public offices. Thanks to the
support of the Dortmund’s cadastral authorities some markers
were glued (for GCPs collection and TLS scans registration) on
the windows of these buildings during the data acquisitions.
The data acquired on City centre of Dortmund are:
- Oblique images: 1260 images (252 images for each camera)
were acquired with PentaCam IGI (flown by AeroWest -
http://www.aerowest.de) on May 19th, 2014, around
approximately 10-12h CET. The GSD is 10 cm in nadir images
and varies from 8 to 12cm in the oblique views. The overlap is
75% / 80% (along / across-track directions) for the nadir images
while it is 80% / 80% for oblique images.
- UAV: A multi-rotor DIJ S800 was used for the data
acquisition on June 8th, 2014: 1073 images were acquired with
the drone over the “Rathaus (city hall)”, the “Stadthaus” as well
as the obelisk and the surrounding square area. The images were
acquired during 4 different flights and an image GSD ranging
from 1 to 3 cm was adopted in each flight. Both nadir and
oblique images were acquired on the area. The camera mounted
on the drone was a Sony Nex-7 (the same used for terrestrial
acquisitions, see below).
Figure 1. Area test on the City centre of Dortmund (Germany).
- Terrestrial images: Basically the same buildings as acquired
with the UAV got surveyed using two different cameras on May
11th, 2014: Sony Nex-7 (2858 images) and Canon 600D with
Voigtländer fix focus (1452 images). The images were acquired
considering different distances from the imaged objects and
using convergent and rotated views in order to enable complete
objects reconstruction and to improve the reliability of the self-
calibration.
- Terrestrial Laser Scanner (TLS): The scans were acquired
on May 11, 2014 using a Z+F 5010C laser scanner (1 mm
precision in the distance measurement). The two main buildings
and the surrounding square were acquired using an average 2
mm resolution step on the surveyed surfaces.
- Aerial Laser Scanner (ALS): Point clouds over the test area
were provided by the Municipality of Dortmund for free. The
point clouds have an approximate density of 10 pts/m2.
- Total station (and GNSS RTK in the red area): A
topographic network and a GNSS survey were set up for the
scaling and geo-referencing of the imagery. These data were
acquired on the same day of the terrestrial images and TLS. 17
well distributed GCPs, as well as 91 target coordinates on the
building façades were surveyed. Two GNSS Leica-1200 and
Leica total stations were used for this task.
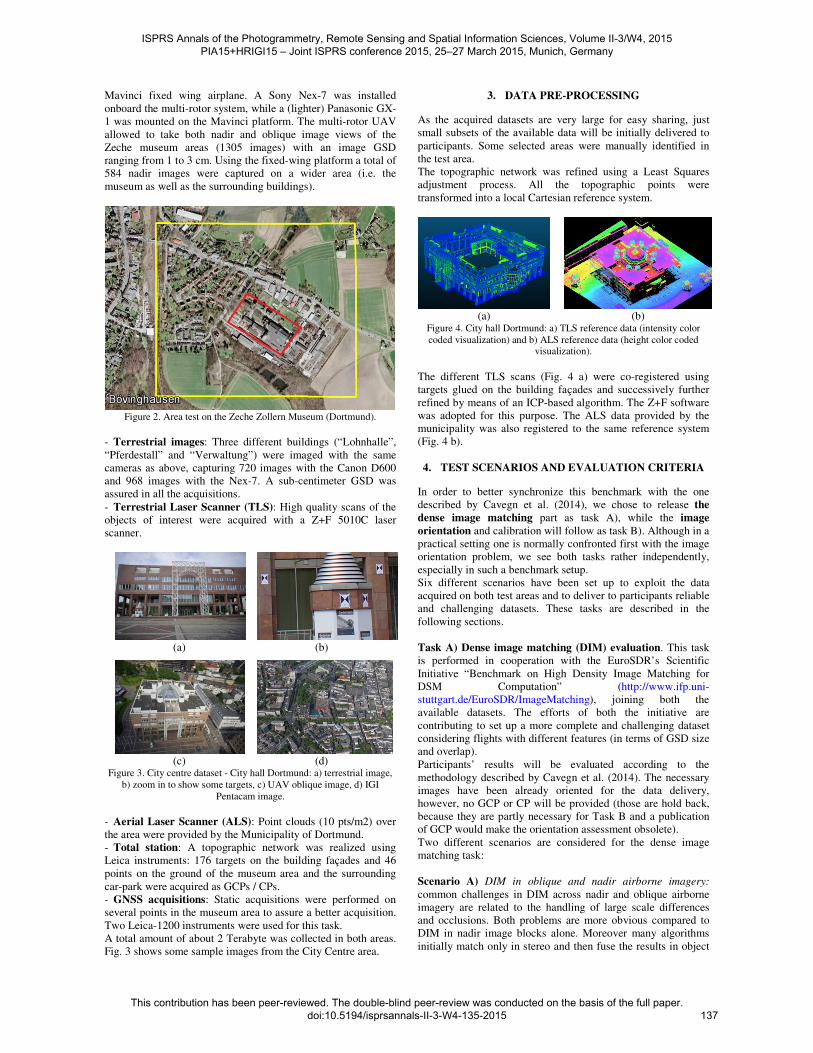
2.2 Zeche Zollern (Dortmund, Germany)
The area (Fig. 2) was surveyed with an oblique 5-cameras
system (in yellow) while a smaller part (red rectangle) was
surveyed with UAV, terrestrial images as well as TLS. Targets
were glued on façades of the test buildings. Most of the
acquisitions (aerial, UAV, terrestrial images plus control and
TLS) took place in one day: May 19th, 2014.
Data acquired on the Zeche Zollern Museum area are:
- Oblique images: 905 images taken by AeroWest with the
PentaCam IGI system. The image GSDs and the overlaps are
the same as listed before.
- UAV: Two different UAV platforms have been used for the
image acquisition task: a DIJ S800 multi-rotor platform and a
ISPRS Annals of the Photogrammetry, Remote Sensing and Spatial Information Sciences, Volume II-3/W4, 2015 PIA15+HRIGI15 – Joint ISPRS conference 2015, 25–27 March 2015, Munich, Germany
This contribution has been peer-reviewed. The double-blind peer-review was conducted on the basis of the full paper. doi:10.5194/isprsannals-II-3-W4-135-2015
136
Mavinci fixed wing airplane. A Sony Nex-7 was installed
onboard the multi-rotor system, while a (lighter) Panasonic GX-
1 was mounted on the Mavinci platform. The multi-rotor UAV
allowed to take both nadir and oblique image views of the
Zeche museum areas (1305 images) with an image GSD
ranging from 1 to 3 cm. Using the fixed-wing platform a total of
584 nadir images were captured on a wider area (i.e. the
museum as well as the surrounding buildings).
Figure 2. Area test on the Zeche Zollern Museum (Dortmund).
- Terrestrial images: Three different buildings (“Lohnhalle”,
“Pferdestall” and “Verwaltung”) were imaged with the same
cameras as above, capturing 720 images with the Canon D600
and 968 images with the Nex-7. A sub-centimeter GSD was
assured in all the acquisitions.
- Terrestrial Laser Scanner (TLS): High quality scans of the
objects of interest were acquired with a Z+F 5010C laser
scanner.
(a) (b)
(c) (d)
Figure 3. City centre dataset - City hall Dortmund: a) terrestrial image,
b) zoom in to show some targets, c) UAV oblique image, d) IGI
Pentacam image.
- Aerial Laser Scanner (ALS): Point clouds (10 pts/m2) over
the area were provided by the Municipality of Dortmund.
- Total station: A topographic network was realized using
Leica instruments: 176 targets on the building façades and 46
points on the ground of the museum area and the surrounding
car-park were acquired as GCPs / CPs.
- GNSS acquisitions: Static acquisitions were performed on
several points in the museum area to assure a better acquisition.
Two Leica-1200 instruments were used for this task.
A total amount of about 2 Terabyte was collected in both areas.
Fig. 3 shows some sample images from the City Centre area.
3. DATA PRE-PROCESSING
As the acquired datasets are very large for easy sharing, just
small subsets of the available data will be initially delivered to
participants. Some selected areas were manually identified in
the test area.
The topographic network was refined using a Least Squares
adjustment process. All the topographic points were
transformed into a local Cartesian reference system.
(a) (b)
Figure 4. City hall Dortmund: a) TLS reference data (intensity color
coded visualization) and b) ALS reference data (height color coded visualization).
The different TLS scans (Fig. 4 a) were co-registered using
targets glued on the building façades and successively further
refined by means of an ICP-based algorithm. The Z+F software
was adopted for this purpose. The ALS data provided by the
municipality was also registered to the same reference system
(Fig. 4 b).
4. TEST SCENARIOS AND EVALUATION CRITERIA
In order to better synchronize this benchmark with the one
described by Cavegn et al. (2014), we chose to release the
dense image matching part as task A), while the image
orientation and calibration will follow as task B). Although in a
practical setting one is normally confronted first with the image
orientation problem, we see both tasks rather independently,
especially in such a benchmark setup.
Six different scenarios have been set up to exploit the data
acquired on both test areas and to deliver to participants reliable
and challenging datasets. These tasks are described in the
following sections.
Task A) Dense image matching (DIM) evaluation. This task
is performed in cooperation with the EuroSDR’s Scientific
Initiative “Benchmark on High Density Image Matching for
DSM Computation” (http://www.ifp.uni-
stuttgart.de/EuroSDR/ImageMatching), joining both the
available datasets. The efforts of both the initiative are
contributing to set up a more complete and challenging dataset
considering flights with different features (in terms of GSD size
and overlap).
Participants’ results will be evaluated according to the
methodology described by Cavegn et al. (2014). The necessary
images have been already oriented for the data delivery,
however, no GCP or CP will be provided (those are hold back,
because they are partly necessary for Task B and a publication
of GCP would make the orientation assessment obsolete).
Two different scenarios are considered for the dense image
matching task:
Scenario A) DIM in oblique and nadir airborne imagery:
common challenges in DIM across nadir and oblique airborne
imagery are related to the handling of large scale differences
and occlusions. Both problems are more obvious compared to
DIM in nadir image blocks alone. Moreover many algorithms
initially match only in stereo and then fuse the results in object
ISPRS Annals of the Photogrammetry, Remote Sensing and Spatial Information Sciences, Volume II-3/W4, 2015 PIA15+HRIGI15 – Joint ISPRS conference 2015, 25–27 March 2015, Munich, Germany
This contribution has been peer-reviewed. The double-blind peer-review was conducted on the basis of the full paper. doi:10.5194/isprsannals-II-3-W4-135-2015
137
space. Here different approaches on how to actually do this
fusion accurately, also taking into account the scale differences,
are pursued.
Both datasets - the one reported in Cavegn et al. (2014), and the
one described in this paper - are used for this benchmark. While
the former consists of Leica RCD oblique camera system
imagery, the latter one is from IGI (Pentacam). Another
difference is in the overlap, which is around 80/80% in the latter
dataset and 70/50% in the former one.
A sub-dataset of the Zeche Zollern area has been selected. In
particular the “Verwaltung” will be used for DIM evaluation.
The 85 oblique images from this area and their exterior
orientations, as well as camera calibration protocols, are
delivered to participants. The orientation process resulted in
RMSE values (on GCPs and CPs) lower than the GSD size and
the bundle block adjustment report (by Pix4D
(www.pix4d.com) is provided as well. The result evaluation
will be performed using the TLS data of the administration
building. For details on the evaluation method refer to section 5
and to (Cavegn et al., 2014).
Scenario B) DIM in a combined terrestrial and UAV image
block: very detailed 3D point clouds are expected from the
combination of terrestrial and UAV image blocks, showing a
GSD of 2 cm maximum. Challenges mentioned above for
scenario A hold also here, especially the fact that not only nadir
and oblique, but ground-based horizontally oriented images are
included, making the task even more difficult.
The UAV and terrestrial images as well as their orientations
focusing on the administration building will be delivered. The
image orientation and calibration has been performed with
Pix4D as well. 37 control points, well distributed around and
glued on the administration building itself, were used. Residual
RMSE at control points are (X:5mm, Y:6mm, Z:8mm) while
the residuals at independent check points (CKs) are (X:5mm,
Y:7mm, Z:2mm).
In order to challenge the participants of the dense matching
benchmark, it was decided not to use the complete block of 867
UAV and terrestrial images in total. Although the large number
would be possibly challenging already for some methods, the
number of images was reduced in order to have less redundant
images in the scene, making more evident the matching errors
(gaps, outliers, especially at problematic areas like sharp edges).
The method proposed by Alsadik et al. (2014) was used to
reduce the number of images according to coverage: given the
dense point cloud processed by the Pix4d software as input,
those images necessary to cover each point with 3 images were
selected using this algorithm. Effectively, this means that each
point is visible in at least 3 images. There might be areas where
a larger coverage is realised, but the initial large redundancy is
no more there.
The point clouds computed by participants will be compared to
the ground truth according to the methodology referred to in
Scenario A.
Task B) Image orientation evaluation. This task focuses on
the image orientation assessment of different image block
configurations. Both areas in Dortmund are considered, but
different input data are delivered according to the goal of each
conceived test. For this reason, different scenarios have been set
up. For each scenario a set of images will be delivered together
with GCPs coordinates. Image coordinates of both GCPs and
CPs will be provided, too. Participants will be always requested
to deliver, (a) average reprojection error per image, (b) CPs
coordinates in object space and (c) the sparse tie-points point
cloud retrieved with a bundle adjustment method. The
evaluation will be performed considering the residuals on CPs
and the mean deviation of sparse point cloud from reference
data (TLS and ALS) on some selected planar surfaces. All
scenarios are still not available to participants (February 2015),
due to the lack of a complete GNSS survey that will be finished
in Spring 2015.
Scenario A) Orientation of large airborne multi-view image
image blocks: the whole oblique/nadir image block (1204
images, IGI Pentacam) will be provided to participants together
with a set of GCPs (both image and ground coordinates) and
CPs (only image coordinates). The approximate orientation
achieved by direct sensor orientation solution1, and the lab
camera calibration will be disclosed, too. The results evaluation
will be performed on (a), (b) and (c). The sparse point cloud
will be compared to some reference planes, derived from ALS
and TLS (in correspondence of roof faces and large building
facades) to assess the block deformations, especially in the
border of the block. Details on the evaluation method will be
given below in section 5.
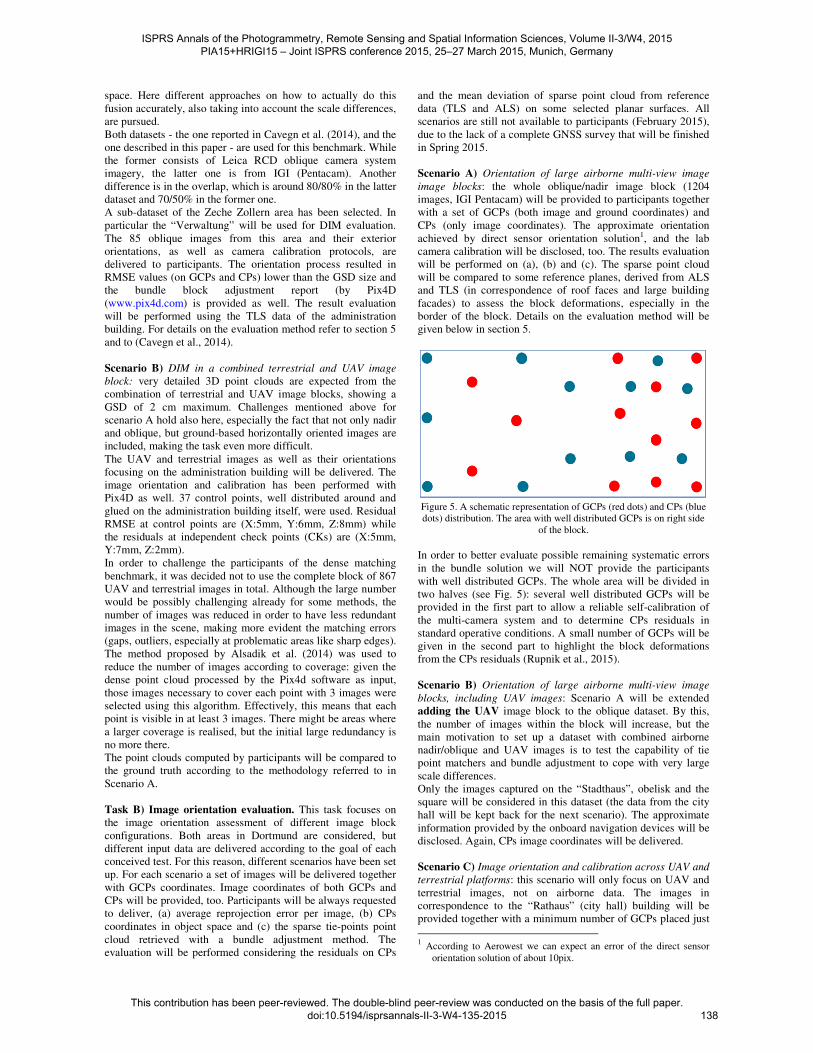
Figure 5. A schematic representation of GCPs (red dots) and CPs (blue
dots) distribution. The area with well distributed GCPs is on right side
of the block.
In order to better evaluate possible remaining systematic errors
in the bundle solution we will NOT provide the participants
with well distributed GCPs. The whole area will be divided in
two halves (see Fig. 5): several well distributed GCPs will be
provided in the first part to allow a reliable self-calibration of
the multi-camera system and to determine CPs residuals in
standard operative conditions. A small number of GCPs will be
given in the second part to highlight the block deformations
from the CPs residuals (Rupnik et al., 2015).
Scenario B) Orientation of large airborne multi-view image
blocks, including UAV images: Scenario A will be extended
adding the UAV image block to the oblique dataset. By this,
the number of images within the block will increase, but the
main motivation to set up a dataset with combined airborne
nadir/oblique and UAV images is to test the capability of tie
point matchers and bundle adjustment to cope with very large
scale differences.
Only the images captured on the “Stadthaus”, obelisk and the
square will be considered in this dataset (the data from the city
hall will be kept back for the next scenario). The approximate
information provided by the onboard navigation devices will be
disclosed. Again, CPs image coordinates will be delivered.
Scenario C) Image orientation and calibration across UAV and
terrestrial platforms: this scenario will only focus on UAV and
terrestrial images, not on airborne data. The images in
correspondence to the “Rathaus” (city hall) building will be
provided together with a minimum number of GCPs placed just
1 According to Aerowest we can expect an error of the direct sensor
orientation solution of about 10pix.
ISPRS Annals of the Photogrammetry, Remote Sensing and Spatial Information Sciences, Volume II-3/W4, 2015 PIA15+HRIGI15 – Joint ISPRS conference 2015, 25–27 March 2015, Munich, Germany
This contribution has been peer-reviewed. The double-blind peer-review was conducted on the basis of the full paper. doi:10.5194/isprsannals-II-3-W4-135-2015
138
on one side building and the approximate position given by the
onboard GNSS devices. The image coordinates of GCPs and
CPs will be provided to the users as well. As in the other
scenarios, the output for the test evaluation will be (a), (b), (c).
Scenario D) Absolute image orientation of UAV images using
airborne nadir and oblique imagery and their known EO/IO
elements: the main goal (compared to scenario B) will be to
assess the capability to correctly orient UAV images just using
the oblique images, and not using GCP. This is a quite relevant
scenario for practical applications. Although differential, 2-
phase receivers are nowadays available for UAV, still there is a
need for an existing reference station. To use a reference
network is not possible in all countries, and for rotary wing
systems with a 2- or even 6- DOF gimbal the direct geo-
referencing is not solved at all. However, some (even outdated)
airborne images with a georeference might be available and this
scenario should help to understand the challenges when those
existing images are used to co-register the UAV image block.
Though it is likely that the absolute orientation of UAV images
will not be in sub-pixel range since the airborne oblique have a
4-5 times larger resolution, it will be interesting how accurate
and reliable tie information can be retrieved.
The oblique images including full internal and external
orientation of the Zollern Zeche test area will be provided to
participants as input (i.e. the same information as used in Task
A, Scenario A). UAV and terrestrial images captured on the
“Lohnhalle” and “Pferdestall” buildings will be provided too:
both nadir flight (acquired with the Mavinci platform) and the
oblique images (multi-rotor platform) will be considered. As in
the former scenarios, the approximate onboard navigation data
will be provided with images. Only the image coordinates of
some CPs will be given together with the approximate GPS
information. The evaluation will be performed in the same way
as described in the other scenarios.
5. EVALUATION PROCEDURES AND FIRST
RESULTS
For each task – image orientation and dense image matching –
dedicated evaluation methods were applied, afterwards briefly
described together with some results. It’s not the aim of the
paper to rate a certain image orientation or dense image
matching algorithm. Therefore the name of the used software
won’t be disclosed.
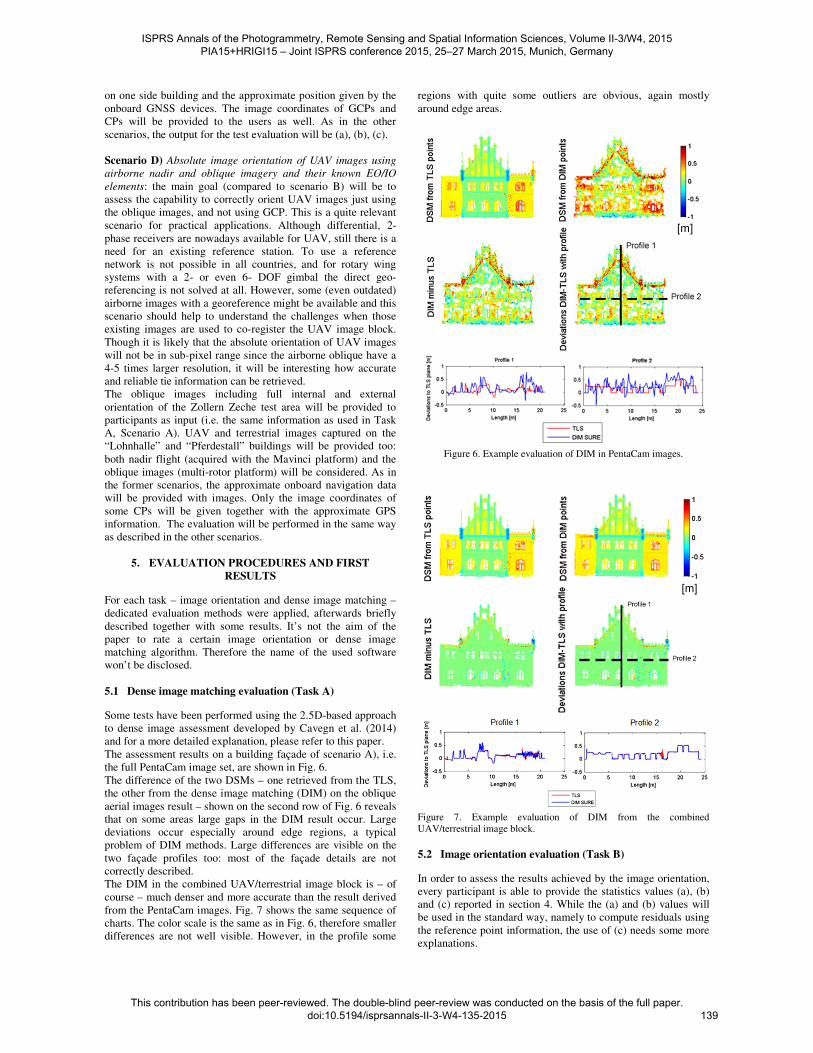
5.1 Dense image matching evaluation (Task A)
Some tests have been performed using the 2.5D-based approach
to dense image assessment developed by Cavegn et al. (2014)
and for a more detailed explanation, please refer to this paper.
The assessment results on a building façade of scenario A), i.e.
the full PentaCam image set, are shown in Fig. 6.
The difference of the two DSMs – one retrieved from the TLS,
the other from the dense image matching (DIM) on the oblique
aerial images result – shown on the second row of Fig. 6 reveals
that on some areas large gaps in the DIM result occur. Large
deviations occur especially around edge regions, a typical
problem of DIM methods. Large differences are visible on the
two façade profiles too: most of the façade details are not
correctly described.
The DIM in the combined UAV/terrestrial image block is – of
course – much denser and more accurate than the result derived
from the PentaCam images. Fig. 7 shows the same sequence of
charts. The color scale is the same as in Fig. 6, therefore smaller
differences are not well visible. However, in the profile some
regions with quite some outliers are obvious, again mostly
around edge areas.
Figure 6. Example evaluation of DIM in PentaCam images.
Figure 7. Example evaluation of DIM from the combined
UAV/terrestrial image block.
5.2 Image orientation evaluation (Task B)
In order to assess the results achieved by the image orientation,
every participant is able to provide the statistics values (a), (b)
and (c) reported in section 4. While the (a) and (b) values will
be used in the standard way, namely to compute residuals using
the reference point information, the use of (c) needs some more
explanations.
[m]
[m]
ISPRS Annals of the Photogrammetry, Remote Sensing and Spatial Information Sciences, Volume II-3/W4, 2015 PIA15+HRIGI15 – Joint ISPRS conference 2015, 25–27 March 2015, Munich, Germany
This contribution has been peer-reviewed. The double-blind peer-review was conducted on the basis of the full paper. doi:10.5194/isprsannals-II-3-W4-135-2015
139
Given a reference point cloud information of a sufficient
accuracy – in this case better than the expected accuracy of the
tie points – we search for big planar faces within that reference.
Those are for instance large roof or façade planes in TLS or
ALS data.
In order to find planar faces we apply the region growing
method by Vosselman (2012), then we fit planes and analyse
both, the residuals and the eigenvalues. Different parameters are
considered to ensure sufficiently planar faces.
First, point-to-plane residuals and their standard deviations are
computed: these values must not be significantly larger than the
expected mean point error. Further, we compute the curvature
of the planes from the eigenvalues L:
� � ��/��� � � � ��) (1)
The curvature must be smaller than a threshold which can be
derived from the ellipsoidal shape of the tensor, described by L1
L2 and L3. In the sum constituting the denominator, L3 is
negligible, because from the segment growing we can already
assume an approximate planar surface. In our experiments
Cmax=8E-5 is used, i.e. L3 must not be larger than 0.008% of the
extent in the horizontal plane. At the same time L1 and L2 are
requested to be larger than 3m.
Figure 8. Selected reference planes from the “City hall” TLS/ALS data
and computed plane normals. Colors refer to different planes.
For the evaluation of the actual tie points we are interested in
the direction of the tie point offset to the reference plane. To do
that, the normal vector direction must be defined on the
reference data in order to point outside the building. This is
done by computing connecting building components and
assuming that the collection of planes being part of a certain
component constitutes a single building entity. Hence, the
normals need to point away from the centre of the respective
connected component. An example of this is shown in Fig. 8:
both TLS/ALS of the city hall are considered as reference in
this figure. Besides the planes also the corresponding reference
points are stored and used in the subsequent steps.
The individual tie points are then processed as follows: for each
tie point the corresponding plane from the reference (if any) is
selected. This is done by finding the closest reference point and
checking if the tie point after being projected onto the plane that
belongs to that reference point falls within the boundaries of the
reference plane.
To do that, a rototranslation of the reference system is
performed to transform the 3D problem into a 2.5D problem
(i.e. from the model in Fig.8 to the raster map of a single façade
shown in Fig. 9). This means that the local Z-coordinate of
points positioned on the plane will be 0 after transformation;
otherwise it will be according to the (signed) plane distance. A
candidate tie point is assigned to that plane if it is surrounded by
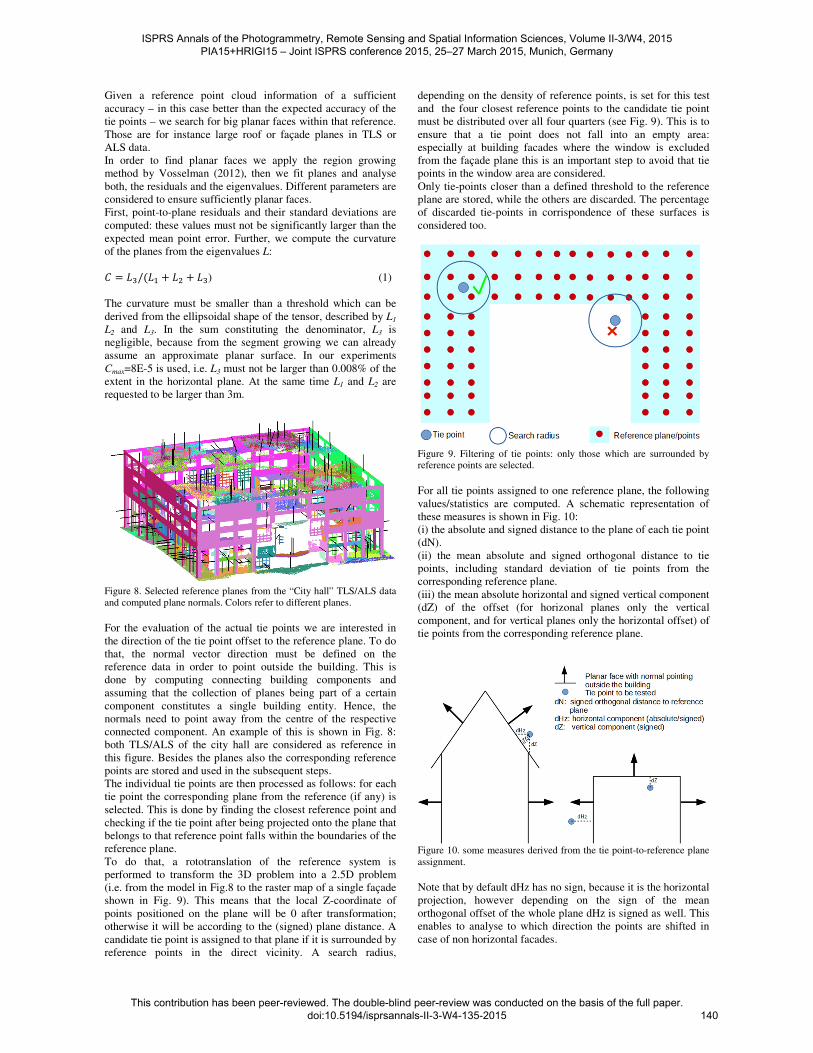
reference points in the direct vicinity. A search radius,
depending on the density of reference points, is set for this test
and the four closest reference points to the candidate tie point
must be distributed over all four quarters (see Fig. 9). This is to
ensure that a tie point does not fall into an empty area:
especially at building facades where the window is excluded
from the façade plane this is an important step to avoid that tie
points in the window area are considered.
Only tie-points closer than a defined threshold to the reference
plane are stored, while the others are discarded. The percentage
of discarded tie-points in corrispondence of these surfaces is
considered too.
Figure 9. Filtering of tie points: only those which are surrounded by reference points are selected.
For all tie points assigned to one reference plane, the following
values/statistics are computed. A schematic representation of
these measures is shown in Fig. 10:
(i) the absolute and signed distance to the plane of each tie point
(dN).
(ii) the mean absolute and signed orthogonal distance to tie
points, including standard deviation of tie points from the
corresponding reference plane.
(iii) the mean absolute horizontal and signed vertical component
(dZ) of the offset (for horizonal planes only the vertical
component, and for vertical planes only the horizontal offset) of
tie points from the corresponding reference plane.
Figure 10. some measures derived from the tie point-to-reference plane
assignment.
Note that by default dHz has no sign, because it is the horizontal
projection, however depending on the sign of the mean
orthogonal offset of the whole plane dHz is signed as well. This
enables to analyse to which direction the points are shifted in
case of non horizontal facades.
ISPRS Annals of the Photogrammetry, Remote Sensing and Spatial Information Sciences, Volume II-3/W4, 2015 PIA15+HRIGI15 – Joint ISPRS conference 2015, 25–27 March 2015, Munich, Germany
This contribution has been peer-reviewed. The double-blind peer-review was conducted on the basis of the full paper. doi:10.5194/isprsannals-II-3-W4-135-2015
140
(a)
(b)
Figure 11. Evaluation of a dense point cloud: (a) signed distance from our approach, (b) absoute point-to-point distance. Maximum absolute
error 10cm in both cases.
In order to demonstrate the suitability of evaluation measures a
dense point cloud is first considered as test data (Fig.11). The
reference is the TLS dataset of the city hall. The signed
distances of points to the reference planes, according to our
method described in (i), are shown in Fig. 11a. On the other
hand, the same dataset but just using the simple Point-to-Point
asolute distance is shown in Fig. 11b.
The absolute distance value is comparable in both examples but
the sign provided by the proposed method helps to further
analyse the results: distances are positive on the right part of the
front façade (i.e. with an offset pointing outside of the building),
while the opposite happens on the other facades where distances
are mostly negative, indicating some overall deformation since
there the point show an inward offset.
Because of the sparse distribution of tie point clouds, the
visualisation of distances from the reference data cannot be very
meaningful (as shown in Fig. 12a). In these cases, the
visualisation of the mean distance from each reference plane
(i.e. evaluation statistics (ii) and (iii)) might be more helpful
than the computation of single points indipendently.
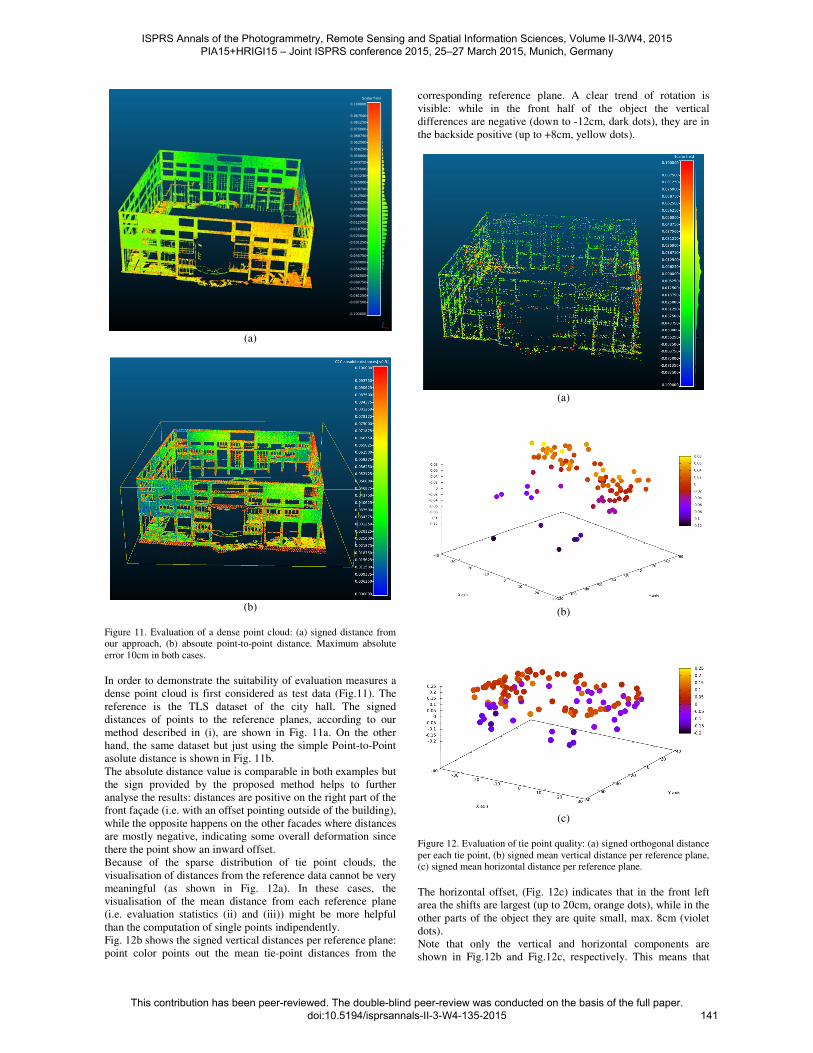
Fig. 12b shows the signed vertical distances per reference plane:
point color points out the mean tie-point distances from the
corresponding reference plane. A clear trend of rotation is
visible: while in the front half of the object the vertical
differences are negative (down to -12cm, dark dots), they are in
the backside positive (up to +8cm, yellow dots).
(a)
(b)
(c)
Figure 12. Evaluation of tie point quality: (a) signed orthogonal distance
per each tie point, (b) signed mean vertical distance per reference plane, (c) signed mean horizontal distance per reference plane.
The horizontal offset, (Fig. 12c) indicates that in the front left
area the shifts are largest (up to 20cm, orange dots), while in the
other parts of the object they are quite small, max. 8cm (violet
dots).
Note that only the vertical and horizontal components are
shown in Fig.12b and Fig.12c, respectively. This means that
ISPRS Annals of the Photogrammetry, Remote Sensing and Spatial Information Sciences, Volume II-3/W4, 2015 PIA15+HRIGI15 – Joint ISPRS conference 2015, 25–27 March 2015, Munich, Germany
This contribution has been peer-reviewed. The double-blind peer-review was conducted on the basis of the full paper. doi:10.5194/isprsannals-II-3-W4-135-2015
141
only the mean horizontal projection is shown for vertical
façades, while only mean vertical distances are considered for
flat horizontal roofs.
The developed plane-based evaluation of tie points is supposed
to enable a better detection of systematic errors in the image
orientation. In combination with the check points residuals this
will be an efficient tool satisfying the benchmark goals.
6. DATA DELIVERY
A dedicated webpage has been implemented on the ISPRS
website. Any participant can download the available data after a
registration procedure; the procedure to upload the results is
described as well. Data currently available (10 Feb. 2015) for
download refer only to the image matching assessment task.
Some GNSS acquisitions in the large areas (yellow rectangles in
Figs 1 and 2) still need to be captured and some data for the
image orientation still need to be selected and pre-processed.
For more information, please refer to
(http://www2.isprs.org/commissions/comm1/icwg15b/benchma
rk_main.html) on the ISPRS’s website and subscribe to the
realised newsletter (http://www2.isprs.org/newsletter.html).
7. CONCLUSIONS
The description of a new benchmark datasets supported by
ISPRS and EuroSDR and the different evaluation scenarios
were presented. The proposed benchmark will deliver
challenging datasets to participants in order to face some R&D
open issues. The derived evaluations and conclusions will be of
interest for both photogrammetric and computer vision
communities. The image matching criteria has already shown to
provide feasible results (Cavegn et al., 2014) in the on-going
benchmark: the new airborne oblique image set (with an higher
image overlap) as well as the UAV/terrestrial image block will
enrich the already available dataset.
The image orientation task still needs some GNSS
measurements to be completed, but it will be hopefully
available before mid-2015. The evaluation criteria will be both
traditional (i.e. image reprojection errors, residuals at CPs) and
unconventional (i.e. tie point-to-plane distance), in order to
provide a complete evaluation of the orientation results without
requiring statistical measures from the bundle adjustment
process. The analysis performed using these criteria have shown
to be useful in all the presented case studies giving an indirect
assessment of the image pose estimation quality. However, we
are of course open for any discussion on the evaluation methods
and assessment criteria.
The presented benchmark, in its current implementation, will be
focused on image orientation and matching issues. Since the
data will be open, other research topics, like investigation into
radiometry of multi-view images (BRDF) or semantic analysis
could be realized in the future.
ACKNOWLEDGEMENTS
Data acquisition and pre-processing was made feasible through
the funds provided by ISPRS (Scientific Initiative) and
EuroSDR. Further we are grateful to Aerowest GmbH for
sponsoring part of the PentaCam flight. We thank Pix4D for
providing us a research license of pix4dmapper.
REFERENCES
Agarwal, S., Furukawa, Y., Snavely, N., Simon, I., Curless, B.,
Seitz, S. and Szelisky, R., 2011. Building Rome in a day. In:
Communication of the ACM, Vol.54(10), pp.105-112.
Alsadik, B.S., Gerke, M., Vosselman, G., Daham, A. and Jasim,
L., 2014. Minimal camera networks for 3D image based
modeling of cultural heritage objects. In: Sensors : journal on
the science and technology of sensors and biosensors 14(4) pp.
5785-5804.
Cavegn, S., Haala, N., Nebiker, S., Rothermel, M. and Tutzauer,
P., 2014. Benchmarking High Density Image Matching for
Oblique Airborne Imagery. In: The International Archieves of
Photogrammetry, Remote Sensing and Spatial Information
Sciences, Zürich, Switzerland, Vol. XL-3, pp. 45-52.
Frahm, J., M., Georgel, P., Gallup, D., Johnson T., Raguram,
R., Wu, C., Jen, Y., H., Dunn, E., Clipp, B., Lazebnik, S. and
Pollefeys, M., 2010. Building Rome on a Cloudless Day. In:
Computer Vision – ECCV 2010, pp. 368-381.
Furukawa, Y., Curless, B., Seitz, S.M. and Szeliski, R., 2010.
Towards internet-scale multi-view stereo. In: Computer Vision
and Pattern Recognition (CVPR), pp. 1434 - 1441.
Geiger, A., Lenz, P., Stiller, C. and Urtasun, R., 2013: Vision
meets Robotics: The KITTI Dataset. International Journal of
Robotics Research, 0(0) 1–7, DOI: 10.1177/0278364913491297
Gruen, A., Remondino, F. and Zhang, L., 2005. The Bamiyan
project: multi-resolution image-based modelling. In: Recording,
Modeling and Visualization of Cultural Heritage, Taylor &
Francis / Balkema, ISBN 0 415 39208 Xpp, pp. 45-54.
Haala, N., 2014. Dense Image Matching Final Report. EuroSDR
Publication Series, Official Publication No. 64, pp. 115-145.
Rottensteiner, F., Sohn, G., Gerke, M., Wegner, J.D., Breitkopf,
U. and Jung, J., 2014: Results of the ISPRS Benchmark on
Urban Object Detection and 3D Building Reconstruction. ISPRS
Journal of Photogrammetry and Remote Sensing, 93, pp. 256–
271.
Rupnik, E., Nex, F., Toschi, I. and Remondino, F., 2015. Aerial
multi-camera systems: Accuracy and block triangulation issues.
ISPRS Journal of Photogrammetry and Remote Sensing, 101,
pp. 233-246.
Shan, Q., Adams, R., Curless, B., Furukawa, Y. and Seitz, S.
M., 2013. The Visual Turing Test for Scene Reconstruction.
Proceedings of: 3DV '13, pp. 25-32.
Vosselman, G., 2012. Automated planimetric quality control in
high accuracy airborne laser scanning surveys. ISPRS Journal
of Photogrammetry and Remote Sensing, 74, pp. 90-100.
Wendel, A., Hoppe, C., Bischof, H. and Leberl, F., 2012.
Automatic fusion of partial reconstructions. In: ISPRS Annals of
Photogrammetry, Remote Sensing and Spatial Information
Sciences, I-3, pp.81-86.
ISPRS Annals of the Photogrammetry, Remote Sensing and Spatial Information Sciences, Volume II-3/W4, 2015 PIA15+HRIGI15 – Joint ISPRS conference 2015, 25–27 March 2015, Munich, Germany
This contribution has been peer-reviewed. The double-blind peer-review was conducted on the basis of the full paper. doi:10.5194/isprsannals-II-3-W4-135-2015
142