isotopic abundance measurements on solid nuclear-type samples by glow discharge mass spectrometry
TRANSCRIPT
Abstract A double-focusing Glow Discharge Mass Spec-trometer (GDMS) installed in a glovebox for nuclear sam-ple screening has been employed for isotopic measurements.Isotopic compositions of zirconium, silicon, lithium, boron,uranium and plutonium which are elements of nuclear con-cern have been determined. Interferences arising from thematrix sample and the discharge gas (Ar) for each of theseelements are discussed. The GDMS results are comparedwith those from Thermal Ionization Mass Spectrometry(TIMS). For boron and lithium at µg/g-ng/g levels, the twomethods gave results in good agreement. In samples con-taining uranium the isotopic composition obtained byGDMS was in agreement with those from TIMS indepen-dently of the enrichment. Attempts for the determinationof plutonium isotopic composition were also made. In thiscase, due to the interferences of uranium at mass 238 andamericium at mass 241, the GDMS raw data are comple-mentary with those values obtained from physical non-de-structive techniques.
Introduction
In nuclear technology and generally in nuclear field researchthe precise and accurate measurement of isotope ratios is of great interest. For their determination the widely ac-cepted technique is thermal ionization mass spectrometry(TIMS). In this method the sample must be dissolved andchemical separation of the analyte of interest is requiredbefore the analysis. The use of a technique directly ap-plicable to solid samples has the advantage of a minimalsample preparation. In our laboratory a high resolutionglow discharge mass spectrometer has been installed in aglove-box [1] for the analysis of nuclear solid samples.This instrument consists of a magnetic sector mass spec-
trometer equipped with a Faraday cup detector system.For isotope ratio measurement it is theoretically capableto obtain a precision of the order of 0.01% RSD making itcompetitive with the more conventional isotope ratio in-struments using thermal or electron-bombardment ionisa-tion methods. Little work has been reported on the use ofa GDMS for isotope ratio measurements. Recently, how-ever, a few papers have appeared [2, 3].
The GDMS installed in our laboratory has been used forthe measurement of the isotopic composition in nuclearsamples. In this paper the experience gathered on severalsamples are described and the results compared with thoseobtained using the TIMS technique which has been usedby us to measure isotope ratios in nuclear materials for tenyears.
Experimental
Sample preparation. Flat samples only were analysed. When pow-der samples were provided, the material was compacted into a disc13 mm diameter and 2 mm thick with a hydraulic press (3630X,Spex, USA). A load of 8 t was applied for 5 min. For nonconduc-tive samples, a secondary cathode of tantalum was used [4–6]. Nochemical treatment was performed, the samples were pre-sputteredbefore the analysis for a duration of 10–15 min.
Mass spectrometer. The GDMS instrument used in this study wasa double-focusing sector instrument (VG 9000, Fisons UK) modi-fied as previously described [1] for the installation in a glovebox toallow the analysis of nuclear samples. The salient features of thisinstrument include a magnetic sector followed by an electric sectorfor high abundance sensitivity, liquid nitrogen cryo-cooled dischargecell (to about –130°C) for suppression of background gases, and acombination of an ion detection system employing a Faraday cupand a Daly ion multiplier detector.
The mass spectrometer was operated at an 8200 V acceleratingpotential and, if not differently specified, with a mass resolution of1000 (10% valley definition) in the isotope ratio mode. The dis-charge gas was high purity argon, which was further purified bypassage through a heated active-metal getter system (at 400°C) be-fore entering the ion source. The discharge voltage was typically 1 kV at a current of 2 mA. The pressure in the ion source chamberwas 0.01 Pa whereas the pressure inside the discharge cell was be-tween 26–130 Pa.
Maria Betti · Gert Rasmussen · Lothar Koch
Isotopic abundance measurements on solid nuclear-type samples by glow discharge mass spectrometry
Fresenius J Anal Chem (1996) 355 :808–812 © Springer-Verlag 1996
Received: 1 October 1995 / Revised: 10 January 1996 / Accepted: 9 February 1996
LECTURE
Maria Betti (Y) · G. Rasmussen · L. KochEuropean Commission, Joint Research Centre, Institute for Transuranium Elements, P.O. Box 2340, D-76125 Karlsruhe, Germany

Results and discussion
Zr isotopic composition in samples containing Pu
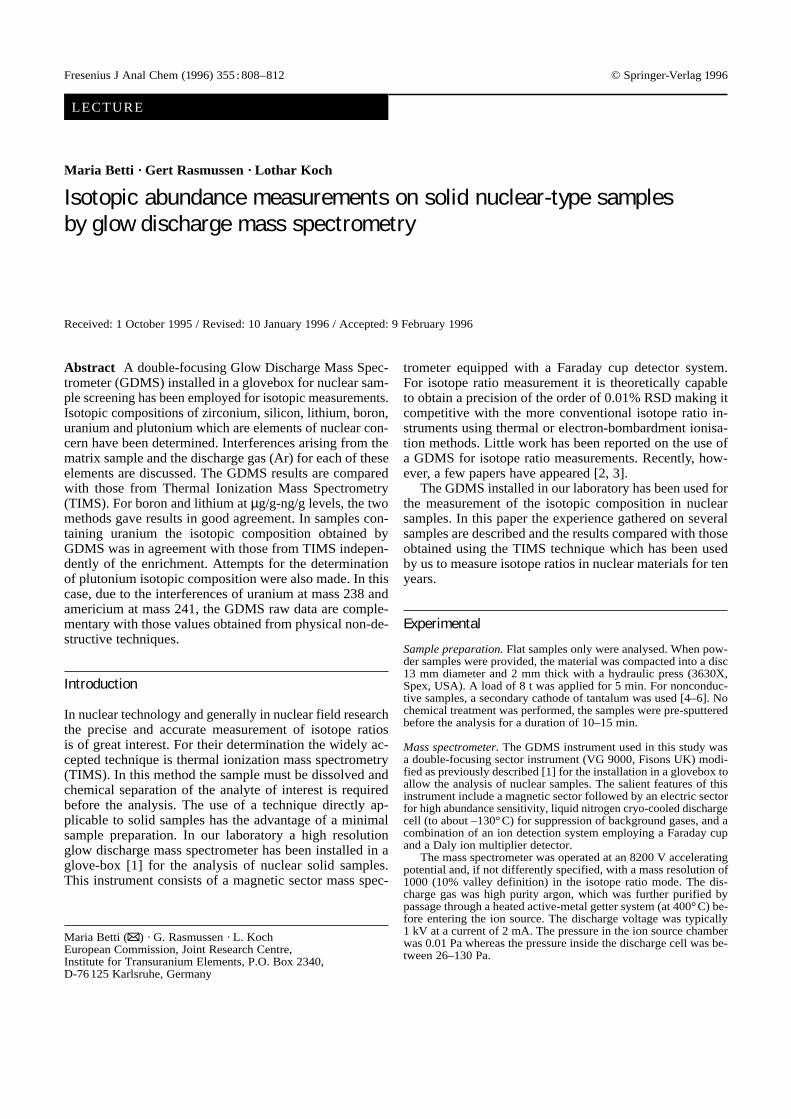
Zirconium alloys are used as cladding for nuclear fuels.After irradiation the activated zirconium is obtained andits isotopic composition is of interest. The long-lived iso-tope of zirconium is 93Zr (half-life = 1.5 × 10⁶ a) and inabsence of niobium it can be determined by non-nuclearmethods. The mass resolution requested between 93Zr and93Nb is of 2 × 10⁶. In samples containing high amounts ofplutonium, the determination of the isotopic abundance ofnon-natural zirconium could be hindered by the presenceof isobaric interferences due to the combination of pluto-nium isotopes with those of argon. The formation in theglow discharge of plutonium/argon polyatomic species wasevaluated. The two isotopes 239Pu and 240Pu were consid-ered for plutonium. In the case of argon only 40Ar with itsnatural abundance of 99.6% was taken into account. Inseveral specimens containing zirconium and plutonium indifferent concentrations the following species were mea-sured: 239Pu+, 240Pu+, 239Pu2+, 240Pu2+, 239Pu40Ar+, 240Pu40Ar+,239Pu40Ar2+, 240Pu40Ar2+, 239Pu40Ar3+, 240Pu40Ar3+. Peaks cor-responding to the bivalent cations of the plutonium iso-topes 239Pu2+ and 240Pu2+ at mass 119.52 and 120.02 aswell as those corresponding to the species 239Pu40Ar+ and240Pu40Ar+ at mass 279.01 and 280.01 were constantly found.Their signals are shown in Fig.1 together with those of239Pu+ and 240Pu+. Their shape is quite distinct even thoughtheir intensities is of the order of 10-16–10-17 A/s.
No evidence for the formation in the glow discharge ofthe plutonium/argon bivalent and trivalent species wasfound. In order to evaluate to which extent divalent pluto-nium isotope cations and plutonium/argon compounds areformed in the glow discharge, the peak area ratios 239Pu+/240Pu+, 239Pu2+/240Pu2+, and 239Pu40Ar+/240Pu40Ar+ were used.Mean values of 6.00, 6.06 and 5.98 for the three ratioswere found. This means that the double charged isotopesor the argon/plutonium molecular compounds are alwaysformed to the same extent, independent of the plutoniumconcentration.
Trivalent plutonium/argon molecular compounds didnot form, a mass resolution even less than 1000 could beused in the determination of the isotopic composition ofzirconium. This allows flat top peaks to be obtained whichin the evaluation of isotopic abundances give better accu-racy. For the non-natural isotope the exact masses to de-termine the necessary mass resolution were calculated onthe basis of mass defect [7].
Isotopic abundance measurements using a resolutionof 1000 were performed for zirconium samples. Twentyindependent runs were performed and the mean valuesand the relative standard deviations calculated. A massrange from 90 to 100 was considered in order to evaluate
809
Fig. 1a–d GD mass spectra obtained for 239Pu+ (a) and 240Pu+ (b)and the respective plutonium/argon mono-charged compounds (c, d)
a b
c d
Table 1 Isotopic abundance of Zr in an unknown sample com-pared with the abundance for natural Zr
Isotope Unknown Natural [8] Bias %
90Zr 51.38 51.45 +0.1491Zr 11.27 11.22 +0.4492Zr 17.10 17.15 –0.3094Zr 17.32 17.38 –0.3496Zr 2.93 2.80 +4.6

the contribution of molybdenum isotopes to those of zir-conium at masses 92, 94 and 96. After subtraction of thiscontribution the isotopic abundance of zirconium was cal-culated. As seen from Table 1 where the experimental re-sults are compared with the values reported in literature[8] the zirconium detected was natural and the biggest er-ror was associated with the isotope at mass 96, which hasthe lowest abundance.
Silicon isotopic composition in aluminium matrices
Aluminium is a material used in nuclear technology. Afterreactor operations the isotopic composition of natural sil-icon contained in aluminium changes.
The determination of silicon can not be accomplishedby the worldwide diffused quadrupole based InductivelyCoupled Plasma Mass Spectrometers (ICP-MS). The res-olution required for the separation of 28Si+ from 12C16O+
and 14N2+ is 1625 and 957, respectively. Moreover, in an
aluminium matrix the tail of Al and the formation of27AlH+ produce also interferences on 28Si+ that can noteasily be resolved. The other two isotopes of silicon havea low abundance: 4.67% for 29Si and 3.10% for 30Si, anda high detection power must be reached to obtain accurateisotopic compositions. The dissolution of those type ofsample is tedious and sometimes, due to the presence ofother metals, incomplete. Double-focusing GDMS can beused successfully for the measurement of silicon isotopicabundance. On 28Si+ the interferences due to formation of27AlH+, 12C16O+ and 14N2
+ can be easily resolved as wellas those interferences due to 28SiH+, 27AlH2
+ and 12C16OH+
on 29Si+ and that due to 14N16O+ on 30Si+. As it appearsfrom Fig.2, the 27AlH+ comes together with 12C16O+ as wellas the 27AlH2
+ with 12C16OH+. 27AlH3+ should appear at
mass 30.005, but no evidences for its formation appeared.28SiH+ and 14N16O+ resulted to be well separated from29Si+ and 30Si+, respectively. Five aluminium samples con-taining traces of silicon were measured using a mass res-olution of 2000, and for each sample ten separate runswere carried out. In Table 2 the mean values obtained forthe three isotopes are reported along with the external pre-cision (expressed as rsd%) and the accuracy (expressed asbias%) calculated on the basis of data reported in litera-ture [8]. As seen both the figures of merit for the methodare good. On the basis of standard samples in-house pre-pared, the relative sensitive factors (RSFs) relative to Alwere also calculated for the three isotopes and were foundto be 1.235 for 28Si, 1.257 for 29Si and 1.248 for 30Si.Other authors [9] had found an RSF value of 2.0 ± 0.3 forSi in a steel matrix when calculated with respect to Fe. Ifthis value is converted to obtain the RSF with respect toAl, a value of 1.0 results, which is in a reasonable agree-ment with those found in this investigation.
Lithium and boron isotopic composition
Lithium and boron are light elements having two naturalisotopes with widely different abundances: 6Li (7.5%), 7Li(92.5%), 10B (19.9%) and 11B (80.1%). Their detection innuclear material is important for the determination of itspurity. Boron is a neutron capture element and lithium isused as doping additive. The most widely used method fortheir isotopic abundance determination is TIMS, after
810
Table 2 Isotopic composition of silicon in an aluminium matrix
Isotope Exp. value RSD % Ref. value [8] Bias %
28Si 92.22 0.05 92.23 –0.0129Si 4.68 0.28 4.67 +0.2130Si 3.096 1.1 3.10 –0.13
Fig.2a–c GD mass spectra showing matrix interference resolu-tion for the three isotopes of silicon: 28Si (a), 29Si (b) and 30Si (c)
c
b
a

sample dissolution. The use of ICP-MS is hindered by itslow detection power for light elements. By GDMS, detec-tion at the ng/g levels is easily achievable [1].
As to boron, at mass 10 the interference caused by theformation of 40Ar4+ occurs. According to the sample ma-trix 80Kr8+, 40Ca4+ and 30Si3+ are also formed [3]. The nec-essary mass resolution to separate 10B from all these inter-ferences is equal to 500. As for lithium interferences on6Li+ and 7Li+ can arise from 12C2+ and 14N2+, respectively.Also in these cases the minimum resolution necessary forseparation is 500. In this investigation double-focusingGDMS was compared with TIMS. Several samples of nu-clear origin containing either lithium or boron were exam-ined for their isotopic composition. The two methods al-ways gave results with a good agreement. This is evidentfrom Table 3 where the ratios of the results obtained bythe two methods are given. The concentration of boronand lithium in the samples were in the range of µg/g-ng/glevels.
Uranium isotopic composition
After the installation of the GDMS in a glove-box the ura-nium samples were measured to test the system and thefirst results published dealt with the isotopic compositionof uranium certified metal [1]. Many other samples con-taining uranium with different isotopic composition havebeen measured. An example is given in Table 4 where ra-tios of the results obtained by GDMS and TIMS for thefour isotopes of uranium, including the non-natural 236U,in two samples of uranium after different enrichment are
reported. Also values regarding the external precision ofthe methods are given and are expressed as RSD%. Inboth the samples 236U and 234U were present at µg/g lev-els. The ratio between the highly enriched sample (indi-cated as sample 1 in Table 4) and the lowly enriched one(indicated as sample 2 in Table 4) had a value of 10. Theresults obtained by GDMS were always in good agree-ment, independent of the sample enrichment, with thoseobtained by TIMS. The advantage of the use of GDMSlies in the avoidance of the time-consuming dissolutionand dilution steps.
Plutonium isotopic composition
A measurement of the isotopic composition of plutoniumhas been attempted on several samples. Errors in the de-termination of its isotopic composition arise from thepresence of uranium and americium. The 238U isotope in-terferes with 238Pu and at mass 241 an interference due tothe 241Am isotope is observed which is to some extent al-ways present in samples containing plutonium. Mathematiccorrections on 238Pu and 241Am can be carried out whenresults are available from other techniques such as MGA(Multi Group Analysis) [10] which consists of a gamma-ray spectrum analysis code for determining plutonium iso-topic abundances. When corrections can be performedGDMS results were in agreement with those obtained byTIMS for which americium and uranium have been previ-ously chemically separated from plutonium. For plutoniumthe uncorrected data from GDMS is complementary to non-destructive techniques, such as MGA, when no sampledissolution can be performed.
Conclusions
GDMS is not only applicable for the determination oftrace elements (ng/g and sub-ng/g levels) in solid sam-ples. The use of double-focusing GDMS, with variableresolution can also be employed for the determination ofthe isotopic composition. In this investigation those iso-topes of concern in nuclear technology have been consid-ered. Many others dealing with environmental regulationscan be also determined.
As to precision and accuracy, even though it has to bepointed out that the homogeneity of the sample plays animportant role in the direct analysis of solid samples,GDMS is very competitive with TIMS. Moreover, GDMScan be considered a non-destructive method as only asmall amount of the samples (10-9 g) is used for the analy-sis. After the analysis the same specimen can be archivedor used for some other tests. Besides, the direct analysison solids avoids dissolution, separation and dilution stepswhich are tedious, time-consuming and sometimes, due tomatrix effects, incomplete. However in the analysis ofplutonium the presence of uranium and above all ofamericium still constitutes a limitation for this technique.In this case GDMS raw data are complementary to physi-
811
Table 3 Comparison between TIMS and GDMS results for thedetermination of isotopic composition of lithium and boron
Isotope GDMS results/TIMS results
Sample 1 Sample 2 Sample 3
6Li 0.999 1.002 0.9987Li 1.002 0.988 1.01710B 1.000 0.999 0.99911B 1.001 1.000 1.003
Table 4 Comparison between TIMS and GDMS results for the de-termination of isotopic composition of two uranium samples withdifferent enrichment
Isotope GDMS results/TIMS results
Sample 1 Sample 2 RSD % RSD %high enrichment low enrichment GDMS TIMS
234Ua 0.9045 0.9125 1.000 0.500235Ub 0.9999 0.9939 1.200 0.020236Ua 0.8997 0.8896 1.100 2.420238U 1.0004 0.9999 0.050 0.002
a µg/g levelsb Ratio (sample 1/sample 2) = 10

812
cal non-destructive analysis, such as MGA gamma spec-trometry. When the corrections are performed the GDMSresults agree with those from TIMS which still remainsthe best in terms of precision and accuracy.
References
1.Betti M, Rasmussen G, Hiernaut T, Koch L, Milton DPM, Hut-ton RC (1994) J At Anal Spectrom 9 :385–389
2.Donohue DL, Milika Petek (1991) Anal Chem 63 :740–7443. Ecker KH, Pritzkow W (1994) Fresenius J Anal Chem 349 :207–
2084.Milton DMP, Hutton RC (1993) Spectrochim Acta 48 :39–52
5. Schelles W, DeGendt S, Muller V, van Grieken R (1995) ApplSpectr 49 :939–944
6. Betti M, Rasmussen G, Koch L (1994) Analysis of solid nu-clear materials by glow discharge mass spectrometry. WinterConference on Plasma Spectrometry, San Diego, CA
7. Browne E, Dairiki JM, Doebler RE (1978) Tables of isotopes.Wiley, New York Chichester Brisbane Toronto
8. De Bievre P, Barnes IL (1985) Int J Mass Spectr Ion Proc 65 :211–230
9. King FL, Harrison WW (1993) Glow discharge spectroscopies.Plenum Press, New York London
10.Gunnink R (1990) MGA: a gamma-ray spectrum analysis codefor determining plutonium isotopic abundances. UCRL-LR-103220, Vol 1. Lawrence Livermore National Laboratory,University of California, CA