isotopes and mass spectrometry - buxton...
TRANSCRIPT

PSI AP Chemistry Activity
Isotopes and Mass Spectrometry
Why? In this activity we will address the questions:
Are all atoms of an element identical and how do we know? How can data from mass spectrometry be used to identify the elements and the masses
of individual atoms of a specific element. How can Data from mass spectrometry also demonstrate direct evidence of different
isotopes from the same element? How can the average atomic mass be estimated from mass spectra. Explain how data from mass spectrometry supports or rejects early models of the
atom.
Prior Knowledge Model 1: Isotopes
1. Does the sample contain identical atoms of copper?
2. Use the picture above to determine the percent of 63Cu in the sample. What is the percent of 65Cu?
3. a) What is the average atomic mass of copper on the periodic table? b) Is it closer to 63 amu or 65 amu?
c) How does the information from the picture above explain the answer to the previous question?
Magnified 1 billion times (x 109)

4. Consider the data given in the table below. Determine the average mass of an element based on data table the isotopic abundance and the mass of each isotope
Isotope % Abundance 20Ne 90.48 21Ne 0.27
22Ne 9.25
5. There are two stable isotopes of calcium: Ca - 40 (39.96) and Ca - 46 (45.95). Using the average
atomic mass of calcium from the periodic table, calculate the % abundance of each isotope of calcium.
Model 2: Mass spectrometry Information: Mass Spectrometry is a powerful analytical tool used to determine the following information. - The elemental composition of a sample - The masses of particles and of molecules - Potential chemical structures of molecules by analyzing the fragments - The identity of unknown compounds by determining mass and matching to known spectra - The isotopic composition of elements in a sample
A mass spectrometer is a device for separating atoms and molecules according to their mass. In a mass spectrometer, a substance is first heated in a vacuum and then ionized. The ions produced are accelerated through a magnetic field that separates ions of different masses. The height of each peak is proportional to the amount of each isotope present (i.e. it’s relative abundance). The m/z ratio for each peak is found from the accelerating voltage for each peak. Many ions have a +1 charge so that the m/z ratio is numerically equal to mass m of the ion. The graph below was produced when an element, lithium, was analyzed in a mass spectrometer. Use the graph to answer the questions below.
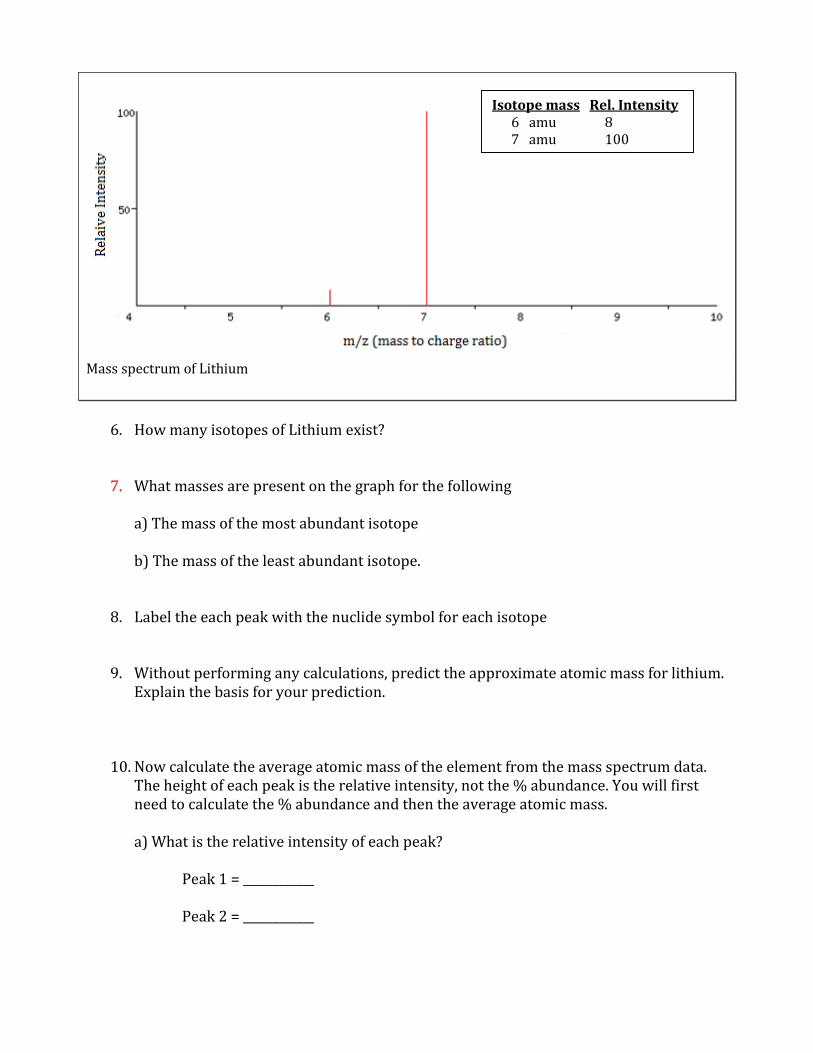
Mass spectrum of Lithium
6. How many isotopes of Lithium exist?
7. What masses are present on the graph for the following a) The mass of the most abundant isotope b) The mass of the least abundant isotope.
8. Label the each peak with the nuclide symbol for each isotope
9. Without performing any calculations, predict the approximate atomic mass for lithium. Explain the basis for your prediction.
10. Now calculate the average atomic mass of the element from the mass spectrum data. The height of each peak is the relative intensity, not the % abundance. You will first need to calculate the % abundance and then the average atomic mass.
a) What is the relative intensity of each peak?
Peak 1 = ____________
Peak 2 = ____________
Isotope mass Rel. Intensity 6 amu 8 7 amu 100

b) What is the total relative intensity of the peaks? Total = __________
c) What is the % of the intensity of each peak? (% = 𝑃𝑎𝑟𝑡
𝑇𝑜𝑡𝑎𝑙 𝑥 100)
Peak 1% = __________ Peak 2% = __________
d) You’ve just determined the % abundance for each isotope of the element. Complete the table and calculate the average atomic mass of the element.
Isotope Mass % Abundance
Average atomic mass = __________amu
11. The modern use of mass spectrometry provides another example of how experimental data can be used to test or reject a scientific model.
a) Does data from mass spectrometry demonstrate evidence which supports or contradicts Dalton’s early model of the atom? Explain.
b) How does data from mass spectrometry demonstrate direct evidence of different isotopes of the same element?
12. What element’s mass spectrum is represented below? Explain your answer.

Model 3: Predicting Isotopic Abundances and Mass Spectrum Based on what you’ve learned, answer the following questions and check your answers using one of the following websites 1. http://www.webelements.com Select the element of interest. Scroll to the bottom right of the
page and click on “Isotopes” under the “Nuclear Properties” section. 2. http://www.sisweb.com/mstools/isotope.htm Enter in the formula of the element to generate its mass spectrum. (Note: formula entry is case sensitive; the first letter of the element must be capitalized will all others lower case.
13. a) What is the average atomic mass of Boron?
b) If there are two predominant isotopes of Boron on earth, 10B and 11B, which do you think is most abundant?
c) Make an estimate of the percentage of each isotope of Boron.
d) Draw a rough sketch for the mass spectrum of Boron. Label each axis and label each peak with the appropriate nuclide symbol
14. There are two naturally occurring isotopes of rubidium, 85Rb and 87Rb. Use the process above to draw a rough sketch for the mass spectrum of rubidium.

Exercises
15. The mass spectrum for elemental bromine is represented below. Label each peak with the appropriate nuclide symbols. Remember, not all elements exist as single atoms in nature.
16. The mass spectrum below represents a mixture of elements. What elements are present? Justify your answer. (Check your answer using the websites listed above.)

17. The mass spectrum of strontium gives four peaks. Use the data below to answer the following questions: a) Sketch the mass spectrum that would be obtained from naturally occurring strontium. b) Label each peak on the mass spectrum with the appropriate nuclide symbols. c) Calculate the average atomic mass of strontium in the sample rounded to two decimal places.
Conclusions: Now that you’ve learned about mass spectrometry, answer the following questions to summarize the big picture.
18. Are all atoms of an element identical and how do we know?
19. How can data from mass spectrometry be used to identify the elements and the masses of individual atoms of a specific element.
20. How can Data from mass spectrometry also demonstrate direct evidence of different isotopes from the same element?
21. How can the average atomic mass be estimated from mass spectra.
m/z 84 86 87 88 Relative intensity 0.68 11.94 8.48 100.00

22. Explain how data from mass spectrometry has advanced our understanding of the
atom.
23. List and briefly explain any other real world applications of mass spectrometry you can think of?

PSI AP Chemistry Activity
Isotopes and Mass Spectrometry
Why? In this activity we will address the questions:
Are all atoms of an element identical and how do we know? How can data from mass spectrometry be used to identify the elements and the masses
of individual atoms of a specific element. How can Data from mass spectrometry also demonstrate direct evidence of different
isotopes from the same element? How can the average atomic mass be estimated from mass spectra. Explain how data from mass spectrometry supports or rejects early models of the
atom.
Prior Knowledge Model 1: Isotopes
24. Does the sample contain identical atoms of copper?
No, the sample contains two different isotopes of copper, copper-63 and copper-65
25. Use the picture above to determine the percent of 63Cu in the sample. What is the percent of 65Cu? 63Cu = 14 atoms %63Cu = 70%
65Cu = 6 atoms %63Cu = 30%
26. a) What is the average atomic mass of copper on the periodic table?
63.55 amu
b) Is it closer to 63 amu or 65 amu? The average atomic mass is closer to 63 amu
Magnified 1 billion times (x109)
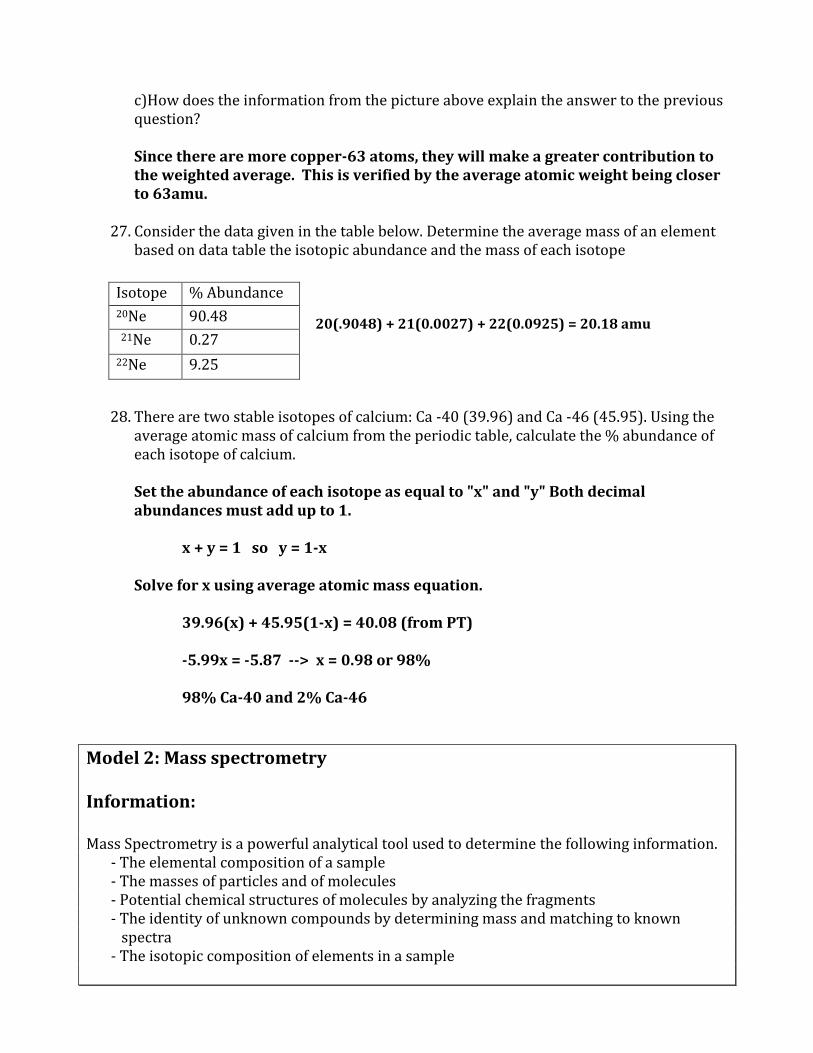
c)How does the information from the picture above explain the answer to the previous question? Since there are more copper-63 atoms, they will make a greater contribution to the weighted average. This is verified by the average atomic weight being closer to 63amu.
27. Consider the data given in the table below. Determine the average mass of an element based on data table the isotopic abundance and the mass of each isotope
20(.9048) + 21(0.0027) + 22(0.0925) = 20.18 amu
28. There are two stable isotopes of calcium: Ca -40 (39.96) and Ca -46 (45.95). Using the
average atomic mass of calcium from the periodic table, calculate the % abundance of each isotope of calcium.
Set the abundance of each isotope as equal to "x" and "y" Both decimal abundances must add up to 1.
x + y = 1 so y = 1-x
Solve for x using average atomic mass equation.
39.96(x) + 45.95(1-x) = 40.08 (from PT)
-5.99x = -5.87 --> x = 0.98 or 98%
98% Ca-40 and 2% Ca-46
Model 2: Mass spectrometry Information: Mass Spectrometry is a powerful analytical tool used to determine the following information. - The elemental composition of a sample - The masses of particles and of molecules - Potential chemical structures of molecules by analyzing the fragments - The identity of unknown compounds by determining mass and matching to known spectra - The isotopic composition of elements in a sample
Isotope % Abundance 20Ne 90.48 21Ne 0.27
22Ne 9.25
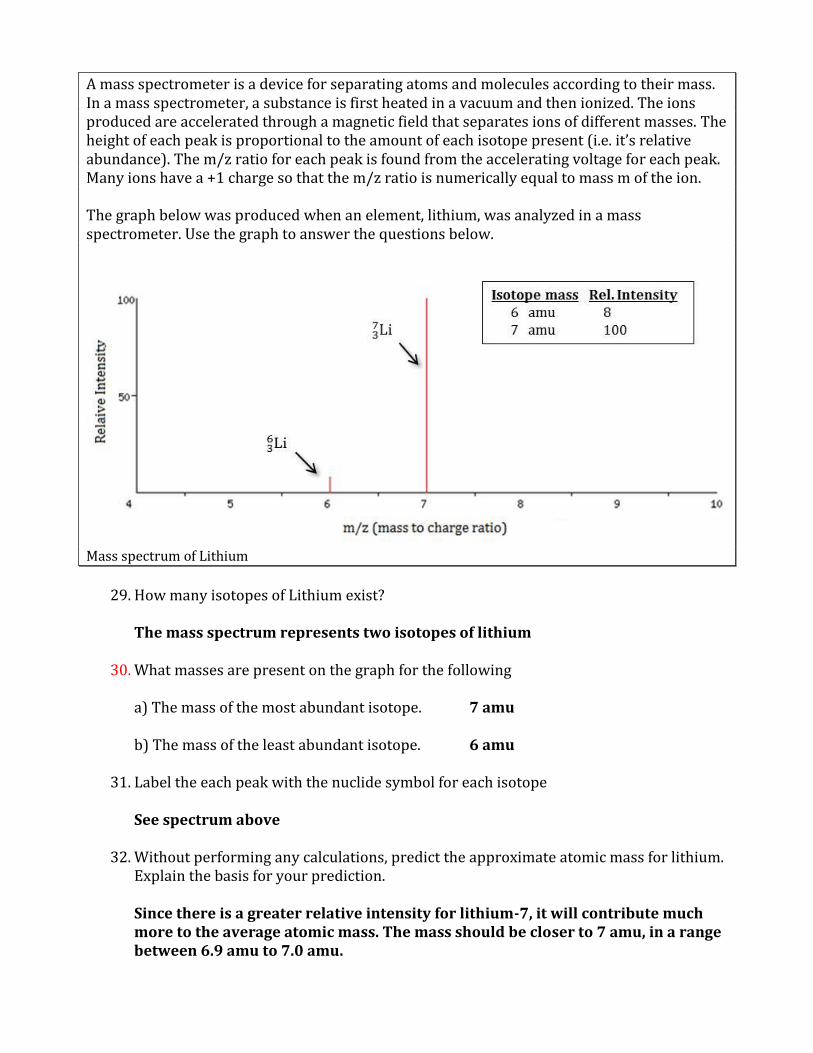
A mass spectrometer is a device for separating atoms and molecules according to their mass. In a mass spectrometer, a substance is first heated in a vacuum and then ionized. The ions produced are accelerated through a magnetic field that separates ions of different masses. The height of each peak is proportional to the amount of each isotope present (i.e. it’s relative abundance). The m/z ratio for each peak is found from the accelerating voltage for each peak. Many ions have a +1 charge so that the m/z ratio is numerically equal to mass m of the ion. The graph below was produced when an element, lithium, was analyzed in a mass spectrometer. Use the graph to answer the questions below.
Mass spectrum of Lithium
29. How many isotopes of Lithium exist?
The mass spectrum represents two isotopes of lithium
30. What masses are present on the graph for the following a) The mass of the most abundant isotope. 7 amu b) The mass of the least abundant isotope. 6 amu
31. Label the each peak with the nuclide symbol for each isotope
See spectrum above
32. Without performing any calculations, predict the approximate atomic mass for lithium. Explain the basis for your prediction.
Since there is a greater relative intensity for lithium-7, it will contribute much more to the average atomic mass. The mass should be closer to 7 amu, in a range between 6.9 amu to 7.0 amu.

33. Now calculate the average atomic mass of the element from the mass spectrum data. The height of each peak is the relative intensity, not the % abundance. You will first need to calculate the % abundance and then the average atomic mass.
a) What is the relative intensity of each peak?
Peak 1 = ____8______
Peak 2 = ___100____
b) What is the total relative intensity of the peaks? Total = ____108___
c) What is the % of the intensity of each peak. (% = 𝑃𝑎𝑟𝑡
𝑇𝑜𝑡𝑎𝑙 𝑥 100)
d. You’ve just determined the % abundance for each isotope of the element. Complete the table and calculate the average atomic mass of the element.
Average atomic mass = 6(.0740) + 7(0.926) = 6.93 amu
34. The modern use of mass spectrometry provides another example of how experimental data can be used to test or reject a scientific model.
a) Does data from mass spectrometry demonstrate evidence which supports or contradicts Dalton’s early model of the atom? Explain.
Data from mass spectrometry clearly demonstrates evidence that contradicts and reject Daltons model, specifically, the postulate that “Atoms of the same element are identical”.
Mass spectrometry provides evidence that exist in different isotopic forms in different relative abundances.
Isotope Mass % Abundance
Lithium-6 6 amu 7.40
Lithium-7 7 amu 92.6
𝐏𝐞𝐚𝐤 𝟏% =𝟖
𝟏𝟎𝟖 𝒙 𝟏𝟎𝟎 = 𝟕. 𝟒𝟎 %
𝐏𝐞𝐚𝐤 𝟐% =𝟏𝟎𝟎
𝟏𝟎𝟖 𝐱 𝟏𝟎𝟎 = 𝟗𝟐. 𝟔 %

b)How does data from mass spectrometry demonstrate direct evidence of different isotopes of the same element?
When a sample of a pure element is analyzed with a mass spectrometer, each isotope will be ionized and detected. The mass spectrum represents each isotope as a peak, plotting its mass to charge (m/z) ratio and its relative intensity.
35. What element’s mass spectrum is represented below? Explain your answer.
The mass spectrum gives two peaks, m/z = 185 and m/z 187, therefore the mass of the element must be somewhere between these two values. Since the relative intensity for m/z 187 is almost two times that of m/z 185, the average atomic mass should be closer to 187 amu. Inspection of the periodic table reveals only Rhenium(Re), atomic mass of 186.21, within this range. It can be concluded that the mass spectrum represents the element Rhenium.
Model 3: Predicting Isotopic Abundances and Mass Spectrum Based on what you’ve learned, answer the following questions and check your answers using one of the following websites 1. http://www.webelements.com Select the element of interest. Scroll to the bottom right of the
page and click on “Isotopes” under the “Nuclear Properties” section. 2. http://www.sisweb.com/mstools/isotope.htm Enter in the formula of the element to generate its mass spectrum. (Note: formula entry is case sensitive; the first letter of the element must be capitalized will all others lower case.)

36. a) What is the average atomic mass of Boron?
10.811 amu b) If there are two predominant isotopes of Boron on earth, 10B and 11B, which do you think is most abundant?
Since the average atomic mass of born is closer to 11 amu, it can be predicted the that boron – 11 is the predominant isotope.
c) Make an estimate of the percentage of each isotope of Boron.
Based on the average atomic mass, the percent abundance could be 80% boron-11 and 20% boron – 10.
d) Draw a rough sketch for the mass spectrum of Boron. Label each axis and label each peak with the appropriate nuclide symbol

37. There are two naturally occurring isotopes of rubidium, 85Rb and 87Rb. Use the process above to draw a rough sketch for the mass spectrum of rubidium.
Since the average atomic mass of Rubidium is 85.47 amu, the isotope Rubium-85 should be in greater abundance. To produce more accurate peak intensities on the mass spectrum, an approximate percent abundance of each isotope can be determined via the process below
Set the abundance of each isotope as equal to "x" and "y" Both decimal abundances must add up to 1.
x + y = 1 so y = 1-x
Solve for x using average atomic mass equation.
85(x) + 87(1-x) = 85.47 (from PT)
-2x = -1.43 --> x = 0.72 or 72%
72% Rb-85 and 28% Rb-87

Exercises
38. The mass spectrum for elemental bromine is represented below. Label each peak with the appropriate nuclide symbols. Remember, not all elements exist as single atoms in nature.
39. The mass spectrum below represents a mixture of elements. What elements are
present? Justify your answer. (Check your answer using the websites listed above.)
The presence of two elements is evident on the mass spectrum from two peaks with a relative intensity of 100. The first peak at m/z = 74.92 exists as a single isotope and can be identified as Arsenic – 75. The second set of peaks appears to be two isotopes of the same element with an estimated average atomic mass slightly less than 108 amu. Examination of the periodic table points to Silver (Ag), with an average atomic mass of 107.87 amu.

40. The mass spectrum of strontium gives four peaks. Use the data below to answer the following questions: a) Sketch the mass spectrum that would be obtained from naturally occurring strontium.
b) Label each peak on the mass spectrum with the appropriate nuclide symbols. See mass spectrum above. c) Calculate the average atomic mass of strontium in the sample rounded to two decimal places.
First, calculate the % abundance from the relative intensity of each isotope peak. Total peak intensity = 0.68 + 11.94 + 8.48 + 100.00 = 121.10 Then, calculate the average atomic mass of strontium. atomic mass = 84(0.0056) + 86(0.0986) + 87(0.0700) + 88(0.8258) = 87.7 amu
m/z 84 86 87 88 Relative intensity 0.68 11.94 8.48 100.00
𝐒𝐫𝟑𝟖𝟖𝟒 % =
𝟎. 𝟔𝟖
𝟏𝟐𝟏. 𝟏𝟎 𝐱 𝟏𝟎𝟎 = 𝟎. 𝟓𝟔 %
𝐒𝐫𝟑𝟖𝟖𝟔 % =
𝟏𝟏. 𝟗𝟒
𝟏𝟐𝟏. 𝟏𝟎 𝐱 𝟏𝟎𝟎 = 𝟗. 𝟖𝟔 %
𝐒𝐫𝟑𝟖𝟖𝟕 % =
𝟖. 𝟒𝟖
𝟏𝟐𝟏. 𝟏𝟎 𝐱 𝟏𝟎𝟎 = 𝟕. 𝟎𝟎 %
𝐒𝐫𝟑𝟖𝟖𝟖 % =
𝟏𝟎𝟎. 𝟎𝟎
𝟏𝟐𝟏. 𝟏𝟎 𝐱 𝟏𝟎𝟎 = 𝟖𝟐. 𝟓𝟖 %

Conclusions: Now that you’ve learned about mass spectrometry, answer the following questions to summarize the big picture.
41. Are all atoms of an element identical and how do we know? No, most elements exist in nature as different isotopes of the same element. We know because mass spectrometry provides direct evidence of these isotopes and the average atomic mass of elements are not whole numbers.
42. How can data from mass spectrometry be used to identify the elements and the masses of individual atoms of a specific element. A mass spectrum provides peaks of each substances m/z ratio and its relative intensity. In a pure sample of an element, the mass of that element is represented as an m/z ratio and can be used to identify the element. Also, identification of an elemtnt can be done by calculating the average atomic mass from the mass spectrum data.
43. How can Data from mass spectrometry also demonstrate direct evidence of different isotopes from the same element? When a sample of a pure element is analyzed with a mass spectrometer, each isotope will be ionized and detected. The mass spectrum represents each isotope as a peak, plotting its mass to charge (m/z) ratio and its relative intensity.
44. How can the average atomic mass be estimated from mass spectra. First, the percent isotopic abundance must be calculated from the relative intensity of each peak (isotope). Then, using the mass of each isotope and the percent abundance, one can calculate the average atomic mass.
45. Explain how data from mass spectrometry has advanced our understanding of the atom. Early models of the atom, postulated that atoms were the smallest component of matter. Dalton’s model, for example, postulated that all atoms of an element are identical. Data from mass spectrometry provides direct evidence of isotopes which rejects these early models. Furthermore, it has advanced our understanding of atomic mass.
46. List and briefly explain any other real world applications of mass spectrometry you can think of?
Students may provide a variety of answers, such as, forensics, environmental applications, quality control, medical applications, research applications, drug testing, and geology.

PSI AP Chemistry Curriculum Alignment Isotopes and Mass Spectrometry Activity Big Idea 1: The chemical elements are fundamental building materials of matter, and all matter can be understood in terms of arrangements of atoms. These atoms retain their identity in chemical reactions. Enduring understanding 1.D: Atoms are so small that they are difficult to study directly; atomic models are constructed to explain experimental data on collections of atoms. The modern use of mass spectrometry provides another example of how experimental data can be used to test or reject a scientific model. Essential knowledge 1.D.2: An early model of the atom stated that all atoms of an element are identical. Mass spectrometry data demonstrate evidence that contradicts this early model.
a. Data from mass spectrometry demonstrate evidence that an early model of the atom (Dalton’s model) is incorrect; these data then require a modification of that model. b. Data from mass spectrometry also demonstrate direct evidence of different isotopes from the same element. c. The average atomic mass can be estimated from mass spectra.
Learning objective 1.14 The student is able to use data from mass spectrometry to identify the elements and the masses of individual atoms of a specific element. [See SP 1.4, 1.5; Essential knowledge 1.D.2] Science Practice 1: The student can use representations and models to communicate scientific phenomena and solve scientific problems.
1.4 The student can use representations and models to analyze situations or solve problems qualitatively and quantitatively.
Science Practice 2: The student can use mathematics appropriately. 2.1 The student can justify the selection of a mathematical routine to solve problems.
2.2 The student can apply mathematical routines to quantities that describe natural phenomena. 2.3 The student can estimate numerically quantities that describe natural phenomena.
Science Practice 4: The student can plan and implement data collection strategies in relation to a particular scientific question. [Note: Data can be collected from many different sources, e.g., investigations, scientific observations, the findings of others, historic reconstruction, and/or archived data.]
4.1 Students should be able to justify why a particular kind of data is most useful for addressing a question, such as the use of mass spectra to support the existence of isotopes, or the trapping of a particular reaction intermediate to support a hypothesized reaction mechanism (SP 4.1)
Science Practice 5: The student can perform data analysis and evaluation of evidence.
5.3 The student can evaluate the evidence provided by data sets in relation to a particular scientific question.