isotope peaks m+2, m+4, .. indicative of presence of br...
TRANSCRIPT

Isotope Peaks
The peaks from the isotopes.
The intensity ratios (relative intensities) in the isotopepatterns arises from the natural abundance of theisotopes, thus are valuable to ascertain the atomiccomposition of ions.
M+1 peaks are primarily due the presence of 13Cin the sample.M+2 peaks useful for N, O calculation (< seven C cpds)M+2, M+4, .. indicative of presence of Br, Cl, S;(79Br : 81Br 1:1, 35Cl : 37Cl 3:1)
1000.8014.52
Isotope peak abundance depends on the molecularconstitution. Example, halogens Cl, Br.
e.g. (Nominal mass, M =100%)
%M+1= 0.012nH+1.08nC+0.369nN+0.038nO+5.08nSi+0.801nS
%(M+2) = 0.005nC(nC-1)+0.205nO+3.35nSi+4.52nS+32.0nCl+97.3nBr)
X=M
Calculating isotope peak abundances (%) to confirmfragment and parent peaks.
Nominal mass, M =100%
%M+1= 0.012nH+1.08nC+0.369nN+0.038nO+5.08nSi+0.801nS
%(M+2) = 0.005nC(nC-1)+0.205nO+3.35nSi+4.52nS+32.0nCl+97.3nBr)
Parent/Molecular Peak M: an ion that has notlost/gained atoms (odd electron fragment, U=integer;reverse not true).
Parent Peak leads to molecular formula.Molecular formula leads to the structural (/partial)features of the possible molecular structure.
Unsaturation can be calculated from the molecularformula of the parent ion.
# # 2# / 2 / 2 1#C & #Si#H & #halogens#N, #P, #As..
U R DB TB c h nchn

where imax is the total number of different elements inthe compound, Ni the number of atoms of element i,and Vi is the valence of atom i.
2maxi
i ii
1U =1+ N (V - 2)
If U is not a whole number – then it’s not amolecular ion. It’s an even electron ion.
Any reasonable molecular ion formula should leadto a whole number U; OE ion.
Rule of Thirteen:
Used to generate the possible formula for a givennominal molecular mass.
1. Generate a base formula consisting of C and H,not necessarily the actual formula ;
M rn13 13 CnHn+r
2. Calculate the index of deficiency, U, for thebase formula.
n r 2U2
3. If needed - find the formula with nO atoms of O forthe same M;
New formula = Base formula + nO O – nOC – 4nOHwhich changes U to U+nO ;
4. If needed - find the formula with nN atoms of N forthe same M,
New formula = Base formula + nN N – nN C – 2nN Hand recalculate U; Fractional U’s – unlikely formula.__________________________________________U < 0 is an impossible combination of atoms andindicates likely presence of O and N.
http://www.chemcalc.org/
Useful Links
http://www.chem.uni-potsdam.de/tools/index.html
http://www.colby.edu/chemistry/NMR/NMR.htmlhttp://www.colby.edu/chemistry/PChem/Fragment.html
% 1# 100%
M peakC
M peak
(M+1)/M ratio is particularly useful to estimate the#C in the species.
Nitrogen Rule:Many peaks can be ruled out as impossible simply onthe grounds of reasonable structure requirements.
Molecule of even nominal mass must contain zero oreven number of N atoms. An odd numbered nominalmass requires an odd number of N.
m/z Relative abundance (normalized)64 100.065 0.9±0.266 5.0±0.5
http://www.colby.edu/chemistry/PChem/Fragment.html
Example 1 only peaks in the MS

%M+1 = 0.7 – 1.1 one C and no Si%M+2 = 4.5 – 5.5 no Cl, Br
64 -12 = 52; mass of 52 cannot come solely from H
Probably one S (from M+2), if so no C present; M+1 √.Tentatively; one S present.64 – 32 = 32; two OSO2
Nominal mass, M =100%
%M+1= 0.012nH+1.08nC+0.369nN+0.038nO+5.08nSi+0.801nS
%(M+2) = 0.005nC(nC-1)+0.205nO+3.35nSi+4.52nS+32.0nCl+97.3nBr)
m/z Relative abundance Normalized58 12.0 100.059 0.5±0.2 4.2±1.760 0.0±0.2 0.0±0.2
43 100.044 3.3±0.345 0.0±0.2
.
.http://www.colby.edu/chemistry/PChem/Fragment.html
Example 2 Organic compound
cluster
cluster
molar mass: 58
Formula M+1 M+2 MM e/o dbrH2N4 1.51 0.00 58.0281 o 2CH2N2O 1.91 0.21 58.0168 o 2C2H2O2 2.30 0.41 58.0055 o 2C2H6N2 3.03 0.03 58.0532 o 1C3H6O 3.43 0.24 58.0419 o 1C4H10 4.55 0.08 58.0783 o 0
M+1 = 59; 2.5-5.9% makes #C = 3, 4 or 5
M = 58 possibilitiesC O no odd # of N present (even M)3 03 1 (may be)4 05 0 - not possible
X+1 = 44 ; 3-3.6% makes #C = 3,leaves 43-36 = 7 mass units in the fragment
C3H7; U = 0.5 EE ion
58Formula M+1 M+2 MM e/o dbr=UN3O 1.15 0.20 58.0042 e 2.5H2N4 1.51 0.00 58.0281 o 2CNO2 1.54 0.40 57.9929 e 2.5CH2N2O 1.91 0.21 58.0168 o 2CH4N3 2.27 0.01 58.0406 e 1.5C2H2O2 2.30 0.41 58.0055 o 2C2H4NO 2.67 0.22 58.0293 e 1.5C2H6N2 3.03 0.03 58.0532 o 1C3H6O 3.43 0.24 58.0419 o 1C3H8N 3.79 0.05 58.0657 e 0.5C4H10 4.55 0.08 58.0783 o 0
CH3CH3
CH3
CH3
CH3
C3H
743.0548 Da
CH3
15.0235 Da
C3H
743.0548 Da
CH3
15.0235 Da
Base peak
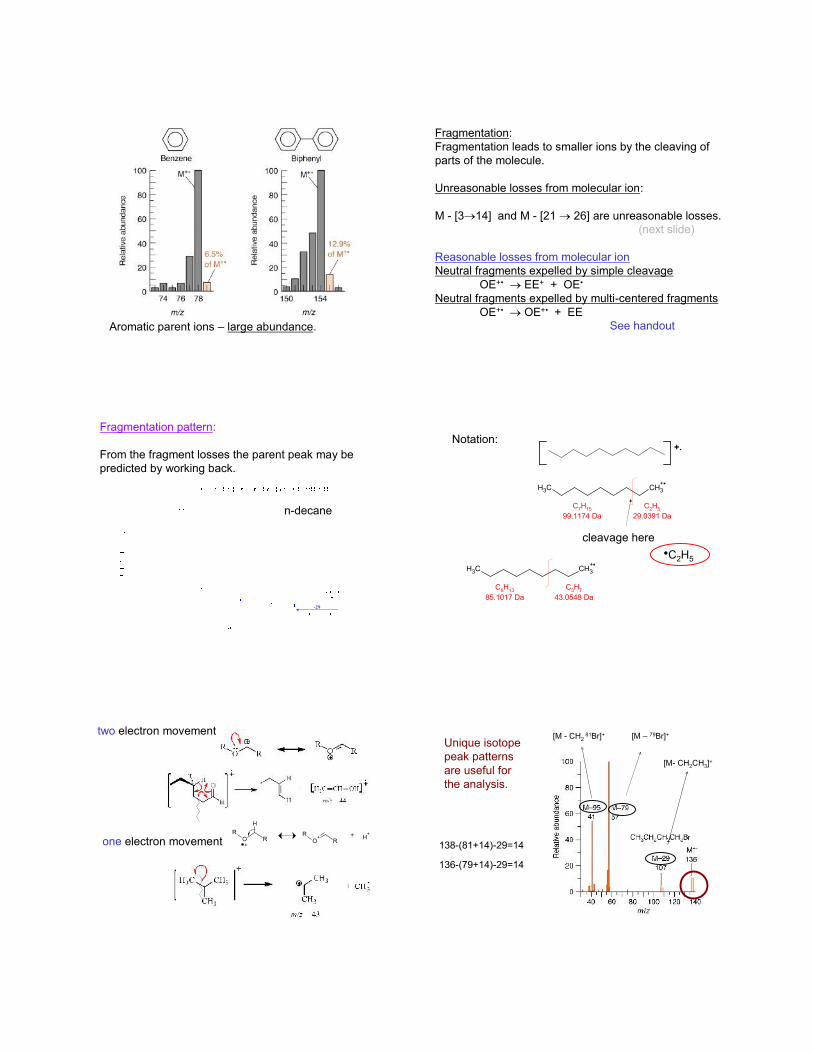
Aromatic parent ions – large abundance.
Fragmentation:Fragmentation leads to smaller ions by the cleaving ofparts of the molecule.
Unreasonable losses from molecular ion:
M - [314] and M - [21 26] are unreasonable losses.(next slide)
Reasonable losses from molecular ionNeutral fragments expelled by simple cleavage
OE+• EE+ + OE•
Neutral fragments expelled by multi-centered fragmentsOE+• OE+• + EE
See handout
Fragmentation pattern:
From the fragment losses the parent peak may bepredicted by working back.
-29
n-decane
Notation:
cleavage here
+.
●C2H5CH3 CH3
+
C6H1385.1017 Da
C3H743.0548 Da
CH3 CH3+
C7H1599.1174 Da
C2H529.0391 Da
two electron movement
one electron movementR
O R
H
x
RO
+R
+ H+
Unique isotopepeak patternsare useful forthe analysis.
[M - CH281Br]+
[M- CH2CH3]+
138-(81+14)-29=14
[M – 79Br]+
136-(79+14)-29=14

Unique isotope peak patterns are useful forthe analysis.
m/z=100
?
Structural isomers differentiation100-29=M-29
Fragmentation:
Nominal mass of parent ion containing C, H, O, S, Si,P and halogens is even.
R' R+.(homolytic) cleavage
odd e m/z ion
even e m/z ion
- neutral species, e.g. CO, water, ..even m/z, no N
M+1M
Fig. E3
use table
M+1 0.4% no C
M = odd, 17 one NFig. E3
Nominal mass1714 – 1N
3 3HConsistent with 1N
NH3
N H
H
H+
M+1
M
PE1

M+1 1.1% 1 C
M = evenPE1 Nominal mass
1612 – 1C
4 4H
CH4
0.9
21.1
100.0
0.06
0.2
M+1 no C
PE2
PE2
1 O present from M+2 peak
2 H present consistent with M+1 peak
M+1, M+2 peaks confirm H2O.
Nominal mass, M =100%
%M+1= 0.012nH+1.08nC+0.369nN+0.038nO+5.08nSi+0.801nS
%(M+2) = 0.005nC(nC-1)+0.205nO+3.35nSi+4.52nS+32.0nCl+97.3nBr)
Data: Contains 3 elements, one is F.
M+1 1 C
PE3
Normalized M+1;1.1 100 1.15
95.4
PE3 Nominal mass3412 – 1 C2219 - 1 F
3 3 H
CH3F
H F
H
H
15
Further 34-15=19
Fragment intensities depend on the stability of theion and the probability of formation.

CH3
CH371
574329 note: reasonable
losses
CH3
CH371
5743
29
CH3CH3
CH3
43
57
Electron repelling methyl groupstabilizes the carbocation. CH3 CH3
CH3
CH3
57
Four ways to form carbocation
Stabilization of carbocations:
1. Alkenes frequently undergo fragmentations that yield allylic cations
2. Carbon-carbon bonds next to an atom with an unshared electron pair usuallybreak readily because the resulting cation is resonance stabilized.
Z =N, 0, or S; R may also be H.
3. Carbon-carbon bonds next to the carbonyl group of an aldehyde or ketonebreak readily because resonance-stabilized ions called acylium ionsare produced.

3. Carbon-carbon bonds next to the carbonyl group of an aldehyde or ketonebreak readily because resonance-stabilized ions called acylium ionsare produced.
4. Alkyl-substituted benzenes undergo loss of a hydrogen atom or methyl groupto yield the relatively stable tropylium ion. This fragmentation gives aprominent peak (sometimes the base peak) at m/e 91.
5. Substituted benzenes also lose their substituent and yield a phenylcation at m/e 77.
Y =halogen,-NO2.-Keto group,-R. etc.
INTENSITYm/e (AS PERCENT OF BASE PEAK)14 8.0
15 38.6
18 16.3
28 39.7
29 23.4
42 46.6
43 10.7
44 100.0 (base)
73 86.1 M+. 100
74 3.2 3.72
75 0.2 0.23
Mass spectrum forProblem E. 7.FIG. E.8
Recalculatingintensities tonormalize
7336 - 3C from M+13714- 1N odd M2316- 1O from M+2
7 7H
C3H7NOC3H7NO 1.0
Use this resource
PE7
molar mass: 73Formula M+1 M+2 MM e/o dbrH3N5 1.9 0.00 73.0390 o 2CH3N3O 2.29 0.21 73.0277 o 2C2H3NO2 2.69 0.42 73.0164 o 2C2H7N3 3.42 0.04 73.0641 o 1C3H7NO 3.81 0.25 73.0528 o 1C4H11N 4.94 0.10 73.0892 o 0
INTENSITYm/e (AS PERCENT OF BASE PEAK)14 8.0
15 38.6
18 16.3
28 39.7
29 23.4
42 46.6 73-31
43 10.7
44 100.0 (base)
73 86.1 M+. 100
74 3.2 3.72
75 0.2 0.23
Mass spectrum forProblem E. 7.FIG. E.8
C3H7NO
Confirming MFC3H7NO 3.81 0.25 73.0528 o 1
3142CH3
N
OHCH3
N
O
CH3 O
NH2
44

No halogensProbably 1 O; (M+2)4 C ; M+1
Calculation; C4H8O 4.56 0.28 72.0575 o 1
Nominal mass7248 – 4 C2416 - 1 O
8 8 H
Use this resource
CH3
O
CH3 CH3
O
CH3
OH
CH3 CH2
OH
72-44=28 loss of 28 from M to form base peak
No straight forward cleavage possible; probablya rearrangement occurs before cleavage.
CH3
OCH3 CH3
O
CH3
OHCH3 CH2
OH
C3H642.047 Da
CH2O30.0106 Da
C3H743.0548 Da CHO
29.0027 Da
C2H529.0391 Da C2H3O
43.0184 Da
C2H529.0391 Da C2H3O
43.0184 Da
Cleavage of Two bonds:1. Alcohols frequently show a prominent peak at M - 18.This corresponds to the loss of a molecule of water.
2. Cycloalkenes can undergo a retro-Diels-Alder reaction that producesan alkene and an alkadienyl radical cation.
3. Carbonyl compounds with a hydrogen on it’s --carbonundergo a fragmentation called the McLafferty rearrangement.
Y may be R, H, OR, OH, etc.
In addition to these reactions, are present peaks that result fromthe elimination of other small stable neutral molecules, e.g.N2, NH3, CO,HCN, H2S, alcohols, and alkenes.
The compound is butanal. m/z = 44 arises from theMcLafferty rearrangement.
m/z=29 arises from acylium ion.
OCH3

MS of which compound?O
O
Isopropyl butyl ether Propyl butyl ether
M+=116present
O
73
101
O
8773
O+
73
O+
101
O+
87
O+
+.
+.
Chromatography – MassSpectroscopy
GC-MS, LC-MS are hyphenated analytical techniques.Two techniques are combined to form a single methodfor analyzing mixtures of chemicals. Chromatographyseparates the components and MS detects andcharacterizes each of the components. Combinationof the techniques allows both qualitative andquantitative evaluation of analytical samples.
The MS spectrometer can be highly selective foranalyte of interest.
http://www.shsu.edu/~chm_tgc/sounds/flashfiles/GC-MS.swf
http://www.shsu.edu/~chm_tgc/sounds/flashfiles/SIM.swf
IonSource
MassAnalyzer
IonDetector
Inlet DataSystem
VacuumPumps
ChromatographOutput
DataOutput
All fragment ions (total)ion current /ora single ion detected.
ElectrosprayAPI
QM

Each analyte’s MS produced
Total (reconstructed) ion current (TIC) vs time
http://www.gmu.edu/departments/SRIF/tutorial/gcd/gc-ms2.htm
Total current of all ions of all masses from a GC peak is detected abovea selected value of time (solvent peak) for a separated analyte.
Total ion current (TIC) Chromatography
GC,LC/MS takes data in three dimensionssimultaneously, recording the number of ionscreated along with their masses over time.
This information is generally represented byexamining the total ion chromatogram (TIC)and ‘slicing’ along the third dimension (m/z) of agiven peak to look at the mass spectrum at achosen time.
3D data sett
t MS – analyte 1
MS – analyte 2
MS – analyte 3
MS requires high vacuum ~10-3 – 10-6 torr. Theeluate from a chromatographic system has muchmore carrier (gas/eluent) than the analyte. If eluatefrom the chromatograph is allowed to enter directlyinto the MS it would overwhelm the vacuum system(especially in LC – liquid vaporizes into a largevolume).
To alleviate the strain on the system, differentstrategies are employed at the sampleintroduction/ionization stage.

Electrospray interface:
Coaxial flow
For positive ion MS
Strong electric field+ nebulization;ions vaporize
Low collisional dissociation; minimal fragmentation.Positive ions accelerateand collide with N2 molecules;few fragments form. Changingskimmer voltage to larger –vewould produce more fragmentation.
Atmospheric Pressure Chemical Ionization API-CI
Coaxial flow
Electrons formed at corona, injects into aerosol.
This technique produces single charged ions.Little fragmentation, less structural information.
.2 2
. .2 2 4 2
. .4 2 2 2
. .2 2 3
3
3 2
2 3 2
2
2
2
2
( )
( 1)( )
n
n
N e N eN N N NN H O N H OH O H O
MHH
OH H OH O nH O H O H O
M nH O HO O Selected ion monitoring possible with the quadrupolemass analyzer with appropriate tuning.
SIM leads to selective detection of analytes.
Selected Ion Monitoring
SIM describes the operation of the mass spectrometerwhere the intensities of one or several specific ionbeams (Multiple ion monitoring) are recorded ratherthan the entire mass spectrum.
The SIM more sensitive than the full scan experimentbecause the mass spectrometer can dwell for a longertime over a smaller mass range; reduces background.

3D data sett
t MS – analyte 1
MS – analyte 2
MS – analyte 3
Selected ion chromatogramQM filter tuned to select the ion Selected ion chromatogram
QM filter tuned to select the ion
Sam Houston University Applet
Selected Reaction Monitoring
SRM delivers a unique fragment ion that can bemonitored and quantified in the midst of a verycomplicated matrix. Plots are simple, usually a singlepeak. Therefore the SRM plot is ideal for sensitive andspecific quantitation.
The SRM experiment is accomplished by specifying theparent mass of the compound for MS/MS fragmentationand then specifically monitoring for a single fragmention. Same as the SIM of a fragment ion. The specificexperiment in known as a "transition" and can bewritten (parent mass fragment mass) For example534375.
Selectivity and S/N ratio increased markedly withQqQ triple quad arrangement.
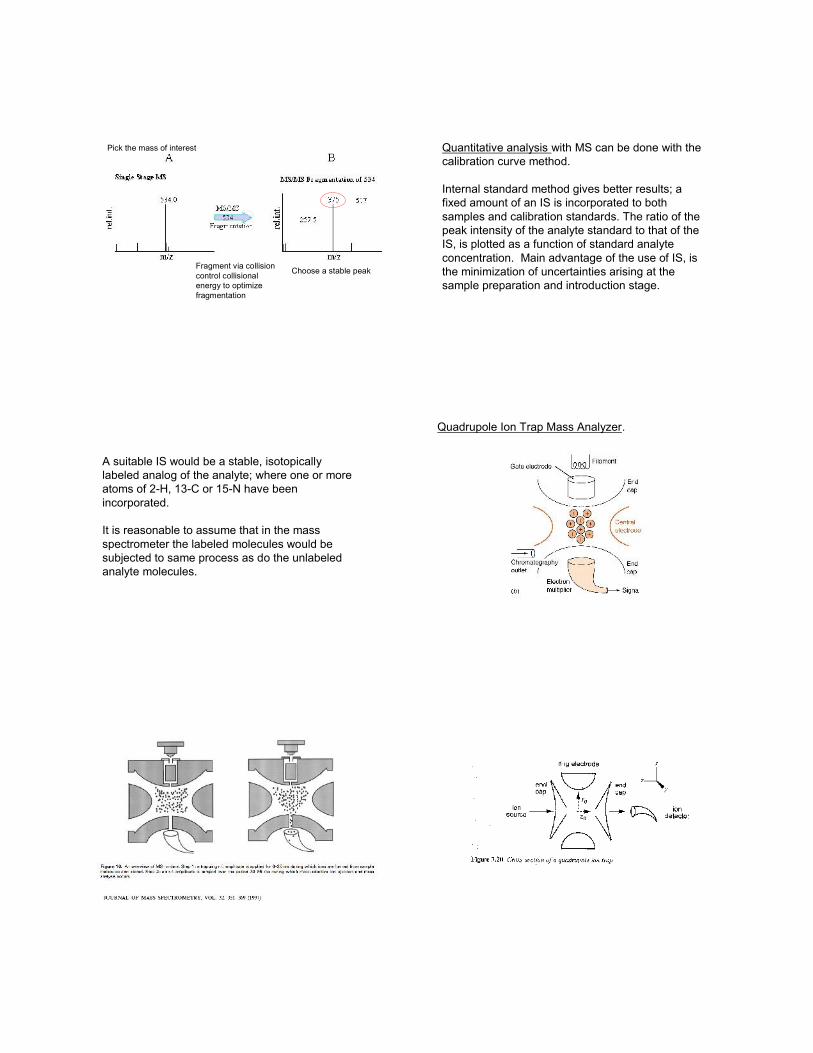
Pick the mass of interest
Fragment via collisioncontrol collisionalenergy to optimizefragmentation
Choose a stable peak
Quantitative analysis with MS can be done with thecalibration curve method.
Internal standard method gives better results; afixed amount of an IS is incorporated to bothsamples and calibration standards. The ratio of thepeak intensity of the analyte standard to that of theIS, is plotted as a function of standard analyteconcentration. Main advantage of the use of IS, isthe minimization of uncertainties arising at thesample preparation and introduction stage.
A suitable IS would be a stable, isotopicallylabeled analog of the analyte; where one or moreatoms of 2-H, 13-C or 15-N have beenincorporated.
It is reasonable to assume that in the massspectrometer the labeled molecules would besubjected to same process as do the unlabeledanalyte molecules.
Quadrupole Ion Trap Mass Analyzer.

Lvt
2
2
2m Vtze L
12
mt LeV z
2
2mvKE zeV
L
MALDI MALDI
Lasers are used to deliver a focused high density ofmonochromatic radiation to a sample target, which isvaporized and ionized.
The yield of ions is often increased by using asecondary ion source or a matrix.
Mass Spectroscopy
Bioanalytical Perspective
Reflex Time-of-Flight Mass Spectrometry
Not all ions gets desorbed at the same time and inexactly the same location, leads to slightly differentvelocities for identical ions. Degrades the resolutiondue to peak broadening (lower resolution).
Reflex can detect post source decay.
opposing EDE Linear Mode DE Reflex Mode

MALDI is incompatible with continuous operation.It is a pulsed technique. Not for tandem methods asGC-MS, LC-MS and CE-MS.
Peaks such as [M+2H]+2, [M+H]+, [M+Na]+ is typical.
Used for analysis of proteins, peptides, fragmentsof peptides and their mixtures (molecular weights withpractically no fragmentation).
Fast, mixtures handled, more powerful thanelectrophoresis, chromatography.
MALDI tolerates moderate concentrations of buffersand salts.
Identification of proteins via the “peptide fingerprint”.
Proteinenzyme
products from cleavage at specificplaces of protein.
Spectrum = “MS fingerprint”
MALDI-TOF/MS
ESI – MS
Electrospray Ionization
Electrospray Ionization is a versatile ionization method.capable of analyzing compounds directly from aqueousor aqueous/organic solutions, mol wt ~200,000Da;peptides, proteins, carbohydrates, DNA fragmentsand lipids.
It is compatible with continuous operation.
http://www.chemsoc.org/ExemplarChem/entries/2004/warwick_robinson/ESI.htm
Analyte molecules in solution reach the end of astainless steel needle which is held at a high voltage inrelation to the counter electrode.
A fine spray of micro droplets is formed when theanalyte leaves the needle. This spray is highlycharged due to the high potential of the needle.
On traveling to the counter electrode, the highlycharged droplets lose the solvent molecules, the microdroplets shrinks due to solvent evaporation.
The region between the needle and the counterelectrode is held at atmospheric pressure, whilst theother side of the counter electrode is in vacuum.

Evaporation of analyte from the micro droplet surfacetakes place continuously. The diameter of the dropletdecreases whilst the total amount of charge remainsthe same.
Coulombic forces are exerted and induce instability onthe droplet surface, and as a result the droplet breaksup into smaller droplets.
This process leads to very small droplets containingonly an analyte ion with a lot of solvent around it.
When the diameter becomes less than 10nm theremaining solvent leaves the analyte ion, and freeions is formed.
The resulting increase in charge density of the droplet,forces the charged analyte ion out of the solution,leaving highly charged analyte molecules.
The charge on the species due to the protons bonded.
[M+nH+] type ions produces for a given analyte; n~+50.
Electrospray ionisation produces multiply charged ions,(up to +30 to +50 charges). Therefore high molecularweights can be measured using mass analyzers with alimited weight range.
The number of charges an ion can depends stronglyupon its 3D dimensional structure.
When a protein assumes a tight conformation, onlysurface sites are available for protonation making theobserved charge states are relatively low.
The electrospray process produces a distribution ofcharge states, used in the interpretation of the spectra.
http://www.chm.bris.ac.uk/ms/theory/esi-ionisation.html
z increases,m/z decreasesfor the samemolecule
ESI-MS Spectrum of a biomolecule; Monoisotopic Masspeaks considered here
Isotope peaks
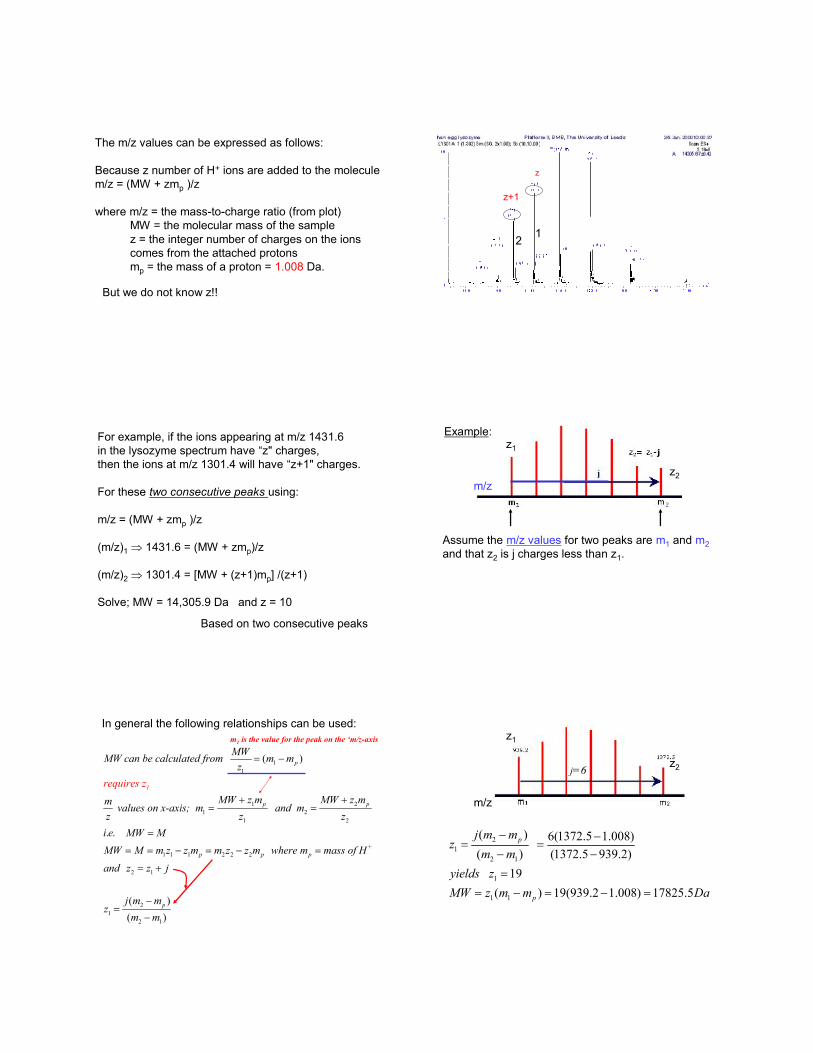
The m/z values can be expressed as follows:
Because z number of H+ ions are added to the moleculem/z = (MW + zmp )/z
where m/z = the mass-to-charge ratio (from plot)MW = the molecular mass of the samplez = the integer number of charges on the ionscomes from the attached protonsmp = the mass of a proton = 1.008 Da.
But we do not know z!!
z
z+1
12
For example, if the ions appearing at m/z 1431.6in the lysozyme spectrum have “z" charges,then the ions at m/z 1301.4 will have “z+1" charges.
For these two consecutive peaks using:
m/z = (MW + zmp )/z
(m/z)1 1431.6 = (MW + zmp)/z
(m/z)2 1301.4 = [MW + (z+1)mp] /(z+1)
Solve; MW = 14,305.9 Da and z = 10
Based on two consecutive peaks
Assume the m/z values for two peaks are m1 and m2and that z2 is j charges less than z1.
Example:z1
z2m/z
In general the following relationships can be used:
11
1 21 2
1 2
1 1 1 2 2 2
2 1
21
2 1
( )
. .
( )( )
p
p p
+p p p
1
p
MWMW can be calculated from m mz
MW z m MW z mm values on x-axis; m and mz z z
i e MW MMW M m z z m m z z m where m mass of Hand z z j
j m mz
m
requires
m
z
m1 is the value for the peak on the ‘m/z-axis
21
2 1
1
1 1
( ) 6(1372.5 1.008)( ) (1372.5 939.2)
19( ) 19(939.2 1.008) 17825.5
p
p
j m mz
m myields zMW z m m Da
m/z
z1
z2j=6

Based on two consecutive peaks
z our notation
The result corresponds to the average molecularweight of the protein.
Identifying one charge state effectively identifies themall, as they increase or decrease by one by going leftor right respectively.
Charges can only be integers.