isothermal modeling study of concentration …eprints.utm.my/id/eprint/713/1/jtjun42f.pdf · aliran...
TRANSCRIPT

ISOTHERMAL MODELING STUDY OF CONCENTRATION FLUCTUATIONS 75
Jurnal Teknologi, 42(F) Jun. 2005: 75–88© Universiti Teknologi Malaysia
1 Department of Gas Engineering, Faculty of Chemical and Natural Resources Engineering, UniversitiTeknologi Malaysia, 81310 Skudai, Johor, Malaysia.
2 Department of Fuel and Energy, University of Leeds, Leeds, LS2 9JT, United Kingdom.*Corresponding author: E-mail. [email protected]
ISOTHERMAL MODELING STUDY OF CONCENTRATIONFLUCTUATIONS IN MULTI-JET TURBULENT MIXING
AZEMAN MUSTAFA1* & G. E. ANDREW2
Abstract. Water analogy flow visualisation and conductivity techniques with air bubbles and saltsolution as tracers are relatively simple and cost-effective techniques for the qualitative and quantitativestudies of turbulent fuel and air mixing and yet give very useful information about aerodynamicpatterns and mixing characteristics of the system concerned. These techniques have been used to studythe fuel placement effects on the flow aerodynamics and mixing characteristics of a series of multi-jetgrid cone stabilised non-swirl flow. The experimental results showed that the degree of fuel and airmixing was largely governed by the internally-generated flow aerodynamics and the turbulent energyavailable. The methods of direct fuel injection had a major influence on the mixing uniformity onlyin the high turbulence jet interaction zone near the cone exit plane
Keywords: Fuel placement, turbulent mixing, non-swirl, flow aerodinamics, mixing uniformity
Abstrak. Teknik gambaran aliran analogi air dan keberaliran menggunakan gelembung udaradan larutan garam sebagai pengesan merupakan kaedah yang ringkas dan efektif (kos) untuk mengkajisecara kualitatif dan kuantitatif campuran gelora udara dan bahanapi. Teknik ini dapat memberiinformasi yang sangat berguna mengenai corak aerodinamik dan ciri-ciri campuran bagi sesuatusistem. Teknik ini telah digunakan untuk mengkaji pengaruh suntikan bahanapi ke atas aerodinamikaliran dan ciri-ciri campuran sistem tanpa pusar kon grid jet berbilang. Hasil ujikaji menunjukkantahap pencampuran bahanapi dan udara sangat dipengaruhi oleh corak pembentukan dalamanaerodinamik aliran dan penghasilan tenaga gelora. Teknik suntikan terus bahanapi memberi pengaruhyang besar ke atas keseragaman campuran di dalam zon interaksi jet bergelora tinggi berhampirandengan satah keluar kon.
Kata kunci: Suntikan bahanapi, campuran gelora, tanpa pusar, aerodinamik aliran, keseragamancampuran
1.0 INTRODUCTION
Turbulence plays an important role in virtually all engineering problems involvingfluid flow. Practically, the most important feature of turbulence is the strong mixingcaused by the turbulent fluctuations. In combustion, turbulent mixing process isessential to the satisfactory combustion performance. Combustion in turbulent flowsare mixing controlled, and chemical reactions can occur only when the reactants
Untitled-8 02/17/2007, 01:3875

AZEMAN MUSTAFA & G. E. ANDREW76
become molecularly mixed. The nature of the mixing process of fuel and air is verymuch dependent on the turbulent energy available, which is represented by the pressureenergy dissipated in the flow at the burner entry ports [1]. The pressure energy is firstconverted to velocity stream, which decays in shear layers to turbulence. The rate ofdecay of the turbulence determines the degree of mixing in the combustor. Thefluctuating turbulent motions contribute significantly to the transport of momentum,heat and mass and hence have a determining influence on the distribution of velocity,temperature and species concentrations over the flow field . The level and nature ofconcentration fluctuations due to turbulent mixing are particularly important, especiallyin environmentally sensitive combustion applications such as gas turbine situations,where the concentrations may be fluctuating in and out the flammability limits orbetween low and high pollutant producing regions.
The ideal method towards full understanding of the combustion characteristics ofany particular combustor or burner geometry is to directly measure parameters relatedto the combustion process such as pressure, velocity, temperature and concentrationspecies etc. Direct measurement of these parameters could provide detailed informationof the internal structure of the combustion process but nevertheless it requires detailedexperimental set-up which might be costly and quite time consuming. A number ofworkers [2-4] have adopted the isothermal investigation of turbulent flows as a firststep means of full understanding the mixing present inside the combustor. Themeasurements from an isothermal flow system will not always be satisfactory forexplaining the equivalent combusting flow system as the distribution of transportproperties, density and viscosity is affected by the flow reacting [5]. Neverthelessextending the information obtained on isothermal studies for use in the developmentof combustion studies is important.
In the present work, the mixing characterististics of the non-swirling turbulent flowswas experimentally investigated by means of different fuel injection modes simulatedusing a weak salt solution. The experiment was performed employing two wellestablished isothermal modelling techniques, i.e. flow visualisation and measurementsof scalar (concentration) mixing of three-dimensional turbulent mixing shear layersusing water conductivity analogy with a weak salt solution as a tracer.
2.0 ISOTHERMAL STUDY OF TURBULENT MIXINGCHARACTERISTICS
Fuel and air mixing in burners has been found to be similar for both isothermal flowand flows in combustion [6]. The aerodynamics of complex turbulent combustionsituations such as gas turbine combustion chambers have been found to be essentiallythe same under combustion conditions as they are in isothermal models [7]. Thus, ina fully turbulent flow where the flow aerodynamics are strongly dependent on theReynolds number, it is possible to investigate combustor aerodynamics simply by
Untitled-8 02/17/2007, 01:3876

ISOTHERMAL MODELING STUDY OF CONCENTRATION FLUCTUATIONS 77
examining the isothermal flow aerodynamics. The present isothermal study of turbulentmixing characteristics in the simulated combustion chambers were experimentallydivided into two sections.
2.1 Qualitative Technique for Studying Aerodynamic FlowPatterns
An overall view of flow structure produced in a physical process can be observed withflow visualisation method in a range of applications, so as to provide useful informationon the whole flow field [8,9]. This qualitative technique, known as flow visualisationtechnique, is based on the eye observation and the photography of the flow pattern inthe model. The application of flow visualisation techniques using fluid flow analogyhas been widely regarded as a cheap (compared with testing full size equipment),quick and reliable tool for the assessment of the aerodynamic design requirements.The flow visualisation technique provides a direct means of continuously observingdetailed flow patterns by the use of transparent models with the aids of a high intensitylight source. In this way, an extremely useful means of analysing the flow patterns in acomplex fluid dynamic system is provided and the fulfilment of the aerodynamicdesign requirements can be assessed almost at a glance.
2.2 Quantitative Techniques for Studying Turbulent ScalarMixing
Most study on scalar mixing in turbulent flows [10-13] has been accomplished mainlyusing temperature. Most turbulent temperature measurements have been for combustionsituations where the temperature fluctuations are largely controlled by chemical reactionrather than pure mixing. Furthermore, it is impossible to distinguish turbulenttemperature fluctuations arising from turbulent mixing and those from pure chemicalreaction. Alternatively, the study of scalar mixing in turbulent flows can be quantitativelyaccomplished by probing the flow's local concentration of either a passive scalar or ofa chemical product which is formed as a result of mixing and reaction between twodifferent fluids. Concentration is a scalar and its measurement and interpretation aresimpler than those of velocity and turbulence. Quantitative turbulent mixing and meanconcentration are measured using water conductivity analogy with a weak salt solutionas the tracer.
3.0 EXPERIMENTAL SET-UP
The non-swirl stabiliser employed in the present work, as shown in Figure 1, is a four-hole grid cone design which was originally designed by Al-Shaikhly [14] for hiscombustion tests. An isothermal mixing experimental set-up is schematically shownin Figure 2.
Untitled-8 02/17/2007, 01:3877

AZEMAN MUSTAFA & G. E. ANDREW78
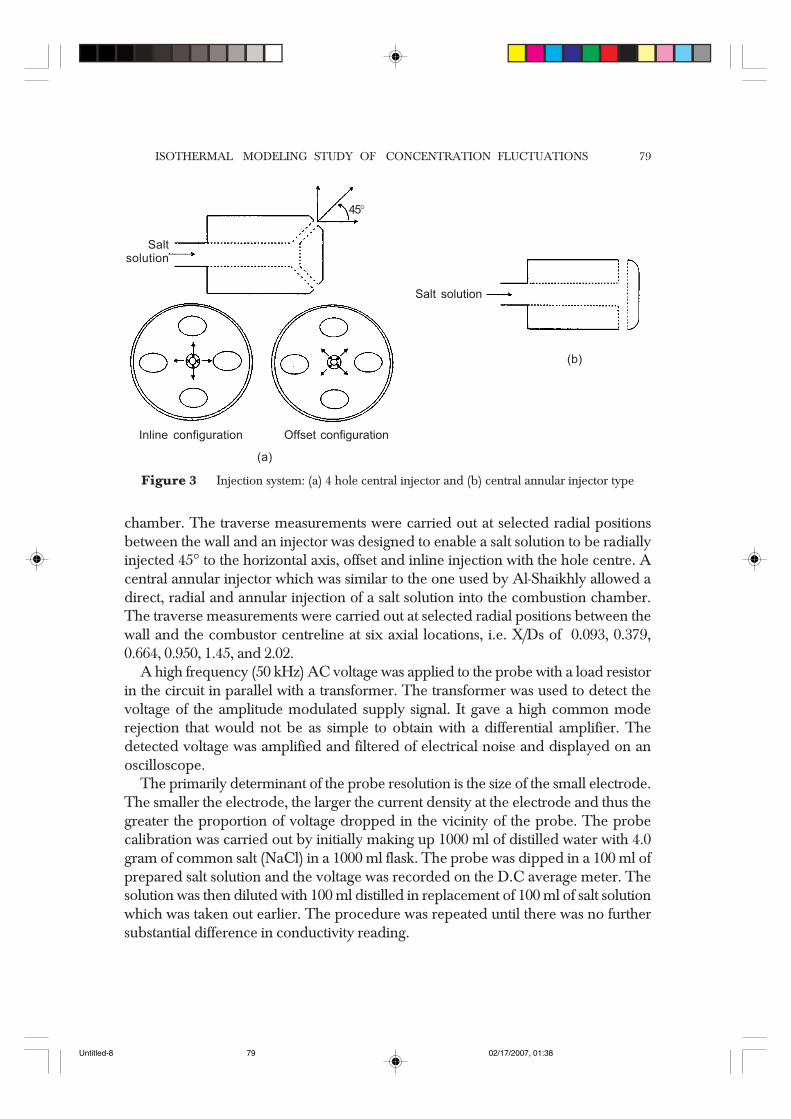
The present work investigated the influence of different modes of direct salt solutioninjection simulating a fuel on the turbulent mixing concentration characteristics of thenon-swirl jet shear layer system. Two types of central injector, as shown in Figure 3,were tested. A simple 4 hole central injector was designed to enable a salt solution tobe radially injected 45° to the horizontal axis, offset and inline injection with the holecentre. A central annular injector which was similar to the one used by Al-Shaikhlyallowed a direct, radial and annular injection of a salt solution into the combustion
Figure 1 An isometric view of grid cone combustor
Figure 2 A schematic layout of the test rig
To conductivitymeasuringdevice
Todrain
Water
Straigthener
Injector
Salt tracer
Traverse hole
Probe
Combustion chamberGrid conestabiliser
To drain
Untitled-8 02/17/2007, 01:3878
ISOTHERMAL MODELING STUDY OF CONCENTRATION FLUCTUATIONS 79
chamber. The traverse measurements were carried out at selected radial positionsbetween the wall and an injector was designed to enable a salt solution to be radiallyinjected 45° to the horizontal axis, offset and inline injection with the hole centre. Acentral annular injector which was similar to the one used by Al-Shaikhly allowed adirect, radial and annular injection of a salt solution into the combustion chamber.The traverse measurements were carried out at selected radial positions between thewall and the combustor centreline at six axial locations, i.e. X/Ds of 0.093, 0.379,0.664, 0.950, 1.45, and 2.02.
A high frequency (50 kHz) AC voltage was applied to the probe with a load resistorin the circuit in parallel with a transformer. The transformer was used to detect thevoltage of the amplitude modulated supply signal. It gave a high common moderejection that would not be as simple to obtain with a differential amplifier. Thedetected voltage was amplified and filtered of electrical noise and displayed on anoscilloscope.
The primarily determinant of the probe resolution is the size of the small electrode.The smaller the electrode, the larger the current density at the electrode and thus thegreater the proportion of voltage dropped in the vicinity of the probe. The probecalibration was carried out by initially making up 1000 ml of distilled water with 4.0gram of common salt (NaCl) in a 1000 ml flask. The probe was dipped in a 100 ml ofprepared salt solution and the voltage was recorded on the D.C average meter. Thesolution was then diluted with 100 ml distilled in replacement of 100 ml of salt solutionwhich was taken out earlier. The procedure was repeated until there was no furthersubstantial difference in conductivity reading.
Figure 3 Injection system: (a) 4 hole central injector and (b) central annular injector type
Saltsolution
Salt solution
Inline configuration Offset configuration
(a)
(b)
45°
Untitled-8 02/17/2007, 01:3879

AZEMAN MUSTAFA & G. E. ANDREW80
4.0 FLOW PATTERNS VISUALISATION
The aerodynamic flow patterns were observed by using small air bubbles as tracers,accomplished by controlling the water pump valve, and a two-dimensional light sheetillumination. Figure 4 shows a photographic reproduction of the flow patterns for afour-hole grid cone stabiliser. The observed aerodynamics flow patterns showed thewater jets had deflected on passing through the conical stabiliser and impinged oneach other on the centre line. As a result, two opposing flows were created, one directedbackwards into the cone forming inner recirculation region while the other directedaxially downstream forming outer recirculation region near the wall. This is consistentwith the outcome of the two-dimensional water modelling flow visualisation [14]. TheWRZ was extended to about 200 mm downstream of the cone exit compared with180 mm obtained from the experimental measurements. It should be noted that thewall recirculation length is only an approximate value as it is difficult to measureaccurately from the developed film negative, but it still gives a reasonable agreementwith the static pressure profile obtained from the experimental measurements.
Figure 4 Side view of jet interaction
5.0 MEAN CONCENTRATION AND FLUCTUATION MIXINGRESULTS
In the present work, the dilution mechanism of salt solution by water is considered tobe the same as the mixing process. The mixing results were expressed as a deviationfrom the mean concentration. A term known as the mixed-mean concentration ratiowas introduced to express variation in conductivity in terms of mixing parameter. Themixed-mean concentration ratio is simply a ratio of the concentration of salt solution atany point to the mean concentration of fully mixed solution in the model. In the presentwork, the water and salt solution were considered to be fully mixed at an X/D of 2.02,where variation in conductivity was found to be very slight. In the well mixed region,
WRZ
WRZ
IRZHigh Axial Velocity Region
Untitled-8 02/17/2007, 01:3880

ISOTHERMAL MODELING STUDY OF CONCENTRATION FLUCTUATIONS 81
the mixed-mean concentration ratio was one, elsewhere values greater than one werefuel rich and less than one were fuel lean. The water and salt solution flow rates werefixed at 80 l/min and 2.5 l/min, respectively, thus giving an air/fuel ratio of 32/1.
Figures 5-8 show radial variations in the mixed-mean concentration ratio and theturbulent fluctuations for three fuel injection modes. These figures clearly show thatthe methods of fuel injection had a major effect on the mixing in the jet interactionregion near the stabiliser exit, as indicated by large concentration and turbulent mixinggradients in the jet shear layer region. Comparison of the mixing results shows that theinline fuel injection produced the radial mixing profiles of the least deviation from themean and also of the least difference between the inline and offset measurements.
The inline mixing profiles at X/D=0.093 in Figure 5 shows a rich/lean/rich systemfor the central annular fuel injection and the inline fuel injection and a lean/rich systemfor the offset fuel injection. In the central region (r/R≤0.25), the inline fuel injectionproduced the richest mixing on the combustor centreline but the fuel was rapidlymixed as it radially moved into the shear layer mixing region. The richer centralregion of the inline fuel injection as compared with that of the central annular injectionwas expected as all fuel was directly injected into the shear layer. The reason for theleanest central region of the offset fuel injection was evident; the fuel was not injectedinto the jet shear layer. In the outer region, all three fuel injection methods producedthe mixing profiles which were radially richer towards the wall. This was expected forthe central annular and inline injection modes. However, for the offset injection thiswas not expected and the rich mixing near the wall was probably was due to the fuelinjected between the shear layers impinged on the wall and subsequently swept intothe region inline with the jet centreline. Further downstream of stabiliser exit, themixing profiles of the three fuel injection modes show a similar trend of a lean centralregion and a slightly rich near wall region. At X/D=0.379 and X/D=0.664, the offsetfuel injection still produced a distinct lean/rich profile compared with the annular andinline injection modes. In the outer region, the mixing was completed by X/D=0.950but the lean central region was slowly mixed with the axial outer recirculation zoneand became complete by X/D=1.45. The mixing intensity profiles in Figure 6 showsa similar trend of high concentration fluctuations in the interacting shear layers andfurther away from the jet interaction zone the fluctuations were at minimum values.
The offset mixing profiles for three fuel injection modes are shown in Figure 7. Incomparison with the inline profiles in Figure 5, the offset traverses show the most non-uniform radial mixing profile and the largest concentration ratio difference betweenthe three fuel injection profiles. At an X/D of 0.093, the mixing was above the mean forall investigated fuel injection modes except on the centreline, where the mixing wasslightly in the lean region for the offset injection mode. With the annular injectionmode, the central region was around 20-25% rich and radially increased to reach thepeak richness of 60% in the wall region. With the inline injection mode, the mixingwas unexpectedly 10-20% rich even though the fuel was not directly injected in theoffset line. With the offset injection mode, the radial mixing was 90% of the mean on
Untitled-8 02/17/2007, 01:3881

AZEMAN MUSTAFA & G. E. ANDREW82
0.0 0.2 0.4 0.6 0.8 1.00.3
0.5
0.7
0.9
1.1
1.3
1.5
1.7X/D = 0.093
0.0 0.2 0.4 0.6 0.8 1.00.3
0.5
0.7
0.9
1.1
1.3
1.5
1.7X/D = 0.379
0.0 0.2 0.4 0.6 0.8 1.00.3
0.5
0.7
0.9
1.1
1.3
1.5
1.7 X/D = 0.664
0.0 0.2 0.4 0.6 0.8 1.00.3
0.5
0.7
0.9
1.1
1.3
1.5
1.7 X/D = 0.950
0.0 0.2 0.4 0.6 0.8 1.00.3
0.5
0.7
0.9
1.1
1.3
1.5
1.7X/D = 1.450
0.0 0.2 0.4 0.6 0.8 1.00.3
0.5
0.7
0.9
1.1
1.3
1.5
1.7X/D = 2.02
Figure 5 Effect of injection modes on mixed-mean concentration ratio mixing profiles (data takenat points inline with the hole centre)
Mix
ed
-mean
co
ncen
trati
on
rati
oM
ixed
-mean
co
ncen
trati
on
rati
oM
ixed
-mean
co
ncen
trati
on
rati
o
Mix
ed
-mean
co
ncen
trati
on
rati
o
r/R r/R
r/Rr/R
r/R r/R
Mix
ed
-mean
co
ncen
trati
on
rati
oM
ixed
-mean
co
ncen
trati
on
rati
o
X/D = 0.093 X/D = 0.379
X/D = 0.950X/D = 0.664
X/D = 1.450 X/D = 2.02
Central annular
Inline
Offset
Untitled-8 02/17/2007, 01:3882

ISOTHERMAL MODELING STUDY OF CONCENTRATION FLUCTUATIONS 83
0.0 0.2 0.4 0.6 0.8 1.00
10
20
30
40
50
60
70X/D = 0.093
0.0 0.2 0.4 0.6 0.8 1.00
10
20
30
40
50
60
70X/D = 0.379
0.0 0.2 0.4 0.6 0.8 1.00
10
20
30
40
50
60
70X/D = 0.664
0.0 0.2 0.4 0.6 0.8 1.00
10
20
30
40
50
60
70X/D = 0.950
0.0 0.2 0.4 0.6 0.8 1.00
10
20
30
40
50
60
70X/D = 1.450
0.0 0.2 0.4 0.6 0.8 1.00
10
20
30
40
50
60
70X/D = 2.020
Figure 6 Effect of injection modes on turbulent fluctuation profiles (data taken at points inline withthe hole centre)
% F
luctu
ati
on
% F
luctu
ati
on
% F
luctu
ati
on
% F
luctu
ati
on
% F
luctu
ati
on
% F
luctu
ati
on
r/Rr/R
r/R r/R
r/Rr/R
X/D = 0.093 X/D = 0.379
X/D = 0.664 X/D = 0.950
X/D = 1.450 X/D = 2.020
Central annular
Inline
Offset
Untitled-8 02/17/2007, 01:3883

AZEMAN MUSTAFA & G. E. ANDREW84
0.0 0.2 0.4 0.6 0.8 1.00.6
0.8
1.0
1.2
1.4
1.6
1.8
2.0
2.2
2.4X/D = 0.093
0.0 0.2 0.4 0.6 0.8 1.00.6
0.8
1.0
1.2
1.4
1.6
1.8
2.0
2.2
2.4X/D = 0.379
0.0 0.2 0.4 0.6 0.8 1.00.6
0.8
1.0
1.2
1.4
1.6
1.8
2.0
2.2
2.4 X/D = 0.664
r/R0.0 0.2 0.4 0.6 0.8 1.0
0.6
0.8
1.0
1.2
1.4
1.6
1.8
2.0
2.2
2.4 X/D = 0.950
r/R
0.0 0.2 0.4 0.6 0.8 1.00.6
0.8
1.0
1.2
1.4
1.6
1.8
2.0
2.2
2.4X/D = 1.450
0.0 0.2 0.4 0.6 0.8 1.00.6
0.8
1.0
1.2
1.4
1.6
1.8
2.0
2.2
2.4X/D = 2.02
Figure 7 Effect of injection modes on mixed-mean concentration ratio mixing profiles (data takenat points offset the hole centre)
Mix
ed
-mean
co
ncen
trati
on
rati
o
r/Rr/R
r/R r/R
r/Rr/R
Mix
ed
-mean
co
ncen
trati
on
rati
oM
ixed
-mean
co
ncen
trati
on
rati
o
Mix
ed
-mean
co
ncen
trati
on
rati
oM
ixed
-mean
co
ncen
trati
on
rati
o
Mix
ed
-mean
co
ncen
trati
on
rati
o
X/D = 0.093 X/D = 0.379
X/D = 0.664 X/D = 0.950
X/D = 1.450 X/D = 2.020
Central annular
Inline
Offset
Untitled-8 02/17/2007, 01:3884

ISOTHERMAL MODELING STUDY OF CONCENTRATION FLUCTUATIONS 85
0.0 0.2 0.4 0.6 0.8 1.00
5
10
15
20
25
30X/D = 0.093
0.0 0.2 0.4 0.6 0.8 1.00
5
10
15
20
25
30X/D = 0.379
0.0 0.2 0.4 0.6 0.8 1.00
5
10
15
20
25
30 X/D = 0.664
0.0 0.2 0.4 0.6 0.8 1.00
5
10
15
20
25
30 X/D = 0.950
0.0 0.2 0.4 0.6 0.8 1.00
5
10
15
20
25
30X/D = 1.450
0.0 0.2 0.4 0.6 0.8 1.00
5
10
15
20
25
30X/D = 2.020
Figure 8 Effect of injection modes on turbulent fluctuation profiles (data taken at points offset thehole centre)
r/R r/R
r/Rr/R
r/Rr/R
% F
luctu
ati
on
% F
luctu
ati
on
% F
luctu
ati
on
% F
luctu
ati
on
% F
luctu
ati
on
% F
luctu
ati
on
X/D = 0.093 X/D = 0.379
X/D = 0.664 X/D = 0.950
X/D = 1.450 X/D = 2.020
Central annular
Inline
Offset
Untitled-8 02/17/2007, 01:3885

AZEMAN MUSTAFA & G. E. ANDREW86
the centreline and became radially richer, reaching the peak richness of 2.25 times themean near the wall. Thus, the offset traverses of the offset fuel injection exhibited astrong lean/rich mixing profile.
At an X/D of 0.379, the mixing results of all injection modes showed a similar trendof lean central region and of steady increase in the local fuel concentrations, reachingthe maximum values near the wall. With the annular injection, a lean/rich profile wasstill noticeable; 80% mixed on the centreline and radially increased to reach the peakrichness of 20% near the wall. The offset injection produced a stronger lean/rich profilethan the annular injection; the mixing ranged from 80% of the mean in the centralregion to 30% rich near the wall. The inline injection was first to achieve completemixing at X/D=0.664, followed by the annular injection at X/D=0.95 and the offsetinjection at X/D=1.45. The offset turbulent fluctuation profiles in Figure 8 again showthe peak fluctuations were at the jet interaction zone just downstream of the stabiliserexit where most mixing took place. Comparison of the offset and inline turbulentintensity profiles in Figures 6 and 8 shows that the peak fluctuations of the inline planewere between 40-70% with the inline injection mode showing the highest peak valuecompared with the peak offset fluctuations of 25-28%. This is also in agreement withthe mixing results in Figures 5 and 7 which show more uniform inline mixing profiles.
6.0 CONCLUSIONS
(1) Modes of fuel injection had a major effect on the mixing in the immediate jetinteraction zone downstream of the stabiliser exit. Further away from this mixedregion, the effect was less significant.
(2) The inline fuel injection was shown to give rapid mixing as the fuel was injectedinto the high turbulence region of the jet shear layers. This consequently producedradial mixing profiles of the least deviation from the mean and hence the mostuniform mixing.
(3) The offset fuel injection was shown to produce a strong aerodynamic lean/richprofile particularly in the jet interaction region downstream of the stabiliser exit.Hence, the mixing was the worst among the three fuel injection methodsinvestigated. The mixing characteristics of the annular central fuel injection werea compromise between the inline and the offset fuel injection modes.
(4) High concentration fluctuations were found in the jet interaction zone where theturbulent mixing was at its maximum intensity. This corresponded to a regionof rapid fuel and air mixing. In the mixed region further away from the jetinteraction zone, the concentration fluctuations became increasingly insignificant.
ACKNOWLEDGEMENTS
The authors would like to thank Universiti Teknologi Malaysia for the financialsupport and University of Leeds for providing the facilities to carry out this researchwork.
Untitled-8 02/17/2007, 01:3886

ISOTHERMAL MODELING STUDY OF CONCENTRATION FLUCTUATIONS 87
REFERENCES[1] Andrews, G. E., M. M. Abdul Aziz, U. S. Abdul Hussain, N. A. Al-Dabbagh, N. A. Ahmad, A. F. Al-
Shaikly, H. S. Al-Kabie, M. Kowkabi, and A. R. Shahbadi. 1989. High Intensity Burners with Low NOxEmissions. British Flame Days 1988. Furnace Combustion Research and its Applications. The Institute ofEnergy.
[2] Palma, J. M. 1989. Mixing in Non-reacting Gas Turbine Combustor Flows. Ph.D. Thesis. University ofLondon.
[3] McGuirk, J. J., and J. M. L. M. Palma. 1995. Experimental Investigation of the Flow Inside a Water Modelof a Gas Turbine Combustor: Part 2 - Higher Order Moments and Flow Visualisation. Transaction of theAMSE - Journal of Fluid Engineering. 117.
[4] McGuirk, J. J., and J. M. L. M. Palma. 1995. Experimental Investigation of the Flow Inside a Water Modelof a Gas Turbine Combustor: Part 1 - Mean and Turbulent Flowfield. Transaction of the AMSE - Journal ofFluid Engineering. 117.
[5] Syred, N., and M. Beer. 1974. Combustion in Swirling Flows: A Review. Combustion and Flame. 23: 143-201.
[6] Syred, N., and M. Beer. 1971. Flame Stabilisation in Recirculation Zones of Jets with Swirl. The ThirteenthSymposium (Int.) on Combustion. The Combustion Institute. Pittsburgh. 617-624.
[7] Clarke, A. E., A. J. Gerrard, and L. A. Holliday. 1962. Some Experience in Gas Turbine CombustionChamber Practice Using Water Flow Visualisation Techniques. The Nineth Int. Symposium on Combustion.The Combustion Institute. Pittsburgh: 875-891.
[8] Merzkirch, W. 1974. Flow Visualisation. New York: Academic Press.[9] Vest, C. M. 1979. Holographic Interferometry. New York: John Wiley.[10] Ahmed, S. A., R. S. Boray, and A. S. Najed. 1989. An Experimental Investigation of Isothermal Swirling
Flow in a Model of a Dump Combustor. ISABE Paper. 89-7072: 689-702.[11] Sturgess, G. J., S. P. Heneghan, M. D. Vangsness, D. R. Ballal, and A. L. Lesmerises. 1991. Isothermal Flow
Fields in a Research Combustor. ASME Paper. 91-GT-37.[12] Yanagi, T., and Y. Mimura. 1981. Velocity Temperature Correlations in Premixed Flames. The Eighteenth
Int. Symposium on Combustion. The Combustion Institute. Pittsburgh. 1031-1039.[13] Abdalla, A. Y., D. Bradley, S. B. Chin, and C. Lan. 1982. Temperature Fluctuations in a Jet Stirred Reactor.
The Eighteenth Int. Symposium on Combustion. The Combustion Institute. Pittsburgh. 459-502.[14] Al-Shaikhly, A. F. A. 1989. Jet Shear Layer, Lean Primary Zones for Low Emissions Gas Turbine Combustion.
Ph.D. Thesis. Dept. of Fuel and Energy, University of Leeds.
Untitled-8 02/17/2007, 01:3887