isolation by distance and post-glacial range expansion in...
TRANSCRIPT

Molecular Ecology (2005)
14
, 225–244 doi: 10.1111/j.1365-294X.2004.02388.x
© 2004 Blackwell Publishing Ltd
Blackwell Publishing, Ltd.
Isolation by distance and post-glacial range expansion in the rough-skinned newt,
Taricha granulosa
SHAWN R. KUCHTA and AN-MING TAN
Museum of Vertebrate Zoology, 3101 Valley Life Science Bldg., Berkeley, CA 94720–3160
Abstract
Allozymes and mitochondrial DNA sequences were used to examine the phylogeographicalhistory of the rough-skinned newt,
Taricha granulosa,
in western North America. Nineteenpopulations were analysed for allozyme variation at 45 loci, and 23 populations were analysedfor cytochrome
b
sequence variation. Both data sets agree that populations in the southernpart of the range are characterized by isolation by distance, whereas northern populationsfit the expectations of a recent range expansion. However, the northern limit of isolation bydistance (and the southern limit of range expansion) is located in Oregon State by themtDNA data, and in Washington State by the allozyme data. Nevertheless, both data setsare consistent with the known Pleistocene history of western North America, with phylo-genetically basal populations in central and northern California, and a recent range expansionin the north following the retreat of the Cordilleran ice sheet 10 000 years ago. Additionally,a population in Idaho, previously considered introduced from central California based onmorphometric analyses, possesses a distinct mtDNA haplotype, suggesting it could benative. The relevance of these results for Pacific Northwest biogeography is discussed.
Keywords
: allozymes, glaciation, isolation by distance, phylogeography, range expansion,
Tarichagranulosa
Received 15 June 2004; revision received 16 September 2004; accepted 16 September 2004
Introduction
Advances in population genetic and phylogenetic techniquesare aiding evolutionary biologists in unraveling the complexinteractions among geological change, genetic differentiation,species distribution, and species formation (Moritz
et al
.1992; Avise 2000; Brunsfeld
et al
. 2001; Kuchta & Meyer2001; Matocq 2002; Zamudio & Savage 2003; Mahoney2004). Increasingly, diverse data sets are being employedin phylogeographical studies, and discordances amongdata sets reflective of complex evolutionary dynamics areoften discovered (e.g. Ruedi
et al
. 1997; Wake & Jockusch2000; Garcia-Paris
et al
. 2003; Ballard & Whitlock 2004). Forinstance, molecular markers with distinct transmissionmodes (e.g. maternal vs. biparental markers) may recordseparate histories (Jockusch & Wake 2002). In this study,we characterize patterns of genetic variation throughoutthe range of the rough-skinned newt,
Taricha granulosa
,
using allozymes and mitochondrial DNA sequences. Ourgoal is to infer biogeographical history, and to comparethis history with other taxa from western North America,which frequently show higher levels of diversity andpopulation structure in the south (California to centralOregon) than the north (central Oregon to Alaska). Inaddition, we explore the ancestry of a disjunct populationin Idaho, which earlier morphometric studies suggestwas introduced from the southern portion of the range of
T. granulosa
(Nussbaum & Brodie 1971).
Pleistocene history of western North America
At the height of the last glacial maximum, 22 000–18 000years ago, the Laurentide and Cordilleran ice sheets coveredmuch of Canada, southeastern Alaska, and the northernUnited States (Mann & Hamilton 1995). In addition to thephysical presence of the glaciers, climatic change duringthe ice ages displaced plants and animals, restructuredhabitats, and radically influenced the distribution of taxa(e.g. Hewitt 1999; Brunsfeld
et al
. 2001). The Cordilleran icesheet reached its maximum extent in western North
Correspondence: Shawn R. Kuchta, Fax: 831-459-5353, E-mail:[email protected]
226
S . R . K U C H T A and A . - M . T A N
© 2004 Blackwell Publishing Ltd,
Molecular Ecology
, 14, 225–244
America 14 500–14 000 years ago, filling the Puget Troughand Straight of Juan de Fuca of present-day WashingtonState (Waitt & Thorson 1983). Thereafter, the Cordilleranice sheet rapidly retreated inland, and by 10 000 yearsago large expanses of land were exposed and colonizedby terrestrial organisms (Josenhans
et al
. 1995; Mann &Hamilton 1995).
At the height of the last glaciation, unglaciated regions(refugia) were present in Beringia, the Haida Gwaii region(i.e. Queen Charlotte Islands) of coastal British Columbia,Vancouver Island, and areas south of the Cordilleran icesheet (Barnosky
et al
. 1987; Demboski
et al
. 1999; referencestherein). Extensive glaciers were present in the Cascade,Olympic, Siskiyou, and Sierra Nevada mountain ranges, butthe Coast Ranges in the western U.S. were largely unglaci-ated (Burke & Birkland 1983; Guyton 1998). In present-dayWashington and Oregon State, coniferous forests werelocated coastally, while inland regions supported tundra,sub-Alpine and Alpine parkland, and other vegetationtypes with no present-day analogs (Barnosky
et al
. 1987;Whitlock 1992).
Populations of plants and animals occupying unglaciatedregions expanded their ranges following glacial retreatand the shift of climatic zones (Whitlock 1992). Rangeexpansions are predicted to result in reduced levels ofgenetic variation and genetic structure, as repeated longdistance dispersal of individuals (founder events) imposesa series of bottlenecks on the colonizing genomes (Hewitt1996, 1999, 2000; Ibrahim
et al
. 1996; Hewitt & Ibrahim 2001).Unglaciated regions, in contrast, may show higher levelsof genetic variation and population structure, such asisolation by distance. As
T. granulosa
currently occupiesformerly glaciated regions in the north, we hypothesizedthose populations would harbour less genetic diversitythan refugial populations. In this paper, we test this scenariousing isolation by distance plots and other phylogeograph-ical methods. Our results are compared with phylogeo-graphical studies of other Pacific Northwest taxa.
Materials and methods
Allozyme variation
Population Sampling and Laboratory Techniques.
One hundrednine individuals from 19 populations spanning the rangeof
Taricha granulosa
were examined for allozyme variation(Fig. 1; Table 1; Appendix). Following collection, specimenswere euthanized in 25% chlorotone, and heart, liver, andintestine were removed and frozen at
−
70
°
C. Carcasses arestored as vouchers in the Museum of Vertebrate Zoology(MVZ), University of California at Berkeley. Thirty-fourenzymatic products encoded by 45 loci were surveyed(Table 2), and standard methods of starch gel electrophoresiswere employed (Murphy
et al
. 1996).
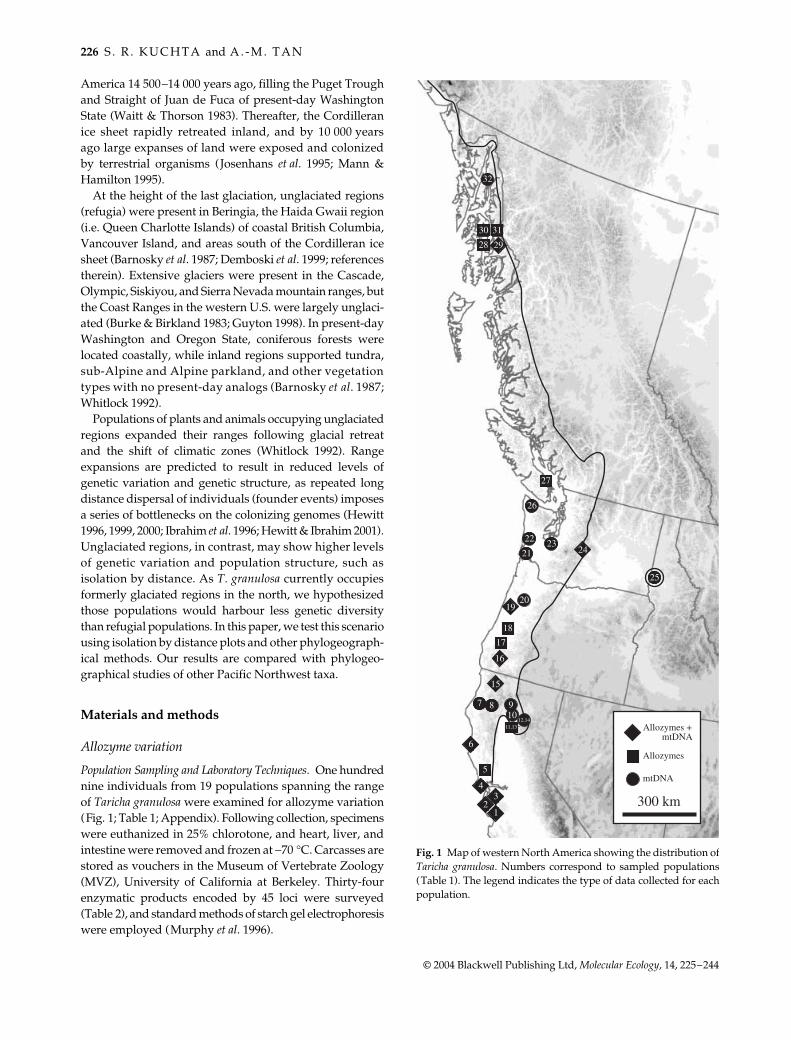
Fig. 1 Map of western North America showing the distribution ofTaricha granulosa. Numbers correspond to sampled populations(Table 1). The legend indicates the type of data collected for eachpopulation.
P H Y L O G E O G R A P H Y O F T H E R O U G H - S K I N N E D N E W T
227
© 2004 Blackwell Publishing Ltd,
Molecular Ecology
, 14, 225–244
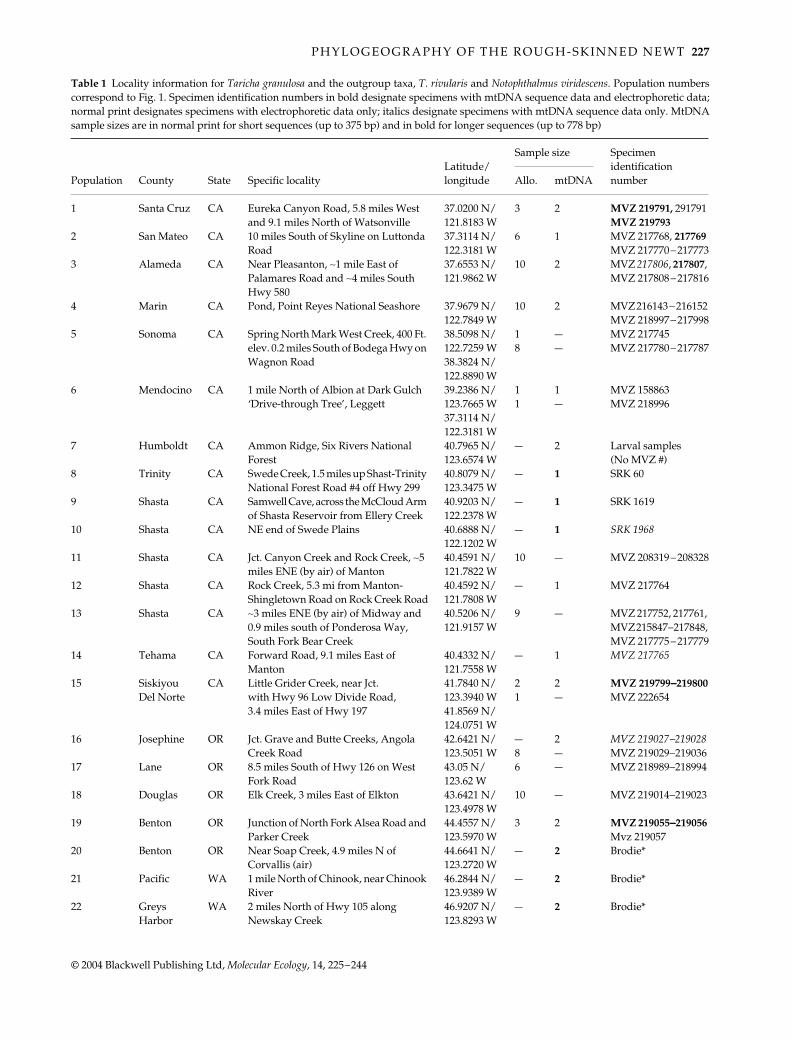
Table 1
Locality information for
Taricha granulosa
and the outgroup taxa,
T. rivularis
and
Notophthalmus viridescens
. Population numberscorrespond to Fig. 1. Specimen identification numbers in bold designate specimens with mtDNA sequence data and electrophoretic data;normal print designates specimens with electrophoretic data only; italics designate specimens with mtDNA sequence data only. MtDNAsample sizes are in normal print for short sequences (up to 375 bp) and in bold for longer sequences (up to 778 bp)
Population County State Specific localityLatitude/longitude
Sample size Specimen identification number Allo. mtDNA
1 Santa Cruz CA Eureka Canyon Road, 5.8 miles West and 9.1 miles North of Watsonville
37.0200 N/121.8183 W
3 2
MVZ 219791,
291791
MVZ 219793
2 San Mateo CA 10 miles South of Skyline on Luttonda Road
37.3114 N/122.3181 W
6 1 MVZ 217768,
217769
MVZ 217770
−
2177733 Alameda CA Near Pleasanton,
∼
1 mile East of Palamares Road and
∼
4 miles South Hwy 580
37.6553 N/121.9862 W
10 2 MVZ
217806
,
217807
, MVZ 217808
−
217816
4 Marin CA Pond, Point Reyes National Seashore 37.9679 N/122.7849 W
10 2 MVZ 216143
−
216152 MVZ 218997
−
2179985 Sonoma CA Spring North Mark West Creek, 400 Ft.
elev. 0.2 miles South of Bodega Hwy on Wagnon Road
38.5098 N/122.7259 W 38.3824 N/122.8890 W
1 8
— —
MVZ 217745 MVZ 217780
−
217787
6 Mendocino CA 1 mile North of Albion at Dark Gulch ‘Drive-through Tree’, Leggett
39.2386 N/123.7665 W 37.3114 N/122.3181 W
1 1
1 —
MVZ 158863 MVZ 218996
7 Humboldt CA Ammon Ridge, Six Rivers National Forest
40.7965 N/123.6574 W
— 2 Larval samples (No MVZ #)
8 Trinity CA Swede Creek, 1.5 miles up Shast-Trinity National Forest Road #4 off Hwy 299
40.8079 N/123.3475 W
—
1
SRK 60
9 Shasta CA Samwell Cave, across the McCloud Arm of Shasta Reservoir from Ellery Creek
40.9203 N/ 122.2378 W
—
1
SRK 1619
10 Shasta CA NE end of Swede Plains 40.6888 N/ 122.1202 W
—
1
SRK 1968
11 Shasta CA Jct. Canyon Creek and Rock Creek,
∼
5 miles ENE (by air) of Manton
40.4591 N/ 121.7822 W
10 — MVZ 208319
−
208328
12 Shasta CA Rock Creek, 5.3 mi from Manton-Shingletown Road on Rock Creek Road
40.4592 N/ 121.7808 W
— 1 MVZ 217764
13 Shasta CA
∼
3 miles ENE (by air) of Midway and 0.9 miles south of Ponderosa Way, South Fork Bear Creek
40.5206 N/ 121.9157 W
9 — MVZ 217752, 217761, MVZ 215847
−
217848, MVZ 217775
−
21777914 Tehama CA Forward Road, 9.1 miles East of
Manton40.4332 N/ 121.7558 W
— 1
MVZ 217765
15 Siskiyou CA Little Grider Creek, near Jct. 41.7840 N/ 2 2
MVZ 219799
−−−−
219800
Del Norte with Hwy 96 Low Divide Road, 3.4 miles East of Hwy 197
123.3940 W 41.8569 N/ 124.0751 W
1 — MVZ 222654
16 Josephine OR Jct. Grave and Butte Creeks, Angola Creek Road
42.6421 N/ 123.5051 W
— 8
2 —
MVZ 219027
−
219028
MVZ 219029
−
21903617 Lane OR 8.5 miles South of Hwy 126 on West
Fork Road43.05 N/ 123.62 W
6 — MVZ 218989
−
218994
18 Douglas OR Elk Creek, 3 miles East of Elkton 43.6421 N/ 123.4978 W
10 — MVZ 219014
−
219023
19 Benton OR Junction of North Fork Alsea Road and Parker Creek
44.4557 N/ 123.5970 W
3 2
MVZ 219055
−−−−
219056
Mvz 219057
20 Benton OR Near Soap Creek, 4.9 miles N of Corvallis (air)
44.6641 N/ 123.2720 W
—
2
Brodie*
21 Pacific WA 1 mile North of Chinook, near Chinook River
46.2844 N/ 123.9389 W
—
2
Brodie*
22 Greys WA 2 miles North of Hwy 105 along 46.9207 N/ —
2
Brodie*Harbor Newskay Creek 123.8293 W

228
S . R . K U C H T A and A . - M . T A N
© 2004 Blackwell Publishing Ltd,
Molecular Ecology
, 14, 225–244
23 Pierce WA 32 miles SW of Dupont (air) 47.0540 N/ 122.6608 W
—
2
Brodie*
24 Kittitas WA Taneum Canyon 47.0833 N/ 120.8333 W
2 2 Larval samples (No MVZ #)
25 Latah ID Near town of Moscow (approximate locality)
46.733 N/ 116.9990 W
—
2
Brodie*
26 Clallam WA Beaver Lake, 4 miles North of Sappho on Burnt Mountain Road
48.1130 N/ 124.2455 W
—
2
Brodie*
27 — B.C. Gabriola Island, along Pilot Bay Road behind Camp Miriam, British Columbia, Canada
49. 1700 N/ 123.8000 W
3 — MVZ 186261
−
186263
28 Wrangell- AK Etolin Island, Alexander 56.19 N/ 4 – MVZ 219773Petersburg Archipelago 132.48 W
−
21977629 Wrangell- AK Highbush Lake, Wrangell 56.3292 N/ 3 2
MVZ 219779
−−−−
219780;
Petersburg Island, Alexander Archipelago 132.0809 W MVZ 219781
30 Wrangell- AK Falls Creek, Mitkof Island, 56.6839 N/ 5 — MVZ 219768
−
219772Petersburg Alexander Archipelago 132.9213 W
31 Wrangell- AK Figure Eight Lake, near Stikine 56.7009 N/ 3 — MVZ 219767;Petersburg River, Stikine-LeConte Wilderness
Area132.2767 W MVZ 219777
−
219778
32 Juneau AK Tee Harbor (possible introduction from Shelter Lake, on Shelter Island near Tee Harbor)
58.410 N/ 134.757 W (58.418 N/ 134.870 W)
—
2
Brodie*
Outgroup species:
Taricha rivularis
33 Sonoma CA Big Sulphur Creek, 13–13.7 miles East U.S. Hwy. 101 on Geysers Road
38.8043 N/ 122.8355 W
1 MVZ 217851
Outgroup species:
Nothophthalmus viridescens
34 Brunswick NC Temporary Lake 2 miles NW of Southport
33.9736 N/ 78.0614 W
— 2 MVZ 161852
−
161853
35 Alachua FL River Styx Crossing, Hwy. 346 29.5169 N/ 82.2219 W
—
1
MVZ 205719
*Tissues provided by E. D. Brodie Jr (Utah State University) and E. D. Brodie III (Indiana University) Specimens will be donated to the University of Texas, Collection of Vertebrates.
Population County State Specific localityLatitude/longitude
Sample size Specimen identification number Allo. mtDNA
Table 1
Continued
Regional Diversity.
Patterns of regional diversity wereexplored using multidimensional scaling (MDS) and isolationby distance (IBD) plots. Multidimensional scaling of Nei(1978) genetic distances were used to explore the relationshipbetween geography and genetic differentiation. MDS is aclass of ordination techniques that displays the complexrelationships among populations in a small number ofdimensions (Lessa 1990). When interpopulational variationis a function of distance alone, the MDS of the first twodimensions produces a clustering pattern similar to ageographical map of the populations (Jackman & Wake1994; Tilley & Mahoney 1996). Note that genetically similarclusters do not necessarily identify historical relationships(clades) (de Quieroz & Good 1997). MDS was performedusing the program
statistica
(StatSoft Inc.). Data were
input as a matrix of Nei’s genetic distances (Nei 1978), butRogers’ distances (1972) provide equivalent results. Screeplots were used to determine the number of dimensionsrequired to sufficiently accommodate the variation.
The accumulation of genetic differentiation with increasedgeographical separation, as a result of restricted dispersalrelative to geographical range, was first explored by Wright(1943), who termed the phenomenon Isolation by Distance(IBD). We tested for IBD by plotting Nei’s (1978) unbiasedgenetic distance (D
N
) among pairwise population compari-sons against geographical distance. This approach has beensuccessfully employed by many researchers, especiallyherpetological systematists, to document IBD (e.g. Tilley
et al
. 1978; Good & Wake 1992; Jackman & Wake 1994;Tilley & Mahoney 1996; de Quieroz & Good 1997; Tilley
P H Y L O G E O G R A P H Y O F T H E R O U G H - S K I N N E D N E W T
229
© 2004 Blackwell Publishing Ltd,
Molecular Ecology
, 14, 225–244
1997; Highton & Peabody 2000; Highton & Peabody 2000;Mead
et al
. 2001). Mantel tests were used to test for a significantassociation between genetic and geographical distance,and reduced major axis (RMA) regression was used toestimate regression statistics. Hellberg (1994) showed thatRMA regression is superior to Ordinary Least Squaresregression for this purpose. The computer program
ibd
(Bohonak 2002) was used to calculate Mantel tests (100 000randomizations) and the slope, y-intercept, and coefficientof determination (
r
2
).
No a priori rationale exists for determining the limits ofIBD. Thus, various methods of grouping populations wereexplored. In the Pacific Northwest, glacial history suggeststhat populations in the north should be recent arrivals.Accordingly, populations were added sequentially fromsouth to north, and regression statistics calculated as eachpopulation was added. The grouping with the highest
r
2
was defined as the ‘optimal’ grouping. This ‘optimal’grouping was compared with the IBD statistics from threeother approaches to grouping populations: (1) all populations
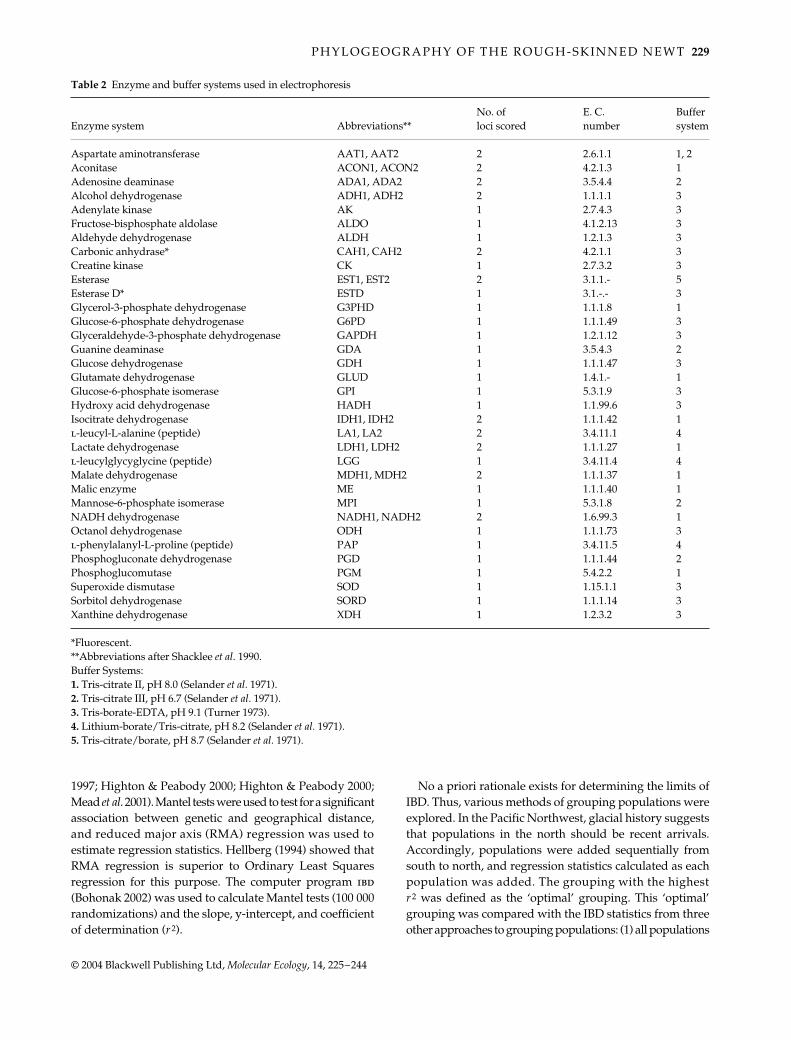
Table 2 Enzyme and buffer systems used in electrophoresis
Enzyme system Abbreviations**No. of loci scored
E. C. number
Buffer system
Aspartate aminotransferase AAT1, AAT2 2 2.6.1.1 1, 2Aconitase ACON1, ACON2 2 4.2.1.3 1Adenosine deaminase ADA1, ADA2 2 3.5.4.4 2Alcohol dehydrogenase ADH1, ADH2 2 1.1.1.1 3Adenylate kinase AK 1 2.7.4.3 3Fructose-bisphosphate aldolase ALDO 1 4.1.2.13 3Aldehyde dehydrogenase ALDH 1 1.2.1.3 3Carbonic anhydrase* CAH1, CAH2 2 4.2.1.1 3Creatine kinase CK 1 2.7.3.2 3Esterase EST1, EST2 2 3.1.1.- 5Esterase D* ESTD 1 3.1.-.- 3Glycerol-3-phosphate dehydrogenase G3PHD 1 1.1.1.8 1Glucose-6-phosphate dehydrogenase G6PD 1 1.1.1.49 3Glyceraldehyde-3-phosphate dehydrogenase GAPDH 1 1.2.1.12 3Guanine deaminase GDA 1 3.5.4.3 2Glucose dehydrogenase GDH 1 1.1.1.47 3Glutamate dehydrogenase GLUD 1 1.4.1.- 1Glucose-6-phosphate isomerase GPI 1 5.3.1.9 3Hydroxy acid dehydrogenase HADH 1 1.1.99.6 3Isocitrate dehydrogenase IDH1, IDH2 2 1.1.1.42 1l-leucyl-L-alanine (peptide) LA1, LA2 2 3.4.11.1 4Lactate dehydrogenase LDH1, LDH2 2 1.1.1.27 1l-leucylglycyglycine (peptide) LGG 1 3.4.11.4 4Malate dehydrogenase MDH1, MDH2 2 1.1.1.37 1Malic enzyme ME 1 1.1.1.40 1Mannose-6-phosphate isomerase MPI 1 5.3.1.8 2NADH dehydrogenase NADH1, NADH2 2 1.6.99.3 1Octanol dehydrogenase ODH 1 1.1.1.73 3l-phenylalanyl-L-proline (peptide) PAP 1 3.4.11.5 4Phosphogluconate dehydrogenase PGD 1 1.1.1.44 2Phosphoglucomutase PGM 1 5.4.2.2 1Superoxide dismutase SOD 1 1.15.1.1 3Sorbitol dehydrogenase SORD 1 1.1.1.14 3Xanthine dehydrogenase XDH 1 1.2.3.2 3
*Fluorescent.**Abbreviations after Shacklee et al. 1990.Buffer Systems:1. Tris-citrate II, pH 8.0 (Selander et al. 1971).2. Tris-citrate III, pH 6.7 (Selander et al. 1971).3. Tris-borate-EDTA, pH 9.1 (Turner 1973).4. Lithium-borate/Tris-citrate, pH 8.2 (Selander et al. 1971).5. Tris-citrate/borate, pH 8.7 (Selander et al. 1971).

230
S . R . K U C H T A and A . - M . T A N
© 2004 Blackwell Publishing Ltd,
Molecular Ecology
, 14, 225–244
from throughout the range of
T. granulosa
(2) the MDS clus-ters, and (3) and the ‘optimal’ solution found for IBD in themtDNA data set (described below).
Phylogenetic Analysis.
Modified Cavalli-Sforza & Edwards(1967) chord distances were used in a Neighbour Joiningalgorithm to estimate phylogenetic relationships from theallozyme data. The use of chord distances with NeighbourJoining has been shown to be accurate when subjected to sim-ulation and congruence tests (Wiens & Servedio 1998; Wiens2000). Chord distances and phylogenetic reconstructionswere computed using
phylip
3.573c (Felsenstein 1993).
MtDNA Cytochrome b Sequence Variation
Population Sampling and Laboratory Techniques
: 39 in-dividuals from 23 populations throughout the rangeof
T. granulosa
were sequenced for a fragment of themitochondrial cytochrome
b
gene (Fig. 1, Table 1). Threeindividuals of
Notophthalmus viridescens
were used as anoutgroup; there is consistent support for a sister taxonrelationship between
Taricha
and
Notophthalmus
(Wake& Özeti 1969; Titus & Larson 1995; Larson
et al
. 2003). Thecomplete data set combines overlapping sequences oftwo lengths collected at different times with differenttechnologies. For data set #1, 24 individuals (includingtwo
N. viridescens
), average length 363 bp, were amplifiedusing the PCR primers MVZ 15 and Cytb2 (Moritz
et al
.1992). Sequences were obtained by running single-strandPCR products on gels (‘manual sequencing’). See Tan &Wake (1995) for laboratory details. Data set #2 consists of 18individuals (including one
N. viridescens
), average length751 bp, amplified using the PCR primers MVZ15 and MVZ16(Moritz
et al
. 1992). The majority of data set #2 focuses onnorthern populations, where the shorter sequences of dataset #1 yielded a single haplotype. Whole genomic DNA wasextracted from ethanol-preserved or frozen tissues (tailtips, liver, intestine) using the ‘DNeasy Tissue Kit’ (Qiagen,Inc). Amplifications were carried out in a PTC-100 ThermalCycler (M.J. Research), and included nontemplate controlsto monitor contamination. Double stranded PCR productswere purified using the QIAquick PCR Purification kit (Qiagen,Inc.). All samples were sequenced in both directionsin a 10
µ
L reaction mixture using dRhodamine and a 377Automated Sequencer (Applied Biosystems, Inc.). Sequenceswere visually aligned in
sequencher
(Gene Codes Corp.). Allsequences are deposited in GenBank under the accessionnumbers L22714, L22771-L22879, L22880-L22881 (data set#1) and AY627899-AY627912 (data set #2).
Regional Diversity.
Patterns of regional diversity within
T. granulosa
were explored using nucleotide diversity (π, theaverage number of nucleotide differences per site) (Nei1987), isolation by distance plots, and haplotype networks.
Isolation by distance was examined in the mtDNAdata in a manner similar to the allozyme data, by plottinggenetic divergence against geographical distance. Satura-tion curves (described below, under Phylogenetic Analyses)suggest that there is little or no mutational saturationwithin T. granulosa, and thus simple percent divergencewas used as a measure of genetic distance. Mantel tests andRMA regression statistics were calculated using the pro-gram ibd 1.52 (Bohonak 2002). The ‘optimal’ grouping ofpopulations calculated for the mtDNA data set (definedas the grouping with the highest r2 value; see AllozymeVariation: Regional Diversity, above) was compared to (1) thecomplete data set (2) the MDS clusters, and (3) the ‘optimal’grouping calculated for the allozyme data set. For tests ofIBD, the Idaho sample (25) was excluded from regressionstatistics because of its geographical isolation and becausewe lack an allozyme sample from Idaho for comparison.
Haplotype networks were generated with tcs 1.13(Clement et al. 2000). Haplotype networks are useful at lowlevels of divergence, when gene trees may not be bifurcat-ing, and thus the hypothesis of a hierarchical relationshipamong haplotypes violated. Haplotype networks weregenerated using (1) all haplotypes, shortened to 375 bp sothat sequence length variation between data set #1 and #2does not impact the results, and (2) the longer sequencesfrom data set #2 from Oregon to Alaska, where only a singlehaplotype was found with data set #1.
Phylogenetic Analyses. Prior to phylogenetic analysis,mutational saturation in the data set was tested by plottingthe absolute number of transitions and transversions ateach codon position (1st, 2nd, and 3rd) against maximumlikelihood distances (parameters chosen with modeltest3.06 (Posada & Crandall 1998; see below)). Mutationalsaturation is identified when increasing genetic distancesare not reflected by an increase in the absolute number ofmutational differences.
Maximum likelihood and Bayesian analyses wereconducted. Identical sequences in data set #1 and #2 wereidentified in macclade 4.0 (Maddison & Maddison 2000)using the ‘Search and Merge’ option. The resultingcombined data set had 19 unique haplotypes, includingthree outgroup haplotypes. The model that best fits thecytochrome b data was determined using a hierarchicallikelihood ratio test, as implemented in the programmodeltest 3.06 (Posada & Crandall 1998). The TransversionModel (TVM) was chosen, and included a parameter forsubstitution rate heterogeneity among sites (Γ = 0.7376).Nucleotide frequencies under this model were estimatedas: A = 0.2829; C = 0.2862; G = 0.1465; T = 0.2844. All siteswere assumed to be variable. This model was used in bothmaximum likelihood and Bayesian analyses.
Maximum likelihood analyses and nonparametric boot-strapping were carried out with paup* 4.0 b10 (Swofford

P H Y L O G E O G R A P H Y O F T H E R O U G H - S K I N N E D N E W T 231
© 2004 Blackwell Publishing Ltd, Molecular Ecology, 14, 225–244
2003), using a heuristic search routine, Tree Bisection andReconnection (TBR) branch swapping, and a starting treeestimated by neighbour joining.
Bayesian analyses were conducted with mrbayes 2.01(Huelsenbeck & Ronquist 2001). The analysis was initiatedwith random starting trees, and carried out for 5.0 × 10⁵
generations. In all runs, default Metropolis-coupledMarkov chain Monte Carlo methods (‘heated chains’) wereused to improve the ability of the Markov chains to findalternate optima. Markov chains were sampled every 100generations, for a total of 5000 sample points. After exclud-ing 10 000 ‘burn in’ generations (chosen by visualization ofa plot of log-likelihood scores against generation), a major-ity rule consensus tree was constructed. The percentage oftimes a particular clade is recovered is its posterior prob-ability. For a clade to be significantly supported it shouldoccur in ∼95% of the sample points (Lewis 2001). To assurethat the posterior probability values had not become‘stuck’ on a local optimum, we repeated the analysis fivetimes with different random starting trees. The log-likelihoodvalues and the posterior probabilities of the clades recoveredwere compared among runs for congruence.
Results
Allozyme variation
Of the 45 loci scored in Taricha granulosa, 21 were variable[many of the invariable loci are variable in other species of
Taricha, or between species; see Kuchta (2002)] (Appendix).Table 3 provides the matrix of Nei’s (1978) and Rogers’(1972) genetic distances among population samples.
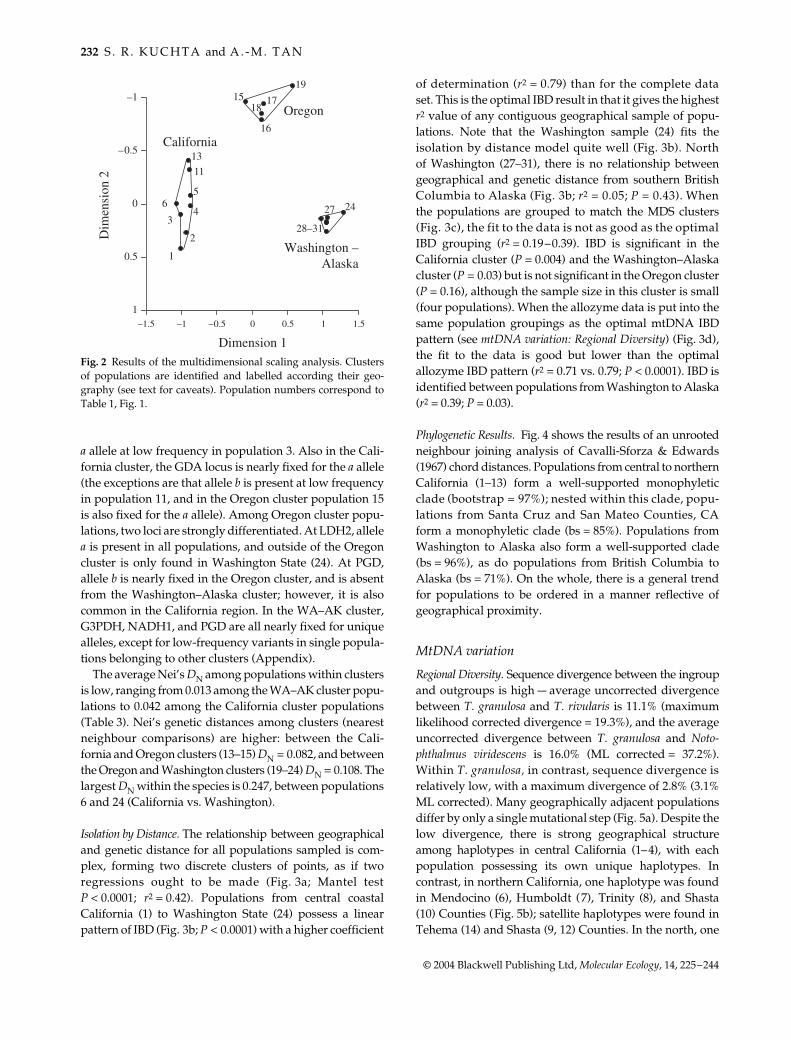
A scree plot suggests that two axes account for mostof the variation in the MDS analysis (data not shown; seeKuchta 2002). Three geographically differentiated clustersof populations were identified (Fig. 2): we label these the‘California’, ′ Oregon′, and ‘Washington to Alaska’ clustersbecause they generally follow state boundaries. However,note that the Siskiyou county population (15) in northernCA is grouped within the ‘Oregon’ cluster, and that there islimited sampling near the Oregon and Washington border,so these labels are not literal. The California cluster looselymirrors geography, with Santa Cruz (1) at one end and Shasta(13) at the other. The Oregon cluster (pop 15–19) is separatedfrom the California cluster, and, relative to geography, haslarger values on the first axis. Population 19 is distinct from15 to 18. The Washington–Alaska cluster is removed fromthe Oregon cluster, especially in the second dimension, andstrongly deviates from a ‘map’ of populations that isolationby distance can produce in MDS results. The populationsin this cluster also form a tight grouping, in contrast to thelarge geographical distance encompassed (>900 km).
Several loci show strong shifts in allele frequency amongthe clusters, and some loci have alleles that are restricted toparticular clusters (Appendix). Among California clusterpopulations, there are four loci with unique, widespreadalleles, including ACON2, IDH1, PGD, and PGM. Forexample, PGM is nearly fixed for allele b, except for the
Table 3 Nei’s (1978) – below diagonal) and Rogers’ (1972) — above diagonal) genetic distances between population pairs for allozymevariation. Clusters refer to the population grouping pattern in the multidimensional scaling analysis (Fig. 2 and text)
California cluster Oregon cluster Washington to Alaska cluster
1 2 3 4 5 6 11 13 15 16 17 18 19 24 27 28 29 30 31
1 — 0.132 0.246 0.221 0.239 0.219 0.276 0.3 0.36 0.38 0.391 0.384 0.422 0.462 0.442 0.436 0.425 0.446 0.4352 0.009 — 0.215 0.188 0.218 0.211 0.251 0.272 0.34 0.348 0.354 0.348 0.395 0.45 0.42 0.419 0.409 0.428 0.4183 0.058 0.045 — 0.139 0.18 0.179 0.26 0.266 0.328 0.331 0.353 0.341 0.427 0.453 0.423 0.416 0.406 0.424 0.4154 0.045 0.033 0.018 — 0.149 0.14 0.2 0.215 0.296 0.303 0.326 0.314 0.403 0.435 0.405 0.398 0.386 0.409 0.3965 0.054 0.047 0.032 0.021 — 0.117 0.16 0.16 0.298 0.303 0.326 0.314 0.403 0.432 0.399 0.393 0.383 0.402 0.3926 0.041 0.041 0.029 0.016 0.01 — 0.18 0.209 0.352 0.356 0.374 0.364 0.445 0.468 0.441 0.434 0.423 0.444 0.43311 0.076 0.065 0.071 0.04 0.024 0.03 — 0.116 0.289 0.287 0.295 0.289 0.381 0.448 0.415 0.412 0.4 0.421 0.4113 0.092 0.077 0.075 0.047 0.024 0.042 0.011 — 0.281 0.287 0.303 0.295 0.388 0.448 0.412 0.406 0.401 0.41 0.40715 0.136 0.123 0.114 0.092 0.093 0.13 0.088 0.082 — 0.202 0.201 0.207 0.255 0.386 0.378 0.374 0.362 0.386 0.37316 0.156 0.131 0.118 0.097 0.098 0.134 0.087 0.087 0.04 — 0.066 0.048 0.234 0.359 0.319 0.317 0.302 0.331 0.31517 0.166 0.136 0.136 0.114 0.114 0.15 0.092 0.097 0.04 0.003 — 0.03 0.212 0.374 0.34 0.341 0.327 0.354 0.3418 0.16 0.131 0.127 0.106 0.106 0.142 0.089 0.093 0.043 0.001 0 — 0.223 0.365 0.326 0.326 0.312 0.34 0.32519 0.196 0.172 0.205 0.181 0.181 0.221 0.16 0.165 0.065 0.055 0.044 0.05 — 0.324 0.32 0.333 0.319 0.346 0.33224 0.242 0.232 0.234 0.213 0.209 0.247 0.229 0.228 0.159 0.136 0.15 0.142 0.108 — 0.191 0.189 0.184 0.211 0.18627 0.219 0.199 0.202 0.183 0.177 0.216 0.193 0.189 0.154 0.107 0.122 0.112 0.106 0.031 — 0.079 0.096 0.098 0.0828 0.212 0.197 0.193 0.175 0.171 0.208 0.19 0.184 0.151 0.106 0.124 0.113 0.117 0.032 0.002 — 0.056 0.058 0.01229 0.2 0.187 0.184 0.164 0.161 0.197 0.178 0.178 0.14 0.096 0.113 0.103 0.106 0.031 0.006 0.001 — 0.109 0.04530 0.224 0.207 0.203 0.187 0.18 0.22 0.2 0.188 0.161 0.116 0.135 0.124 0.127 0.042 0.006 0.002 0.011 — 0.0731 0.21 0.196 0.193 0.174 0.17 0.207 0.189 0.184 0.15 0.105 0.123 0.112 0.116 0.031 0.003 0 0.001 0.003 —
232 S . R . K U C H T A and A . - M . T A N
© 2004 Blackwell Publishing Ltd, Molecular Ecology, 14, 225–244
a allele at low frequency in population 3. Also in the Cali-fornia cluster, the GDA locus is nearly fixed for the a allele(the exceptions are that allele b is present at low frequencyin population 11, and in the Oregon cluster population 15is also fixed for the a allele). Among Oregon cluster popu-lations, two loci are strongly differentiated. At LDH2, allelea is present in all populations, and outside of the Oregoncluster is only found in Washington State (24). At PGD,allele b is nearly fixed in the Oregon cluster, and is absentfrom the Washington–Alaska cluster; however, it is alsocommon in the California region. In the WA–AK cluster,G3PDH, NADH1, and PGD are all nearly fixed for uniquealleles, except for low-frequency variants in single popula-tions belonging to other clusters (Appendix).
The average Nei’s DN among populations within clustersis low, ranging from 0.013 among the WA–AK cluster popu-lations to 0.042 among the California cluster populations(Table 3). Nei’s genetic distances among clusters (nearestneighbour comparisons) are higher: between the Cali-fornia and Oregon clusters (13–15) DN = 0.082, and betweenthe Oregon and Washington clusters (19–24) DN = 0.108. Thelargest DN within the species is 0.247, between populations6 and 24 (California vs. Washington).
Isolation by Distance. The relationship between geographicaland genetic distance for all populations sampled is com-plex, forming two discrete clusters of points, as if tworegressions ought to be made (Fig. 3a; Mantel testP < 0.0001; r2 = 0.42). Populations from central coastalCalifornia (1) to Washington State (24) possess a linearpattern of IBD (Fig. 3b; P < 0.0001) with a higher coefficient
of determination (r2 = 0.79) than for the complete dataset. This is the optimal IBD result in that it gives the highestr2 value of any contiguous geographical sample of popu-lations. Note that the Washington sample (24) fits theisolation by distance model quite well (Fig. 3b). Northof Washington (27–31), there is no relationship betweengeographical and genetic distance from southern BritishColumbia to Alaska (Fig. 3b; r2 = 0.05; P = 0.43). Whenthe populations are grouped to match the MDS clusters(Fig. 3c), the fit to the data is not as good as the optimalIBD grouping (r2 = 0.19–0.39). IBD is significant in theCalifornia cluster (P = 0.004) and the Washington–Alaskacluster (P = 0.03) but is not significant in the Oregon cluster(P = 0.16), although the sample size in this cluster is small(four populations). When the allozyme data is put into thesame population groupings as the optimal mtDNA IBDpattern (see mtDNA variation: Regional Diversity) (Fig. 3d),the fit to the data is good but lower than the optimalallozyme IBD pattern (r2 = 0.71 vs. 0.79; P < 0.0001). IBD isidentified between populations from Washington to Alaska(r2 = 0.39; P = 0.03).
Phylogenetic Results. Fig. 4 shows the results of an unrootedneighbour joining analysis of Cavalli-Sforza & Edwards(1967) chord distances. Populations from central to northernCalifornia (1–13) form a well-supported monophyleticclade (bootstrap = 97%); nested within this clade, popu-lations from Santa Cruz and San Mateo Counties, CAform a monophyletic clade (bs = 85%). Populations fromWashington to Alaska also form a well-supported clade(bs = 96%), as do populations from British Columbia toAlaska (bs = 71%). On the whole, there is a general trendfor populations to be ordered in a manner reflective ofgeographical proximity.
MtDNA variation
Regional Diversity. Sequence divergence between the ingroupand outgroups is high — average uncorrected divergencebetween T. granulosa and T. rivularis is 11.1% (maximumlikelihood corrected divergence = 19.3%), and the averageuncorrected divergence between T. granulosa and Noto-phthalmus viridescens is 16.0% (ML corrected = 37.2%).Within T. granulosa, in contrast, sequence divergence isrelatively low, with a maximum divergence of 2.8% (3.1%ML corrected). Many geographically adjacent populationsdiffer by only a single mutational step (Fig. 5a). Despite thelow divergence, there is strong geographical structureamong haplotypes in central California (1–4), with eachpopulation possessing its own unique haplotypes. Incontrast, in northern California, one haplotype was foundin Mendocino (6), Humboldt (7), Trinity (8), and Shasta(10) Counties (Fig. 5b); satellite haplotypes were found inTehema (14) and Shasta (9, 12) Counties. In the north, one
Fig. 2 Results of the multidimensional scaling analysis. Clustersof populations are identified and labelled according their geo-graphy (see text for caveats). Population numbers correspond toTable 1, Fig. 1.

P H Y L O G E O G R A P H Y O F T H E R O U G H - S K I N N E D N E W T 233
© 2004 Blackwell Publishing Ltd, Molecular Ecology, 14, 225–244
haplotype is broadly distributed from northern CA (15) toAlaska (32); satellite haplotypes were found in LatahCounty, ID (25) and Pacific County, WA (21).
Among the longer sequences in data set #2, haplotypesbetween Oregon (20) and Alaska (32) differ by a maximumof five bp (Fig. 5b). Unlike central California populations,haplotypes in the north tend to be widely distributed. Forexample, one haplotype was found in populations 21, 22,23, 26, and 32 (from Benton Co., OR to Juneau Co., AK);another haplotype (differing from the first by 3 bp) wasfound in populations 20, 22, and 23 (Benton Co., OR, to
Pierce Co., WA). Finally, two individuals from a popula-tion in Idaho (25) share an identical, unique haplotype. It islocated at a tip of the haplotype networks (Fig. 5a,b), andis one base pair different from a haplotype that is broadlydistributed in Oregon and Washington.
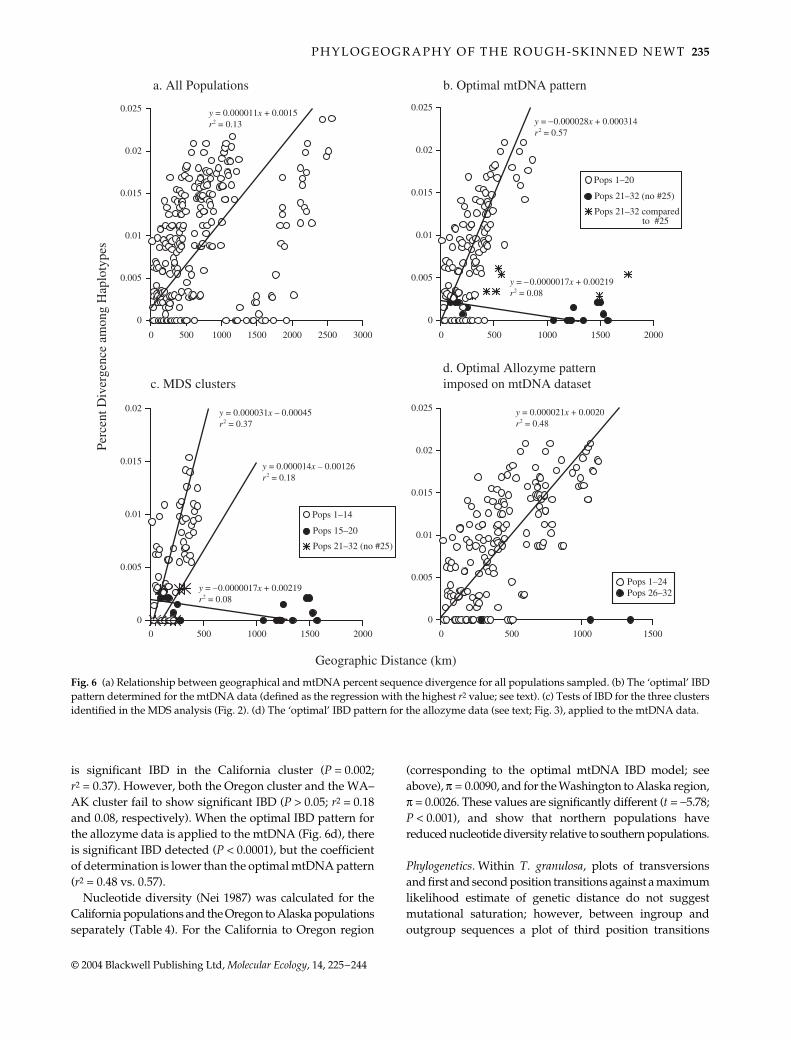
IBD patterns in the mtDNA data are similar to theallozyme data. When all the populations are considered, thereare two separate clusters of points (Fig. 6a). Significant IBDis present (Mantel test P = 0.003), however, the coefficientof determination is low (r2 = 0.13). The optimal IBD pattern(defined as the regression with the highest r2) includes all
Fig. 3 (a) Relationship between geographical distance (km) and Nei’s (1978) genetic distance (DN) among all populations. (b) The ‘optimal’IBD pattern determined for the allozyme data (defined as the regression with the highest r2 value; see text). Regressions are calculatedseparately for populations 1–24 and 27–31. (c) Tests of IBD for clusters identified in the MDS analysis (Fig. 2). (d) The ‘optimal’ IBD patternfor the mtDNA data (see text; Fig. 6), applied to the allozyme data.

234 S . R . K U C H T A and A . - M . T A N
© 2004 Blackwell Publishing Ltd, Molecular Ecology, 14, 225–244
the populations from Santa Cruz Co., CA (1) to Benton Co.,OR (20) (r2 = 0.57; P < 0.0001) (Fig. 6b). No IBD is present inpopulations from Washington to Alaska (21–33, excludingthe Idaho population, 25) (P = 0.84; r2 = 0.08) (Fig. 6b).
Comparisons between populations from Washington–Alaska with the Idaho population (25) also fail to show apattern of isolation by distance (Fig. 6b). When the MDSpattern is imposed on the mtDNA data (Fig. 6c), there
Fig. 4 Unrooted neighbour joining tree,constructed using chord distances (Cavalli-Sforza & Edwards 1967). Bootstrap supportvalues are in bold along internodes (values< 70% not shown). The asterisk shows theroot identified by the Bayesian/ML ana-lysis of the mtDNA data (Fig. 7).
Fig. 5 Haplotype networks. (a) All popula-tions, with longer haplotypes from Data set#2 shorted to match Data set #1 (275 bp). (b)Longer haplotypes (up to 778 bp) from Dataset #2 for haplotypes found from Oregonto Alaska, where the shorter sequences in(a) show very little diversity (the ‘north-ern haplotype’ in Fig. 5a). The asterisksindicate where the network connects tohaplotypes from California.
P H Y L O G E O G R A P H Y O F T H E R O U G H - S K I N N E D N E W T 235
© 2004 Blackwell Publishing Ltd, Molecular Ecology, 14, 225–244
is significant IBD in the California cluster (P = 0.002;r2 = 0.37). However, both the Oregon cluster and the WA–AK cluster fail to show significant IBD (P > 0.05; r2 = 0.18and 0.08, respectively). When the optimal IBD pattern forthe allozyme data is applied to the mtDNA (Fig. 6d), thereis significant IBD detected (P < 0.0001), but the coefficientof determination is lower than the optimal mtDNA pattern(r2 = 0.48 vs. 0.57).
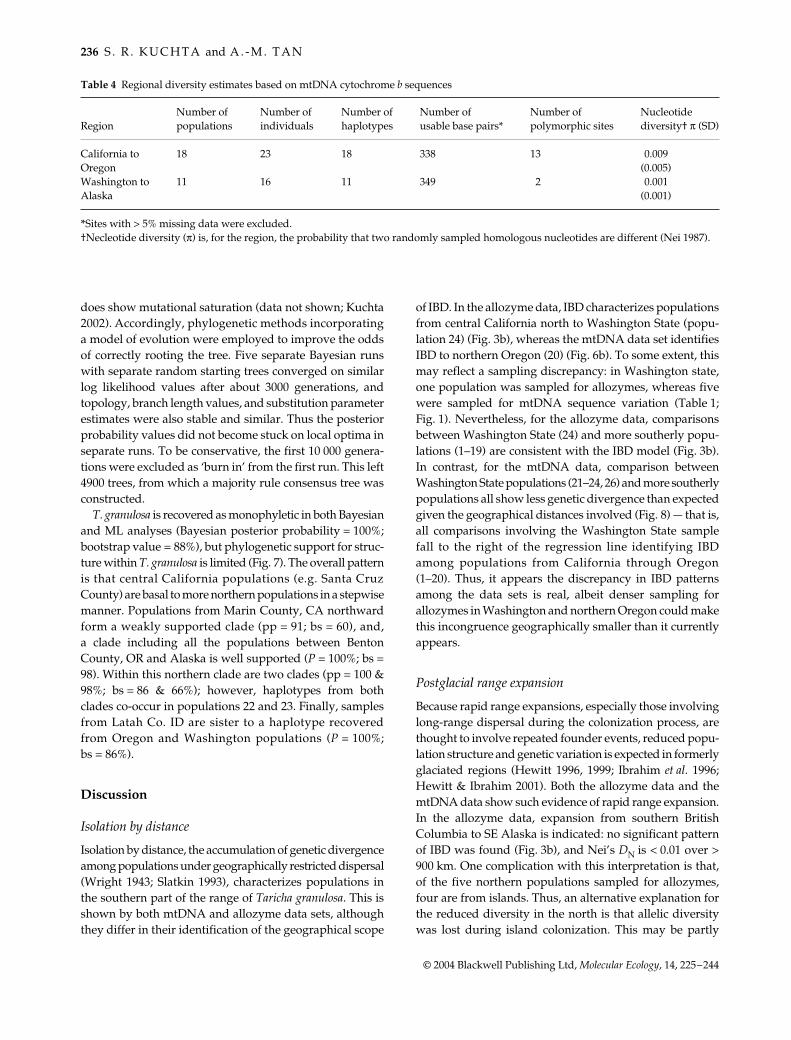
Nucleotide diversity (Nei 1987) was calculated for theCalifornia populations and the Oregon to Alaska populationsseparately (Table 4). For the California to Oregon region
(corresponding to the optimal mtDNA IBD model; seeabove), π = 0.0090, and for the Washington to Alaska region,π = 0.0026. These values are significantly different (t = −5.78;P < 0.001), and show that northern populations havereduced nucleotide diversity relative to southern populations.
Phylogenetics. Within T. granulosa, plots of transversionsand first and second position transitions against a maximumlikelihood estimate of genetic distance do not suggestmutational saturation; however, between ingroup andoutgroup sequences a plot of third position transitions
Fig. 6 (a) Relationship between geographical and mtDNA percent sequence divergence for all populations sampled. (b) The ‘optimal’ IBDpattern determined for the mtDNA data (defined as the regression with the highest r2 value; see text). (c) Tests of IBD for the three clustersidentified in the MDS analysis (Fig. 2). (d) The ‘optimal’ IBD pattern for the allozyme data (see text; Fig. 3), applied to the mtDNA data.
236 S . R . K U C H T A and A . - M . T A N
© 2004 Blackwell Publishing Ltd, Molecular Ecology, 14, 225–244
does show mutational saturation (data not shown; Kuchta2002). Accordingly, phylogenetic methods incorporatinga model of evolution were employed to improve the oddsof correctly rooting the tree. Five separate Bayesian runswith separate random starting trees converged on similarlog likelihood values after about 3000 generations, andtopology, branch length values, and substitution parameterestimates were also stable and similar. Thus the posteriorprobability values did not become stuck on local optima inseparate runs. To be conservative, the first 10 000 genera-tions were excluded as ‘burn in’ from the first run. This left4900 trees, from which a majority rule consensus tree wasconstructed.
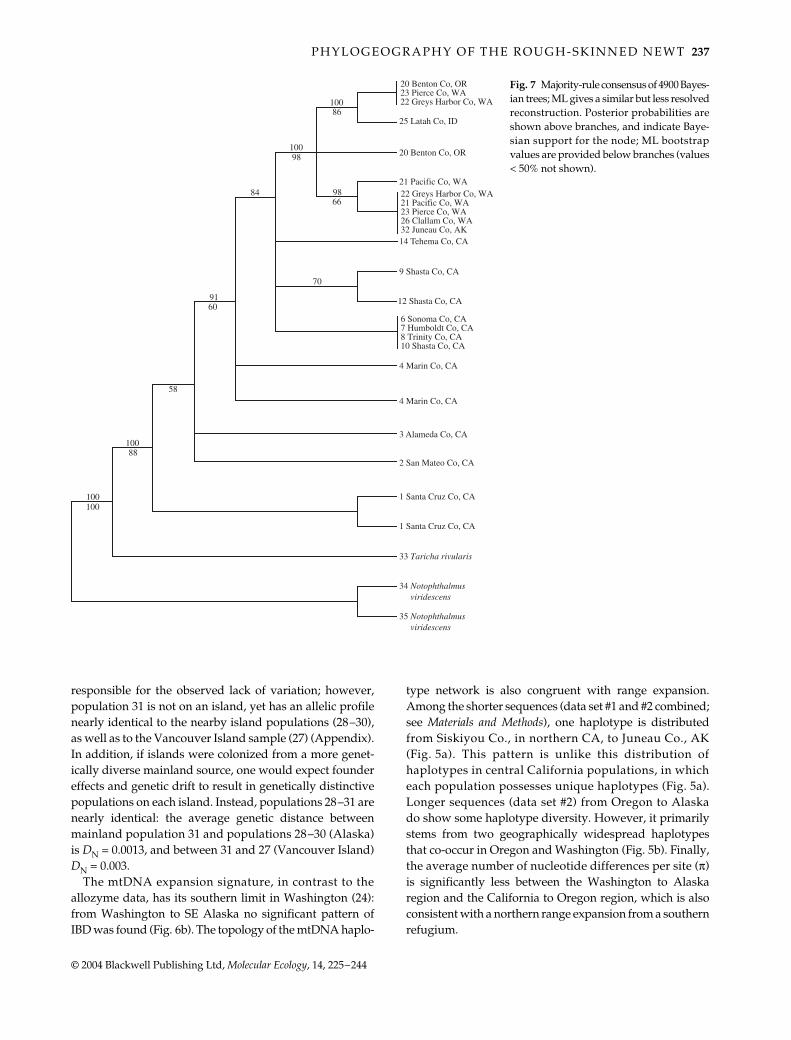
T. granulosa is recovered as monophyletic in both Bayesianand ML analyses (Bayesian posterior probability = 100%;bootstrap value = 88%), but phylogenetic support for struc-ture within T. granulosa is limited (Fig. 7). The overall patternis that central California populations (e.g. Santa CruzCounty) are basal to more northern populations in a stepwisemanner. Populations from Marin County, CA northwardform a weakly supported clade (pp = 91; bs = 60), and,a clade including all the populations between BentonCounty, OR and Alaska is well supported (P = 100%; bs =98). Within this northern clade are two clades (pp = 100 &98%; bs = 86 & 66%); however, haplotypes from bothclades co-occur in populations 22 and 23. Finally, samplesfrom Latah Co. ID are sister to a haplotype recoveredfrom Oregon and Washington populations (P = 100%;bs = 86%).
Discussion
Isolation by distance
Isolation by distance, the accumulation of genetic divergenceamong populations under geographically restricted dispersal(Wright 1943; Slatkin 1993), characterizes populations inthe southern part of the range of Taricha granulosa. This isshown by both mtDNA and allozyme data sets, althoughthey differ in their identification of the geographical scope
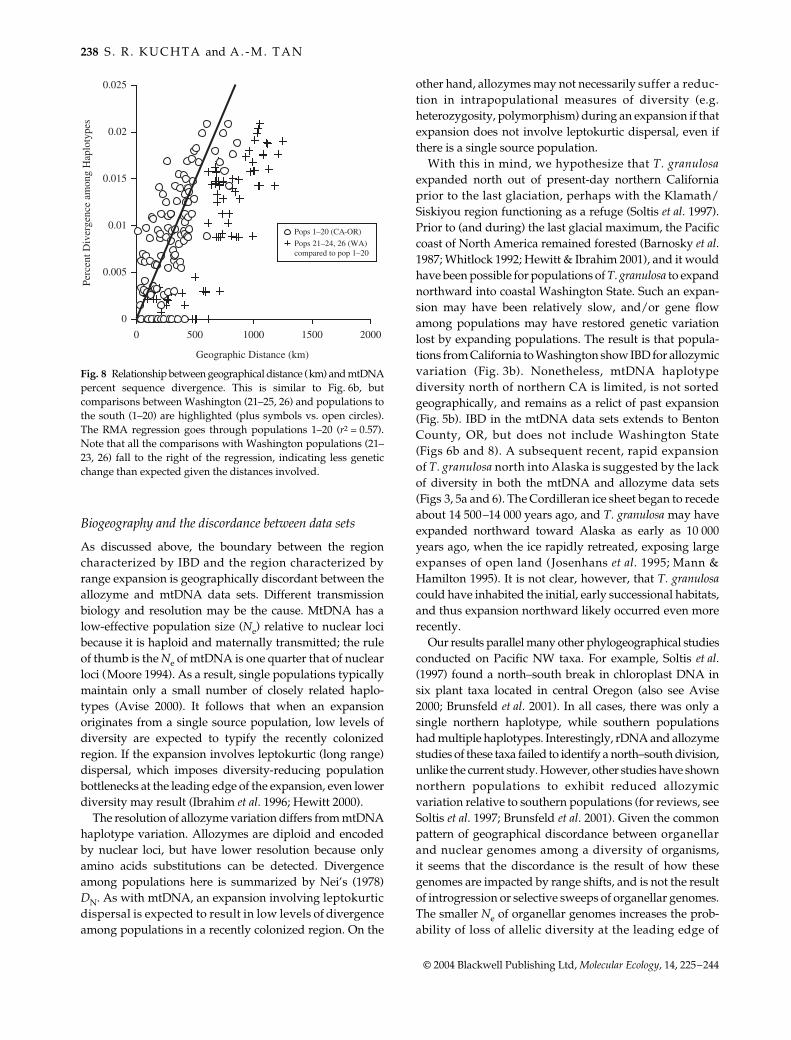
of IBD. In the allozyme data, IBD characterizes populationsfrom central California north to Washington State (popu-lation 24) (Fig. 3b), whereas the mtDNA data set identifiesIBD to northern Oregon (20) (Fig. 6b). To some extent, thismay reflect a sampling discrepancy: in Washington state,one population was sampled for allozymes, whereas fivewere sampled for mtDNA sequence variation (Table 1;Fig. 1). Nevertheless, for the allozyme data, comparisonsbetween Washington State (24) and more southerly popu-lations (1–19) are consistent with the IBD model (Fig. 3b).In contrast, for the mtDNA data, comparison betweenWashington State populations (21–24, 26) and more southerlypopulations all show less genetic divergence than expectedgiven the geographical distances involved (Fig. 8) — that is,all comparisons involving the Washington State samplefall to the right of the regression line identifying IBDamong populations from California through Oregon(1–20). Thus, it appears the discrepancy in IBD patternsamong the data sets is real, albeit denser sampling forallozymes in Washington and northern Oregon could makethis incongruence geographically smaller than it currentlyappears.
Postglacial range expansion
Because rapid range expansions, especially those involvinglong-range dispersal during the colonization process, arethought to involve repeated founder events, reduced popu-lation structure and genetic variation is expected in formerlyglaciated regions (Hewitt 1996, 1999; Ibrahim et al. 1996;Hewitt & Ibrahim 2001). Both the allozyme data and themtDNA data show such evidence of rapid range expansion.In the allozyme data, expansion from southern BritishColumbia to SE Alaska is indicated: no significant patternof IBD was found (Fig. 3b), and Nei’s DN is < 0.01 over >900 km. One complication with this interpretation is that,of the five northern populations sampled for allozymes,four are from islands. Thus, an alternative explanation forthe reduced diversity in the north is that allelic diversitywas lost during island colonization. This may be partly
Table 4 Regional diversity estimates based on mtDNA cytochrome b sequences
RegionNumber of populations
Number of individuals
Number ofhaplotypes
Number of usable base pairs*
Number of polymorphic sites
Nucleotide diversity† π (SD)
California to 18 23 18 338 13 0.009Oregon (0.005)Washington to 11 16 11 349 2 0.001Alaska (0.001)
*Sites with > 5% missing data were excluded.†Necleotide diversity (π) is, for the region, the probability that two randomly sampled homologous nucleotides are different (Nei 1987).
P H Y L O G E O G R A P H Y O F T H E R O U G H - S K I N N E D N E W T 237
© 2004 Blackwell Publishing Ltd, Molecular Ecology, 14, 225–244
responsible for the observed lack of variation; however,population 31 is not on an island, yet has an allelic profilenearly identical to the nearby island populations (28–30),as well as to the Vancouver Island sample (27) (Appendix).In addition, if islands were colonized from a more genet-ically diverse mainland source, one would expect foundereffects and genetic drift to result in genetically distinctivepopulations on each island. Instead, populations 28–31 arenearly identical: the average genetic distance betweenmainland population 31 and populations 28–30 (Alaska)is DN = 0.0013, and between 31 and 27 (Vancouver Island)DN = 0.003.
The mtDNA expansion signature, in contrast to theallozyme data, has its southern limit in Washington (24):from Washington to SE Alaska no significant pattern ofIBD was found (Fig. 6b). The topology of the mtDNA haplo-
type network is also congruent with range expansion.Among the shorter sequences (data set #1 and #2 combined;see Materials and Methods), one haplotype is distributedfrom Siskiyou Co., in northern CA, to Juneau Co., AK(Fig. 5a). This pattern is unlike this distribution ofhaplotypes in central California populations, in whicheach population possesses unique haplotypes (Fig. 5a).Longer sequences (data set #2) from Oregon to Alaskado show some haplotype diversity. However, it primarilystems from two geographically widespread haplotypesthat co-occur in Oregon and Washington (Fig. 5b). Finally,the average number of nucleotide differences per site (π)is significantly less between the Washington to Alaskaregion and the California to Oregon region, which is alsoconsistent with a northern range expansion from a southernrefugium.
Fig. 7 Majority-rule consensus of 4900 Bayes-ian trees; ML gives a similar but less resolvedreconstruction. Posterior probabilities areshown above branches, and indicate Baye-sian support for the node; ML bootstrapvalues are provided below branches (values< 50% not shown).
238 S . R . K U C H T A and A . - M . T A N
© 2004 Blackwell Publishing Ltd, Molecular Ecology, 14, 225–244
Biogeography and the discordance between data sets
As discussed above, the boundary between the regioncharacterized by IBD and the region characterized byrange expansion is geographically discordant between theallozyme and mtDNA data sets. Different transmissionbiology and resolution may be the cause. MtDNA has alow-effective population size (Ne) relative to nuclear locibecause it is haploid and maternally transmitted; the ruleof thumb is the Ne of mtDNA is one quarter that of nuclearloci (Moore 1994). As a result, single populations typicallymaintain only a small number of closely related haplo-types (Avise 2000). It follows that when an expansionoriginates from a single source population, low levels ofdiversity are expected to typify the recently colonizedregion. If the expansion involves leptokurtic (long range)dispersal, which imposes diversity-reducing populationbottlenecks at the leading edge of the expansion, even lowerdiversity may result (Ibrahim et al. 1996; Hewitt 2000).
The resolution of allozyme variation differs from mtDNAhaplotype variation. Allozymes are diploid and encodedby nuclear loci, but have lower resolution because onlyamino acids substitutions can be detected. Divergenceamong populations here is summarized by Nei’s (1978)DN. As with mtDNA, an expansion involving leptokurticdispersal is expected to result in low levels of divergenceamong populations in a recently colonized region. On the
other hand, allozymes may not necessarily suffer a reduc-tion in intrapopulational measures of diversity (e.g.heterozygosity, polymorphism) during an expansion if thatexpansion does not involve leptokurtic dispersal, even ifthere is a single source population.
With this in mind, we hypothesize that T. granulosaexpanded north out of present-day northern Californiaprior to the last glaciation, perhaps with the Klamath/Siskiyou region functioning as a refuge (Soltis et al. 1997).Prior to (and during) the last glacial maximum, the Pacificcoast of North America remained forested (Barnosky et al.1987; Whitlock 1992; Hewitt & Ibrahim 2001), and it wouldhave been possible for populations of T. granulosa to expandnorthward into coastal Washington State. Such an expan-sion may have been relatively slow, and/or gene flowamong populations may have restored genetic variationlost by expanding populations. The result is that popula-tions from California to Washington show IBD for allozymicvariation (Fig. 3b). Nonetheless, mtDNA haplotypediversity north of northern CA is limited, is not sortedgeographically, and remains as a relict of past expansion(Fig. 5b). IBD in the mtDNA data sets extends to BentonCounty, OR, but does not include Washington State(Figs 6b and 8). A subsequent recent, rapid expansionof T. granulosa north into Alaska is suggested by the lackof diversity in both the mtDNA and allozyme data sets(Figs 3, 5a and 6). The Cordilleran ice sheet began to recedeabout 14 500–14 000 years ago, and T. granulosa may haveexpanded northward toward Alaska as early as 10 000years ago, when the ice rapidly retreated, exposing largeexpanses of open land (Josenhans et al. 1995; Mann &Hamilton 1995). It is not clear, however, that T. granulosacould have inhabited the initial, early successional habitats,and thus expansion northward likely occurred even morerecently.
Our results parallel many other phylogeographical studiesconducted on Pacific NW taxa. For example, Soltis et al.(1997) found a north–south break in chloroplast DNA insix plant taxa located in central Oregon (also see Avise2000; Brunsfeld et al. 2001). In all cases, there was only asingle northern haplotype, while southern populationshad multiple haplotypes. Interestingly, rDNA and allozymestudies of these taxa failed to identify a north–south division,unlike the current study. However, other studies have shownnorthern populations to exhibit reduced allozymicvariation relative to southern populations (for reviews, seeSoltis et al. 1997; Brunsfeld et al. 2001). Given the commonpattern of geographical discordance between organellarand nuclear genomes among a diversity of organisms,it seems that the discordance is the result of how thesegenomes are impacted by range shifts, and is not the resultof introgression or selective sweeps of organellar genomes.The smaller Ne of organellar genomes increases the prob-ability of loss of allelic diversity at the leading edge of
Fig. 8 Relationship between geographical distance (km) and mtDNApercent sequence divergence. This is similar to Fig. 6b, butcomparisons between Washington (21–25, 26) and populations tothe south (1–20) are highlighted (plus symbols vs. open circles).The RMA regression goes through populations 1–20 (r2 = 0.57).Note that all the comparisons with Washington populations (21–23, 26) fall to the right of the regression, indicating less geneticchange than expected given the distances involved.
P H Y L O G E O G R A P H Y O F T H E R O U G H - S K I N N E D N E W T 239
© 2004 Blackwell Publishing Ltd, Molecular Ecology, 14, 225–244
an expansion, because genetic drift is a stronger force withlow Ne. Also, if there is male-biased dispersal, this mayfurther reduce the chance that mtDNA diversity willpersist through an expansion event because this alsolowers Ne.
Like T. granulosa, the salamander Ensatina eschscholtziialso shows reduced diversity in the Pacific NW relative toCalifornia. For mtDNA sequences, a single clade extendsfrom northern California to British Columbia, whereas severalhighly divergent clades are found in northern California(Moritz et al. 1992; Kuchta, Parks, Schneider, and Wake,unpublished data). Allozyme diversity is also greater inCalifornia than in northern populations (Wake & Yanev1986). In contrast to E. eschscholtzii and T. granulosa, manyother salamanders show large genetic breaks between PacificNorthwest and more southern populations. For example,Rhyacotriton kezeri and R. variegates (Good & Wake 1992),Dicamptodon tenebrosus and D. ensatus (Good 1989), andAneides vagrans and A. ferreus ( Jackman 1998) all show deepdivergence in allozymes among sister taxa in the regionbetween central Oregon and northern California.
Status of disjunct populations in Idaho
The presence of T. granulosa populations in the northernRocky Mountains of Idaho is of biogeographical interest.Nussbaum & Brodie (1971) analysed the body proportionsof 50 specimens from an Idaho population, and comparedtheir data with Riemer (1958) and additional populationsfrom Oregon and Washington. They found that the Idahopopulations were most similar to populations from thesouthern part of the range of T. granulosa (e.g. Santa CruzCounty, CA) in head shape and pigment distribution, andconcluded that the Idaho populations were introduced fromcentral coastal California. The mtDNA data presented herereject this hypothesis, because the haplotype from Idaho isunique, and, more importantly, is one base pair differentfrom another haplotype broadly distributed throughoutWashington and Oregon. Taken together, the genetic andmorphometric data suggest the Idaho populations couldbe native. Alternatively, it is conceivable that the Idahopopulations were introduced from Oregon or Washington,and the morphometric differences documented by Nussbaum& Brodie (1971) a result of phenotypic plasticity, samplingartifacts, or a rapid response to natural selection. If thepopulations in Idaho are native, they are of conservationconcern (Nussbaum et al. 1983).
Lending credence to the possibility that the Idaho popu-lations could be native is the fact that over 100 species ofplants and animals are disjunctly distributed in the mesicforests of the northern Rockies in Idaho and Montana, andthe Cascades and Coast Ranges of western Washington,Oregon, and northern California (‘Mesic Forest DisjunctDistribution’; Brunsfeld et al. 2001). Amphibian species with
this distribution include Ascaphus truei/montanus (Ascaphidae)(Nielson et al. 2001), Dicamptodon ensatus/tenebrosus/atterimus(Dicamptodontidae) (Good 1989), Plethodon vandykei/idahoensis(Plethodontidae) (Howard et al. 1993), and Rana pretiosa/luteiventris (Ranidae) (Green et al. 1996). In all these instances,sister taxa are found between the northern Rocky Mountainsand the mesic forests of Washington and Oregon. However,this is not the situation in other taxa, such as the plantsTiarella trifoliata (Saxifragaceae) (Soltis et al. 1992), Alnusrubra (Betulaceae) (Soltis et al. 1997), and Polystichum muni-tum (Dryopteridaceae) (Soltis et al. 1997), and the lizardElgaria coerulea (Anguidae) (Good 1985). Brunsfeld et al.(2001) reviewed the comparative phylogeography of west-ern North America, and proposed two contrasting bio-geographical scenarios to explain these distributionalpatterns. The first is the ‘Ancient Vicariance’ hypothesis,which posits that Rocky mountain populations have beendemographically separated from coastal mountain popu-lations for a long time (perhaps millions of years; seeBrunsfeld et al. 2001), as is the case with the amphibian taxacited above. The alternative hypothesis is the ‘Inland Dis-persal’ hypothesis, and is the result of recent colonizationof the Rocky Mountains by Coast Range populations,probably either via the Okanogan Highlands in northernWashington or the Central Oregon Highlands. Most planttaxa so far studied are best explained by some version ofthis second hypothesis, as is the lizard E. coerulea. If theIdaho populations of T. granulosa are native, the geneticdata is also most consistent with the inland dispersalhypothesis. Because the haplotype in Idaho is most similarto a haplotype found in central Oregon, the Central OregonHighlands are the most likely dispersal corridor.
In summary, T. granulosa is characterized by isolation bydistance in the southern part of its range, but has reducedgenetic diversity in the north because of the effects ofrecent range expansion. This result is congruent with otherphylogeographical studies of Pacific Northwest taxa, espe-cially plants, yet differs from most other salamander speciesthus far studied. Finally, we showed that Rocky Mountainpopulations (in Idaho) are most closely related to popula-tions in Washington and Oregon, and we suggest they couldbe native. More work is required, however, to deduce thehistory of these populations with confidence.
Acknowledgements
Valuable specimens and tissues were loaned to us by BradfordNorman, Edmond Brodie, Jr., Edmond Brodie, III, David Darda,Gary Fellers, David Green, Dan Holland, Bill Leonard, SharynMarks, Claudia Luke, Phil Northern, Richard Sage, and HartWelsh. Numerous government agencies allowed us to collectspecimens for this research, and their support is appreciated. Thisresearch was in part funded by the National Science Foundation(DEB 0072869) to D. B. Wake and S.R.K. An NSF PredoctoralFellowship supported S.R.K. for three years. Edmund Brodie Jr. and

240 S . R . K U C H T A and A . - M . T A N
© 2004 Blackwell Publishing Ltd, Molecular Ecology, 14, 225–244
E. Brodie III funded the sequencing of many of the tissues fromOregon through Alaska with NSF grants DEB 9904070 (EDB Jr.)and DEB 9903829 (EDB III). The work of A. T. was funded by a CarlB. Koford grant (Museum of Vertebrate Zoology, U. C. Berkeley),and the Department of Integrative Biology (U.C. Berkeley). Bothauthors thank David B. Wake for guidance and support as our thesisadvisor. Kate Horjus, Jim Kurpius, Meredith Mahoney, DavidWake, the members of ‘Kuchta Koffee’ (Alexis Harrison, FrankSantan, Ilea Smith, Michelle Smith and Ryan Taylor) and fouranonymous reviewers improved the manuscript with theirinsightful comments.
References
Avise JC (2000) PhyloGeographyraphy: the History and Formation ofSpecies. Harvard University Press, Cambridge, Massachusetts.
Ballard JWO, Whitlock MC (2004) The incomplete natural historyof mitochondria. Molecular Ecology, 13, 729–744.
Barnosky CW, Anderson PM, Bartlein PJ (1987) The northwesternU.S. during glaciation; vegetational history and paleoclimaticimplications. In: North America and Adjacent Oceans During theLast Glaciation (eds Ruddiman WF, Wright HE Jr), pp. 289–321.Geological Society of America, Boulder.
Bohonak AJ (2002a) IBD (isolation by distance): a program forpopulation genetic analyses of isolation by distance. Journal ofHeredity, 93, 153–154.
Brunsfeld SJ, Sullivan J, Soltis DE, Soltis PS (2001) Comparativephylogeography of northwestern North America: a synthesis.In: Integrating Ecology and Evolution in a Spatial Context (edsSilvertown J, Antonovics F), pp. 319–339. Blackwell Science, Oxford.
Burke RM, Birkland PW (1983) Holocene glaciation in the mountainranges of the western United States. In: Late-Quaternary Environ-ments of the United States, Vol. 2: the Holocene (ed. Wright HE Jr),pp. 3–11. University of Minnesota Press, Minneapolis.
Cavalli-Sforza LL, Edwards AWF (1967) Phylogenetic analysis:models and estimation procedures. American Journal of HumanGenetics, 19, 233–257.
Clement M, Posada D, Crandall KA (2000) tcs: a computer programto estimate gene genealogies. Molecular Ecology, 9, 1657–1660.
Demboski JR, Stone KD, Cook JA (1999) Further perspectives on theHaida Gwaii glacial refugium controversy. Evolution, 53, 2008–2012.
Felsenstein J (1993) phylip (Phylogeny Inference Package), Ver-sion 3.5c. Department of Genetics. University of Washington,Seattle.
Garcia-Paris M, Alcobendas M, Buckley D, Wake DB (2003) Dis-persal of viviparity across contact zones in Iberian populationsof fire salamanders (Salamandra) inferred from discordance ofgenetic and morphological traits. Evolution, 57, 129–143.
Good DA (1985) Studies of interspecific and intraspecific variationin the alligator lizards (Lacertidae: Anguidae: Gerrhonotinae).PhD Thesis, University of California, Berkeley.
Good DA (1989) Hybridization and cryptic species in Dicamptodon(Caudata: Dicamptodontidae). Evolution, 43, 728–744.
Good DA, Wake DB (1992) Geographic variation and speciation inthe torrent salamanders of the genus Rhyacotriton (Caudata:Rhyacotritonidae). University Of California Publications in Zoology,126, 1–91.
Green DM, Sharbel TF, Kearsley J, Kaiser H (1996) Postglacialrange fluctuation, genetic subdivision and speciation in thewestern North American spotted frog complex, Rana pretiosa.Evolution, 50, 374–390.
Guyton B (1998) Glaciers of California. University of CaliforniaPress, Berkeley, CA.
Hellberg ME (1994) Relationships between inferred levels of geneflow and geographic distance in a philopatric coral, Balanophylliaelegans. Evolution, 48, 1829–1854.
Hewitt G (1996) Some genetic consequences of ice ages, and theirrole in divergence and speciation. Biology Journal of the LinnaeanSociety, 58, 247–276.
Hewitt G (1999) Post-glacial recolonization of European biota.Biology Journal of the Linnaean Society, 68, 87–112.
Hewitt G (2000) The genetic legacy of the Quaternary ice ages.Nature, 405, 907–913.
Hewitt GM, Ibrahim KM (2001) Inferring glacial refugia and his-torical migrations with molecular phylogenies. In: IntegratingEcology and Evolution in a Spatial Context (eds Silvertown J,Antonovics F). Blackwell Science, Oxford.
Highton R, Peabody RB (2000) Geographic protein variation andspeciation in salamanders of the southern Appalachian moun-tains with the description of four new species. In: The Biology ofPlethodontid Salamanders (eds Bruce RC, Jaeger R, Houck LD).Kluwer Academic/Plenum Publishers, New York.
Howard JH, Seeb LW, Wallace R (1993) Genetic variation andpopulation divergence in the Plethodon vandykei species group(Caudata: Plethodontidae). Herpetologica, 49, 238–247.
Huelsenbeck JP, Ronquist F (2001) MRBAYES 2.001: Bayesianinference of phylogenetic trees. Bioinformatics, 17, 754–755.
Ibrahim KM, Nichols RA, Hewitt GM (1996) Spatial patterns ofgenetic variation generated by different forms of dispersalduring range expansion. Heredity, 77, 282–291.
Jackman TR (1998) Molecular and historical evidence for the intro-duction of clouded salamanders (genus Aneides) to VancouverIsland, British Columbia, Canada, from California. CanadianJournal of Zoology, 76, 1570–1580.
Jackman TR, Wake DB (1994) Evolutionary and historical analysisof protein variation in the blotched forms of salamanders of theEnsatina complex (Amphibia: Plethodontidae). Evolution, 48,876–897.
Jockusch EL, Wake DB (2002) Falling apart and merging: diversi-fication of slender salamanders (Plethodontidae: Batrachoseps)in the American West. Biological Journal of the Linnaean Society,76, 361–391.
Josenhans HW, Fedje DW, Conway KW, Barrie JV (1995) Postglacial sea levels on the western Canadian continental shelf:evidence for rapid change, extensive subaerial exposures, andearly human habitation. Marine Geology, 125, 73–94.
Kuchta SR (2002) Systematics, Speciation, and Mimicry in Taricha(Caudata: Salamandridae). PhD Thesis, University of Californiaat Berkeley.
Kuchta SR, Meyer D (2001) A genealogical view of geographicalvariation. Molecular Ecology, 10, 2569–2576.
Larson A, Weisrock DW, Kozak KH (2003) Phylogenetic systematicsof salamanders (Amphibia: Urodela), a review. In: ReproductiveBiology and Phylogeny of the Urodela (Ed. Sever DM), pp. 31–108.Science Publishers, Inc., Enfield, NH.
Lessa EP (1990) Multidimensional analysis of geographic geneticstructure. Systematic Zoology, 39, 242–252.
Lewis PO (2001) Phylogenetic systematics turns over a new leaf.Trends in Ecology and Evolution, 16, 30–37.
Maddison DR, Maddison WP (2000) MACCLADE 4: Analysis of Phylogenyand Character Evolution, Version 4.0, Sinauer, Sunderland, MA.
Mahoney MM (2004) Molecular systematics and phylogeographyof the Plethodon elongatus species group: combining phylogenetic
P H Y L O G E O G R A P H Y O F T H E R O U G H - S K I N N E D N E W T 241
© 2004 Blackwell Publishing Ltd, Molecular Ecology, 14, 225–244
and population genetic methods to investigate species history.Molecular Ecology, 13, 149–166.
Mann DH, Hamilton TD (1995) Late Pleistocene and Holocenepaleoenvironments of the North Pacific coast. QuaternaryScience Reviews, 14, 449–471.
Matocq MD (2002) Phylogeographical structure and regionalhistory of the Dusky-footed woodrat, Neotoma fuscipes. MolecularEcology, 11, 229–242.
Mead LS, Tilley SG, Katz LA (2001) Genetic structure of the blue ridgedusky salamander (Desmognathus orestes): inferences from allozymes,mitochondrial DNA, and behavior. Evolution, 55, 2287–2302.
Moore WS (1994) Inferring phylogenies from mtDNA variation:mitochondrial-gene trees versus nuclear-gene trees. Evolution,49, 718–726.
Moritz C, Schneider CJ, Wake DB (1992) Evolutionary relation-ships within the Ensatina eschscholtzii complex confirm the ringspecies interpretation. Systematic Biology, 41, 273–291.
Murphy RW, Sites JW, Buth DG, Haufler CH (1996) Proteins:isozyme electrophoresis. In: Molecular Systematics (eds Hillis DM,Moritz C, Mable BK), pp. 51–120. Sinauer Associates, Inc.,Sunderland, MA.
Nei M (1978) Estimation of average heterozygosity and geneticdistance from a small number of individuals. Genetics, 89, 583–590.
Nei M (1987) Molecular Evolutionary Genetics. Columbia UniversityPress, New York, NY.
Nielson M, Lohman K, Sullivan J (2001) Phylogeography of thetailed frog (Ascaphus truei): implications for the biogeography ofthe Pacific Northwest. Evolution, 55, 147–160.
Nussbaum RA, Brodie ED Jr (1971) The taxonomic status of therough-skinned newt, Taricha granulosa (Skilton), in the RockyMountains. Herpetologica, 27, 260–270.
Nussbaum RA, Brodie ED, Storm RM (1983) Amphibians and Reptilesof the Pacific Northwest. University Press of Idaho, Moscow, ID.
Posada D, Crandall KA (1998) Modeltest: testing the model ofDNA substitution. Bioinformatics, 14, 817–818.
de Quieroz K, Good DA (1997) Phenetic clustering in biology: acritique. Quarterly Review of Biology, 72, 3–30.
Riemer WJ (1958) Variation and systematic relationships withinthe salamander genus Taricha. University Of California Publica-tions in Zoology,56, 301–390.
Rogers JS (1972) Measures of genetic similarity and genetic dis-tance. Studies in Genetics VII. University of Texas Publication7213, Austen, TX.
Ruedi M, Smith MF, Patton JL (1997) Phylogenetic evidence ofmitochondrial DNA introgression among pocket gophers inNew Mexico (family Geomyidae). Molecular Ecology, 6, 453–462.
Selander RK, Smith MH, Yang SY, Johnson WE, Gentry JR (1971)Biochemical polymorphism and systematics in the genus Pero-myscus. I. Variation in the old-field mouse (Peromyscus polionotus).Studies in Genetics VI. University of Texas Publication, 7103, 49–90.
Shacklee JB, Allendorf FW, Morizot C, Whitt GS (1990) Geneticnomenclature for protein-coding loci in fish. Transactions of theAmerican Fisheries Society, 119, 2–15.
Slatkin M (1993) Isolation by distance in equilibrium and non-equilibrium populations. Evolution, 47, 264–279.
Soltis DE, Gitzendanner MA, Strenge DD, Soltis PS (1997) Chloro-plast DNA intraspecific phylogeography of plants from thePacific Northwest of North America. Plant Systematics andEvolution, 206, 353–373.
Soltis DE, Soltis PS, Kuzoff RK, Tucker TL (1992) Geographicstructuring of chloroplast DNA genotypes in Tiarellan trifoliataSaxifragaceae. Plant Systematics and Evolution, 181, 203–216.
Swofford DL (2003) Paup*. Phylogenetic Analysis Using Parsi-mony (*and Other Methods), Version 4. Sinauer Associates,Sunderland, Massachusetts.
Tan AM, Wake DB (1995) MtDNA phylogeography of the Cali-fornia newt, Taricha torosa (Caudata, Salamandridae). MolecularPhylogenetics and Evolution, 4, 383–394.
Tilley SG (1997) Patterns of genetic differentiation in AppalachianDesmognathine salamanders. Journal of Heredity, 88, 305–315.
Tilley SG, Mahoney MJ (1996) Patterns of genetic differentiation insalamanders of the Desmognathus ochrophaeus complex (Amphibia:Plethodontidae). Herpetological Monographs, 10, 1–42.
Tilley SG, Merritt RB, Wu B, Highton R (1978) Genetic differenti-ation in salamanders of the Desmognathus ochrophaeus complex(Plethodontidae). Evolution, 32, 93–115.
Titus TA, Larson A (1995) A molecular phylogenetic perspectiveon the evolutionary radiation of the salamander family Sala-mandridae. Systematic Biology, 44, 125–151.
Turner BJ (1973) Genetic variation of mitochondrial aspartateaminotransferase in the teleost Cyprinodon nevadensis. Compara-tive Biochemical Physiology, 44B, 89–92.
Waitt RB, Thorson RM (1983) The Cordilleran ice sheet inWashington, Idaho, and Montana. In: Late-Quaternary Environ-ments of the United Sates (ed. Porter SC), pp. 53–70. University ofMinnesota Press, Minneapolis.
Wake DB, Jockusch EL (2000) Detecting species borders usingdiverse data sets: Plethodontid salamanders in California. In:The Biology of Plethodontid Salamanders (eds Bruce RC, Jaeger RG,Houck LD), pp. 95–119. Kluwer Academic/Plenum Publishers,New York.
Wake DB, Özeti N (1969) Evolutionary relationships in the familySalamandridae. Copeia, 1969, 124–137.
Wake DB, Yanev KP (1986) Geographic variation in allozymesin a ‘ring species’, the plethodontid salamander Ensatinaeschscholtzii of western North America. Evolution, 40, 702–715.
Whitlock C (1992) Vegetational and climatic history of the PacificNorthwest during the last 20,000 years: implications for under-standing present-day biodiversity. The Northwest EnvironmentalJournal, 8, 5–28.
Wiens JJ (2000) Reconstructing phylogenies from allozyme data:comparing method performance with congruence. Biology Jour-nal of the Linnaean Society, 70, 613–632.
Wiens JJ, Servedio MR (1998) Phylogenetic analysis and intra-specific variation: performance of parsimony, likelihood, anddistance methods. Systematic Biology, 47, 228–253.
Wright S (1943) Isolation by distance. Genetics, 28, 114–138.Zamudio KR, Savage WK (2003) Historical isolation, range expansion,
and secondary contact of two highly divergent mitochondriallineages in spotted salamanders (Ambystoma maculatum). Evolution,57, 1631–1652.
Dr Shawn R. Kuchta and Dr An-Ming Tan both received their PhDfrom the Museum of Vertebrate Zoology, Department of Inte-grative Biology, University of California, Berkeley. Dr Kuchta iscurrently a postdoctoral researcher with Dr Barry Sinervo at theUniversity of California Santa Cruz, where he is conductingstudies on adaptive diversification in the Ensatina salamander‘ring species’ complex. His research interests are in herpetology,phylogeography, and the interface of ecology and evolution. DrTan works at the University of Hawaii. His research interests arein phylogenetics, molecular systematics, and herpetology.

242S
. R. K
UC
HT
A and
A.-M
. TA
N
© 2004 Blackw
ell Publishing Ltd, Molecular Ecology, 14, 225–244
Appendix
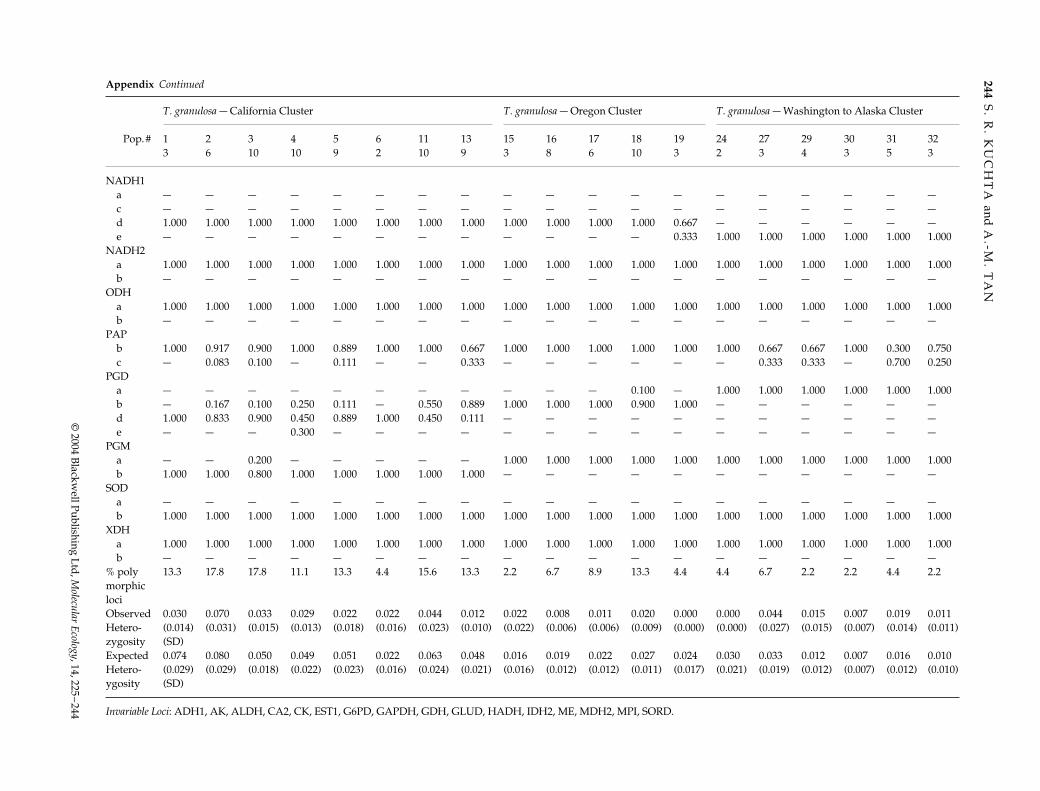
Allozyme allele frequencies in populations of Taricha granulosa. Clusters refer to the results of the multidimensional scaling analysis (Fig. 2).
Pop. # (n)
T. granulosa — California Cluster T. granulosa — Oregon Cluster T. granulosa — Washington to Alaska Cluster
13
26
310
410
59
62
1110
139
153
168
176
1810
193
242
273
294
303
315
323
AAT1c 1.000 1.000 1.000 1.000 1.000 1.000 0.800 1.000 1.000 1.000 1.000 1.000 1.000 1.000 1.000 1.000 1.000 0.875 1.000d — — — — — — 0.200 — — — — — — — — — — 0.125 —
AAT2a 0.500 1.000 1.000 1.000 1.000 1.000 1.000 1.000 1.000 1.000 1.000 1.000 1.000 1.000 1.000 1.000 1.000 1.000 1.000b 0.500 — — — — — — — — — — — — — — — — — —
ACON1a — — 0.050 — — — — — — — — — — — — — — — —c 1.000 1.000 0.950 1.000 1.000 1.000 1.000 1.000 1.000 1.000 1.000 1.000 1.000 1.000 1.000 1.000 1.000 1.000 1.000
ACON2a 1.000 1.000 1.000 1.000 0.111 0.750 0.150 — — — — — — — — — — — —b — — — — 0.556 — 0.600 1.000 1.000 1.000 1.000 1.000 1.000 1.000 1.000 1.000 1.000 1.000 1.000c — — — — 0.333 0.250 0.250 — — — — — — — — — — — —
ADA1a 0.833 0.583 1.000 1.000 1.000 1.000 0.150 0.556 0.500 0.375 — 0.100 — 1.000 0.833 1.000 1.000 1.000 1.000b — — — — — — 0.700 0.444 0.167 — — — — — — — — — —c 0.167 0.417 — — — — 0.150 — 0.333 0.625 1.000 0.900 1.000 — 0.167 — — — —
ADA2b — 0.083 — — 0.056 — — — — — — — — — 0.500 — — — —c — — — — — — — — — — — — 0.667 0.500 — — — — —d 1.000 0.917 1.000 1.000 0.944 1.000 1.000 1.000 1.000 1.000 1.000 1.000 0.333 0.500 0.500 1.000 1.000 1.000 1.000
ADH2a 1.000 1.000 1.000 1.000 1.000 1.000 1.000 1.000 1.000 1.000 1.000 1.000 1.000 1.000 1.000 1.000 1.000 1.000 1.000b — — — — — — — — — — — — — — — — — — —
ALDOa 1.000 1.000 1.000 1.000 1.000 1.000 1.000 1.000 1.000 1.000 1.000 1.000 1.000 — 1.000 1.000 1.000 1.000 1.000b — — — — — — — — — — — — — 1.000 — — — — —c — — — — — — — — — — — — — — — — — — —
CA1a — — — — — — — — — — — — 1.000 1.000 1.000 1.000 1.000 1.000 1.000b — — 1.000 1.000 1.000 1.000 1.000 1.000 1.000 1.000 1.000 1.000 — — — — — — —c 1.000 1.000 — — — — — — — — — — — — — — — — —
EST2a 1.000 1.000 1.000 1.000 1.000 1.000 1.000 1.000 1.000 1.000 1.000 1.000 1.000 1.000 1.000 1.000 1.000 1.000 1.000b — — — — — — — — — — — — — — — — — — —

PH
YL
OG
EO
GR
AP
HY
OF
TH
E R
OU
GH
-SK
INN
ED
NE
WT
243
© 2004 B
lackwell Publishing Ltd, M
olecular Ecology, 14, 225–244
ESTDa 1.000 1.000 0.700 1.000 1.000 1.000 1.000 1.000 1.000 1.000 1.000 1.000 1.000 1.000 1.000 1.000 1.000 1.000 1.000b — — 0.300 — — — — — — — — — — — — — — — —
G3PHDa — — — — — — — — — — — — — 1.000 1.000 1.000 0.833 1.000 1.000b 1.000 1.000 1.000 1.000 1.000 1.000 1.000 1.000 1.000 1.000 1.000 1.000 1.000 — — — 0.167 — —
GDAa 1.000 1.000 1.000 1.000 1.000 1.000 0.900 1.000 1.000 — — — — — — — — — —b — — — — — — 0.100 — — 1.000 1.000 1.000 1.000 1.000 1.000 1.000 1.000 1.000 1.000
GPIa 1.000 1.000 1.000 1.000 1.000 1.000 1.000 1.000 1.000 1.000 1.000 1.000 1.000 1.000 1.000 1.000 1.000 1.000 1.000b — — — — — — — — — — — — — — — — — — —
IDH1a 0.167 0.250 0.100 — — — — — — — 0.083 0.050 — — — — — — —b 0.333 0.500 0.900 0.650 0.389 — — 0.056 1.000 1.000 0.917 0.950 1.000 1.000 1.000 1.000 1.000 1.000 1.000c 0.500 0.250 — 0.350 0.611 1.000 1.000 0.944 — — — — — — — — — — —
LA1a 1.000 1.000 1.000 1.000 1.000 1.000 1.000 1.000 1.000 1.000 1.000 1.000 1.000 1.000 1.000 1.000 1.000 1.000 1.000c — — — — — — — — — — — — — — — — — — —
LA2a 1.000 1.000 0.450 0.900 1.000 1.000 1.000 1.000 1.000 1.000 1.000 1.000 1.000 1.000 1.000 1.000 1.000 1.000 1.000b — — 0.550 0.100 — — — — — — — — — — — — — — —
LDH1a 0.667 1.000 1.000 1.000 1.000 1.000 1.000 1.000 1.000 1.000 1.000 1.000 1.000 1.000 1.000 1.000 1.000 1.000 1.000b 0.333 — — — — — — — — — — — — — — — — — —
LDH2a — — — — — — — — 1.000 0.125 0.333 0.200 1.000 0.500 — — — — —b 0.333 0.667 1.000 1.000 1.000 1.000 1.000 1.000 — 0.875 0.667 0.800 — 0.500 1.000 1.000 1.000 1.000 1.000c 0.667 0.333 — — — — — — — — — — — — — — — — —
LGGb — 0.167 — 0.200 — — — — — — — — — — — — — — —c 1.000 0.583 1.000 0.800 1.000 1.000 0.900 0.889 1.000 1.000 0.917 0.900 1.000 1.000 1.000 1.000 1.000 1.000 1.000d — 0.250 — — — — 0.100 0.111 — — 0.083 0.100 — — — — — — —
MDH1a 0.500 0.500 0.850 0.400 0.500 0.750 0.400 0.555 — 0.063 0.083 0.100 — — — — — — —c — 0.167 0.050 — 0.278 — — 0.167 — — — — — — — — — — —d 0.500 0.333 0.100 0.600 0.222 0.250 0.600 0.278 1.000 0.938 0.917 0.900 1.000 1.000 1.000 1.000 1.000 1.000 1.000
Pop. # (n)
T. granulosa — California Cluster T. granulosa — Oregon Cluster T. granulosa — Washington to Alaska Cluster
13
26
310
410
59
62
1110
139
153
168
176
1810
193
242
273
294
303
315
323
Appendix Continued
244S
. R. K
UC
HT
A and
A.-M
. TA
N
© 2004 Blackw
ell Publishing Ltd, Molecular Ecology, 14, 225–244
NADH1a — — — — — — — — — — — — — — — — — — —c — — — — — — — — — — — — — — — — — — —d 1.000 1.000 1.000 1.000 1.000 1.000 1.000 1.000 1.000 1.000 1.000 1.000 0.667 — — — — — —e — — — — — — — — — — — — 0.333 1.000 1.000 1.000 1.000 1.000 1.000
NADH2a 1.000 1.000 1.000 1.000 1.000 1.000 1.000 1.000 1.000 1.000 1.000 1.000 1.000 1.000 1.000 1.000 1.000 1.000 1.000b — — — — — — — — — — — — — — — — — — —
ODHa 1.000 1.000 1.000 1.000 1.000 1.000 1.000 1.000 1.000 1.000 1.000 1.000 1.000 1.000 1.000 1.000 1.000 1.000 1.000b — — — — — — — — — — — — — — — — — — —
PAPb 1.000 0.917 0.900 1.000 0.889 1.000 1.000 0.667 1.000 1.000 1.000 1.000 1.000 1.000 0.667 0.667 1.000 0.300 0.750c — 0.083 0.100 — 0.111 — — 0.333 — — — — — — 0.333 0.333 — 0.700 0.250
PGDa — — — — — — — — — — — 0.100 — 1.000 1.000 1.000 1.000 1.000 1.000b — 0.167 0.100 0.250 0.111 — 0.550 0.889 1.000 1.000 1.000 0.900 1.000 — — — — — —d 1.000 0.833 0.900 0.450 0.889 1.000 0.450 0.111 — — — — — — — — — — —e — — — 0.300 — — — — — — — — — — — — — — —
PGMa — — 0.200 — — — — — 1.000 1.000 1.000 1.000 1.000 1.000 1.000 1.000 1.000 1.000 1.000b 1.000 1.000 0.800 1.000 1.000 1.000 1.000 1.000 — — — — — — — — — — —
SODa — — — — — — — — — — — — — — — — — — —b 1.000 1.000 1.000 1.000 1.000 1.000 1.000 1.000 1.000 1.000 1.000 1.000 1.000 1.000 1.000 1.000 1.000 1.000 1.000
XDHa 1.000 1.000 1.000 1.000 1.000 1.000 1.000 1.000 1.000 1.000 1.000 1.000 1.000 1.000 1.000 1.000 1.000 1.000 1.000b — — — — — — — — — — — — — — — — — — —
% poly 13.3 17.8 17.8 11.1 13.3 4.4 15.6 13.3 2.2 6.7 8.9 13.3 4.4 4.4 6.7 2.2 2.2 4.4 2.2morphiclociObserved 0.030 0.070 0.033 0.029 0.022 0.022 0.044 0.012 0.022 0.008 0.011 0.020 0.000 0.000 0.044 0.015 0.007 0.019 0.011Hetero-zygosity
(0.014) (0.031) (0.015) (0.013) (0.018) (0.016) (0.023) (0.010) (0.022) (0.006) (0.006) (0.009) (0.000) (0.000) (0.027) (0.015) (0.007) (0.014) (0.011)(SD)
Expected 0.074 0.080 0.050 0.049 0.051 0.022 0.063 0.048 0.016 0.019 0.022 0.027 0.024 0.030 0.033 0.012 0.007 0.016 0.010Hetero-ygosity
(0.029) (0.029) (0.018) (0.022) (0.023) (0.016) (0.024) (0.021) (0.016) (0.012) (0.012) (0.011) (0.017) (0.021) (0.019) (0.012) (0.007) (0.012) (0.010)(SD)
Invariable Loci: ADH1, AK, ALDH, CA2, CK, EST1, G6PD, GAPDH, GDH, GLUD, HADH, IDH2, ME, MDH2, MPI, SORD.
Pop. # (n)
T. granulosa — California Cluster T. granulosa — Oregon Cluster T. granulosa — Washington to Alaska Cluster
13
26
310
410
59
62
1110
139
153
168
176
1810
193
242
273
294
303
315
323
Appendix Continued