isolation and analysis of antibiotic compounds from … · isolation and analysis of antibiotic...
TRANSCRIPT

Isolation and Analysis of Antibiotic Compounds from Soil Microbes
A Major Qualifying Project Report:
Submitted to the Faculty
Of the
WORCESTER POLYTECHNIC INSTITUTE
In partial fulfillment of the requirements for the
Degree of Bachelor of Science
In
Biology and Biotechnology
and
Chemistry and Biochemistry
by
Matthew Googins (BBT), Colin Harrington (BBT), and Parsant Jotikasthira (CBC)
Date: 4/25/2017
Project Advisor
Prof. Michael A. Buckholt (BBT)

1
Table of Contents
Acknowledgements ..................................................................................................................... 3
Abstract ....................................................................................................................................... 4
1. Background ............................................................................................................................. 5
1.1 The Problem ...................................................................................................................... 5
1.2 Antibiotics ......................................................................................................................... 6
1.3 Antibiotic Classes .............................................................................................................. 6
1.3.1 Beta Lactams .............................................................................................................. 7
1.3.2 Aminoglycosides ........................................................................................................ 7
1.3.3 Glycopeptides ............................................................................................................. 8
1.3.4 Tetracyclines ............................................................................................................... 9
1.3.5 Macrolides ................................................................................................................ 11
1.3.6 Lipopeptides ............................................................................................................. 12
1.3.7 Chloramphenicols ..................................................................................................... 13
1.3.8 Ansamycins .............................................................................................................. 14
1.3.9 Teixobactin ............................................................................................................... 15
1.4 Project Outline................................................................................................................. 16
2. Methods................................................................................................................................. 17
2.1 Screening Microbes to Molecules Freezer Isolates for Antibiotic Activity .................... 17
2.2 Determining the Identity of the Isolates .......................................................................... 18
2.2.1 Metabolic Assays ...................................................................................................... 18
2.2.2 PCR ........................................................................................................................... 18
2.2.3 Gram Staining ........................................................................................................... 20
2.2.4 Gel Electrophoresis................................................................................................... 20
2.3 Extraction of Secondary Metabolites .............................................................................. 21
2.3.2 Alternate Media Extractions ..................................................................................... 22
2.4 Chemical Analysis of Extracts ........................................................................................ 22
2.4.2 HPLC of Antibiotic Standards .................................................................................. 23
3. Results ................................................................................................................................... 24
3.1 Initial Antibiotic Production Screening........................................................................... 24
3.2 Organic Extraction of Isolate Cultures ............................................................................ 26
2
3.3 General PCR Results ....................................................................................................... 28
3.4 Isolate 15-6 ...................................................................................................................... 28
3.4.1 15-6 Metabolic Assays ............................................................................................. 29
3.4.2 15-6 PCR results ....................................................................................................... 31
3.4.3 15-6 Growth and antibiotic production on various solid media ............................... 35
3.5 Isolate 14-29 .................................................................................................................... 39
3.5.1 14-29 Metabolic assays ............................................................................................ 40
3.5.2 14-29 PCR results ..................................................................................................... 41
3.6 LB Media Extracts HPLC Results of Samples 15-6, 14-29, and Solvents ..................... 47
3.6.2 Antibiotic Standards HPLC Results ......................................................................... 52
4. Discussion ............................................................................................................................. 56
References ................................................................................................................................. 64
Appendix I: Microbes to Molecules Freezer Stock Isolates ..................................................... 70
Appendix II: Indole Assay Procedure ....................................................................................... 74
3
Acknowledgements
We would like to acknowledge the following individuals for their assistance with this
project, firstly our project advisor Professor Michael A. Buckholt for his constant support and
guidance throughout the duration of the project. We would also like to thank Professor JoAnn
Whitefleet-Smith for her help in using the lyophilizer in Goddard and Andrew Butler for
providing us with information regarding mass spectroscopy and NMR protocols.

4
Abstract
The growing number of antibiotic resistant strains of bacteria is a serious issue that must be
addressed. New antibiotics need to be found to prevent a global epidemic. Soil bacteria
isolates from the Microbes to Molecules (BB2905) course were identified and their products
were purified and analyzed. We developed an identification pipeline for antibiotic discovery
to proceed from the BB2905 course. The process for creating the pipeline resulted in the
optimization of 16s ribosomal subunit PCR protocols. This allowed for the identification of
samples 15-6 and 14-29 to be of the Streptomyces and Brevibacillus genus, respectively. The
pipeline was then utilized to extract and analyze of antibiotic extracts from samples 15-6 and
14-29. The antibacterial products of 15-6 and 14-29 were isolated and purified into fractions
using HPLC. The final characterization of said samples was not accomplished due to the
characterization methods, nuclear magnetic resonance (NMR) and mass spectroscopy,
requiring larger sample masses than what were feasibly obtained. Future experimentation
should focus on further optimization of growth techniques for the isolated species and
chemical analysis methods to further characterize the antibiotic compounds.

5
1. Background
1.1 The Problem
The growing number of antibiotic resistant strains of bacteria is a serious issue that
must be addressed. Diseases that were once easily treatable are now becoming harder to treat
making them more dangerous. According to the Centers for Disease Control and Prevention
(CDC) at least two million people become infected with antibiotic resistant strains of bacteria
in the United States every year (CDC, 2016). This is because the current arsenal of effective
antibiotics used for treating bacterial infections is shrinking due to bacterial resistance.
Biologists need to find new antibiotics to combat this threat and prevent a global epidemic. In
response to the looming crisis, crowdsourcing efforts such as the Small World Initiative are
attempting to help combat the threat of antibiotic resistant bacteria.
The Small World Initiative is a project started at Yale University in 2012 that aims to
discover new, potentially useful, antibiotics from soil microbes by crowdsourcing the
discovery process. The Initiative is currently made up of 150 institutions across the world,
including Worcester Polytechnic Institute (WPI) (Small World Initiative, 2015). The
institutions involved in the Small World Initiative contribute to the effort by having students
collect soil samples, grow microbes from the soil sample, and screen these microbes for
antibiotic production. The data obtained from this, such as the location from which the sample
was taken and the probable species or genus of the “antibiotic” producing bacteria, is
uploaded into the Small World Initiative’s database on their website (Small World Initiative,
2015).
WPI is currently a part of this initiative with the course Microbes to Molecules
(BB2905). This course has students collect their own soil sample and attempt to isolate
antibiotic producing bacteria. However, further analysis of these bacteria and their potential
antibiotic products is still required. This analysis includes detailed characterization of the
bacteria, finding the best conditions to grow the bacteria, and characterizing the antibiotic
compounds produced by the bacteria. The goal of this project is to complete this work and
develop more optimum procedures for future Microbes and Molecules courses and future
projects working with soil bacteria and antibiotic isolation.

6
1.2 Antibiotics
Antibiotics are compounds that are able to kill or stop the growth of bacteria.
Alexander Fleming discovered the first antibiotic, Penicillin, in 1928 (ACS and RSC, 1999).
Antibiotics continued to be discovered frequently until the early 1980s, when economic
pressure within the pharmaceutical community shifted the focus of research towards on other
drugs (Spellberg and Gilbert, 2014). This shift in the pharmaceutical industry resulted in a
diminished pipeline of new antibiotics into the clinical setting.
Currently, researchers are uncertain of the exact function of antibiotics in nature, but
there are two competing theories. The first is that antibiotics are used as a defensive
mechanism by organisms against other microbes within the same ecosystem. The other, is that
antibiotics may actually be bacterial signaling molecules (Clardy et al, 2009;Yim et al, 2007).
Soil bacteria represent the largest source of already discovered antibiotic compounds
(Handelsman et al, 1998). Despite this, soil microbes remain largely uncharacterized. It is
estimated that there are 103 to 10
7 in any given soil sample (Fierer et al, 2007). However, it is
only possible to cultivate a fraction of these bacteria, using standard culturing techniques
(Delong and Pace, 2001). The continued exploration of the largely unexplored soil
environment could yield a multitude of novel medicinal compounds.
A recent publication illustrating the continued potential of novel antibiotic discovery
from soil was the discovery of teixobactin by Ling et.al at Northeastern University in 2015.
This process involved using a device called an iChip to isolate and grow soil microbes in
native conditions (Ling et al., 2015). The device involves a plastic matrix filled with solid
media with semipermeable membranes on either side. The device is then inserted into a
sample of the native soil that the bacteria came from (Ling et al., 2015). Using the iChip, the
group at Northeastern University was able to isolate an antibiotic producing organism called
Eleftheria terrae which produced the novel antibiotic teixobactin. This story demonstrates the
continued importance of the relatively unexplored soil ecosystem for finding novel medicinal
compounds. For more information on Teixobactin see section 1.3.9 below.
1.3 Antibiotic Classes
Antibiotics can be broken down into many structural classes. Each class has its own
unique chemical properties that distinguishes it from other classes. We have included
7
information on the most common classes below.
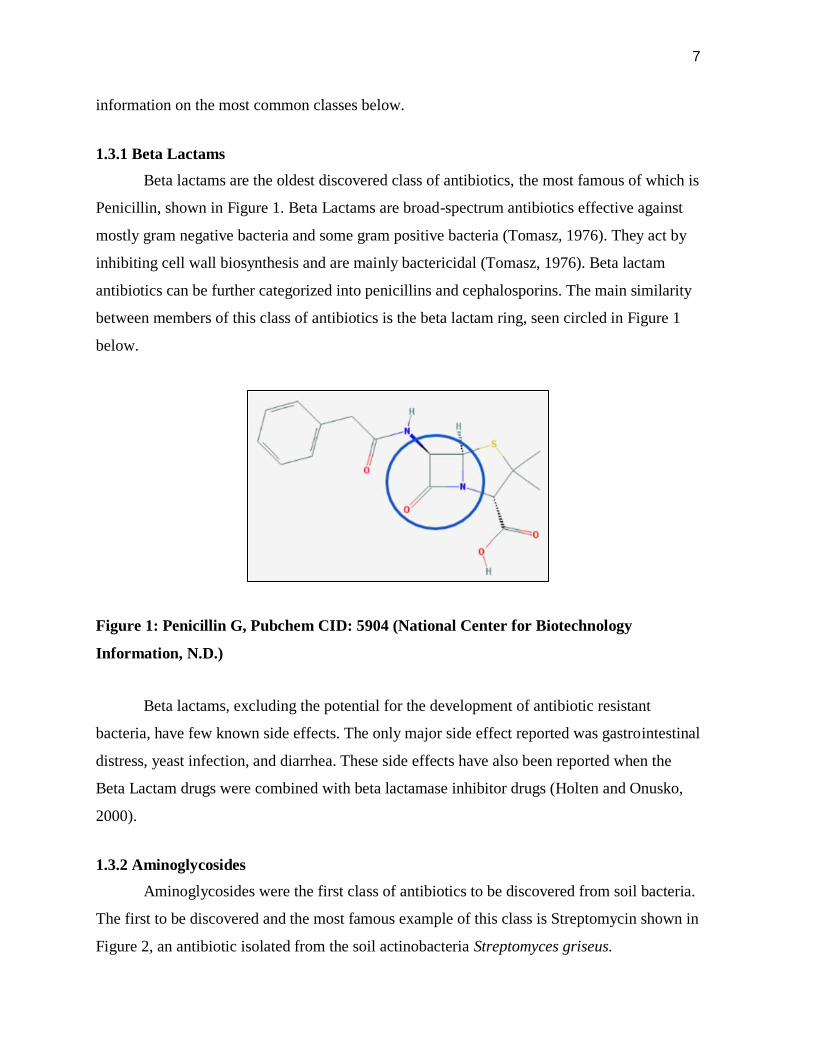
1.3.1 Beta Lactams
Beta lactams are the oldest discovered class of antibiotics, the most famous of which is
Penicillin, shown in Figure 1. Beta Lactams are broad-spectrum antibiotics effective against
mostly gram negative bacteria and some gram positive bacteria (Tomasz, 1976). They act by
inhibiting cell wall biosynthesis and are mainly bactericidal (Tomasz, 1976). Beta lactam
antibiotics can be further categorized into penicillins and cephalosporins. The main similarity
between members of this class of antibiotics is the beta lactam ring, seen circled in Figure 1
below.
Figure 1: Penicillin G, Pubchem CID: 5904 (National Center for Biotechnology
Information, N.D.)
Beta lactams, excluding the potential for the development of antibiotic resistant
bacteria, have few known side effects. The only major side effect reported was gastrointestinal
distress, yeast infection, and diarrhea. These side effects have also been reported when the
Beta Lactam drugs were combined with beta lactamase inhibitor drugs (Holten and Onusko,
2000).
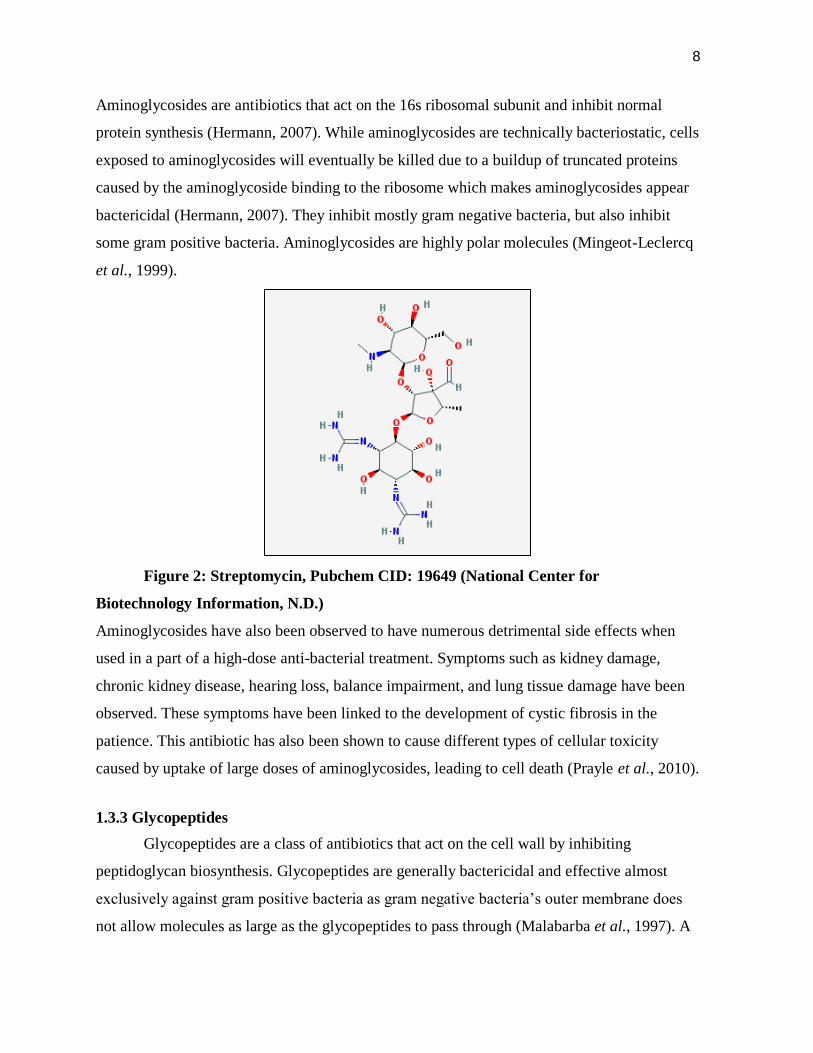
1.3.2 Aminoglycosides
Aminoglycosides were the first class of antibiotics to be discovered from soil bacteria.
The first to be discovered and the most famous example of this class is Streptomycin shown in
Figure 2, an antibiotic isolated from the soil actinobacteria Streptomyces griseus.
8
Aminoglycosides are antibiotics that act on the 16s ribosomal subunit and inhibit normal
protein synthesis (Hermann, 2007). While aminoglycosides are technically bacteriostatic, cells
exposed to aminoglycosides will eventually be killed due to a buildup of truncated proteins
caused by the aminoglycoside binding to the ribosome which makes aminoglycosides appear
bactericidal (Hermann, 2007). They inhibit mostly gram negative bacteria, but also inhibit
some gram positive bacteria. Aminoglycosides are highly polar molecules (Mingeot-Leclercq
et al., 1999).
Figure 2: Streptomycin, Pubchem CID: 19649 (National Center for
Biotechnology Information, N.D.)
Aminoglycosides have also been observed to have numerous detrimental side effects when
used in a part of a high-dose anti-bacterial treatment. Symptoms such as kidney damage,
chronic kidney disease, hearing loss, balance impairment, and lung tissue damage have been
observed. These symptoms have been linked to the development of cystic fibrosis in the
patience. This antibiotic has also been shown to cause different types of cellular toxicity
caused by uptake of large doses of aminoglycosides, leading to cell death (Prayle et al., 2010).
1.3.3 Glycopeptides
Glycopeptides are a class of antibiotics that act on the cell wall by inhibiting
peptidoglycan biosynthesis. Glycopeptides are generally bactericidal and effective almost
exclusively against gram positive bacteria as gram negative bacteria’s outer membrane does
not allow molecules as large as the glycopeptides to pass through (Malabarba et al., 1997). A

9
notable example of a glycopeptide antibiotic is Vancomycin, shown in Figure 3. The basic
structure of glycopeptides is a cyclic non-ribosomal peptide with sugars attached on the
periphery of the cycle (National Center for Biotechnology Information, N.D.) (See Figure 3).
Figure 3: Vancomycin Pubchem CID: 14969 (National Center for Biotechnology
Information, N.D.)
Glycopeptide antibiotics have side effects similar to aminoglycosides. Intravenous
administration of glycopeptides have been observed to cause histamine based effects such as
hypertensions and in a rare case, cardiac arrest. Other symptoms include renal damage, skin
rashes, and inner ear damage caused by ototoxicity. The cause of these effects and tissue
toxicities have been linked to impurities found when the antibiotic is isolated. Modern
methods of isolating glycopeptides have increased the purities of samples and reduced the
severity of many of the side effects (Finch and Eliopoulus, 2005).
1.3.4 Tetracyclines
Tetracyclines are another class of antibiotic that commonly used in modern medicine.
Tetracyclines are formed from a linear fusion of a tetracyclic nucleus, shown in Figure 4, with
different groups attached (Chopra and Roberts, 2001). This class of antibiotics has been
shown to function as a bacteriostatic compound that is effective against Gram positive, Gram
negative, and preventative against certain parasites. In bacteria, tetracyclines function by
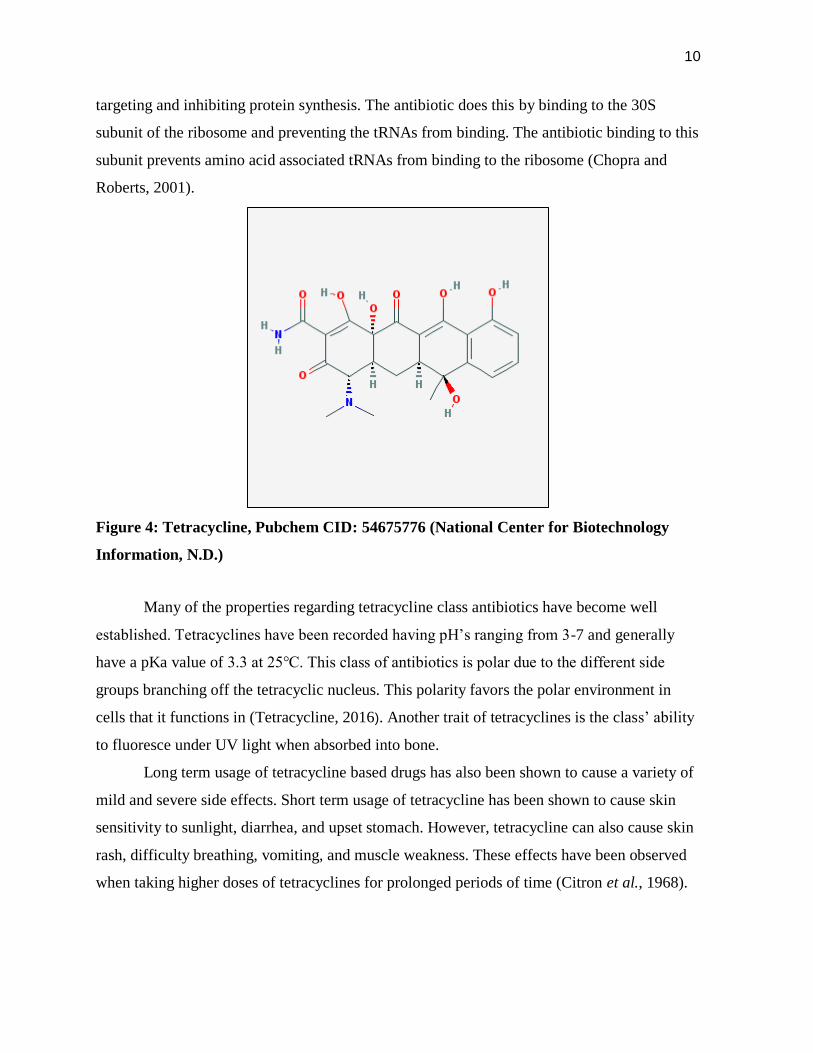
10
targeting and inhibiting protein synthesis. The antibiotic does this by binding to the 30S
subunit of the ribosome and preventing the tRNAs from binding. The antibiotic binding to this
subunit prevents amino acid associated tRNAs from binding to the ribosome (Chopra and
Roberts, 2001).
Figure 4: Tetracycline, Pubchem CID: 54675776 (National Center for Biotechnology
Information, N.D.)
Many of the properties regarding tetracycline class antibiotics have become well
established. Tetracyclines have been recorded having pH’s ranging from 3-7 and generally
have a pKa value of 3.3 at 25℃. This class of antibiotics is polar due to the different side
groups branching off the tetracyclic nucleus. This polarity favors the polar environment in
cells that it functions in (Tetracycline, 2016). Another trait of tetracyclines is the class’ ability
to fluoresce under UV light when absorbed into bone.
Long term usage of tetracycline based drugs has also been shown to cause a variety of
mild and severe side effects. Short term usage of tetracycline has been shown to cause skin
sensitivity to sunlight, diarrhea, and upset stomach. However, tetracycline can also cause skin
rash, difficulty breathing, vomiting, and muscle weakness. These effects have been observed
when taking higher doses of tetracyclines for prolonged periods of time (Citron et al., 1968).

11
1.3.5 Macrolides
Macrolides are a large class of antibiotics produced by bacteria and fungi alike.
Macrolides are generally made from a lactonic ring of 12 to 22 carbon atoms with different
side groups, shown in Figure 5. Generally, macrolides have been shown to be effective against
Gram positive strains of bacteria, but have also been shown to function against Gram negative
bacteria (Hof, 1994). Macrolides function as bacteriostatic antibiotics, though bactericidal
activity has been observed in in vitro experiments (Pankey and Sabath, 2004). These
antibiotics function by targeting the 50S unit of the ribosome. By targeting this part of the
ribosome, macrolides inhibit protein synthesis.
Figure 5: Erythromycin, Pubchem CID: 12560 (National Center for Biotechnology
Information, N.D.)
The properties of macrolide class antibiotics have been determined due to their general
structure. Macrolides are polar, due to the numerous polar side groups on the main carbon ring
structure. These antibiotics have their highest activity at pHs of 7.8 to 8 (Macrolides, 2016)
Similarly to other classes of antibiotics, macrolides have been observed to cause
adverse effects on patients. The milder observed side effects are abdominal pain, diarrhea, and
nausea. However, macrolides have been shown to cause, on rare occasions, pancreatitis, acute
hepatitis, and reversible ototoxicity (Cunha, 2001).

12
1.3.6 Lipopeptides
Lipopeptides are a class of antibiotics they are made of a cyclic peptide and a long
hydrocarbon tail. Lipopeptides act by making the plasma membrane permeable to ions, which
causes cell lysis (Yu et al., 2015;Steenbergen et al., 2005). They are generally bactericidal
(Yu et al., 2015;Steenbergen et al., 2005). Daptomycin is almost exclusively effective against
gram positive bacteria, while the polymyxins are mostly effective against gram negative
bacteria (Yu et al., 2015;Steenbergen et al., 2005). Daptomycin and the polymyxins were
listed in the same class as they are structurally similar in that they are made from both lipid
and peptide components and mechanistically similar, in that they both depolarize the
membrane and cause cell lysis. Despite their similarities however, they are effective against
very different bacteria in that polymyxins are effective against a narrow spectrum of gram
negative bacteria and daptomycin is effective against most gram positive bacteria (Yu et al.,
2015;Steenbergen et al., 2005).
Figure 6: Polymyxin B, Pubchem CID: 49800004 (National Center for Biotechnology
Information, N.D.)
The majority of lipopeptide based drugs have been shown to cause few mild unwanted
effects on patients. Those that have been observed to cause adverse effects have only occurred
in 2% of patients in pre-clinical trials. The known side effects of lipopeptide drugs are nausea,

13
constipation, headache, rash, and skin reactions at injection site (Steenbergen et al., 2005).
Daptomycin is another example of a lipopeptide antibiotic. Daptomycin is a natural
product of the soil bacterium Streptomyces roseosporus. This drug is used for treatments of
complicated skin infections by gram-positive bacteria. High dosage of this drug can cause
effects on skeletal muscle, including myalgia and myositis (Eisenstein et al., 2010) . The
bacteria was discovered by scientists at Eli Lilly from a soil sample from Mount Ararat in
Turkey during the late 1980s, and later developed by Cubist Pharmaceuticals (Eisenstein et
al., 2010). The structure of daptomycin is shown in Figure 7.
Figure 7: Daptomycin, Pubchem CID: 16129629 (National Center for Biotechnology
Information, N.D.)
1.3.7 Chloramphenicols
Chloramphenicols are one of the more simplistic antibiotics in regards to its structure
the 2,2-dichloro-N-[(1R,2R)-1,3-dihydroxy-1-(4-nitrophenyl)propan-2-yl]acetamide shown in
Figure 8, differs from most antibiotics due to the two chloride atoms (National Center for
Biotechnology Information, N.D.). The only other antibiotic to have chloride atoms is
vancomycin. Chloramphenicol has been shown to target both Gram positive and Gram
negative bacteria. Generally, chloramphenicol acts as a bacteriostatic antibiotic. However, it
has shown bactericidal activity against certain strains of bacteria similarly to macrolides,
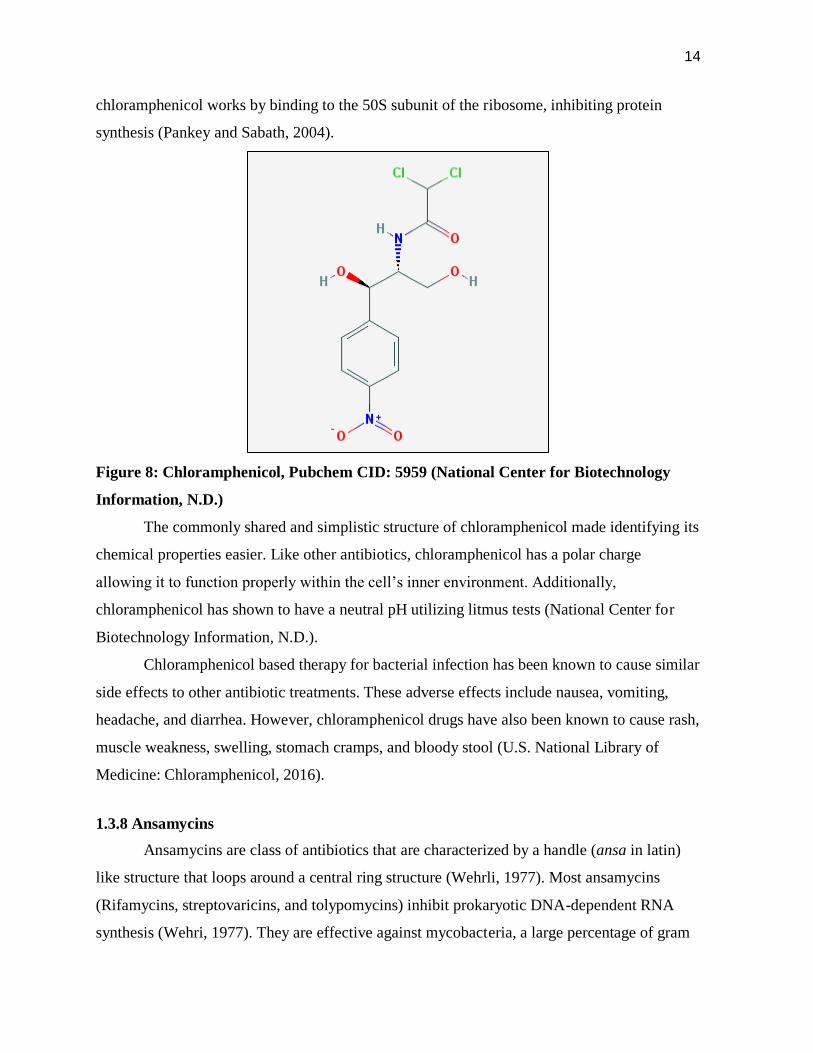
14
chloramphenicol works by binding to the 50S subunit of the ribosome, inhibiting protein
synthesis (Pankey and Sabath, 2004).
Figure 8: Chloramphenicol, Pubchem CID: 5959 (National Center for Biotechnology
Information, N.D.)
The commonly shared and simplistic structure of chloramphenicol made identifying its
chemical properties easier. Like other antibiotics, chloramphenicol has a polar charge
allowing it to function properly within the cell’s inner environment. Additionally,
chloramphenicol has shown to have a neutral pH utilizing litmus tests (National Center for
Biotechnology Information, N.D.).
Chloramphenicol based therapy for bacterial infection has been known to cause similar
side effects to other antibiotic treatments. These adverse effects include nausea, vomiting,
headache, and diarrhea. However, chloramphenicol drugs have also been known to cause rash,
muscle weakness, swelling, stomach cramps, and bloody stool (U.S. National Library of
Medicine: Chloramphenicol, 2016).
1.3.8 Ansamycins
Ansamycins are class of antibiotics that are characterized by a handle (ansa in latin)
like structure that loops around a central ring structure (Wehrli, 1977). Most ansamycins
(Rifamycins, streptovaricins, and tolypomycins) inhibit prokaryotic DNA-dependent RNA
synthesis (Wehri, 1977). They are effective against mycobacteria, a large percentage of gram

15
positive bacteria, and some gram negative bacteria (Floss and Yu, 2005). They act on bacteria
in a bacteriostatic way. Rifamycin is a naturally occurring example of this class (See Figure
9).
Figure 9: Rifamycin SV, Pubchem CID: 6324616 (National Center for Biotechnology
Information, N.D.)
Ansamycins based drugs have been observed to have few known negative side effects.
These adverse effects include rash, blisters, loss of coordination, and other common side
effects shared among most antibiotics such as nausea and diahrrea (U.S. National Library of
Medicine: Rifampin, 2016).
1.3.9 Teixobactin
Teixobactin acts by inhibiting cell wall synthesis by binding to a precursor of
peptidoglycan (Lipid II) and a precursor of teichoic acid, both of which are necessary to
construct the cell wall (Ling et al., 2015). Teixobactin does not belong to an already
established class of antibiotics and instead is the first member of a new class of antibiotics that
bind to the Lipid II peptidoglycan precursor (Ling et al., 2015). A structure of teixobactin is
shown in Figure 10 below.

16
Figure 10: Teixobactin, Pubchem CID: 86341926 (National Center for Biotechnology
Information, N.D.)
1.4 Project Outline
The focus of this project was on two main topics: Soil bacteria and the antibiotics they
produce. For the soil bacteria, optimum methods for the culturing, maintenance, and analysis
of isolated samples were investigated. These protocols were established concurrently with the
antibiotic based research. This research focused on determining which isolated soil bacteria
produce antimicrobial molecules as secondary metabolites. The conditions for them to
produce their secondary metabolites (potential antibiotics) from these selected samples were
established. Then, techniques for properly isolating these metabolites were determined. Once
isolated the characterization of these metabolites was attempted using different analytical
techniques where possible to determine if it belongs to a known class of antibiotics. All
techniques and protocols can then be used by the Microbes and Molecules course to further
this type of research. The project is outlined visually in Figure 11.

17
Figure 11: Project Overview Flowchart
2. Methods
2.1 Screening Microbes to Molecules Freezer Isolates for Antibiotic Activity
All isolates from previously run Microbes to Molecules courses (2014, 2015, and
2016) were streaked from freezer stocks onto Luria-Bertini (LB) agar and allowed to incubate
at room temperature for 72 hours. For a complete list of isolates see Appendix I.
The isolates were screened for antibiotic production using a top agar method which
was adapted from the top agar method present in the Small World Initiative research protocols
document (Hernandez et al., 2015). The isolates were transferred from the freezer stocks to
the LB plates using a sterilized inoculation loop. The isolates were plated clockwise in
numbered order (See Appendix I for full list of isolates plated and their corresponding ID
numbers) in a circular pattern around the plate. Each year of isolates were plated on separate
plates in order to minimize the risk of confusion. A 3 mL liquid culture was made for E. coli
(ATCC 11795) and B. Subtilis and allowed to incubate at 37 degrees Celsius for 24 hours. The

18
top agar itself was made of 50% agar LB. 1 mL of the liquid culture of each species were
added to separate 4 ml aliquots of the top agar. Each aliquot was poured onto a single plate of
small world samples. Antibiotic activity of the isolates was indicated by zones of inhibition of
the species tested against. Figure 12 represents an example of a zone of inhibition for the top
agar method. .
Figure 12: Example of a Zone of Inhibition
2.2 Determining the Identity of the Isolates
Before continuing work with the isolates in liquid culture, the identity of the isolates
was determined. The identities of the bacterial isolates were determined through both PCR,
metabolic assays, and Gram staining.
2.2.1 Metabolic Assays
In order to help characterize the bacterial isolates, a variety of metabolic assays were
performed. These assays include the indole assay (Appendix II), the glucose fermentation
assay (Power and Johnson, 2009), the lactose fermentation assay (Power and Johnson, 2009),
the MacConkey agar assay (Hernandez et al., 2015), and the amylase assay (Buckholt, 2014).
In both the glucose and lactose fermentation assays, a yellow colored result means
ferments with acid, while bubbles indicated gas production due to fermentation of the
carbohydrate (Power and Johnson, 2009).
2.2.2 PCR
PCR was utilized to better identify the provided soil bacteria samples. Two different
sets of primers were used for the 16s ribosomal subunit amplification (27F and 1492R, 8F and

19
1391R, ordered from Integrated DNA technologies). The mix used for all PCR samples was
10 uL Deionized water, 1.3 uL of 10 uM of the first primer, 1.3 uL of 10 uM of the second
primer, and 12.5 uL of 12.5 uM of New England Biolabs 2x Q5 Master Mix. This procedure
was later redone using OneTaq 2x PCR Mix. The PCR protocols differed only in annealing
temperature due the different primers. The general protocol was 95 degrees C for 2 minutes,
then 30 cycles of 95 for 30 seconds, 49 degrees (54 degrees for the 8F and 1391R primer
combination) for 45 seconds, 72 degrees for two minutes, followed by 72 degrees for 10
minutes, and finally held at 10 degrees.
An additional set of primers and protocols were used in an attempt to identify several
Bacillus genus microbe samples. These primers (UP-1 and UP-2r) and sequencing primers
(UP-1S and UP-2Sr) were designed to target bacterial gyrase genes. Gyrase genes were
known to be used by bacteria to power its flagella. The PCR utilized 12.5 uL of Q5 2x Master
Mix, 1.3 uL of 1 uM UP-1 primer, 1.3 uL of 1uM UP-2r primer, and 10 uL Deionized water.
The PCR protocol used was 30 cycles of 94 degrees C for 1 minute, 60 degrees C for 1
minute, and 72 degrees C for 2 minutes. The PCR products were then held at 10 degrees C
until they were removed from the PCR machine (Yamamoto and Harayama, 1995).
Primer Sequences:
16s ribosomal subunit
27F:5’-AGAGTTTGATCMTGGCTCAG-3’
1492r:5′-GGTTACCTTGTTACGACTT-3’
8F:5’-AGAGTTTGATCCTGGCTCAG-3’
1391r:5’-GACGGGCGGTGTGTRCA-3’
gyrB
UP-1:5’-
GAAGTCATCATGACCGTTCTGCA(TC)GC(TCAG)GG(TCAG)AA(AG)TT(TC)GA-3’
UP-1S:5’-GAAGTCATCATGACCGTTCTGCA-3’
UP-2r:5’-
AGCAGGGTACGGATGTGCGAGCC(AG)TC(TCAG)AC(AG)TC(TCAG)GC(AG)TC(TC
AG)GTCAT-3’
UP-2Sr:5’-AGCAGGGTACGGATGTGCGAGCC-3’
20
2.2.2.2 Gradient PCR
A gradient PCR was performed to optimize the PCR protocols for future experiments.
OneTaq Master Mix was used instead of Q5, but the rest of the mix was kept the same. PCR
for the outside primers (1442R and 27F) was performed using a gradient of annealing
temperatures from 44 to 54 degrees Celsius, placing samples at 44 degrees (5 degrees cooler),
48 degrees (normal annealing temperature), and at 54 degrees (5 degrees warmer). Standard
PCR cycle times and temperatures were kept the same. The gradient PCR for the inside
primers (8F and 1391R) using annealing temperatures from 44 to 54 degrees Celsius, placing
samples at 44 (10 degrees cooler), 48 (5 degrees cooler), and 54 degrees Celsius (normal
annealing temperature).
2.2.3 Gram Staining
Gram staining was used as a supplementary identification method to distinguish
between Gram positive and Gram negative organisms. The specific protocol used was from
the Small World Initiative manual (Hernandez et al., 2015).
2.2.4 Gel Electrophoresis
Gel electrophoresis of the PCR products was run at 90 volts to check for the correctly
sized DNA fragment. The gel was created using 60 mL of 10% agarose gel in 1x TAE buffer
and the DNA was stained using SYBR green. When using the 2x Q5 Master Mix, 0.5 uL of
10x SYBR was mixed with 5ul of the sample and 0.5 uL of loading dye. The protocol for
using OneTaq was just to add 1uL of SYBR to the sample, as OneTaq contained its own
loading dye. When it was determined that the correct product was made, the samples were
sent off to Eton Biosciences for sequencing. The sequencing was run twice for each sample
using the same primers used for PCR. When the sequences were returned from Eton
Biosciences, they were inputted into the NCBI nucleotide BLAST search (Altschul et al.,
1990) with the 16s bacterial ribosomal option selected. The likely genus and species of the
isolates was determined using the max score and the identification percent. This method
however does not identify the isolates with complete certainty, and is only accurate to the
genus level. The genus was determined due to all visible BLAST results sharing the same
genus.

21
2.3 Extraction of Secondary Metabolites
Organic extractions using both ethyl acetate and methanol were performed on solid
media cultures (grown on LB agar) of the isolates that had been frozen by placing them in the
-80oC freezer for 24 hours (Hernandez et al., 2015). Liquid nitrogen was also used to freeze
samples by placing their conical tube in the liquid until frozen. Before freezing, the solid
media cultures were removed from the petri dishes and placed in a 50 mL conical centrifuge
tube. After the freezing period 12 mL of ethyl acetate and 8 mL of water or 20 mL of
methanol were added depending on which solvent was used. The tubes were then allowed to
gently rock at 25oC for 24 hours. After 24 hours the tubes were centrifuged at 2056.32 RCF
for 15 minutes. The solvent phase was then pipetted off the top of the tube and deposited into
a glass scintillation vial. It should be noted that the methanol extractions did not have a phase
separation and therefore all liquid was pipetted off into a 50 mL tube and then centrifuged
again. The liquid was then pipetted into a glass scintillation vial. The vials were then allowed
to dry down completely by passing air over them in the fume hood and then they were
suspended in 1 mL of the original solvent. The extracts were tested by applying 10 uL of
extract on 6 mm diameter paper disks, made by using a paper hole puncher on Whatman 1mm
filter paper, letting them dry, and overlaying these disks on plates of test species such as E.
coli (ATCC 11795) and B. subtilis and allowing incubation for 24 hours. Zones of inhibition
indicated a positive result for an active antibiotic extract.
Organic extractions were also performed on liquid cultures of isolates 15-6 and 14-29.
30 mL of liquid culture was grown at 25o C for 5 days for both isolates. Ethyl acetate was
used to extract the 15-6 isolate and methanol was used to extract the 14-29 isolate. Fifty
percent of the volume of the liquid culture of solvent was added to the top of the liquid
cultures in 50 mL conical tubes. The tubes were then allowed to shake at 25o C for 24 hours.
The rest of the liquid culture extraction method matches the solid media extraction procedure
described in Hernandez et al., 2015. These extracts were tested the same way as the solid
media extracts. For the methanol extracts further filtering was required after centrifugation. A
0.2 micron test tube filter was utilizes to remove any remaining solid particles from the
extracts.

22
2.3.2 Alternate Media Extractions
The 15-6 sample was grown and extracted from a variety of media types to determine
if other media types could produce antibacterial product more efficiently. The agar media
tested were LB, Potato Dextrose Agar (PDA), Trypticase Soy Agar (TSA), Reasoner’s 2a
Agar (R2A), and Todd Hewitt Agar (THA) media. Samples from the 15-6 freezer stock were
plated on each plate and left to grow at room temperature. After three days the plates were
examined and growth documented. The plates were then left to grow for an additional two
days (totaling five days of growth at room temperature), before they were extracted. All plates
were extracted using the ethyl acetate extraction technique described in Section 2.3. All
resulting extracts were analyzed with a zone of inhibition test and then were further analyzed
and purified using techniques described in Section 2.4 to determine concentrations relative to
each other.
2.4 Chemical Analysis of Extracts
High pressure liquid chromatography (HPLC) was used as both an analytical
technique and as a separation technique for both the 15-6 and 14-29 extracts using a 100 uL
injection volume of the samples. The HPLC machine used was an Agilent 1100 series. The
column used was the Zorbax RX-C18 (4.6 x 25 mm column, 5 μL, 300 Å) and the solvents
used were 0.1% Formic acid in H2O (Solvent A) and 0.1% Formic acid in Acetonitrile. Table
1 shows the elution profile used for this HPLC. The particular HPLC method used was taken
from Wobbe (2015).
Table 1: HPLC Elution profile used (Wobbe, 2015)
Time (minutes) % Solvent A % Solvent B
0 92 8
4.25 92 8
29.25 20 80
37.55 20 80
37.56 10 90
45.85 10 90
45.86 92 8
54.15 92 8
23
Fractions were taken manually at five minute intervals for the HPLC runs. Starting at time
zero the elution was collected from the column into a 15 mL conical tube, every five minutes
the 15 mL tube was replaced being sure to keep and label all tubes in order of collection. The
extracts of the 15-6 and the 14-29 isolates were run as well as the solvents present in the
extracts (ethyl acetate and methanol respectively).
Initial attempts to dry the fractions down was done by passing nitrogen over the top of
the liquid. This method however was too inefficient and lyophilization was chosen as an
alternative.
Lyophilization was used to dry down both sets of the HPLC fractions. The lyophilizer
used was a Savant Novalyphe-NL500. Each 5 mL fraction was transferred into either a large
glass test tube or a 50 mL conical tube. The fractions were then frozen into shells using liquid
nitrogen and placed into glass lyophilization canisters. A vacuum was pulled and the fractions
were allowed to lyophilize for 24 hours or until no frozen solvent was visible. The test
tubes/50 mL conical tubes were then thoroughly rinsed with the solvent used in the original
extraction (ethyl acetate or methanol) and this solution was transferred to 15 mL conical tubes
and dried down by passing air over them. The fractions were then resuspended in 100 μL of
the respective solvent. 100 μL of solvent was used as this is the volume of the original extract
that was injected into the HPLC column.
In order to test the fractions, 10 uL of each fraction was spotted onto small filter paper
disks in the same procedure as described above for the extract testing, and allowed to dry.
Control fractions of just the extraction solvent (ethyl acetate or methanol) collected in the
same way as the extract fractions were also spotted onto the filter paper disks in the same
manner. The disks were then placed on an inoculated E. coli (ATCC 11795) or B. subtilis LB
plate, all fractions were tested against both species. The plates were then allowed to incubate
at 37oC for 24 hours. Zones of inhibition indicated fractions that contain the antibiotic
compound.
2.4.2 HPLC of Antibiotic Standards
Antibiotic standards were run through the same HPLC method as above in order to
determine similarities between the extractions and known antibiotics. The antibiotic standards
24
run included a penicillin/streptomycin mix (10,000 ug/uL), carbenicillin (50 mg/mL),
ampicillin (10 mg/mL), tetracycline (15 mg/mL), gentamicin (10 mg/mL), cycloheximide (25
ug/uL), and amphotericin B (10 mg/mL).
3. Results
The purpose of these experiments was the optimization of different laboratory methods
used in the Small World soil bacteria project as well as the identification of isolated
antibacterial compounds from these soil bacteria. These methods were designed to identify
bacterial strains isolated from soil samples that showed antibacterial activity, extract bacterial
products from these samples, and characterize these products to determine their identity.
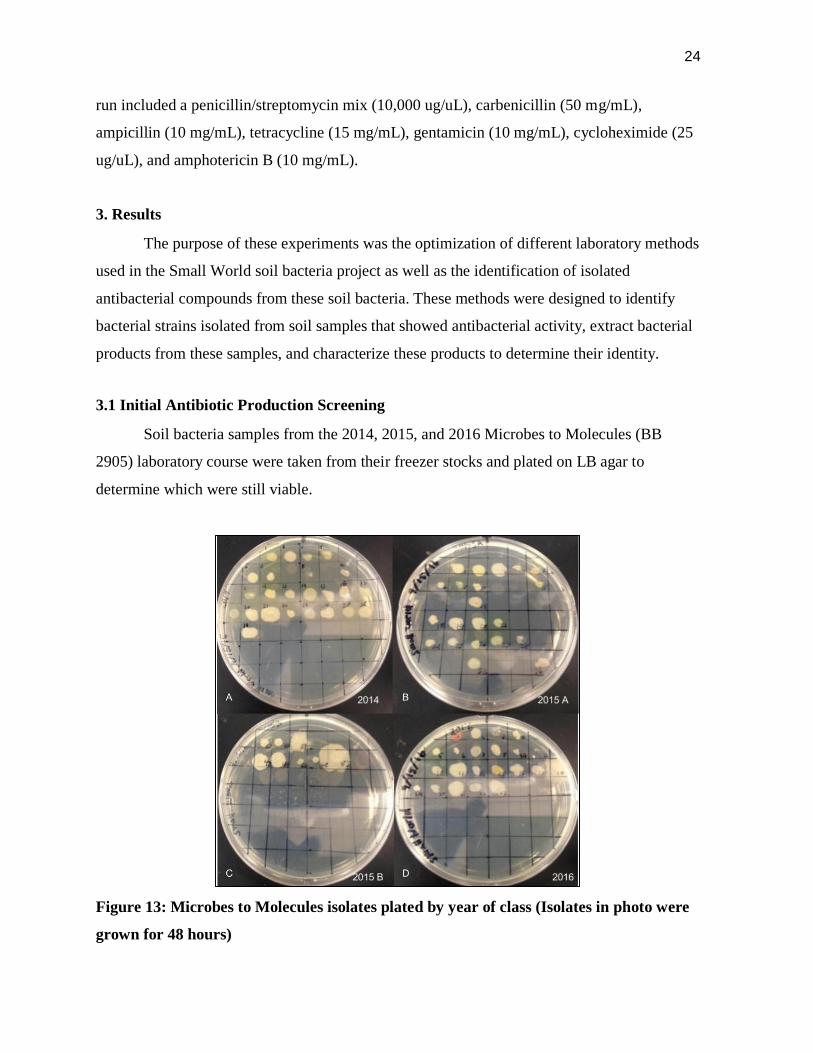
3.1 Initial Antibiotic Production Screening
Soil bacteria samples from the 2014, 2015, and 2016 Microbes to Molecules (BB
2905) laboratory course were taken from their freezer stocks and plated on LB agar to
determine which were still viable.
Figure 13: Microbes to Molecules isolates plated by year of class (Isolates in photo were
grown for 48 hours)

25
After 48 hours, colonies of various sizes and colors were observed from each sample
shown in Figure 13. It was also observed that certain strains grew larger colonies than others,
but this information was not relevant as they had not been tested for antibacterial activity.
These results showed that the cryo-storage method used by the class worked and that all of the
samples were viable for further testing. Any potential antibacterial activity of the samples was
tested using a top agar assay. A colony of each sample was grown on two separate LB agar
plates. The two plates allowed for each soil bacteria sample to be tested for antibacterial
activity against gram positive (B.subtilis) and gram negative (E. coli) bacteria. After the top
agar mixed with its respective bacteria culture was added to the plates, they were left to grow
as described above.
Figure 14: E.coli (Left) and B. subtilis (Right) top agar screening plates. Note that 14-29
is mislabeled in this figure as 14-39.
The plates, after incubation, showed varying levels of antibacterial activity in Figure
14. Antibacterial activity was observed on both the E. coli and B. subtilis plates. In some
instances, the zone of inhibition was much bigger than others, such as the zone created by one
of the colonies in the first row of column A of the E. coli plate. Some samples were also
observed to only inhibit the growth of one type of bacteria, such as the 15-19 sample that only
created a zone of inhibition on the E.coli plate. Soil bacteria samples that showed to have
antibacterial activity were selected for further analysis. Specifically, samples that showed
strong inhibited of both gram positive and gram negative bacteria were selected for further
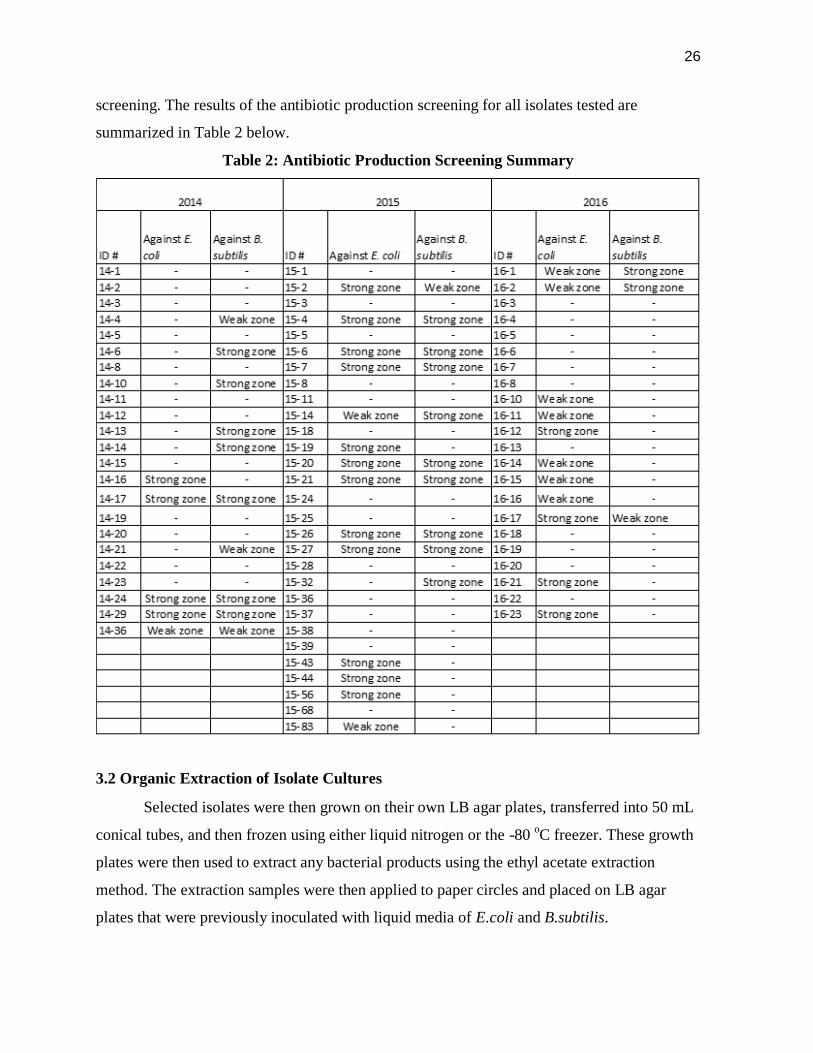
26
screening. The results of the antibiotic production screening for all isolates tested are
summarized in Table 2 below.
Table 2: Antibiotic Production Screening Summary
3.2 Organic Extraction of Isolate Cultures
Selected isolates were then grown on their own LB agar plates, transferred into 50 mL
conical tubes, and then frozen using either liquid nitrogen or the -80 oC freezer. These growth
plates were then used to extract any bacterial products using the ethyl acetate extraction
method. The extraction samples were then applied to paper circles and placed on LB agar
plates that were previously inoculated with liquid media of E.coli and B.subtilis.
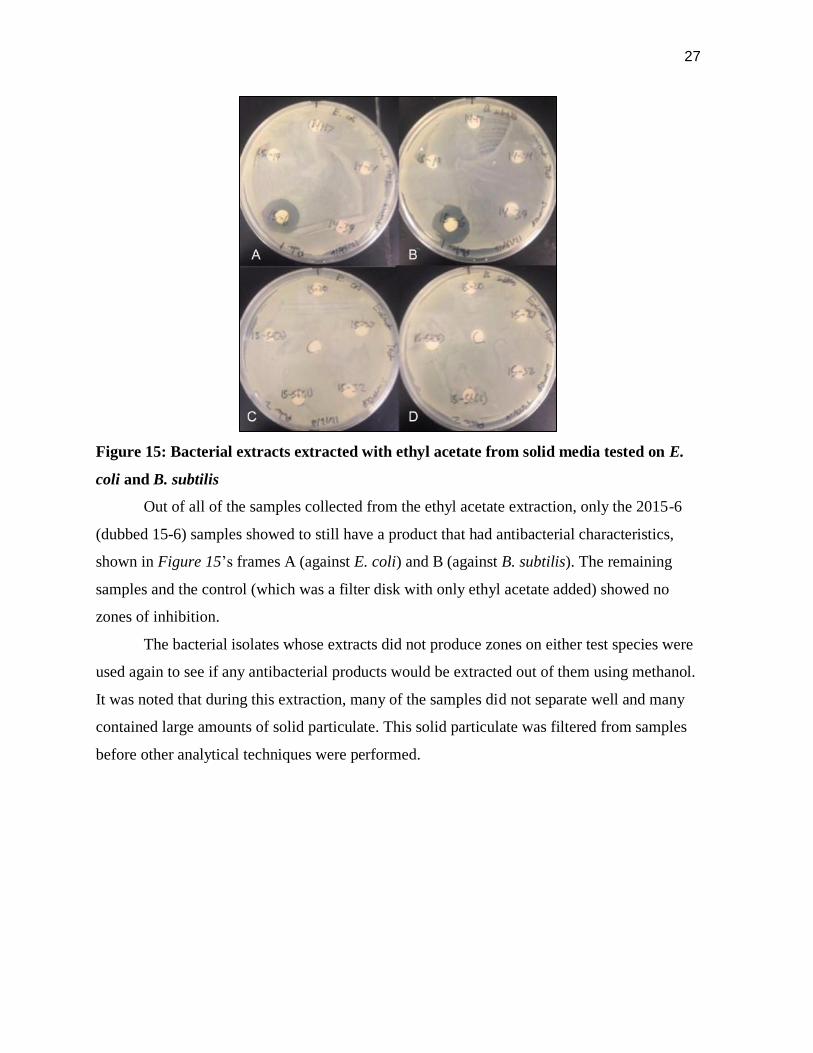
27
Figure 15: Bacterial extracts extracted with ethyl acetate from solid media tested on E.
coli and B. subtilis
Out of all of the samples collected from the ethyl acetate extraction, only the 2015-6
(dubbed 15-6) samples showed to still have a product that had antibacterial characteristics,
shown in Figure 15’s frames A (against E. coli) and B (against B. subtilis). The remaining
samples and the control (which was a filter disk with only ethyl acetate added) showed no
zones of inhibition.
The bacterial isolates whose extracts did not produce zones on either test species were
used again to see if any antibacterial products would be extracted out of them using methanol.
It was noted that during this extraction, many of the samples did not separate well and many
contained large amounts of solid particulate. This solid particulate was filtered from samples
before other analytical techniques were performed.

28
Figure 16: Bacterial extracts extracted in methanol from solid media tested against E.
coli and B. subtilis
The samples were tested using the same technique used for the ethyl acetate
extractions. Observed in Figure 16, only sample 2014-29 (dubbed 14-29) was observed to
produce zones of inhibition on the plates. The remaining samples and the control (made by
placing a paper circle on the agar that only had methanol added to it) failed to produce any
zones of inhibition.
3.3 General PCR Results
Colony PCR was utilized to help identify the soil bacteria. Primers for the 16s subunit
of the ribosome were selected to produce DNA samples to be sequenced. Using the normal
PCR protocol for the 16s subunit showed poor results for most samples. Using a gradient of
annealing temperatures, it was determined that the PCR produced more quality product at 44
C when using the 27F and 1492R primers.
The gyrase gene targeted PCR was then conducted on samples identified as being in
the Bacillus genus. The attempted PCR did not produce sufficient amounts of DNA. Due to
limited time and repeated insufficient results from the gyrase PCR, attempts to sequence the
Bacillus samples were not pursued further.
3.4 Isolate 15-6
The 15-6 isolate produced an antibiotic compound that could be extracted using the
ethyl acetate extraction technique. 15-6 grew slowly on LB agar at room temperature, taking
at least 72 hours before colonies are visible. It was able however able to readily produce the

29
antibiotic compound on LB agar. 15-6 also grew slowly in LB liquid media taking at least 72
hours before the media becomes cloudy or clumps of colonies are apparent. On LB agar the
colonies are very small, circular, and have a hard and waxy texture, making them difficult to
pick up when inoculating other media. After 96 hours a yellow-brown precipitate could be
seen excreting from the colonies on the plate.
Figure 17: Gram stain of isolate 15-6 at 400x magnification
When 15-6 was gram stained it appeared gram positive and filamentous (seen in Figure 17).
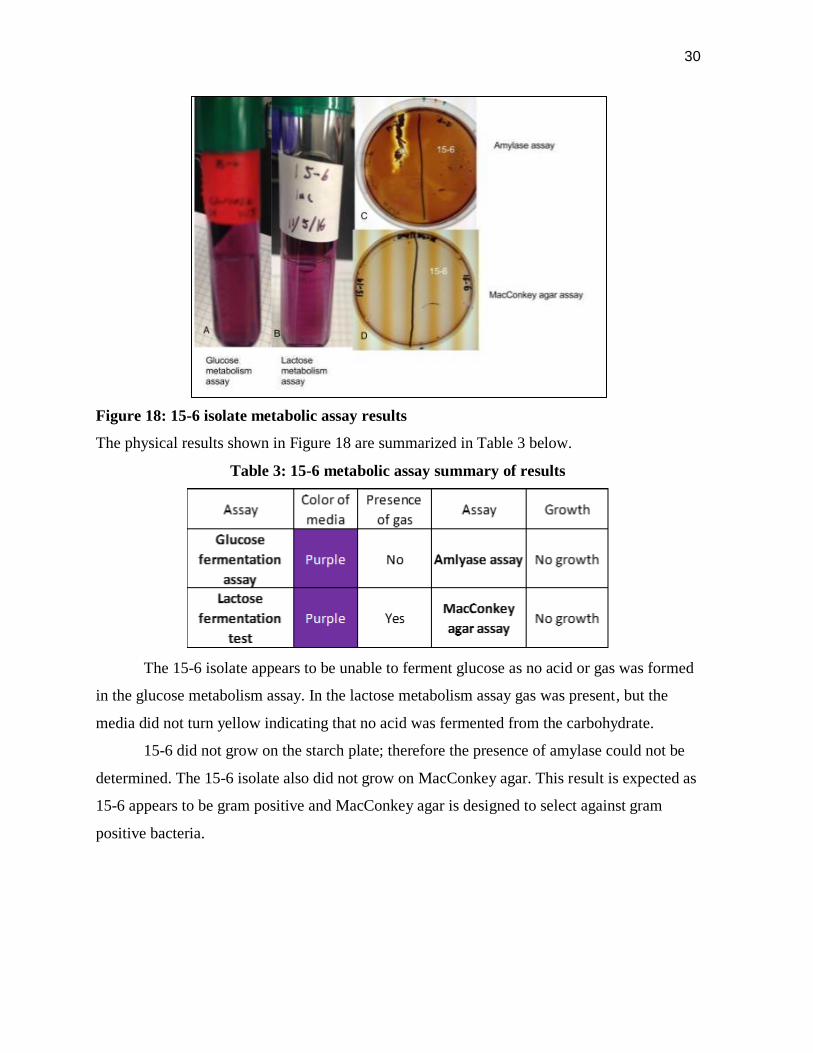
3.4.1 15-6 Metabolic Assays
The results of four metabolic assays for the 15-6 isolate were recorded in Figure 18.
These assays in clockwise order are glucose fermentation, lactose fermentation, amylase
assay, and the MacConkey agar assay.
30
Figure 18: 15-6 isolate metabolic assay results
The physical results shown in Figure 18 are summarized in Table 3 below.
Table 3: 15-6 metabolic assay summary of results
The 15-6 isolate appears to be unable to ferment glucose as no acid or gas was formed
in the glucose metabolism assay. In the lactose metabolism assay gas was present, but the
media did not turn yellow indicating that no acid was fermented from the carbohydrate.
15-6 did not grow on the starch plate; therefore the presence of amylase could not be
determined. The 15-6 isolate also did not grow on MacConkey agar. This result is expected as
15-6 appears to be gram positive and MacConkey agar is designed to select against gram
positive bacteria.

31
3.4.2 15-6 PCR results
According to the 16s ribosomal nucleotide BLAST search alignment (Altschul et al.,
1990) 15-6 is likely a Streptomyces species. The exact species cannot be determined with the
sequences that were obtained. The likely species include Streptomyces costaricanus,
Streptomyces murinus, Streptomyces phaeogriseichromatogenes, and Streptomyces
misionensis. Figure 19 summarizes the BLAST 16s ribosomal subunit sequence alignment
results for isolate 15-6. The 16s ribosomal nucleotide alignments for the top three matched
species are shown in Figures 20-22.
Figure 19: 15-6 16s ribosomal subunit sequence alignment results (sequenced with 27F
primer)

32
Figure 20: 15-6 and Streptomyces costaricanus (strain NBRC 100773) 16s ribosomal
subunit partial sequence alignment
33
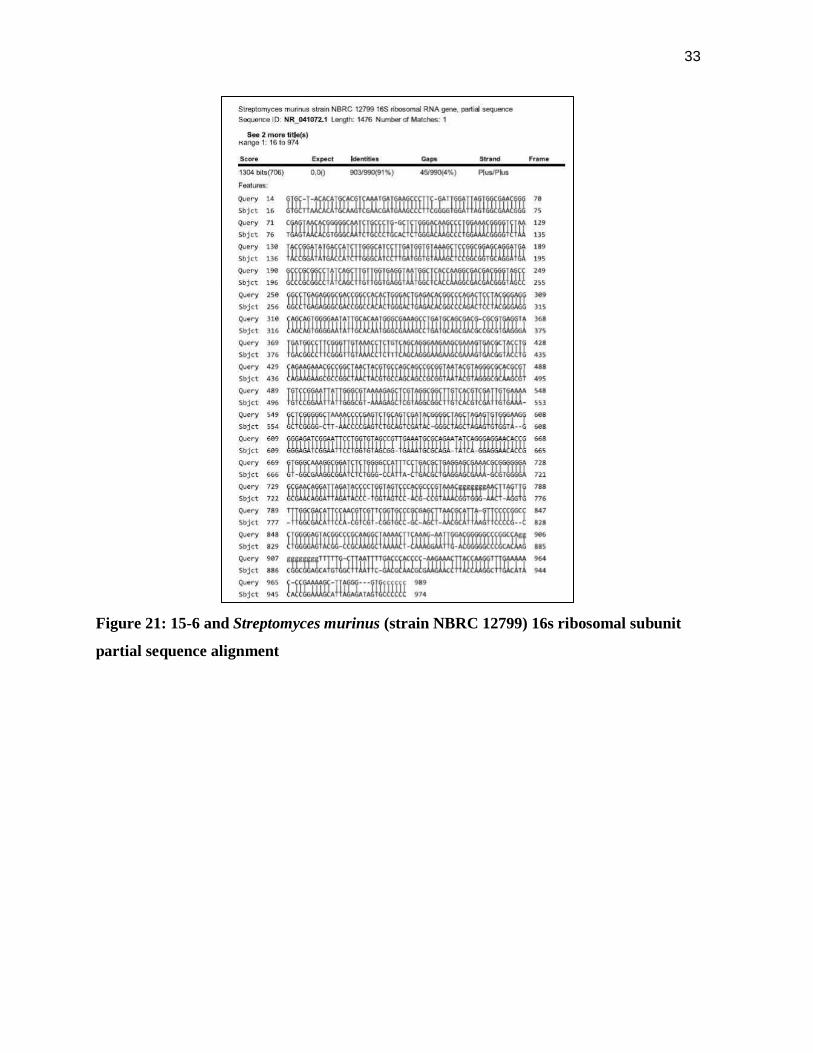
Figure 21: 15-6 and Streptomyces murinus (strain NBRC 12799) 16s ribosomal subunit
partial sequence alignment

34
Figure 22: 15-6 and Streptomyces phaeogriseichromatogenes (strain NRRL 2834) 16s
ribosomal subunit partial sequence alignment
The BLAST results, shown in Figure 19, indicated that the sequences generated from
the 16s PCR was equally probable to belong to numerous bacteria strains. This was
demonstrated in Figures 20-22 when the DNA sequences of the top three BLAST matches
were aligned with the DNA generated from PCR. Each DNA sequence from BLAST results
showed equally high levels of similarity with the 15-6 16s Ribosomal subunit DNA.

35
3.4.3 15-6 Growth and antibiotic production on various solid media
Over the course of the project, the growth of 15-6 was noted to be very slow, requiring
three days to grow to concentrations with defined colonies. Different agar media types were
then used to determine if 15-6 grew more efficiently on other media besides LB. The agar
media tested were LB, Potato Dextrose Agar (PDA), Trypticase Soy Agar (TSA), Reasoner’s
2a Agar (R2A), and Todd Hewitt Agar (THA) media. The plates were left to grow for five
days and the resulting bacterial growth was documented.
Figure 23: 15-6 growth on LB (A), PDA (B), TSA (C), R2A (D), and THA (E)
The plates, Figure 23, showed that the 15-6 sample grew at different rates for each
media. The PDA and THA media showed the largest concentration of colonies. TSA media
showed the lowest, with R2A and LB media showing about the same concentrations of
colonies. Every plate had its bacterial product extracted using ethyl acetate extraction.
The extracts were then used on a zone of inhibition tests against E.coli and B.subtilis.
The goal of this test was to determine if any of the extracted samples produced a more
concentrated sample. The theory being, more concentrated samples would show larger zones
of inhibition on the plates.

36
Figure 24: Testing of 15-6 extracts extracted from LB, PDA, TSA, R2A, and THA media
against B. subtilis (A) and E. coli (B)
After letting the E.coli and B.subtilis grow on the treated plates for 24 hours, the plates
shown in Figure 24 were obtained. Each of the extracts showed to produce clear zones of
inhibition on the B.subtilis plate and very faint zones of inhibition on the E.coli plate. Along
with the control showing no zones of inhibition, as it served as a negative control, the R2A
and PDA extracts were observed to have slightly larger zones of inhibition. The THA, LB,
and TSA extracts were observed to have smaller zones of inhibition.
3.4.3.2 Various Solid Media 15-6 Extract HPLC Results
Further analysis of the extracts along with the purification of the extracts was
conducted using an HPLC column. Previously grown 15-6 extract, grown on LB media, was
used to determine elution times. Elution times and protocols from this experiment, shown in
section 3.6, were used to design the HPLC graphs shown in Figures 25-29. Each extract was
run through the HPLC for 30 minutes and the fraction from the 25-30 minute time period was
collected.

37
Figure 25: HPLC chromatogram of 15-6 grown on TSA extracted in ethyl acetate
Figure 26: HPLC chromatogram of 15-6 grown on THA extracted in ethyl acetate

38
Figure 27: HPLC chromatogram of 15-6 grown on R2A extracted in ethyl acetate
Figure 28: HPLC chromatogram of 15-6 grown on PDA extracted in ethyl acetate
39
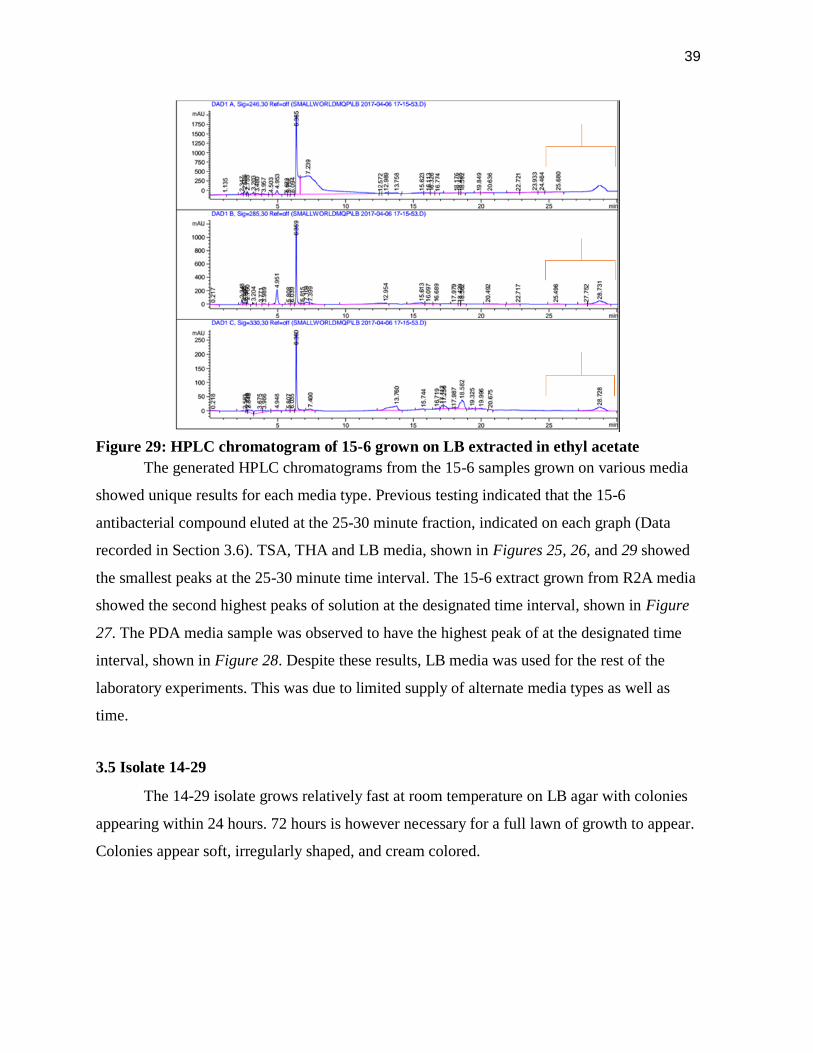
Figure 29: HPLC chromatogram of 15-6 grown on LB extracted in ethyl acetate
The generated HPLC chromatograms from the 15-6 samples grown on various media
showed unique results for each media type. Previous testing indicated that the 15-6
antibacterial compound eluted at the 25-30 minute fraction, indicated on each graph (Data
recorded in Section 3.6). TSA, THA and LB media, shown in Figures 25, 26, and 29 showed
the smallest peaks at the 25-30 minute time interval. The 15-6 extract grown from R2A media
showed the second highest peaks of solution at the designated time interval, shown in Figure
27. The PDA media sample was observed to have the highest peak of at the designated time
interval, shown in Figure 28. Despite these results, LB media was used for the rest of the
laboratory experiments. This was due to limited supply of alternate media types as well as
time.
3.5 Isolate 14-29
The 14-29 isolate grows relatively fast at room temperature on LB agar with colonies
appearing within 24 hours. 72 hours is however necessary for a full lawn of growth to appear.
Colonies appear soft, irregularly shaped, and cream colored.
40
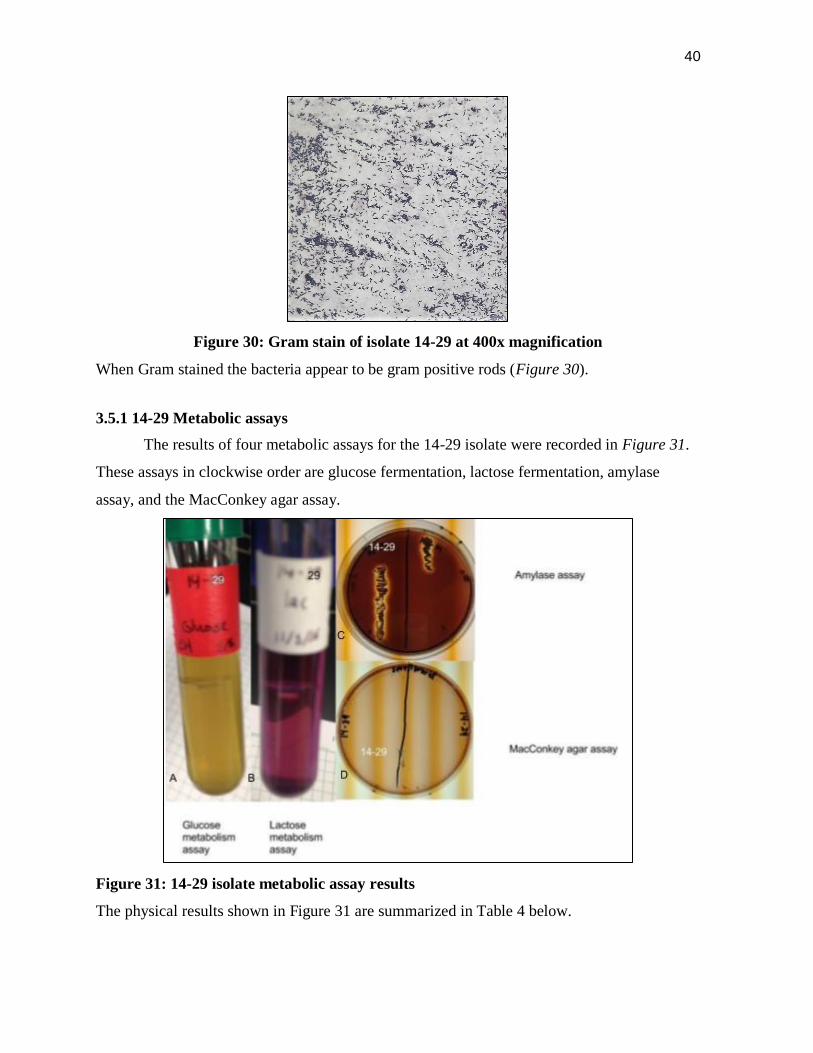
Figure 30: Gram stain of isolate 14-29 at 400x magnification
When Gram stained the bacteria appear to be gram positive rods (Figure 30).
3.5.1 14-29 Metabolic assays
The results of four metabolic assays for the 14-29 isolate were recorded in Figure 31.
These assays in clockwise order are glucose fermentation, lactose fermentation, amylase
assay, and the MacConkey agar assay.
Figure 31: 14-29 isolate metabolic assay results
The physical results shown in Figure 31 are summarized in Table 4 below.

41
Table 4: 14-29 metabolic assay summary of results
The 14-29 isolate appears to be able to ferment glucose as the media turned yellow,
indicating the presence of an acid, and gas was formed. In the lactose fermentation test, gas
was formed but the media did not turn yellow, indicating no acid was present.
14-29 appears to be amylase positive (Figure 31). On the MacConkey agar plate in
Figure 19 14-29 is mislabeled as 14-39. 14-29 did not grow on MacConkey agar. This result is
expected as 14-29 appears to be gram positive and MacConkey agar is designed to select
against gram positive bacteria.
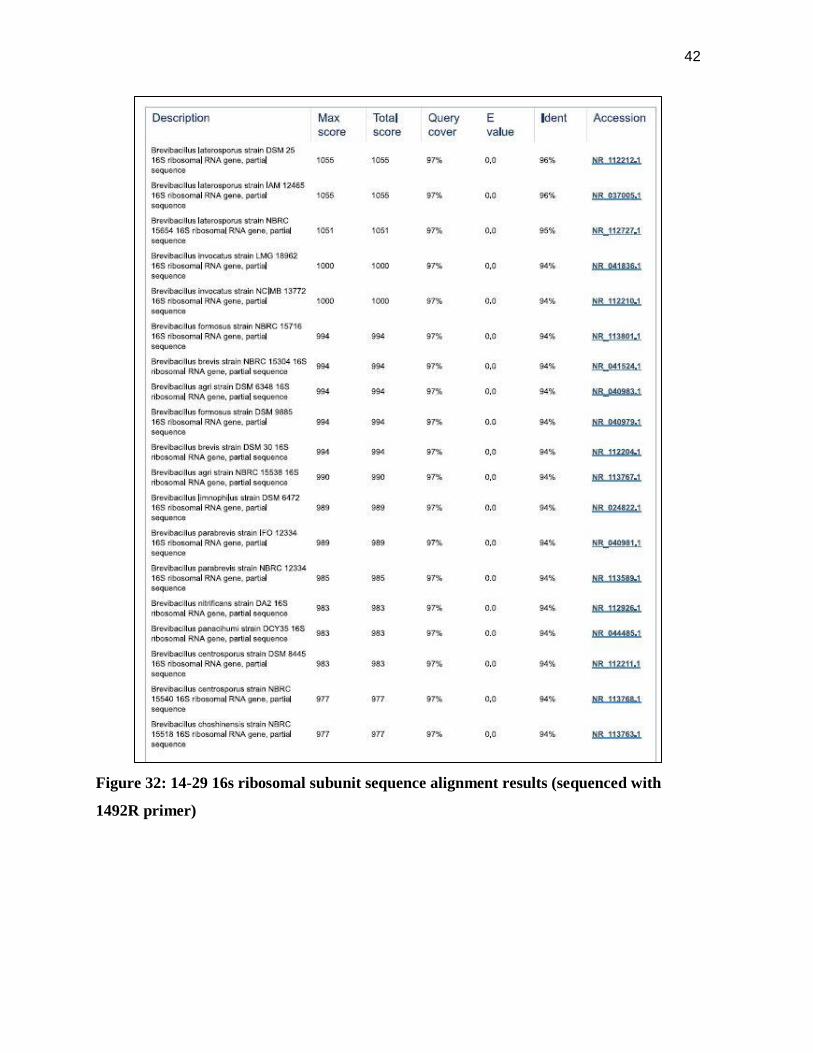
3.5.2 14-29 PCR results
According to the 16s ribosomal nucleotide BLAST alignment (Altschul et al., 1990),
14-29 is likely a Brevibacillus species. The exact species cannot be determined with the
sequences that were obtained. The most likely species include Brevibacillus laterosporus,
Brevibacillus inocatus, or Brevibacillus fomnosus. A summary of the top sequence alignment
results can be seen in Figure 32. The nucleotide alignments for the top five matches are
shown in Figures 33-37.
42
Figure 32: 14-29 16s ribosomal subunit sequence alignment results (sequenced with
1492R primer)

43
Figure 33:14-29 and Brevibacillus laterosporus (strain DSM 25) 16s ribosomal subunit
partial sequence alignment

44
Figure 34:14-29 and Brevibacillus laterosporus (strain IAM 12465) 16s ribosomal subunit
partial sequence alignment

45
Figure 35:14-29 and Brevibacillus laterosporus (strain NBRC 15654) 16s ribosomal
subunit partial sequence alignment
46
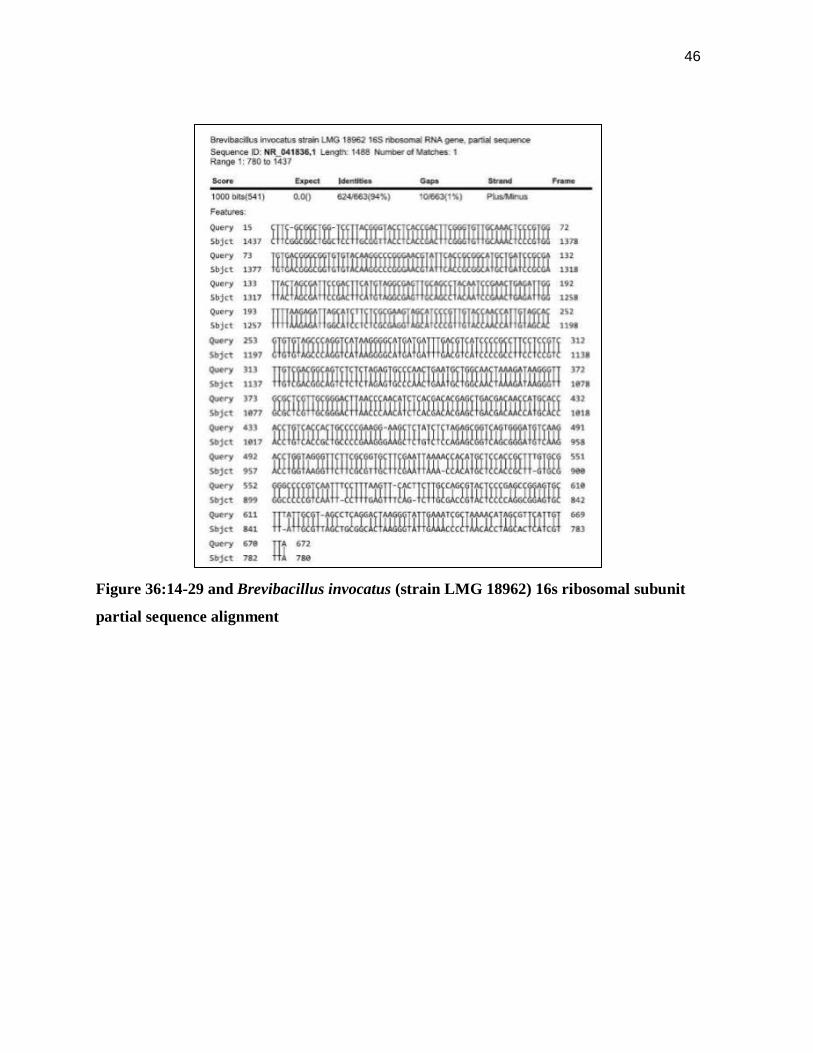
Figure 36:14-29 and Brevibacillus invocatus (strain LMG 18962) 16s ribosomal subunit
partial sequence alignment

47
Figure 37: 14-29 and Brevibacillus invocatus (strain NCIMB 13772) 16s ribosomal
subunit partial sequence alignment
The BLAST results, shown in Figure 32, indicated that the sequences generated from
the 16s PCR was equally probable to belong to numerous bacterial species or strains. This was
demonstrated in Figures 33-37 when the DNA sequences of the top three BLAST matches
were aligned with the DNA generated from PCR. Each DNA sequence from BLAST results
showed relatively equal levels of similarity with the 14-29 16s Ribosomal subunit DNA.
3.6 LB Media Extracts HPLC Results of Samples 15-6, 14-29, and Solvents
The extraction samples were then run through an HPLC column to help purify the
antibacterial product out of the extracts as well as gather chemical data on the extractions.
Additionally, HPLC was used for ethyl acetate and methanol by themselves to create standard
chromatograms to compare with the chromatograms of the extracts. The ethyl acetate standard
is Figure 38 and the methanol standard is Figure 41.

48
After samples 15-6 and 14-29 were filtered through the HPLC column, the solution
that ran through the column was collected in five minute fractions. These fractions were dried
down and resuspended in 100 μL of the original solvent used for the extraction of that
particular isolate (ethyl acetate for 15-6 and methanol for 14-29). Fractions were collected
from the ethyl acetate and methanol standards and were tested alongside the extract fractions
as a control. Each fraction was then applied to paper tested using the same inhibition zone
assay as before. This assay is shown in Figure 40 for 15-6 and Figure 43 for 14-29.
Figure 38: HPLC chromatogram of ethyl acetate
The ethyl acetate chromatogram (Figure 38) is characterized by a peak at approximately
seven minutes and two peaks at 42 minutes and 43-50 minutes respectively. These peaks are
also present in the 15-6 chromatogram seen in Figure 39.
49
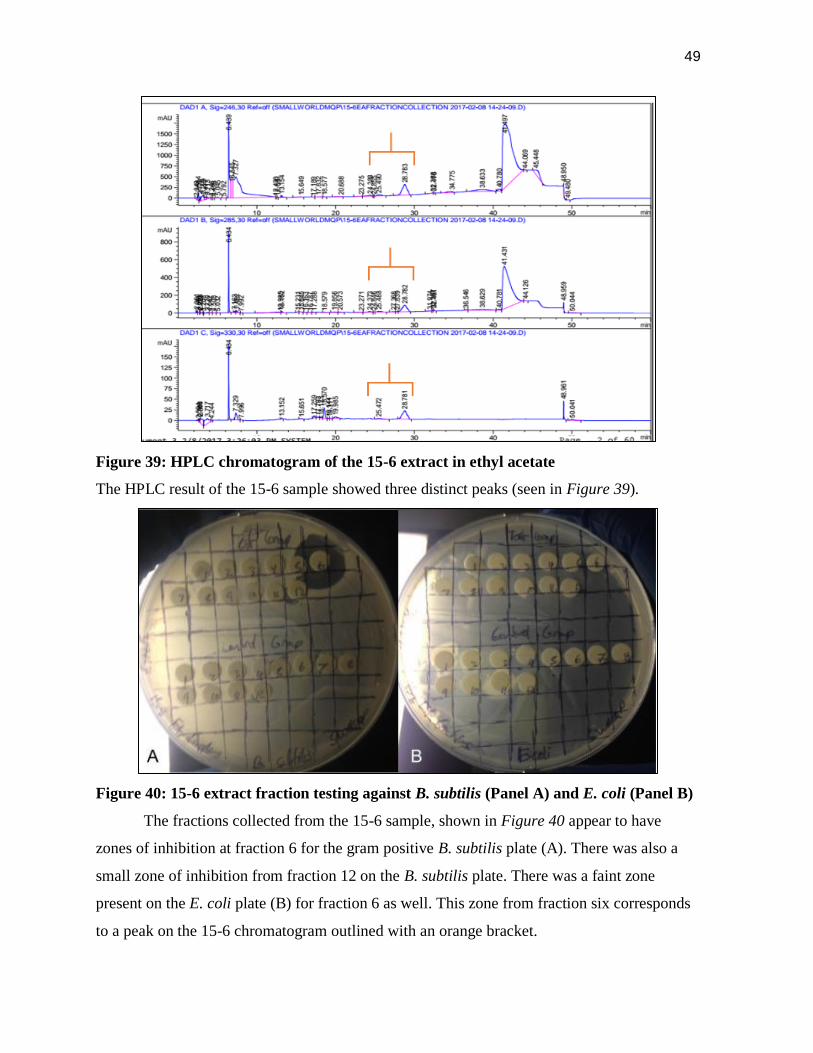
Figure 39: HPLC chromatogram of the 15-6 extract in ethyl acetate
The HPLC result of the 15-6 sample showed three distinct peaks (seen in Figure 39).
Figure 40: 15-6 extract fraction testing against B. subtilis (Panel A) and E. coli (Panel B)
The fractions collected from the 15-6 sample, shown in Figure 40 appear to have
zones of inhibition at fraction 6 for the gram positive B. subtilis plate (A). There was also a
small zone of inhibition from fraction 12 on the B. subtilis plate. There was a faint zone
present on the E. coli plate (B) for fraction 6 as well. This zone from fraction six corresponds
to a peak on the 15-6 chromatogram outlined with an orange bracket.

50
Figure 41: HPLC chromatogram of methanol
The HPLC chromatogram (Figure 41) of methanol defining feature is one large peak from
approximately 41 minutes to 49 minutes. This feature is shared in the 14-29 chromatogram
(Figure 42).

51
Figure 42: HPLC chromatogram of the 14-29 extract in methanol
The chromatogram generated when the 14-29 extract was run through HPLC resulted
in numerous peaks. Most notably were three distinct peaks in the 15-20, 20-25, and 25-30
minute time intervals. It was noticed however, that these three peaks vanished when exposed
to 330 nm wavelengths of light. Despite this, all fractions were tested using zone of inhibition
tests to determine with fractions contained compounds with antibacterial activity.

52
Figure 43: 14-29 extract fraction testing against B. subtilis (Panel A) and E. coli (Panel
B)
The zone of inhibition tests run for the fractions collected from the HPLC purification
of the 14-29 sample showed several zones of inhibition. Shown in Figure 43, fractions 4, 5,
and 6 (collected from time intervals 15-20 minutes, 20-25 minutes, and 25-30 minutes
respectively), created small zones of inhibition on the B.subtilis plate, Figure 43A, and
minimal inhibition on the E.coli plate, Figure 43B. It was noted that in these fractions, peaks
of activity were noted in the chromatogram at the same time intervals, indicated in Figure 42.
3.6.2 Antibiotic Standards HPLC Results
Antibiotic standards were run through the HPLC column using the same protocols
used for the extract samples (15-6 and 14-29) and their solvents. The antibiotic stock
standards were used in order to find similarities in the chromatograms between the standards
and the selected samples.
Figure 44: HPLC chromatogram of penicillin and streptomycin
The HPLC chromatogram (Figure 44) of penicillin and streptomycin is characterized by a
sharp narrow peak at approximately 12 minutes on the 246 nm and 285 nm wavelength
chromatograms, a sharp narrow peak at approximately 16 minutes on the 330 nm wavelength
chromatogram, and a large broad peak from approximately 40 minutes to 50 minutes.

53
Figure 45: HPLC chromatogram of tetracycline
The HPLC chromatogram (Figure 45) of tetracycline is characterized by a mass of four peaks
from approximately 2-11 minutes and a peak from 40 minutes to 50 minutes. This fifth peak
however did not appear on the third wavelength (330 nm).
Figure 46: HPLC chromatogram of cycloheximide
The HPLC chromatogram (Figure 46) of cycloheximide is characterized by a cluster of peaks
ranging from approximately 15-24 minutes. A large peak is also present from approximately
54
40-49 minutes on the 246 nm and 285 nm wavelength chromatograms.
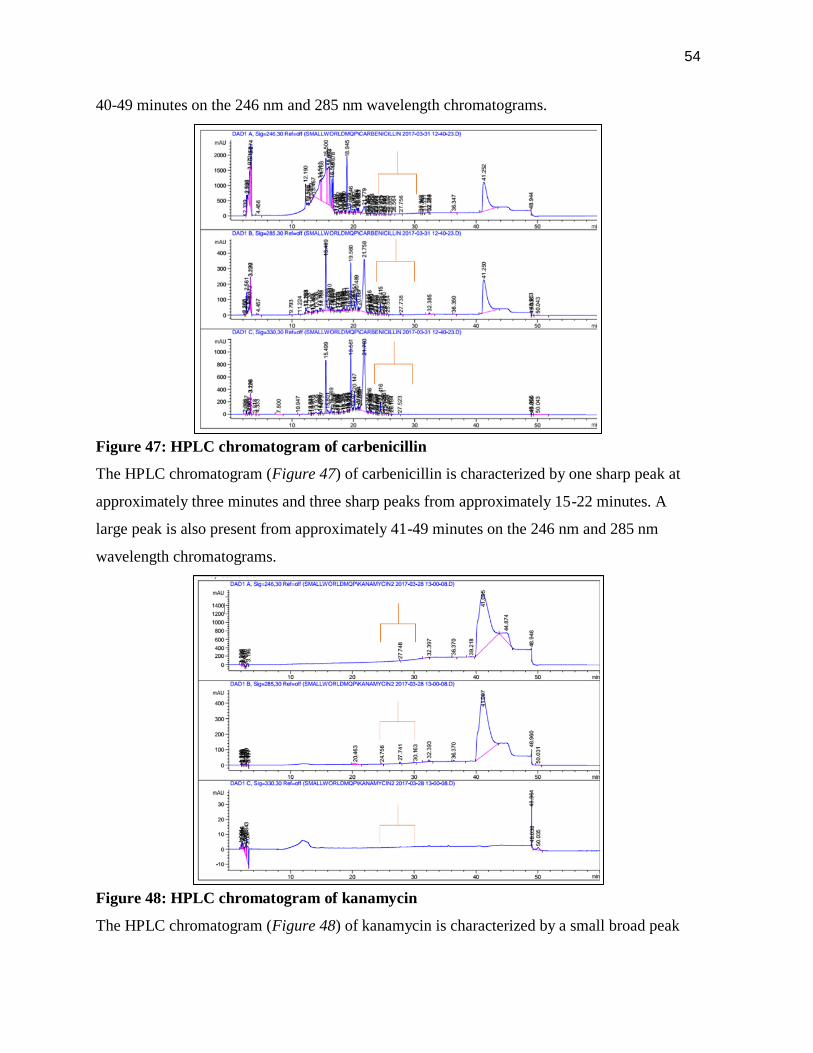
Figure 47: HPLC chromatogram of carbenicillin
The HPLC chromatogram (Figure 47) of carbenicillin is characterized by one sharp peak at
approximately three minutes and three sharp peaks from approximately 15-22 minutes. A
large peak is also present from approximately 41-49 minutes on the 246 nm and 285 nm
wavelength chromatograms.
Figure 48: HPLC chromatogram of kanamycin
The HPLC chromatogram (Figure 48) of kanamycin is characterized by a small broad peak

55
from approximately 10-13 minutes on the 330 nm chromatogram and a large broad peak from
40-50 minutes.
Figure 49: HPLC chromatogram of gentamicin
The HPLC chromatogram (Figure 49) of gentamicin is characterized by two sharp peaks at 2
minutes and 3.5 minutes respectively as well as a large broad peak from 40-50 minutes.
Figure 50: HPLC chromatogram of ampicillin
The HPLC chromatogram (Figure 50) of ampicillin is characterized by several small peaks
ranging from approximately 15-24 minutes and a large broad peak from approximately 40-50

56
minutes.
Figure 51: HPLC chromatogram of Amphotericin B
The HPLC chromatogram (Figure 51) of amphotericin B is characterized by a peak at 3
minutes and a dense cluster of peaks ranging from 10 minutes to 40 minutes. This standard
like all the others tested shares the peak from 40-50 minutes. This can be assumed to be the
solvent they are suspended in as this consistent with the methanol chromatogram in Figure 41.
4. Discussion
The rising threat of antibiotic resistant bacteria is a problem that science must address.
Many new strains of what were once easily treated diseases have emerged and threaten the
world with catastrophic epidemics. The current arsenal of effective antibiotics available to
combat such pathogens has started to dwindle to stronger antibiotics that have negative
consequences for the patient when used to treat the bacterial pathogen. However, groups such
as the Small World Initiative have formed to help. Worcester Polytechnic Institute has begun
their own contributions for the initiative in the form of the Microbes and Molecules BB2905
laboratory course. The goal of this project was to take the preexisting methods and identified
producers from past BB2905 classes to create an optimized pipeline system for the
identification of soil microbial isolates, selection of microbial isolates that produce
antibacterial products, isolate said products, and characterize them. The hope of this pipeline
was to allow students to identify new sources of antibiotics and new classes of antibacterial

57
products that could be used to combat antibiotic resistant bacteria.
The first step of the pipeline was to test which of the microbe samples from previous
years of the BB2905 Lab course were still viable after cryopreservation and which of those
produced antibacterial compounds. All samples were successfully grown on the LB media,
shown in Figure 13, confirming that all samples were still viable and that the cryopreservation
protocols of the BB2905 course worked as intended. All samples were then tested using a top
agar assay against E.coli and B.subtilis bacteria. E.coli and B.subtilis were selected as they
were well established lab cultures of gram negative (E.coli) and gram positive (B.subtilis)
bacteria. Other bacteria types were used to determine which bacteria standards should be used,
such as S.epidermis, E.aerogenes, A.baylyi, and K.pneumonia. However, the other bacteria
were harder to grow and showed inconsistent results for basic testing. E.coli and B.subtilis
strains, conversely, showed more consistent results, and were then used for the other
experiments in this project. If the BB2905 microbes produced an antibiotic product effective
against E.coli or B.subtilis, a visible zone of inhibition would have been observed. After they
were incubated, numerous samples, shown in Figure 14, created zones of inhibition on the
E.coli and B.subtilis top agar assay plates. With a variety of samples to choose from, samples
that showed to have antibacterial activity against both E.coli and B.subtilis were selected for
further testing.
The selected samples were then identified, as many groups in the BB2905 course did
not have success sequence identifying their samples. This was mostly due to the inconsistent
success of attempts to PCR amplify the 16s ribosomal subunit of microbial DNA. Most often,
the PCR did yield sufficient amounts of DNA or long enough strands of useable for
sequencing. The protocols for the 16s PCR were altered and tested to determine which kinds
of changes yielded enough DNA to be sequenced without becoming too inaccurate. This was
done through gradient PCR and using a new PCR mix (OneTaq, instead of Q5 High Fidelity
Master Mix). The gradient PCR indicated that using the provided 16s primers (27F and
1492R) with an annealing temperature of 44℃, five degrees below its original annealing
temperature, produced better results. The new protocol yielded more DNA product that was
sufficient in length to be properly sequenced. Additionally, repeat tests of this protocol
produced consistent sequencing results, indicating that the DNA was not too random to
potentially misidentify a sample (a prominent concern due to the very low annealing

58
temperature). However, the resulting DNA sequences were only able to identify the genus of
each sample, showing multiple species to have similar probability of being the sequenced
sample. The most notable example of this was with samples identified to be in the Bacillus
genus. These samples were highly similar and individual species could not be distinguished
on the basis of the 16S ribosomal sequences alone.
PCR protocols and primers that targeted the gyrase gene were tested on the Bacillus
samples as an attempt to identify them further. Unfortunately, most of the samples failed to
produce any PCR product and those that did, when sequenced, produced sequences that were
identified as being from either completely different genera of bacteria or from different genes
all together. Due to the many potentially pathogenic species within the Bacillus genus that
were among those identified by sequencing, samples identified as such were not selected for
further testing. Further testing of the PCR protocol for the gyrase gene was not pursued due to
time constraints. Just as the PCR protocol for the 16s subunit was optimized for use on soil
bacteria, the PCR protocol for the gyrase gene should be tested and optimized by future
projects. Additionally, alternate gene targets for PCR should be researched and tested to help
increase the identification accuracy of collected soil microbes. The samples that were selected
were 15-6 (identified to be in the Streptomyces genus) and 14-29 (identified to be in the
Brevibacillus genus). The level of accuracy obtained from these tests was sufficient for the
purposes of this project as no notable pathogenic strains were shown to be the likely identity
of these samples.
Alternate non-PCR methods for identifying soil microbe samples were also tested.
Focusing on the metabolism of the organisms, different growth media was used to determine
if the organisms could metabolize different sugar sources. Other tests focused on the cellular
structure of the microbes such as the presence of a cell wall. Using readily available media,
the different tests did yield information regarding each sample. The problem with this data is
that, in order to use it, it would need to be compared to previously compiled information on
specific bacteria. This is a much more time consuming method and it can run into the same
problem as the 16s target sequencing. Many organisms share similar metabolic and cellular
processes and for any certainty, sequencing would be needed for any confirmation. As an
educational tool, having students conduct these tests would be useful. That being said, the
primary method for identifying the soil samples should be sequencing techniques.

59
Additionally, experimenting with which types of media the microbes grow on more efficiently
should be conducted. This project only tested the 15-6 sample using multiple agar media (LB,
R2A, PDA, THA, and TSA) due to limited resources and time. When tested, potato dextrose
agar was shown to be a much more viable media to grow the sample on than the previously
used LB agar.
The problem with growing soil microbes on agar is that optimum growing conditions
have to be determined for each sample. Even then, the optimum conditions may take a
considerable amount of time. The solid cultures for the 15-6 samples took at least five days to
grow and produce significant levels of antibacterial product. The 14-29 sample took less time
to grow, but did not produce as concentrated antibacterial product. When 15-6 was identified,
the creation of liquid cultures in LB media was attempted. However, the cultures needed to be
thoroughly aerated to grow significant amounts of cells and this was difficult with the
available materials. Additionally, 15-6 was observed to clump together at the bottom of the
tubes, given its filamentous cellular structure. These samples, just like the agar media cultures,
required up to a week to grow sufficiently and had to be grown at room temperature. The
challenge with growing soil microbes to produce desired antibacterial products is a balance
between stress and growth. Certain media may provide the bacteria with the required nutrients
to replicate to higher colony counts or concentrations, but might not stress them enough or
give them the right conditions to produce their product. Growing the cultures on low nutrient
media may stress the organism, but the media may lack the required materials for the bacteria
to make its product. Co-culturing the bacteria with another established strain of bacteria (such
as E.coli) may help produce the product. However the presence of the other bacteria may
make extracting the antibacterial product harder as it may produce its own molecules that
could be similar to or block the desired product. Further experimentation into growing
protocols for more efficient antibacterial molecule production should be investigated. Such
experiments could entail, testing selected samples on a wider variety of rich and low nutrient
media as well as different temperatures. This data would allow for much more efficient
sample growth protocols and should be thoroughly documented to aid future experimentation
on selected soil bacterial samples.
The grown 15-6 and 14-29 LB cultures were then extracted using different extraction
techniques to separate out any bacterial products from the cells and media. Two extraction

60
protocols were used: ethyl acetate extraction and methanol extraction. The ethyl acetate
extraction technique yielded clean and positive results for the 15-6 sample. Additionally the
bacterial products suspended in ethyl acetate were much easier to dry down for resuspension
in set volumes, due to the volatile nature of ethyl acetate. The other extraction technique
utilized methanol for its suspension solvent. It was primarily used for sample 14-29 because
the sample was observed to only be successfully extracted using the methanol extraction
protocol. However, the methanol extracts contained significant amounts of particulate. These
samples had to be filtered using 0.2 micron filters before they could be analyzed using HPLC
to prevent them from clogging up the column. The results of the extraction protocols showed
that the success of the extraction depended on the target product. Ethyl acetate extraction
yielded a cleaner product, but not all molecules were soluble in it. Methanol, comparatively,
was able to extract out a wider variety of products than ethyl acetate. More products being
soluble in methanol resulted in messier samples that required additional filtering and testing to
ensure the antibacterial product was still present. Even though the two samples were
successfully extracted using ethyl acetate and methanol techniques, there is no guarantee that
all antibacterial products created by soil microbes will be. Because of this, other extraction
techniques such as dichloromethane based extraction or solid phase extraction methods should
be investigated. These new techniques could help extract different antibacterial samples and
could potentially show what types of chemicals unknown antibacterial products are soluble in.
This data could then be used to help analyze the chemical makeup, such as presence of
chlorine or amine groups, of the unknown antibiotic compounds.
The extracts from samples 15-6 and 14-29 were then analyzed and purified using a
C18 HPLC column. Using a solvent gradient of water with 0.1% formic acid and acetonitrile
with 0.1% formic acid, the samples were separated into twelve equal factions over the course
of one hour. Each of these fractions was then tested to determine at what time point the
antibacterial product passed through the column. This information was then matched to the
graphs created by the HPLC machine. The 15-6 sample was observed to elute through the
column into fraction six, at the 25-30 minute time period, due to the clear zone of inhibition
when tested against B.subtilis and E.coli. This was matched to the single peak recorded by the
HPLC machine within the 25-30 minute time period. The 14-29 sample showed a more
complicated result. When the fractions were tested using a zone of inhibition test, fractions
61
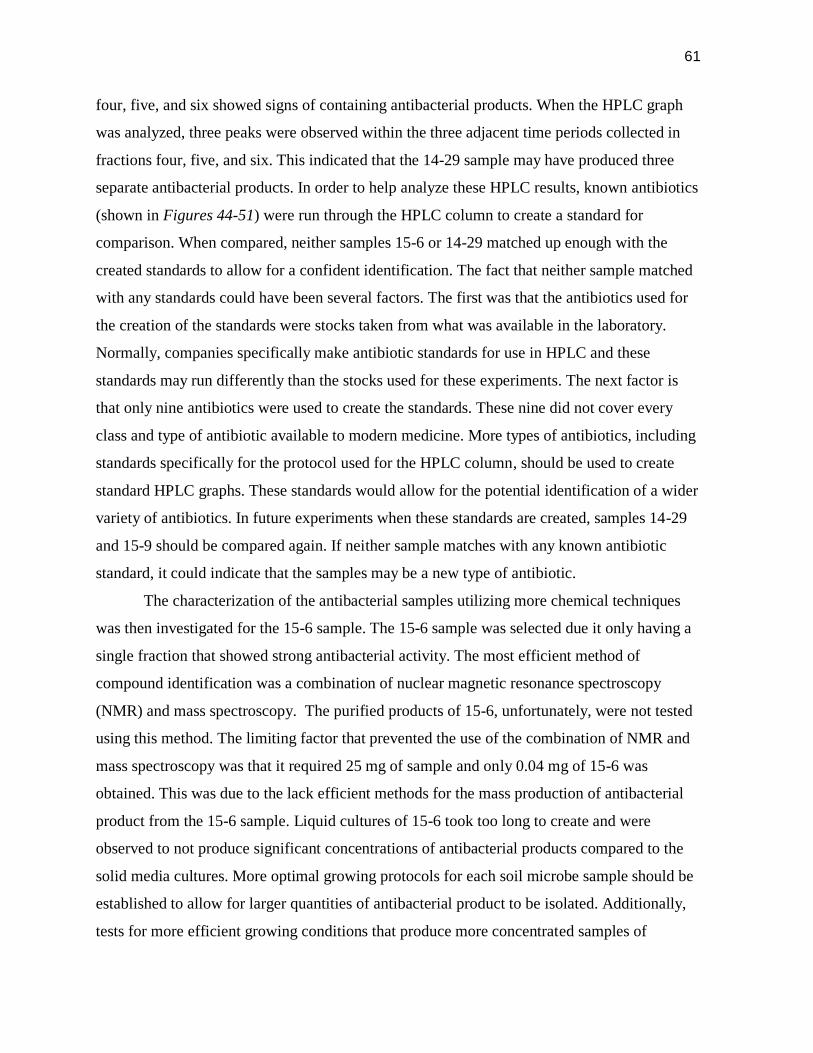
four, five, and six showed signs of containing antibacterial products. When the HPLC graph
was analyzed, three peaks were observed within the three adjacent time periods collected in
fractions four, five, and six. This indicated that the 14-29 sample may have produced three
separate antibacterial products. In order to help analyze these HPLC results, known antibiotics
(shown in Figures 44-51) were run through the HPLC column to create a standard for
comparison. When compared, neither samples 15-6 or 14-29 matched up enough with the
created standards to allow for a confident identification. The fact that neither sample matched
with any standards could have been several factors. The first was that the antibiotics used for
the creation of the standards were stocks taken from what was available in the laboratory.
Normally, companies specifically make antibiotic standards for use in HPLC and these
standards may run differently than the stocks used for these experiments. The next factor is
that only nine antibiotics were used to create the standards. These nine did not cover every
class and type of antibiotic available to modern medicine. More types of antibiotics, including
standards specifically for the protocol used for the HPLC column, should be used to create
standard HPLC graphs. These standards would allow for the potential identification of a wider
variety of antibiotics. In future experiments when these standards are created, samples 14-29
and 15-9 should be compared again. If neither sample matches with any known antibiotic
standard, it could indicate that the samples may be a new type of antibiotic.
The characterization of the antibacterial samples utilizing more chemical techniques
was then investigated for the 15-6 sample. The 15-6 sample was selected due it only having a
single fraction that showed strong antibacterial activity. The most efficient method of
compound identification was a combination of nuclear magnetic resonance spectroscopy
(NMR) and mass spectroscopy. The purified products of 15-6, unfortunately, were not tested
using this method. The limiting factor that prevented the use of the combination of NMR and
mass spectroscopy was that it required 25 mg of sample and only 0.04 mg of 15-6 was
obtained. This was due to the lack efficient methods for the mass production of antibacterial
product from the 15-6 sample. Liquid cultures of 15-6 took too long to create and were
observed to not produce significant concentrations of antibacterial products compared to the
solid media cultures. More optimal growing protocols for each soil microbe sample should be
established to allow for larger quantities of antibacterial product to be isolated. Additionally,
tests for more efficient growing conditions that produce more concentrated samples of

62
antibiotic product should be conducted. A wider variety of rich and minimal media cultures as
well as differential and selective media should be used to grow the bacterial cultures. Once
grown, any products should be extracted and analyzed to determine concentration. Other
alternate techniques such as attempting co-cultures of antibiotic producing bacteria against
E.coli or B.subtilis could also be analyzed. The bacterial culture used for the co-culture should
be tested to determine if it makes any antibacterial products beforehand, to prevent any
potential false positives.
Other potential identification methods should be investigated that allow for accurate
identification of complex molecules that require smaller samples. Future experiments should
consider investigating the use of tests such as UV and IR spectroscopy would be useful for
gathering additional data on the properties of isolated antibiotic samples (especially if they are
observed to produce fluorescence). Other tests such as paper chromatography could also be
useful for analytical purposes. Paper chromatography is not as specific as HPLC, NMR, or
mass spectroscopy when it comes to analyzing the chemical makeup of a compound.
However, paper chromatography may be useful in an undergraduate laboratory course setting.
The test is more simplistic to use and can be compared to standards created from well
documented antibiotics. This kind of test should be used by BB2905 and the results
documented to provide a jumping off point for further analysis.
Each step of the antibacterial identification pipeline was then summarized to key
protocol changes for use by the BB2905 laboratory course. The later steps of the pipeline
were noted to potentially be too time consuming and complicated for a seven week
undergraduate laboratory class to thoroughly complete. Common antibiotics are known to be
highly variable in terms of chemical structure and mechanistic class. An undergraduate
biology laboratory course would most likely be able to reach the purification of antibacterial
products into HPLC separated fractions. From here the creation of a connected chemistry or
biochemistry based laboratory course that focuses on characterizing and identifying unknown
antibacterial fractions from the biology class would be very advantageous. This course could
perform numerous experiments to test the chemical properties of the isolated samples. Even if
the second laboratory course is unsuccessful in fully identifying the unknown antibiotic, the
data gathered would still be valuable for the groups such as the Small World Initiative.
The purpose of this project was the creation of an antibiotics identification pipeline.
63
Utilizing techniques and antibacterial compound producing bacteria samples from the
BB2905 course, each step of the proposed pipeline was created and optimized. This pipeline
was designed to identify soil bacteria, detect if the identified bacteria produced any
antibacterial compounds, extract these antibacterial compounds, purify the extracts, and
characterize them. The protocols improved in this process allowed for the identification of
bacterial samples 15-6 and 14-29 to be in the Streptomyces and Brevibacillus genuses
respectively. This also allowed in the optimization of the 16s subunit PCR protocols, enabling
a higher sequencing success rate for future laboratory courses. 15-6 and 14-29 were also
confirmed to produce antibacterial compounds effective against E.coli and B.subtilis cultures.
The created pipeline was also able to extract 15-6 products using acetyl acetate extraction and
14-29 products using methanol extraction. These samples were then successfully purified
using an HPLC column to create isolated fractions of antibacterial products. Unfortunately,
the characterization of the purified fractions was not accomplished. NMR and mass
spectroscopy were to be used to characterize the fractions, but not enough product was
available for such testing. Future project groups and BB2905 courses should expand upon the
techniques tested by this project. A crucial component that should be investigated further is
the methods for producing larger quantities of antibacterial product from selected soil
microbes. Alternate characterization tests should also be investigated, such as UV
spectroscopy, to try to characterize purified samples while requiring less material to work
with. Other more basic chemical tests such as pH, polarity, and the separation of potential
products using paper chromatography should also be investigated. These tests might not be as
data rich as NMR or mass spectroscopy, but could be more practically implemented into
undergraduate biology, biochemistry, and chemistry laboratory courses. Additional input from
biochemistry and chemistry departments should be obtained to potentially create a new course
to tackle the challenge of identifying the many purified antibiotic samples that will be created
utilizing the pipeline created by this project.
64
References
Altschul SF, Gish W, Miller W, Myers EW, Lipman DJ. 1990. Basic local alignment search
tool. J Mol Biol 215(3):403-10.
American Chemical Society (ACS) and the Royal Society of Chemistry (RSC). 1999. The
discovery and development of penicillin [Internet]. [cited Oct. 6, 2016]. Available
from:
https://www.acs.org/content/dam/acsorg/education/whatischemistry/landmarks/flemin
gpenicillin/the-discovery-and-development-of-penicillin-commemorative-booklet.pdf
Buckholt MA. 2014. Amylase Test. BB 290X: Microbes to Molecules Protocols.
Center for Disease Control and Prevention. 2016. Antibiotic/Antimicrobial Resistance
[Internet]. [cited Oct. 7, 2016]. Available from: https://www.cdc.gov/drugresistance/
Chopra, I., Roberts, M. 2001. Tetracycline Antibiotics: Mode of Action, Applications,
Molecular Biology, and Epidemiology of Bacterial Resistance. Microbiology and
Molecular Biology Reviews: American Society for Microbiology. 65(2):232-260
Citron, K., Emerson, P.A., Joyce., R.B., et al.1968. Comparison of Side-Effects of
Tetracycline and Tetracycline Plus Nystatin. British Medical Journal. 4(5628): 411-
415.
Clardy J, Fischbach MA, Currie CR. 2009. The natural history of antibiotics. Current Biology
19(11):R437-41.
Cunha, B.A. 2001. Antibiotic Side Effects. Medical Clinics of North America. 85(1):149-85
DeLong EF and Pace NR. 2001. Environmental diversity of bacteria and archaea. Systematic

65
Biology. 50(4):470-8.
Eisenstein BI, Oleson FB,Jr, Baltz RH. 2010. Daptomycin: From the mountain to the clinic,
with essential help from francis tally, MD. Clin Infect Dis 50 Suppl 1:S10-5.
Fierer N, Breitbart M, Nulton J, Salamon P, Lozupone C, Jones R, Robeson M, Edwards RA,
Felts B, Rayhawk S, et al. 2007. Metagenomic and small-subunit rRNA analyses
reveal the genetic diversity of bacteria, archaea, fungi, and viruses in soil. Applied and
Environmental Microbiology. 73(21):7059-66.
Finch, R.G., Eliopoulos, G.M. 2005. Safety and efficacy of glycopeptide antibiotics. Journal
of Antimicrobial Chemotherapy. 55, Suppl. S2:ii5-ii13
Floss HG and Yu T. 2005. Rifamycin mode of action, resistance, and biosynthesis. Chem Rev
105(2):621-32.
Fumo, G., Akin, C., Metcalfe, D.D., Neckers, L. 2003. 17-Allylamino-17-
demethoxygeldanamycin (17-AAG) is effective in down-regulating mutated,
constitutively activated KIT protein in human mast cells. Blood. 103(3):1078-84
Handelsman J, Rondon MR, Brady SF, Clardy J, Goodman RM. 1998. Molecular biological
access to the chemistry of unknown soil microbes: A new frontier for natural products.
Chemistry & Biology. 5(10):R245-9.
Hermann T. 2007. Aminoglycoside antibiotics: Old drugs and new therapeutic approaches.
Cellular and Molecular Life Sciences. 64(14):1841-52.
Hernandez S, Tsang T, Handelsman J. 2015. Small World Initiative: Research Protocols.
Hof, H. 1994. Macrolides, a group of antibiotics with broad spectrum of activity. Immunität
und Infektion. 22(2):66-71
66
Holten, K.B., Onusko, E.M.2000. Appropriate Prescribing of Oral Beta-Lactams Antibiotics.
American Family Physician. 1;62(3):611-20
Ling LL, Schneider T, Peoples AJ, Spoering AL, Engels I, Conlon BP, Mueller A, Schäberle
TF, Hughes DE, Epstein S. 2015. A new antibiotic kills pathogens without detectable
resistance. Nature. 517(7535):455-9.
Macrolides. 2016. [cited Oct. 6, 2016]. Available from:
http://dhh.louisiana.gov/assets/oph/Center-PHCH/Center-CH/infectious-
epi/VetInfo/VetAntibioResSen/LADDL/AntimicrobialClasses/macrolides/Macrolides.
Malabarba A, Nicas TI, Thompson RC. 1997. Structural modifications of glycopeptide
antibiotics. Med Res Rev. 17(1):69-137.
Mingeot-Leclercq MP, Glupczynski Y, Tulkens PM. 1999. Aminoglycosides: activity and
resistance. Antimicrobial Agents and Chemotherapy. 43(4):727-37.
National Center for Biotechnology Information. PubChem Compound Database [Internet];
Penicillin G CID=5904, [cited Oct. 6, 2016]. Available from:
https://pubchem.ncbi.nlm.nih.gov/compound/5904
National Center for Biotechnology Information. PubChem Compound Database [Internet];
Streptomycin CID=19649, [cited Oct. 6, 2016]. Available from:
https://pubchem.ncbi.nlm.nih.gov/compound/19649
National Center for Biotechnology Information. PubChem Compound Database [Internet];
Vancomycin CID=14969, [cited Oct. 6, 2016]. Available from:
https://pubchem.ncbi.nlm.nih.gov/compound/14969
National Center for Biotechnology Information. PubChem Compound Database [Internet];
Erythromycin CID=12560, [cited Oct. 6, 2016]. Available from:

67
https://pubchem.ncbi.nlm.nih.gov/compound/12560
National Center for Biotechnology Information. PubChem Compound Database [Internet];
Daptomycin CID=16129629, [cited Oct. 6, 2016]. Available from:
https://pubchem.ncbi.nlm.nih.gov/compound/16129629
National Center for Biotechnology Information. PubChem Compound Database [Internet];
Polymyxin B CID=49800004, [cited Oct. 6, 2016]. Available from:
https://pubchem.ncbi.nlm.nih.gov/compound/49800004
National Center for Biotechnology Information. PubChem Compound Database [Internet];
Chloramphenicol CID=5959, [cited Oct. 6, 2016]. Available from:
https://pubchem.ncbi.nlm.nih.gov/compound/5959
National Center for Biotechnology Information. PubChem Compound Database [Internet];
Tetracycline CID=54675776, [cited Oct. 6, 2016]. Available from:
https://pubchem.ncbi.nlm.nih.gov/compound/54675776
National Center for Biotechnology Information. PubChem Compound Database [Internet];
Teixobactin CID=86341926, [cited Dec. 12, 2016]. Available from:
https://pubchem.ncbi.nlm.nih.gov/compound/86341926
Pankey, G.A., Sabath, L.D. 2004. Clinical Relevance of Bacteriostatic versus Bactericidal
Mechanisms of Action in the Treatment of Gram-Positive Bacterial Infections. Oxford
Journals. 38(6):864-870
Power DA and Johnson JA. 2009. Difco™ & BBL™ manual.
Prayle, A., Watson, A., Fortnum, H., Smyth, A. 2010. Side effects of aminoglycosides on the
kidney, ear and balance in cystic fibrosis. Thorax., 65(7):654-58
Small World Initiative. 2015. Our Approach [Internet]. [cited Oct. 6, 2016]. Available from:
68
http://www.smallworldinitiative.org/about/
Spellberg B and Gilbert DN. 2014. The future of antibiotics and resistance: A tribute to a
career of leadership by John Bartlett. Clinical Infectious Diseases. 59(suppl 2):S71-5.
Steenbergen, J.N., Alder, J., Thorne, G.M., Tally, F.P. 2005. Daptomycin: a lipopeptide
antibiotic for the treatment of serious Gram-positive infections. Journal of
Antimicrobial Chemotherapy. 55(3):238-288
Tomasz A. 1979. The mechanism of the irreversible antimicrobial effects of penicillins: How
the beta-lactam antibiotics kill and lyse bacteria. Annual Reviews in Microbiology.
33(1):113-37.
U.S. National Library of Medicine. 2016. Chloramphenicol Injection. Retrieved Dec 2, 2016
from: https://medlineplus.gov/druginfo/meds/a608008.html
U.S. National Library of Medicine. 2016.Rifampin. Retrieved Dec 2, 2016 from:
https://medlineplus.gov/druginfo/meds/a682403.html
Wehrli W. 1977. Ansamycins chemistry, biosynthesis and biological activity. In: Medicinal
chemistry. Springer. 21 p.
Wobbe CR. 2015. Methods for purifying and analyzing antibacterial compounds from soil
microbes in an undergraduate laboratory course. Department of chemistry and
biochemistry, Worcester Polytechnic Institute.
Yamamoto, S., Harayama S. 1995. PCR amplification and direct sequencing of gyrB genes
with universal primers and their application to the detection of taxonomic analysis of
Pseudomonas putida strains. Applied and Environmental Microbiology, 61(3):1104-
1109
Yim G, Wang HH, Davies J. 2007. Antibiotics as signalling molecules. Philosophical

69
Transactions of the Royal Society of London Series B Biological Sciences.
362(1483):1195-200.
Yu Z, Qin W, Lin J, Fang S, Qiu J. 2015. Antibacterial mechanisms of polymyxin and
bacterial resistance. BioMed Research International 2015.

70
Appendix I: Microbes to Molecules Freezer Stock Isolates
Year ID number Student initials Writing on tube
2014
14-1 DA DA & RH
14-2 ARB Baker
14-3 HMB col.1/col.3 HB 5/5/14
14-4 CAB CB Col 1/2
14-5 AHB AB IS 1/2
14-6 PDB SW6 Iso9 ; Iso20;
A,B,C
14-8 REC N/A
14-10 KMD KMD 5/5/14
14-11 RMG Rebecca German #18
SW11
14-12 RSG Rhiannon Goddard
SW12
14-13 CHH CH 23, CH 8
14-14 WJH WH RM SW14 SW23
14-15 RDH N/A
14-16 JLH EP JH SW26 SW16
14-17 AK AK SA
14-18 CBK N/A
14-19
GK
G.K. 11 SW19A; G.K.
24 SW19B

71
14-20 SNL SL1; SL2
14-21
CLL
SW21A 5/5/14 CL,
SW21B 5/5/14
14-22 KEL KL CT 5/5/14
14-23 RAM WH RM SW14 SW23
14-24 DMM DM
14-25 BNS
N/A
14-26 EJP
EP JH SW26 SW16
14-29 ER SW29A-D CR+ER
2015
15-1 LG
N/A
15-2 LG
N/A
15-3 JD/GS
N/A
15-4 JD/GS
N/A
15-5 KK
N/A
15-6 KK
N/A
15-7 VS
N/A
15-8 VS
N/A
15-11 EB N/A
15-14 KK N/A
15-18 BH
N/A
15-19 BH
N/A

72
15-20 BH
N/A
15-21 BH
N/A
15-24 SE
N/A
15-25 SE
N/A
15-26 KC
N/A
15-27 KC
N/A
15-28 CB/EP
N/A
15-32 SW/CM N/A
15-36 AP
N/A
15-37 AP
N/A
15-38 LG
N/A
15-39 LG
N/A
15-43 SL N/A
15-44 SL N/A
15-56 NF N/A
2016
16-1 NB
N/A
16-2 JB
N/A
16-3 JB
N/A
16-4 MH
N/A
16-5 AM
N/A

73
16-6 NS
N/A
16-7 DC
N/A
16-8 DC
N/A
16-10 MH
N/A
16-11 TN
N/A
16-12 HM
N/A
16-13 LM
N/A
16-14 LM
N/A
16-15 AW
N/A
16-16 HN
N/A
16-17 AH-M
N/A
16-18 AH-M
N/A
16-19 HM
N/A
16-20 - N/A
16-21 AS
N/A
16-22 AS
N/A
16-23 HN
N/A

74
Appendix II: Indole Assay Procedure
Goal:
To determine if tryptophanase is present in the bacterial isolate culture to give insight into the
metabolism of the isolate.
Materials:
● Test tubes
● Tryptone broth
● Bacterial isolates
● Kovac’s reagent
Methods:
The culture was grown in tubes containing tryptone broth (a broth high in tryptophan) at room
temperature for four days. After the incubation period a drop of Kovac’s reagent was added to
the culture tube and the tube was observed for a color change. A negative test will result in a
orange ring at the top of the liquid and a positive test will result in a purple ring at the top of
the liquid.