isolating the effects of electoral participation on ... · isolating the effects of electoral...
TRANSCRIPT

1
Isolating the Effects of Electoral Participation on
Political Efficacy and Political Trust
Victoria Shineman
Visiting Scholar
Center for the Study of Democratic Politics
Princeton University
Abstract: There is a rich literature discussing the effects of participation, and a
growing number of studies have tried to estimate proposed effects using empirical data.
However, empirical testing is difficult because participation is typically both voluntary
and costly, causing it to be partially determined by the characteristics it is theorized to
affect. Put simply, there is an endogeneity problem. This paper discusses theories
regarding how engaging in the act of participation might affect political efficacy and
political trust, and then contributes to the empirical literature through experimental
innovations which improve our ability to make valid causal inferences. An intensive
mobilization treatment was integrated into a panel survey conducted before and after
the 2011 San Francisco Municipal Election. Actual voter turnout was validated from
the official voter history file. The mobilization treatment increased participation by
over 33 percentage points, generating an excellent opportunity to isolate exogenously-
driven participation. The analysis uses assignment to the mobilization treatment as an
instrument for voter turnout, in order to isolate and estimate the independent effect of
being mobilized to vote on different dimensions of political efficacy and political trust.
Heterogeneous treatment effects are also identified, based on whether each subject
approved or disapproved of the electoral outcomes. This paper is part of a larger project
intended to isolate and estimate the effects of participation. Additional experiments and
observational studies will soon be integrated into the analysis.
Acknowledgements: I wish to thank Eric Dickson, Michael Laver, Henry Milner, Rebecca
Morton, Natalie Stroud, and Joshua Tucker for their helpful comments at various stages of
development. The experiment was made possible through a National Science Foundation
Doctoral Dissertation Improvement Grant (Award #1065771) as well as from grants received
from the Rita Mae Kelly Endowment Fellowship, the New York University Center for
Experimental Social Science, and the Wilf Family Department of Politics at New York
University. Previous versions of this paper were presented at the 2012 Democracy, Elections,
and Citizenship Research Group Workshop (Barcelona, Spain) and the 2013 Southern Political
Science Association Annual Meeting (Orlando, Florida).

2
Introduction
There is an extensive theoretical and empirical literature examining the individual and
institutional-level characteristics that affect political participation. There is also a growing
theoretical literature examining the effects of participation. However, with some exceptions,
existing empirical tests of the effects of participation are limited. The primary reason for this is
that the act of participation is typically a costly and voluntary action, and the characteristics
which this act might affect are also often characteristics which affect the decision to participate.
Put simply, there is an endogeneity problem. For example, it is difficult to tell whether the act of
participation increases political efficacy because people with higher political efficacy are also
more likely to participate.
This paper discusses some of the major theorized effects of participation, and then
subjects these theories to an empirical test through an experimental design that generated
exogenously-driven participation, thereby enabling the researcher to isolate causal inference. A
field experiment was integrated with a panel survey conducted before and after the 2011 San
Francisco Municipal Election. Subjects were surveyed before the election, and then half of them
were randomly exposed to an intensive mobilization treatment which successfully increased
electoral participation by more than 33 percentage points. Subjects were surveyed again after the
election, and actual voter turnout was verified with the official voter history file. A comparison
of post-election responses among voters and non-voters in the treatment and control groups
indicates whether being mobilized to vote caused significant changes in several categories of
opinion and behavior. Specifically, I test the effect of exogenously-driven participation on
political efficacy and political trust. The analysis also tests for heterogeneous treatment effects
based on whether or not each subject preferred the candidate who won the Mayoral election.
3
Section 1 provides a brief review of the theoretical mechanisms behind the proposed
effects of participation. Section 2 describes the experimental design implemented to test these
effects. Section 3 describes the methods of analysis and Section 4 presents and interprets the
results. In summary, the results find that being mobilized to submit a ballot in a local election
caused an increase in perceived voting power, perceived ability to engage the alternative voting
system used in that election, faith and confidence in the alternative voting system, trust in local
government, and also increased trust in state-level government among subjects who also
approved of the municipal electoral outcome. There were no significant changes, however, in
individual-level trust in the federal government or sense of political efficacy beyond the electoral
sphere. In several cases, the effects of participation were also stronger in cases where subjects
also approved of the electoral outcomes.
Section 1: Theory – The Effects of Participation
The political science literature includes numerous studies examining the predictors of political
participation. However, less attention has been paid to understanding how the act of engaging in
participation might also affect individual-level attitudes and behaviors. Classical democratic
theory argues that the act of participation not only influences electoral outcomes; participation
also plays an “educative role” that promotes civic engagement and democratic values, therefore
creating a cycle where engaging in participation further enhances the types of attitudes and
behaviors that make future participation more possible and likely (see Pateman 1970; Thompson
1970). Earlier democratic theorists posited that engaging in the act of participation would lead to
self-actualization as a political self (Rousseau, John Stuart Mill).

4
Defining Efficacy and Trust: The concepts of efficacy and trust are partially
intertwined, and both include multiple dimensions. Campbell, Gurin, and Miller (1954, p. 187)
characterized efficacy as the "feeling that individual political action does have, or can have, an
impact upon the political process, namely, that it is worthwhile to perform one's civic duties".
Initial empirical studies estimated efficacy through a 4-question index. Since then, there has been
much debate regarding the appropriate question wordings and conceptual divisions (e.g. Balch
1974; Abramson 1983; Finkel 1984; Madsen 1987; Craig and Maggiotto 1982; Acock, Clarke,
and Stewart 1985; Craig, Niemi, and Silver 1990; Niemi, Craig, and Mattei 1991; Morrell 2003;
Chamberlain 2012).
The modern concept of political efficacy is typically divided into two categories: internal
efficacy and external efficacy. Internal efficacy refers to an individual’s self-perception of his or
her own ability to engage politics, become informed, and meaningfully participate in the political
process. External efficacy refers to an individual’s self-perception of how responsive the
government is to citizen demands, and involves concepts of system legitimacy. Craig, Niemi,
and Silver (1990) further differentiate between two dimensions of external efficacy: regime-
based efficacy (viewing procedures and institutions as legitimate and responsive) and incumbent-
based efficacy (viewing individual representatives as responsive). External political efficacy has
been found to affect feelings that the system is responsive (Abramson and Aldrich 1982),
political trust (Balch 1974; Craig 1979), and diffuse system support (Wright 1976; Iyengar
1980).
The concept of political trust is typically divided into two categories: diffuse support for
the democratic system as a whole, or specific support for individual political actors or
institutions, such as the judiciary, the Congress, or the Presidency (Easton 1975). Incumbent-

5
based trust can also refer to trust in individual representatives (Craig, Niemi, and Silver 1990).
Figure 1 displays the most commonly discussed categories and sub-categories of political
efficacy and political trust.
Figure 1: Common Categories and Sub-Categories of Political Efficacy and Political Trust
Theory – Why Participation Increases Efficacy and Trust: There are several potential
mechanisms through which engaging in the act of participation could affect different dimensions
of political efficacy and political trust. Engaging in the act of participation makes the political
world seem less foreign, and causes the individual to feel more included in the democratic
process. This inclusion can increase approval of democratic institutions, and increase the
perceived legitimacy of the electoral process.
Engaging in the act of participation might also motivate an individual to develop a belief
that participation is worthwhile, in order to justify one’s behavior to oneself: “those who vote or
engage in campaign activities will justify their behaviour by strengthening their belief that the
political system responds to citizen involvement” (Clarke and Acock 1989, p. 553). Some argue
6
that the mere act of participation might cause people to be more likely to passively accept a
political regime. As people engage a system, they become more likely to consider the process of
that system as legitimate and appropriate (Ginsberg 1982). Regardless of whether individuals
have political power, engaging in participation might lead citizens “to believe they are ultimately
controlling the government… and keeping them committed to the existing system” (Olson 1982,
p. 6).
Previous Empirical Evidence – Overall Effect: Several studies have estimated the
effects of different types of participation on different dimensions of efficacy and trust. Finkel’s
(1985) three-wave panel study controls for attitudes during the first wave, and thereby isolates
the effects of electoral and campaign participation on internal and external political efficacy. He
finds that electoral and campaign participation increase external efficacy, but only have a
marginally significant effect on internal efficacy in cases where education is low. In a similar
panel study, Finkel (1987) again finds that electoral and campaign participation increase external
efficacy (and internal efficacy this time as well), but other types of participation – like peaceful
protest and aggressive action – do not have the same effect. Aggressive political action is
actually a predictor of decreased political efficacy.
Other studies have further explored how alternative types of participation might affect
efficacy in different ways. Semetko and Valkenburg (1998) find that political attentiveness leads
to increased internal efficacy. Bowler and Donovan (2002) find that greater access to direct
democracy increases internal efficacy, and Smith and Tolbert (2004, Chapter 4) find that direct
democracy increases external efficacy.
With regard to trust, Lundell (2012) finds that compulsory voting laws – which legally
require electoral participation – are associated with increased trust in government.

7
Previous Empirical Evidence – Heterogeneous Effects: Previous empirical literature
has also explored whether engaging in the act of participation might have divergent or
heterogeneous effects on efficacy and trust, depending on other characteristics which might vary.
A commonly explored question is whether the effects of participation are different depending on
whether or not the outcome of the election is favorable to the participant.
Heterogeneous Effects – Winners and Losers: The section above described reasons
why engaging in the act of participation might increase political efficacy and trust. Additionally,
the effects of participation might interact with approval of the electoral outcome (Clark and
Acock 1989). For example, an individual who voted for a winning campaign might experience
an increase in internal efficacy because he or she might perceive the success of their preferred
candidates as evidence that the act of participation was effective. The opposite response would
be expected from an individual who participated in an election where a non-preferred candidate
was elected; casting a vote for a candidate that does not win might cause a citizen to doubt the
strength of his or her ability to influence political outcomes, decreasing internal efficacy.
Clarke and Acock further suggest that approval of the outcome might affect internal
efficacy, regardless of whether one participated: a victory of a preferred candidate suggests that
“people like me” can influence politics (increasing internal efficacy). Approval of the outcome
might also affect external efficacy, even without participation. Because a preferred candidate will
be more likely to support preferred policies, an individual might see the regime as more
responsive if her preferred candidates win. Similarly, living in a society governed by an opposing
party might make a citizen less likely to perceive of the government as responsive to society.
Clarke and Acock (1989, p. 553) suggest that although a favorable outcome can affect
both types of efficacy for a non-voter, the effects on external efficacy are likely to be stronger

8
than the effects on internal efficacy, because internal efficacy is “anchored by relatively stable
personality traits such as ego strength and self-esteem and, thus, should not fluctuate markedly in
reaction to ongoing political events such as elections”, whereas external efficacy concerns
overall government responsiveness, and so is more sensitive to raw electoral outcomes.
Several empirical tests have estimated the differential effects of participation among
winners and losers. Clarke and Acock (1989) estimate the effects of participation alone, approval
of the outcome alone, and the interaction of participation and approval of the outcome. They find
that although the act of participation increases efficacy among electoral winners, participation
alone has no significant effects. They also find that approval (and awareness) of electoral results
produces increased efficacy. The authors conclude that approval of election results matters more
than whether or not one participated.
Madsen (1987) finds that Indian citizens who submitted successful petitions to
government increased their self-efficacy, but did not change their perception of government
responsiveness. On the contrary, citizens who submitted unsuccessful petitions to government
did not view themselves as efficacious, and decreased their view of government responsiveness.
Therefore winning increased internal efficacy and losing decreased external efficacy.
In a comparison across varied levels of direct democracy, Bowler and Donovan (2002)
find that respondents experienced decreased efficacy if they identified with a losing presidential
candidate or a party whose Senate candidate lost the election. Valentino and Gregoriwicz (2009)
find that participation alone increases internal and external efficacy, and that participation has a
bigger effect among those who approve of the candidate who wins the election. Esaiasson (2011)
finds that electoral losers maintain their support of a democratic system, so long as a minimal
standard of fairness is met; however, electoral winners increase their support of democratic and
9
electoral systems. Nadeau and Blais (1993) find that an electoral loser is more willing to view
the resulting political system as legitimate if that individual participated in the election.
However, strong negative feelings about a winning party can produce a decrease in diffuse
support. Anderson and LoTempi (2002) find that people who support a presidential loser have
less trust after an election, but there is no difference in attitude among those who voted for a
Congressional loser.
There is evidence that successful participation – more generally speaking – also produces
divergent effects. For example, Gastil, Black, Deess, and Leighter (2008) find that participation
in jury deliberations increases trust in the jury process, confidence in judges, and a larger sense
of system responsiveness. They also find that conclusive deliberations and deliberations viewed
as “high quality” produce even stronger effects.
Other Heterogeneous Effects: Other studies have suggested that engaging in
participation might have differential effects based on individual-level political attentiveness,
education, age, and other characteristics.
Overall, the theoretical and empirical evidence provides compelling reasons to believe
that engaging in the act of participation might increase political efficacy and political trust, and
also that the effects of participation might be unique across different subgroups of the
population. Given the combined limitations of the causal inference provided by previous
empirical studies, I offer a new empirical investigation aimed at estimating changes in trust and
efficacy among a population who is exogenously motivated to participate in an election.

10
Section 2: Experimental Design
Overview: The experimental design consisted of a mobilization treatment integrated into a panel
survey conducted before and after the November 8, 2011 San Francisco Municipal Election,
during which the citizens of San Francisco elected their Mayor, Sheriff, and District Attorney,
and voted on eight ballot propositions. The mobilization treatment reduced the cost of
registration and voting, and additionally offered citizens a financial incentive to vote.
Case Selection: San Francisco Municipal Election: In the November 2011 Municipal
Election, San Francisco elected three different city-level offices: the Mayor, the Sheriff, and the
District Attorney. All three contests were non-partisan, and were elected using ranked choice
voting (RCV), a preferential voting system.1
The 2011 San Francisco Municipal Election was an ideal case in which to apply the
experimental design for several reasons. First, a municipal election was likely to have lower
voter turnout than a higher level election. Having low turnout in the baseline group is key to
enabling a strong mobilization treatment, and therefore essential for providing a powerful
opportunity to test the hypotheses. Second, San Francisco has remarkably progressive voter
turnout laws, which maximized the ability for the mobilization treatment to reduce the costs of
participation.2 Third, the combination of three offices elected through an alternative voting
1 RCV enables voters to indicate up to three ranked preferences in each contest,
differentiating between their first choice, second choice, and third choice. If no candidate
receives a majority of the first choice votes, the candidate with the fewest first-choice votes is
eliminated, and those ballots are redistributed to the next choice indicated on the ballot. All the
votes are then re-counted, and the process continues until a single candidate has a majority of
first-choice votes.
2 For the 2011 Municipal Election, San Francisco allowed registration to occur up until
15 days before the election, any citizen was able to request to vote by mail up until one week
11
system with eight referenda on the ballot provided the researcher with multiple opportunities for
measuring different categories of political efficacy and trust. Fourth, the city of San Francisco
maintains a well-kept voter history file, and makes this file available for scholarly research
purposes. Access to the voter history file was critical for verifying actual voter turnout. And
lastly, the 2011 San Francisco Municipal Election was a case where it was possible to offer
incentives for participation. It is illegal to offer money or other material incentives in exchange
for voting in all federal elections and within 48 states, but incentivizing participation is not
forbidden in local elections in California (see Hasen 2000; Nichter 2008; and CA Election Code
Sections 18520-18524).
Recruitment: Subjects were recruited through announcements made in classrooms at
City College San Francisco (Ocean and Downtown Campuses) and through postings in online
job forums, including backpage.org, craigslist.org, and the San Francisco Chronicle’s online
classified section. The study was advertised as a money making opportunity, where participants
would earn $25 for filling out two surveys about 6 weeks apart from each other.
Treatment Assignment and Pre-Treatment Survey: A brief pre-treatment survey was
used to screen subjects for eligibility, as well as to gather basic demographic information that
was used to stratify the treatment assignment. Random treatment assignment was intended to
split the full sample into groups that were comparable before the treatment was administered.
Stratified randomization prevents imbalance between treatment groups, enabling stronger
statistical power and increasing opportunities for subgroup analysis (Kernan, Viscoli, Makuch,
before the election, early voting opened at City Hall one month before the election, voters were
not required to produce identification, there was no minimum residency requirement to register
to vote, polling places were close in proximity, and any registered citizen was able to cast a
provisional ballot at any polling place in the city.
12
Brass, and Horwitz 1999). Treatments were also randomized over time, to create balance in the
time of day and the proximity of the election. All subjects completed the first survey in person at
an office in downtown San Francisco.
Experimental Treatments: The mobilization treatment consisted of several elements
and was sequential in nature, including three stages. The first stage of the mobilization treatment
was delivered in person immediately afterward, one-on-one, in a private office. All subjects were
contacted by e-mail twice more before the second survey, once to confirm participation in the
study, and once to send details about the upcoming second survey. The second and third stages
of the mobilization treatment were also integrated into these e-mails.
Mobilization Treatment – Stage 1: Stage 1 consisted of two parts, one designed to
subsidize participation costs as much as possible, and the other designed to incentivize
participation. To reduce the cost of voting, each subject received a 14-page packet of information
(Appendix A: Mobilization Treatment Packet) prepared from official government sources,
including the details on how to register to vote, verify registration, request a vote-by-mail ballot,
how to submit a vote-by-mail ballot, where and when to vote early, what the ballot will look like,
how to fill in the ballot, how the voting system (ranked-choice voting) counts the votes, and how
to properly mark a ranked-choice ballot. Subjects were also offered a voter registration card, so
they could register, update their address, or request an absentee ballot, and the researcher offered
to return the registration card for the subject.3
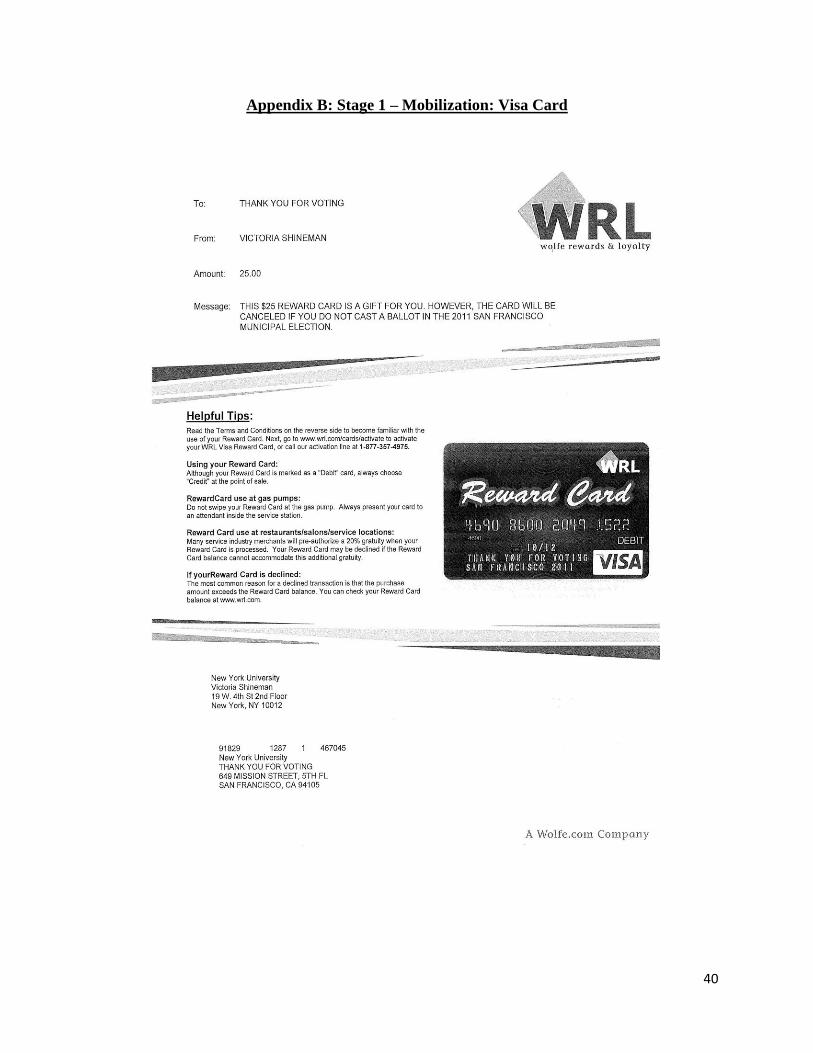
To incentivize participation, the mobilization treatment also provided each subject with a
prepaid $25 Visa gift card. In place of a name, the card read “THANK YOU FOR VOTING,
3 In total, 49 of the 179 subjects (27.4%) filled out a voter registration card for one of
these purposes, and then gave me the card to submit on their behalf. The other 130 subjects
either refused to take a registration card, or took a card with them.

13
SAN FRANCISCO 2011”. Figure 1 displays a picture of the Visa Card, and Appendix B (Visa
Card Handout) displays the full handout given to subjects.
Figure 1: Mobilization Treatment: $25 Prepaid Visa Card
After handing subjects the Visa card and describing it as a “gift for you”, the researcher recited a
memorized script (Appendix C: Visa Verbal Script) that explains the following: (1) The $25 is
already on the card, and the subject can spend it however he or she would like; (2) The card has
not been activated yet; (3) I (the researcher) have the activation code; (4) I will activate the card
after the upcoming municipal election; (5) However, if for whatever reason, the subject does not
cast a ballot in the election, I will cancel the card and “take the money back”; and (6) I will
verify whether or not the subject cast a ballot with the official voter turnout record from the
Election Office. A more detailed summary of this information was also appended to the
mobilization packet (see Appendix A), to provide subjects with a written record of the terms.
The Visa card treatment was designed to capture as much as possible the notion of a fine for not
voting, as opposed to a reward for voting. This was intended to mimic the conditions of
compulsory voting, as well as to capitalize on the behavioral observation that people respond
more to concerns of losing money they already have than they do to prospects of receiving new
money.
14
Mobilization Treatment – Stage 2: All subjects completed the first survey and received
the first stage of the treatment between October 11th
– October 24th
, 2011. The second stage of
the treatment was delivered via e-mail on October 28th
. An e-mail was sent to all subjects,
confirming their participation in the study, and reminding them that the second survey would be
sent via e-mail on November 9th
. For subjects receiving the mobilization treatment, the October
28th
e-mail also included a reminder about the upcoming election, a reminder about the terms of
the $25 Visa card, and a list of resources intended to make it easier to vote: including a list of
different methods of voting, links to the Election Office website, and details on registration and
turnout deadlines. (Appendix D: Stage 2, E-mail #1)
Mobilization Treatment – Stage 3: An e-mail was sent to all subjects on November 7th
,
2011 – one day before the election. This e-mail was a reminder that the second survey would
begin in two days, on November 9th
, 2011. It also informed subjects that all participants who
complete the second survey within 24 hours of receipt will be entered into a lottery, and one
random winner will be selected to receive an additional $100 bonus. The lottery was intended to
motivate subjects to fill out the survey while the election was still fresh in their memory.
For subjects receiving the mobilization treatment, the November 7th
e-mail also included
another reminder that the election was tomorrow, included information about how and where to
vote, and included a reminder that the $25 Visa card would be canceled if the subject did not cast
a ballot in the election (Appendix E: Stage 3, E-mail #2). Although I cannot verify whether all
subjects received or read the e-mails in Stages 2 and 3, all subjects received the link to the
second survey via an e-mail sent to the same e-mail address, so all e-mail addresses were
confirmed when subjects completed the post-election survey.

15
The mobilization treatment was intentionally designed to increase participation without
appealing to the content of the election or appeals to civic duty or other normative appeals. The
treatment was intended to increase participation entirely by reducing instrumental costs and
increasing instrumental incentives to submit a ballot.
Information Treatment: An information treatment was also provided to half the
subjects receiving the mobilization treatment and half of the subjects receiving the mobilization
control, generating a 2x2 treatment design. The information treatment provided subjects with
neutral information about the candidates and ballot measures, including links to watch candidate
debates online, links to candidate websites, and a copy of excerpts from the official voter
pamphlet (see Appendix F: Stage 1: Information Treatment – Handout, and Appendix D: Stage
2, E-mail #1). All resources were copied directly from official government sources, and were
intended to provide unbiased information about the election. All models in the analysis include a
control variable for whether or not each respondent received the information treatment.
Post-Election Survey: The post-election survey was conducted online through Qualtrics.
The San Francisco Municipal Election took place on November 8th
, 2011. An e-mail was sent to
all subjects on Wednesday November 9th
, 2011, including a unique personal link to the second
survey. Subjects were instructed that they have one week to finish the survey, and were
encouraged to complete the survey within 24 hours, in order to be entered into a lottery to win a
$100 bonus prize. The lottery prize was quite effective: more than 70% of subjects completed the
survey within 24 hours. All subjects who completed the second survey were sent a $25 check in
the mail. In total, 96.9% of eligible subjects (349/360) who completed the first survey also
completed the second survey.
16
Verifying Voter Turnout: After the election, I acquired access to the confidential
version of the Voter History File from the San Francisco Department of Elections. I used this file
to validate the actual voter turnout of all subjects in the study, matching based on name, date of
birth, gender, and both home and mailing addresses.
Section 3: Methods
The analysis embraces the notion of “potential outcomes”, which supposes that each actor has a
potential reaction to each treatment assignment, even though only one realized outcome can be
observed in the actual world. The counterfactual outcome is not observed, but is still meaningful,
and can be estimated. To claim there is a treatment effect means an actor’s observed outcome
under the assigned treatment is different from the same actor’s counterfactual outcome under a
different treatment.
Model Specification: The key independent variable of interest is electoral participation,
and the mobilization treatment was intended to increase participation. The experimental design
sought to maximize the conditions that would create a baseline group with minimal turnout and a
treatment group with maximal turnout, in order to observe and test the consequences of
mobilized participation. However, some subjects in the mobilization treatment did not cast
ballots in the 2011 election, and some subjects who did not receive the mobilization treatment
cast ballots in the election anyway. Because there is not a perfect correlation between the
treatment assignment and the independent variable of interest (voter turnout), a multiple equation
model is necessary for isolating the effects of participation. In order to isolate the effects of being
mobilized to vote, I estimate the local average treatment effect (LATE) – or complier-average
causal effect (CACE).
17
We can differentiate four categories of subjects based on whether they received the
mobilization treatment (Zi), and whether they cast a ballot (Di). A subject assigned to the
mobilization treatment will have Z = 1; all other subjects will have Z = 0. A subject who casts a
ballot will have D = 1, and a subject who does not cast a ballot will have D = 0. Following
Angrist, Imbens, and Rubin (1996), I refer to subjects who would vote under either treatment
assignment (D | Z(0) = 1; D | Z(1) = 1) as “always takers”, and refer to subjects who would not
cast a ballot under either treatment assignment (D | Z(0) = 0; D | Z(1) = 0) as “never takers”.
Those who would ballot without the treatment, but would not ballot with the treatment (D | Z(0)
= 1; D | Z(1) = 0) are called “defiers”. Lastly, those who would not vote without the treatment,
but would submit ballots with the treatment (D | Z(0) = 0; D | Z(1) = 1) are called “compliers”.
The compliers are a particular sample of interest, because they are the ones whose actual
electoral participation increased in response to the treatment. Isolating changes in attitudes
among the compliers estimates the effects of being mobilized to vote.
Estimating the effects of mobilized balloting on any of the dependent variables of interest
is complicated because the act of casting a ballot might also be partially caused by each of these
dependent variables. In order to isolate the independent effect of balloting on each dependent
variable, a third variable is needed for leverage, which affects the decision to ballot, but does not
affect the other variables. As an example, I explain the method below using perceived voting
power as the dependent variable. I use an identical statistical approach to estimate the effects of
participation on all eight estimates of political efficacy and trust.
Mobilization studies with imperfect contact rates (e.g. Green, Gerber, and Nickerson
2003) use “intent to treat” (random treatment assignment) to isolate the effect of the “received
treatment” (mobilization contact) on the outcome of interest (voter turnout). This is effectively
18
the same method as using treatment assignment as an instrumental variable. I follow in a similar
manner, except I treat validated voter turnout (casting a ballot) as the treatment, and treat
perceived voting power as the outcome of interest. Because the act of voting is endogenous to
one’s perceived voting power (e.g. people who think their vote has power will vote more often),
the randomly assigned mobilization treatment is necessary in order to isolate exogenously driven
participation. Once exogenous participation is identified, it can be used to estimate the effect of
participation on political efficacy. In this analysis, I consider the mobilization treatment as the
“intent to treat” and measure validated voter turnout as the “delivered treatment”.
Formally, the model consists of the following simultaneous equations. The linear effect
of casting a ballot on political efficacy would read as follows:
[1A] Yi = B0 + (B1 * Di) + ei
where Yi is a continuous measure of individual-level post-election political efficacy, and Di is a
binary {0, 1} variable indicating whether the respondent cast a ballot. In this equation, B0
represents the constant term (or the baseline score of perceived voting power) and B1 represents
the treatment effect: namely, what is the effect of participation on perceived voting power.
Because Di is endogenous to Yi (increasing perceived voting power also makes a person more
likely to submit a ballot), a second equation is added, leveraging the effect of the treatment
assignment on the act of balloting:
[2A] Di = (c * Zi) + vi
In this equation, Zi is a dummy variable indicating whether the respondent was assigned to the
mobilization treatment and c represents the effect of the mobilization treatment on the decision to
19
ballot, or the rate of “received treatment” among those assigned to the treatment. The average
treatment effect is divided by the rate of received treatment, in order to isolate the effect of the
received treatment. This method of analysis is effectively the same as using random assignment
to the mobilization treatment as an instrumental variable to leverage the independent effect of
balloting on political efficacy. Angrist, Imbens, and Rubin (1996) demonstrate that this approach
can successfully estimate the treatment effect on the compliers, or the local average treatment
effect (LATE), as long as five key assumptions are met. I discuss each of these assumptions in
turn.
The first assumption (Stable Unit Treatment Value Assumption, or SUTVA) requires
that a person’s potential outcomes under all treatment assignments are unaffected by the
treatment assignments given to all other actors. This experimental design might have violated
SUTVA because the recruitment method potentially drew subjects from within common
networks. If a subject from the baseline group happened to interact with a subject assigned to the
mobilization treatment, the baseline subject might have inadvertently been exposed to an
increased chance of voting. Minimal spill over might have occurred, but the frequency should be
minimal. Furthermore, any spillover effects would increase the participation within the baseline
category, suggesting any bias introduced by SUTVA violations would favor the null hypothesis.
The second assumption requires that the assignment to the mobilization treatment was
randomly assigned. The experimental design used a pre-survey questionnaire to randomize
treatment assignment within a stratified block design, thereby combining random assignment
with an intentional balance of key variables of interest. Additional information was gathered
about each subject in the pre-treatment survey, enabling a more thorough verification of balance
across the treatment groups. Treatment was assigned randomly, so any imbalance was due to

20
chance. However, demonstrating balance across the treatment groups increases confidence in the
accuracy of the estimated treatment effects.
Subjects between treatment groups were balanced on gender (52% female), age (average
= 37), race (53% white, 20% Asian, 10% black, 10% Hispanic), marital status (9% married),
number of years living at their current address (7.6 years on average), strength of partisan
identity (average of 1.95 on a 3-point scale), voter registration status (78% registered pre-
treatment), ideological orientation (3.5 on an 11-point scale), political interest, previous voting
history, self-reported history of non-electoral forms of participation, and self-predicted
probability (pre-treatment) of voting in the upcoming municipal election. By chance, there were
some significant differences with regard to education, employment, and the percent of subjects
who have children. Appendix G provides a fuller presentation of characteristics of the sample,
and displays the similarities and differences between treatment groups.
The third assumption (The Exclusion Restriction) requires that the instrumental variable
can only affect the outcome through its effect on the treatment. This means that being assigned to
the mobilization treatment can have no direct effect on any of the dependent variables. The
mobilization treatment can only affect each variable through its effect on increasing turnout. The
mobilization treatment was intentionally designed to avoid normative content and appeals related
to electoral outcomes. Whereas mobilization appeals which appeal to civic duty or the
importance of local government might have spillover effects into the dependent variables being
studied in this paper, it seems unlikely that an instrumental adjustment in the costs or incentives
of participation alone would have this effect.
The 4th
Assumption requires that the average effect of the instrument (assignment to the
mobilization treatment) on the treatment (validated voting) is nonzero. The mobilization

21
treatment was incredibly successful at increasing voter turnout. Table 1 presents the validated
voter turnout rates in each treatment group for the last five elections.4 There were differences in
the rate of voter turnout across treatment groups in previous elections, but no group voted
consistently more or less often than the others. The largest deviation is seen among subjects who
received only the information treatment and subjects who received both treatments; both of these
groups voted substantially more often in 2010.
Table 1: Validated Voter Turnout, by Treatment Group
Validated
Voter Turnout
San Francisco
Population Baseline
Information
Only
Mobilization
Only
Information +
Mobilization
2011
Municipal
Election
42.5 46.1 57.1 83.1 86.2
2010
General
Election
61.0 43.3 58.8 43.5 47.6
2010
Primary
Election
34.7 22.2 34.1 28.2 32.1
2009
Municipal
Election
22.6 19.1 22.6 21.3 16.1
2009
CA Special
Election
28.1 24.4 20.5 21.4 25.6
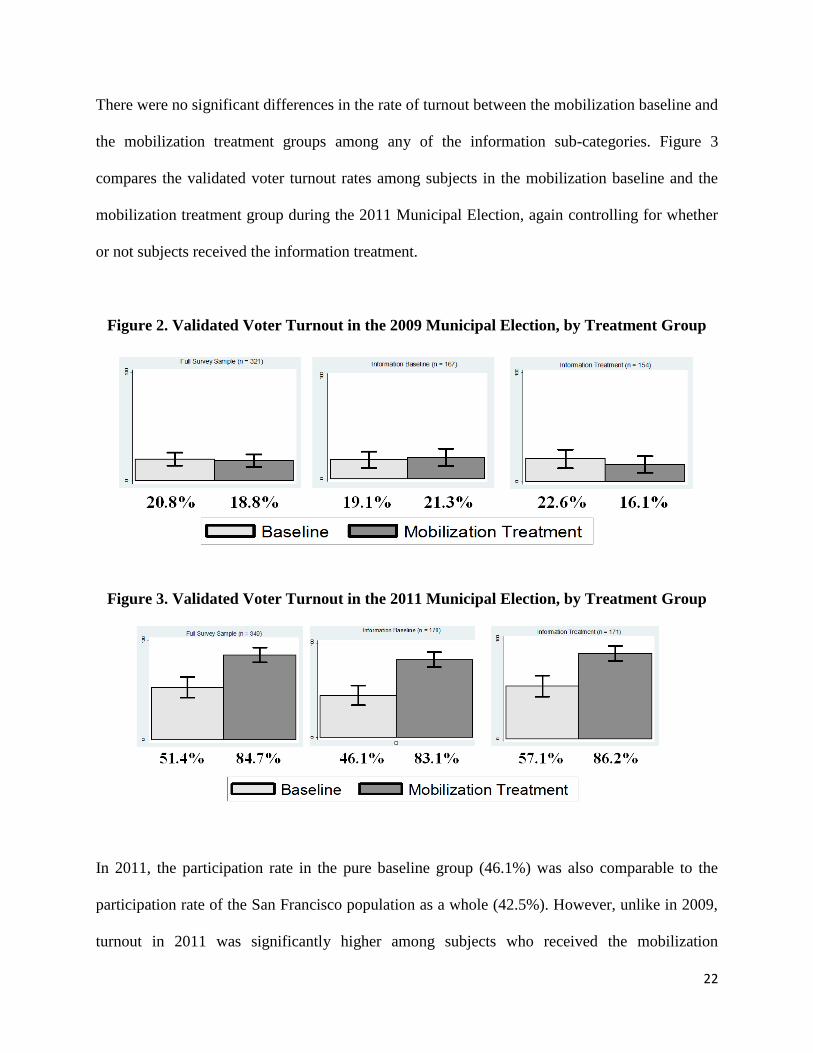
Figure 2 compares the validated voter turnout rates among subjects in the mobilization baseline
and the mobilization treatment group during the previous Municipal Election in 2009, controlling
for whether or not subjects received the information treatment in 2011. In 2009, about 20% of
the sample participated in the election, comparable to the San Francisco city average (22.6%).
4 All voter turnout data was validated through the San Francisco official Voter History
File. In order to account for subjects who were under the age of 18 before 2011, I calculate the
rate of validated voter turnout only among subjects who were eligible to vote during each
election.
22
There were no significant differences in the rate of turnout between the mobilization baseline and
the mobilization treatment groups among any of the information sub-categories. Figure 3
compares the validated voter turnout rates among subjects in the mobilization baseline and the
mobilization treatment group during the 2011 Municipal Election, again controlling for whether
or not subjects received the information treatment.
Figure 2. Validated Voter Turnout in the 2009 Municipal Election, by Treatment Group
Figure 3. Validated Voter Turnout in the 2011 Municipal Election, by Treatment Group
In 2011, the participation rate in the pure baseline group (46.1%) was also comparable to the
participation rate of the San Francisco population as a whole (42.5%). However, unlike in 2009,
turnout in 2011 was significantly higher among subjects who received the mobilization

23
treatment. A significant increase in turnout is observed among the sample as a whole, as well as
among the sub-sample comparisons within the information baseline and the information
treatment groups. The mobilization treatment increased voter turnout from 51.4% to 84.7%
overall, an increase of 33.3 percentage points.
The mobilization treatment intentionally combined several mobilization strategies in
order to generate a strong increase in voter turnout. The resulting increase in electoral
participation was substantial, and is significantly higher than increases in turnout generated by
typical mobilization studies. Analysis of the validated voter history file suggests that the
mobilization treatment is a strong instrument for electoral participation.
The 5th
Assumption (Monotonicity) requires that there are no defiers, or subjects who
would vote without the mobilization treatment, but would not vote with it. Although scholars
have introduced concerns that introducing monetary considerations in scenarios where actors
were previously motivated by other concerns might “crowd out” intrinsic incentives (Gneezy and
Rustichini 2000; Panagopoulos 2008) it seems highly unlikely that any subject who was planning
to vote would decide not to vote after being offered a $25 bonus for this behavior. Given these
five assumptions, the models estimating the LATE will isolate the direct effects of casting a
ballot on each of the dependent variables.
Testing for Heterogeneous Treatment Effects: I estimate the effects of being mobilized
to vote on each dependent variable. I also test for heterogeneous treatment effects, to see if the
act of participation affected citizens differently, based on whether or not they approved of the
outcome of the election. I do this by estimating the effect of the interaction of outcome approval
with voter turnout, while also controlling for outcome approval, as follows:
24
[1B] Yi = B0 + (B1 * Di) + (B3 * Di * Ai) + (B2 * Ai) + ei
where Ai indicates the respondent’s relative approval of the electoral outcome. Because voter
turnout (Di) is endogenous to the dependent variables in question (Yi), the interaction between
voter turnout and approval of the electoral outcome (Di * Ai) is also endogenous to Yi. In order
to properly identify the model, I adjust the second equation by adding an additional instrument:
the interaction between approving of the electoral outcome with being assigned to the
mobilization treatment. The revised second equation is as follows:
[2B] Di = (C1 * Zi) + (C2 * Zi * Ai) + vi
Estimating Approval of Electoral Outcome: I calculate approval of the electoral outcome by
interacting each respondent’s self-identified preferences regarding candidates and ballot
referenda with each respondent’s beliefs as to what the election results were.5
5 I use perceived election results as opposed to actual election results for two reasons.
First of all, the argument that election results might interact with participation is based on the
individual voter responding to a particular outcome. Feeling like a “winner” or “loser” or
developing expectations regarding future policies all depend on a voter’s perception of what the
results of the election were. If particular subjects are unaware or misinformed as to what the
outcome is, this would affect how subjects respond to the results.
The 2011 San Francisco case further aggravated the need to use perceived results,
because the election results were not fully determined or distributed by the media at the time
when many subjects completed the post-election survey. The city of San Francisco had to verify
all of the vote-by-mail and provisional ballots before those ballots could be counted.
Furthermore, because the Mayoral election was quite competitive, the ranked-choice ballots had
to be redistributed and recounted through twelve separate rounds of elimination before Edwin
Lee was finally declared the majority winner. As such, the results of the election were not
25
The post-election survey asked subjects to identify which candidate they thought was the
winner for each of the three electoral contests. I code this variable as each subject’s perceived
winner for each contest.6 In total, 85.4% of subjects correctly identified Edwin Lee as the
Mayoral winner. Subjects also identified which candidate they most preferred in each contest.
For each subject, I generate an approval score for each election, indicating whether the subject
thought that their most preferred candidate won the election. If a subject thought that their
preferred candidate won the election, the approval score is coded as +1. If a subject had a most
preferred candidate but thought a different candidate won, the approval score is coded as -1. If a
subject either had no preference in a contest, or was unsure who won that election, the approval
score is coded as zero. I then add up the approval scores for each of the three contests to create
an index measure, ranging from -3 to +3.
I then create an approval score for the eight ballot referenda using a similar method. All
subjects identified whether they approved or disapproved of each referenda, on a 5-point scale
(ranging from -2 to + 2). Subjects also identified what they believed the outcome was for each of
announced until late the next day, and were not widely distributed through the media until at
least two days after the election.
The post-election survey was distributed the day after the election, and more than 70% of
subjects completed the survey within 24 hours. It is likely that knowledge of election results
would have been higher among all groups if the survey had been after all results had been
finalized and fully distributed through the media. Because many citizens were likely unaware or
unsure of the actual outcomes when the second survey was completed, a measure of perceived
outcomes is preferable to a measure of actual electoral outcomes.
6 Eighty four subjects indicated that they didn’t know who won the election, but 23 of
these subjects did name a particular candidate as the one who received the most “1st choice”
votes in the election. In cases where a subject did not name a winner, I substitute the candidate
thought to have received the most 1st choice votes as the perceived winner.
26
the referenda, on a 5-point scale.7 I interact these two variables to create an approval score for
each perceived referenda outcome, such that higher scores mean a subject strongly approved
(disapproved) of a referenda they were confident was approved (disapproved), and lower scores
mean a subject strongly disapproved (approved) of a referenda they were confident was
approved (disapproved). Weaker preferences or less certainty over the outcome yield scores
closer to zero. Non-existent preferences or unknown outcomes are coded as zero. I add up the
approval score for each of the referenda to create an index of how much each subject approved
or disapproved of the referenda results overall.
I then re-scale the index of approval of the candidate elections and the index of approval
of referenda results so each index ranges from -1 to +1, and I add both scores to create an index
representing each subject’s approval of the overall results of the election as a whole. I then re-
scale this index, so that it ranges from -100% to +100%, with -100% indicating maximum
disapproval of all election outcomes, and +100% indicating maximum approval of all election
outcomes.
Dependent Variables: All dependent variables are constructed based on data collected in
the post-treatment (and post-election) survey.
Political Efficacy: The survey included several questions intended to measure subjects’
level of political efficacy. External efficacy was targeted by two questions about whether the
subject felt like he or she was able to affect the democratic process: subjects were asked to
indicate whether they agreed or disagreed with the following statements: (1) “I feel like my vote
7 The referenda outcome questions allowed subjects to indicate both the perceived
outcome of each referendum, as well as the level of confidence the subject had about whether
they knew the outcome.

27
can make a difference”; and (2) “I feel politically empowered”. Both variables were re-scaled
from 0-100, with higher numbers meaning more agreement with the statement.
Internal efficacy was targeted in two ways. The first intended to capture whether a
subject felt capable of becoming informed about local politics. The survey asked subjects to
indicate whether they agreed or disagreed with the following statement: “It is easy for a citizen to
become informed about local politics”. Again, I re-scale responses to this question from 0-100,
with higher numbers meaning more agreement. The second estimate targeted internal efficacy
through a series of questions intended to capture whether a subject felt capable of engaging
ranked choice voting (RCV), the alternative voting system used to elect the Mayor, Sheriff, and
District Attorney in San Francisco. Specifically, I create an index combining agreement with
three different statements, with more efficacious answers coded as positive responses: (1) “I am
generally well-informed about how ranked-choice voting works”; (2) “Ranked-choice voting is
easy to understand”; and (3) “Ranked-choice voting is too complicated”. This index is similarly
re-scaled from 0 – 100, with higher numbers indicating greater confidence in one’s ability to
engage the voting system.
Political Trust: I also generate four different estimates of political trust. The survey
included a series of questions intended to capture whether subjects had faith and confidence in
ranked choice voting as a voting system. Subjects were asked to indicate whether they agreed or
disagreed with a series of statements about ranked-choice voting, and I create an additive index
based on 10 different statement that indicate a subject’s overall trust, confidence, and approval of
RCV.8 As before, I add each item in such a way that higher numbers mean more positive
8 Indicate whether you agree or disagree with the following statements about ranked-
choice voting: “Ranked-choice voting is generally a fair way of electing representatives”;
28
evaluations of RCV. I then re-scale the combined index to range from 0 – 100, with higher
numbers indicating a more favorable image of RCV.
I also generate estimates of trust at three different levels of government. The survey
asked subjects to indicate whether they agreed or disagreed with each of the following
statements: (1) “I generally trust the [San Francisco City] Government”; and (2) “I have a lot of
confidence in the [San Francisco City] Government”. Identical questions were also asked with
regard to “the California State Government” and “the United States Federal Government”. I add
up each pair of responses to create an index of overall trust and confidence with each level of
government. I re-scale each index from 0 – 100, with higher numbers indicating more trust.
Method of Analysis: The analysis isolates the effect of being mobilized to cast a ballot
on each of the dependent variables. For each dependent variable, I estimate the overall effects of
being mobilized as well as the conditional effects of being mobilized, controlling for approval of
the electoral outcome. Although the randomized treatment assignment provided initial balance
across all treatment groups, all models include an extensive set of control variables, in order to
decrease noise and increase the accuracy and precision of the estimates (Pocock, Assmann, Enos,
and Kasten 2002).9 Nearly all of the dependent variables in question were measured during the
“Ranked-choice voting is better than the previous voting system”; “Ranked-choice voting
produces better political campaigns”; “Ranked-choice voting produces too many candidates”;
“Ranked-choice voting produces more qualified candidates”; “Ranked-choice voting produces
less qualified candidates”; “Ranked-choice voting produces too much of a burden on voters”;
“Ranked-choice voting allows voters to express their true preferences”; “Ranked-choice voting
encourages corruption”; “I like ranked-choice voting”.
9 Control variables include age, age
2, gender, race, education, income, previous
participation history (including previous voter turnout and an index constructed based on self-
identified engagement in other forms of participation), partisan identity, strength of partisanship,
29
pre-treatment survey as well as the post-treatment survey.10
Whenever possible, I also include a
control for the pre-treatment value of each dependent variable. All estimates of efficacy and trust
were re-scaled from 0 – 100, in order to facilitate comparisons between the magnitude of effects.
Section 4: Results and Analysis
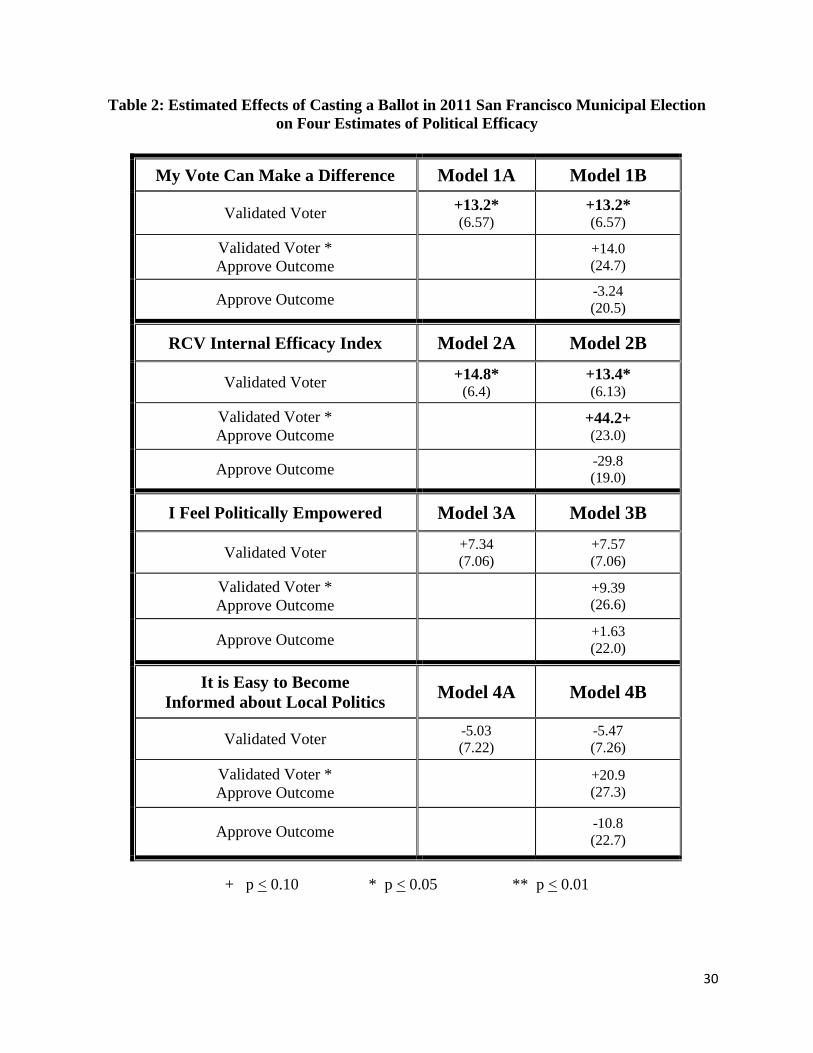
Political Efficacy: Table 2 presents the results from all models estimating the effects of
mobilized participation on the four estimates of political efficacy. I report only the primary
coefficients of interest.11
Standard errors and significance thresholds are indicated in each cell.
Model 1A estimates that mobilized participation increased agreement with the statement
“My vote can make a difference” by 13.2 points, on a 100-point scale (p < 0.05). The magnitude
of this estimate is identical when preferences toward the electoral outcome are included, but
Model 2B does not find any evidence that being an electoral “winner” or “loser” altered the
effects of mobilized participation.
number of years at current address, and dummy variables indicating whether the respondent has
children, is currently employed, is currently in school, and is married. In the full sample models,
I also control for whether or not the respondent received the information treatment.
10 There are two exceptions. One exception is the question about whether the subject feels
politically empowered, which was not asked in the first survey. These models estimate
differences in the post-election measure, but do not control for a pre-treatment score. Another
exception is the series of questions on ranked-choice voting. The second survey included all
questions from the first survey, but also added a couple new questions about RCV. These models
control for the pre-treatment score, but the pre-treatment score does not account for the full
battery of questions.
11 Full results for all models are available upon request.
30
Table 2: Estimated Effects of Casting a Ballot in 2011 San Francisco Municipal Election
on Four Estimates of Political Efficacy
My Vote Can Make a Difference Model 1A Model 1B
Validated Voter +13.2* (6.57)
+13.2* (6.57)
Validated Voter *
Approve Outcome
+14.0
(24.7)
Approve Outcome -3.24
(20.5)
RCV Internal Efficacy Index Model 2A Model 2B
Validated Voter +14.8*
(6.4)
+13.4* (6.13)
Validated Voter *
Approve Outcome
+44.2+ (23.0)
Approve Outcome -29.8
(19.0)
I Feel Politically Empowered Model 3A Model 3B
Validated Voter +7.34
(7.06)
+7.57
(7.06)
Validated Voter *
Approve Outcome
+9.39
(26.6)
Approve Outcome +1.63
(22.0)
It is Easy to Become
Informed about Local Politics Model 4A Model 4B
Validated Voter -5.03
(7.22)
-5.47
(7.26)
Validated Voter *
Approve Outcome
+20.9
(27.3)
Approve Outcome -10.8
(22.7)
+ p < 0.10 * p < 0.05 ** p < 0.01
31
Models 2A and 2B estimate the effects of electoral participation on subjects’ confidence
in their own ability to understand the rules of ranked-choice voting. Model 2A estimates that
being mobilized caused subjects to increase their RCV efficacy scores by 14.8 points (p < 0.05).
Model 2B suggests that the effect of being mobilized varied based on whether a subject approved
or disapproved of the electoral outcome. Both the independent effect of mobilization (+ 13.4,
p < 0.05) and the interaction of mobilization with approval of the outcome (+ 44.2, p < 0.10) are
positive and significant. As a whole, Model 2B estimates that being mobilized to vote increased
subjects’ internal efficacy at higher levels among subjects who also approved of the electoral
outcome.
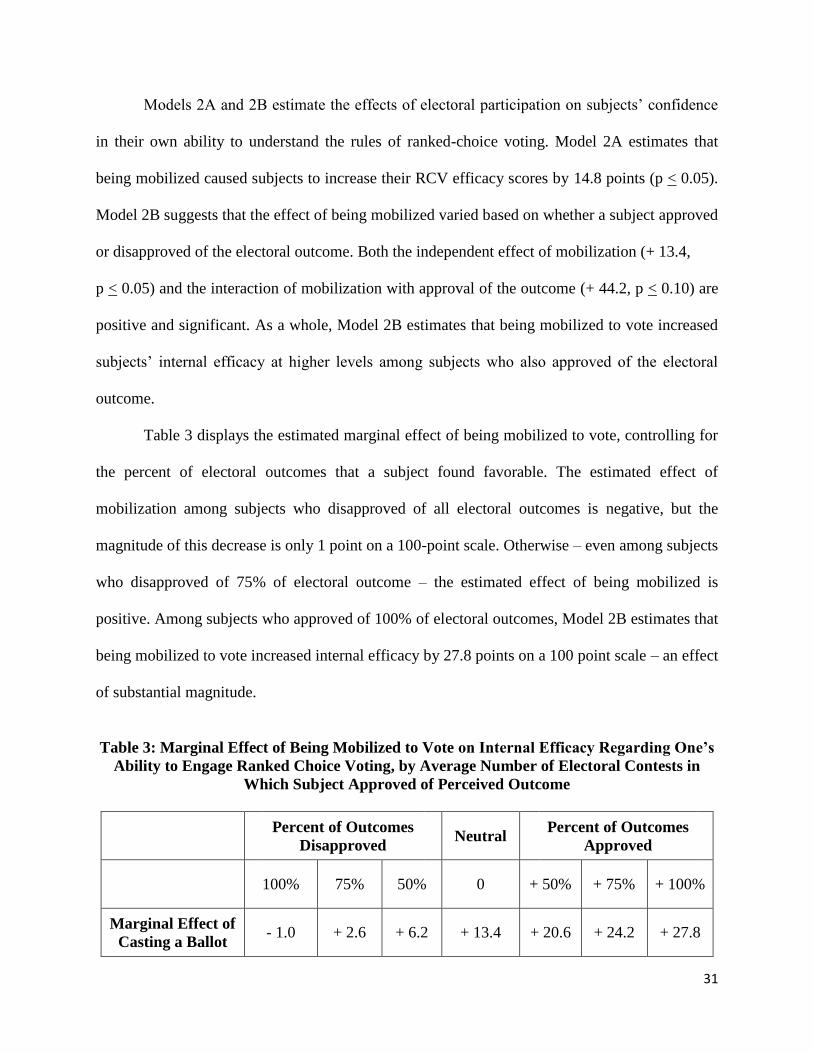
Table 3 displays the estimated marginal effect of being mobilized to vote, controlling for
the percent of electoral outcomes that a subject found favorable. The estimated effect of
mobilization among subjects who disapproved of all electoral outcomes is negative, but the
magnitude of this decrease is only 1 point on a 100-point scale. Otherwise – even among subjects
who disapproved of 75% of electoral outcome – the estimated effect of being mobilized is
positive. Among subjects who approved of 100% of electoral outcomes, Model 2B estimates that
being mobilized to vote increased internal efficacy by 27.8 points on a 100 point scale – an effect
of substantial magnitude.
Table 3: Marginal Effect of Being Mobilized to Vote on Internal Efficacy Regarding One’s
Ability to Engage Ranked Choice Voting, by Average Number of Electoral Contests in
Which Subject Approved of Perceived Outcome
Percent of Outcomes
Disapproved Neutral
Percent of Outcomes
Approved
100% 75% 50% 0 + 50% + 75% + 100%
Marginal Effect of
Casting a Ballot - 1.0 + 2.6 + 6.2 + 13.4 + 20.6 + 24.2 + 27.8
32
Models 3A and 3B estimate the effects of participation on agreement with the statement “I feel
politically empowered”. The results do not suggest that mobilization increased perceived
political power overall, nor do they suggest that the effects of mobilization were different among
subjects who approved or disapproved of the electoral outcome. Similarly, Models 4A and 4B do
not find evidence that being mobilized to vote increased subjects’ perception about how easy it
was to become informed about local politics.
Overall, the data suggest that being mobilized to vote increased both internal and external
political efficacy with regard to the act of voting, but not with regard to influencing politics in
general. In comparison to non-mobilized subjects, mobilized subjects displayed stronger
confidence in their own ability to engage the voting system used in the municipal election
(internal efficacy), and also displayed a stronger belief that their vote was able to affect the
democratic process (external efficacy). However, belief in one’s ability to acquire political
information (internal efficacy) and one’s overall political power (a mix of internal and external
efficacy) were unaffected by mobilization in this case.
The data also suggest that internal efficacy might be differentially affected by the act of
participation, based on whether an actor approves or disapproves of the electoral outcome.
Although being mobilized to vote alone increased subjects’ confidence in their ability to engage
ranked choice voting overall, voting for a winner increased confidence to a greater degree than
voting for a loser.
Political Trust: Table 4 presents the results from all models estimating the effects of
mobilized participation on the four estimates of political trust. Models 5A and 5B estimate the
effects of mobilization on faith and confidence in ranked choice voting as an electoral institution.
Model 5A estimates that subjects who were mobilized to vote reported RCV approval scores that

33
Table 4: Estimated Effects of Casting a Ballot in 2011 San Francisco Municipal Election
on Four Estimates of Political Trust
Overall Approval of
Ranked Choice Voting Model 5A Model 5B
Validated Voter + 10.7* (4.94)
+ 9.66+ (5.03)
Validated Voter *
Approve Outcome
+ 32.2+ (18.7)
Approve Outcome - 24.0
(15.5)
Trust and Confidence in
San Francisco Local Government Model 6A Model 6B
Validated Voter + 9.19+
(5.23)
+ 9.03^ (5.24)
Validated Voter *
Approve Outcome
+ 33.0+ (19.7)
Approve Outcome - 22.0
(16.3)
Trust and Confidence in
California State Government Model 7A Model 7B
Validated Voter + 2.34
(5.15)
+ 1.06
(5.18)
Validated Voter *
Approve Outcome
+ 32.9+ (19.5)
Approve Outcome - 26.0^ (16.2)
Trust and Confidence in
United States Federal Government Model 8A Model 8B
Validated Voter + 5.50
(5.78)
+ 5.14
(5.76)
Validated Voter *
Approve Outcome
+ 9.86
(21.8)
Approve Outcome - 7.52
(18.0)
+ p < 0.10 * p < 0.05 ** p < 0.01

34
were 10.7 points higher (p < 0.05). There is also evidence that mobilization produced
heterogeneous effects. Model 5B finds that the effect of being mobilized increases as the number
of electoral outcomes that a subject approved increases.
Table 5 displays the estimated marginal effect of being mobilized to vote, controlling for
the percent of electoral outcomes that a subject found favorable. The estimated effect of
mobilization is always positive, even when subjects disapproved of 100% of electoral outcomes.
The estimated effect among subjects who were neutral toward the outcome is + 9.7 points.
Among subjects who approved of 100% of the electoral outcomes, the estimated effect of being
mobilized to vote is a 17.9 point increase in trust of the voting system, again on a 100-point
scale.
Table 5: Marginal Effect of Being Mobilized to Vote on Confidence in Ranked Choice
Voting as a Voting System, by Average Number of Electoral Contests in Which Subject
Approved of Perceived Outcome
Percent of Outcomes
Disapproved Neutral
Percent of Outcomes
Approved
100% 75% 50% 0 + 50% + 75% + 100%
Marginal Effect of
Casting a Ballot + 1.5 + 3.6 + 5.6 + 9.7 + 13.8 + 15.8 + 17.9
Model 6A estimates that being mobilized to vote in the San Francisco municipal election
increased overall trust and confidence in the San Francisco local government by 9.2 points
(p < 0.10). Model 6B further finds evidence that the effect of voting in the municipal election
varied based on whether a subject also approved of the electoral outcome. Model 7A does not
find that voting in the municipal election affected trust and confidence in the California state
government, but Model 7B finds that voting at the local level did affect trust toward the state
government, when we also account for subjects’ attitudes toward the municipal election
35
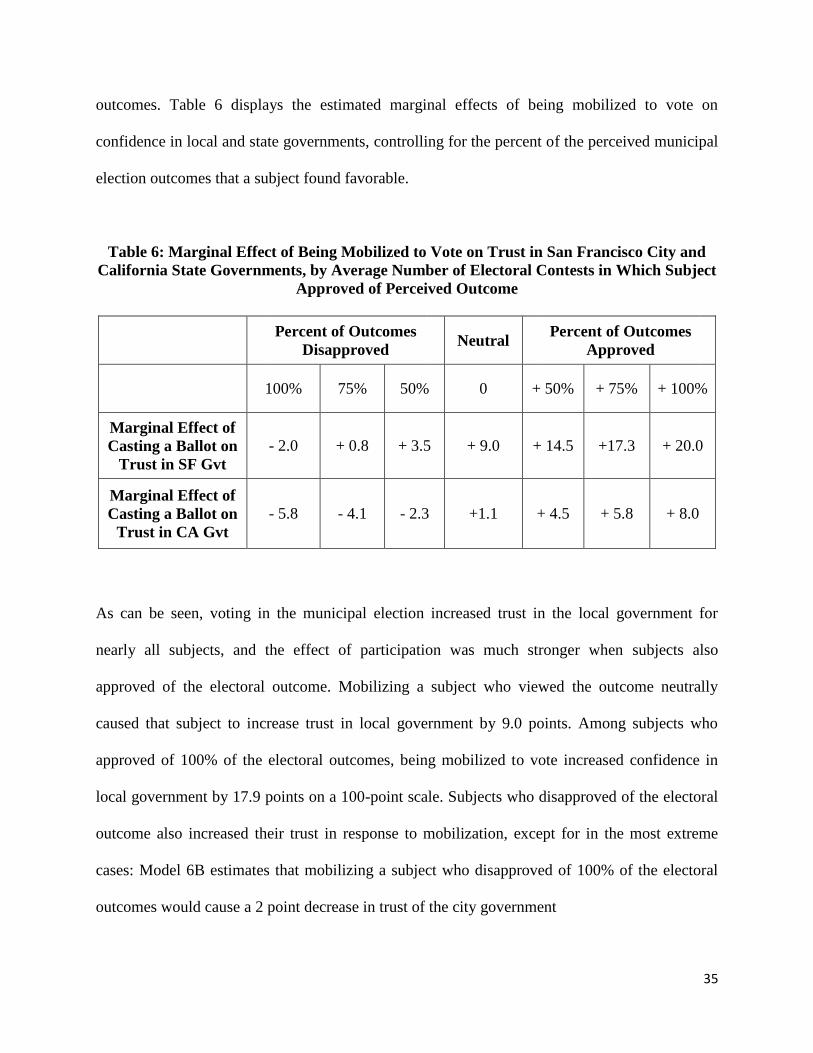
outcomes. Table 6 displays the estimated marginal effects of being mobilized to vote on
confidence in local and state governments, controlling for the percent of the perceived municipal
election outcomes that a subject found favorable.
Table 6: Marginal Effect of Being Mobilized to Vote on Trust in San Francisco City and
California State Governments, by Average Number of Electoral Contests in Which Subject
Approved of Perceived Outcome
Percent of Outcomes
Disapproved Neutral
Percent of Outcomes
Approved
100% 75% 50% 0 + 50% + 75% + 100%
Marginal Effect of
Casting a Ballot on
Trust in SF Gvt
- 2.0 + 0.8 + 3.5 + 9.0 + 14.5 +17.3 + 20.0
Marginal Effect of
Casting a Ballot on
Trust in CA Gvt
- 5.8 - 4.1 - 2.3 +1.1 + 4.5 + 5.8 + 8.0
As can be seen, voting in the municipal election increased trust in the local government for
nearly all subjects, and the effect of participation was much stronger when subjects also
approved of the electoral outcome. Mobilizing a subject who viewed the outcome neutrally
caused that subject to increase trust in local government by 9.0 points. Among subjects who
approved of 100% of the electoral outcomes, being mobilized to vote increased confidence in
local government by 17.9 points on a 100-point scale. Subjects who disapproved of the electoral
outcome also increased their trust in response to mobilization, except for in the most extreme
cases: Model 6B estimates that mobilizing a subject who disapproved of 100% of the electoral
outcomes would cause a 2 point decrease in trust of the city government
36
The effect of voting in the municipal election on trust in state-level government was
much smaller in magnitude, and also varied in direction. Subjects who viewed the outcome of
the municipal election neutrally increased their trust in state-level government by 1.1 points
when they were mobilized to vote at the local level. As the number of electoral outcomes a
subject approved of increased, the effect of mobilization increased trust in state-level
government even further, generating an 8.0 point increase among subjects who approved of
100% of the outcomes. However, among subjects who disapproved of the electoral outcomes,
being mobilized to vote in the municipal election decreased approval of state-level government.
At the extreme, Model 7B estimates that mobilizing a subject who disapproved of 100% of the
electoral outcomes decreased that subject’s trust in state-level government by 5.8 points.
Models 8A and 8B estimate the effects of voting in the municipal election on trust in the
United States Federal Government, but find no significant effects.
Overall, the results suggest that engaging in participation in a particular election increases
confidence in the electoral system used in that election, and also increases trust in the body of
government being elected in that election. Both effects are positive overall, and are also stronger
among individuals who also approve of the electoral outcome. The results also suggest that
participating in an election for one level of government can also affect an individual’s trust in
other levels of government. Voting in the municipal election affected attitudes toward the state
government. However, municipal-level participation did not affect attitudes toward the federal
government, suggesting that the transfer of trust effects might be limited to levels of government
that are closer to the body elected within the particular election.
37
Conclusion
This paper contributed to the study of the effects of participation by implementing an
experimental design that enabled a comparison of subjects before and after a random sample of
them were exogenously motivated to vote. The substantial increase in voter turnout among the
treated population provided the empirical investigation with substantial statistical power.
Overall, the data suggest that the act of electoral participation increased subjects’ perceived
ability to engage San Francisco’s unique voting system, increased subjects’ perceived voting
power, increased confidence in ranked choice voting as a voting system, and increased trust and
confidence in both local and – at least for some subjects – state-level government.
Additional models incorporating subjects’ preferences regarding the electoral outcome
suggest that electoral winners and electoral losers might be differentially affected by
mobilization when it comes to internal efficacy and trust in government, but not with regard to
external efficacy. Because the relationship between approval electoral outcomes and external
efficacy might be mediated by changes in policy that result from the electoral winners, it is
possible that the post-election survey was administered too early to observe such changes.
The comparison of treatment effects among election “winners” and “losers” is a first step
in investigating possible heterogeneous treatment effects. The data generated from this
experiment are from a single election in a single city. These data alone cannot determine whether
it was supporting or opposing the electoral outcomes in general that generated observed
differences, or if observed differences were driven by something specific about the types of
people that approved or disapproved of the outcomes in this particular election. Future studies
can continue to look at the interactive effects of participation and “winning” the election, to
determine if the heterogeneous treatment effects observed in this study were caused by a genuine
38
interaction between winning and participation, or if there was something particular about
subjects who approved of the electoral outcome that caused the act of participation to have
substantially different effects in this case.
The data from this experiment can continue to be used to test for other heterogeneous
treatment effects. Additionally, the basic framework for this experimental design can be
implemented in other elections, to test the durability of these observed effects across other
electoral and cultural conditions. The effects of participation are often theorized but difficult to
study, and experimental innovations like the one conducted in this study are an excellent strategy
for future empirical studies in this area. Pursuing this research agenda further seems especially
fruitful given the strong normative motivations to increase participation, combined with the
strong implications of political attitudes like political efficacy and political trust.

39
Appendix A: Stage 1 – Mobilization: Handout
The mobilization handout included a 12-page packet of information about how to register to
vote, how to verify one’s registration status, how to update one’s registration status, how to
locate one’s polling location, how to vote early at City Hall, how to register to vote-by-mail, how
to submit a vote-by-mail ballot, how to submit a provisional ballot, and how to correctly mark a
ranked-choice ballot. You can download a complete copy of this packet here:
https://docs.google.com/file/d/0B1gapkqmiF36Mm92bEV5dmxuOVU/edit?usp=sharing
40
Appendix B: Stage 1 – Mobilization: Visa Card
41
Appendix C: Stage 1 – Mobilization: Visa Verbal Script
The following script was recited from memory when giving subjects the Visa gift card:
“I have a gift for you. This is a $25 prepaid Visa gift card. The money is already on
the card, and you are free to spend it on whatever you wish. The card has not been
activated yet. I have the activation code, and I will activate your card after the
upcoming San Francisco Municipal Election. However, if for any reason, you do not
submit a ballot in this election, instead of activating your card, I will cancel the card,
and I will take the money back. Although who you vote for and who you don’t vote
for is always secret, whether or not you submit a ballot is recorded by the San
Francisco Election Office. This data is kept in an official Voter History File, which
tracks the registration and turnout of everyone in the city. After the election takes
place, I will use the official Voter History File to verify whether or not you cast a
ballot in the election. Assuming you cast a ballot, your card will be activated.
Otherwise, your card will be canceled, and I will take the money back.”
42
Appendix D: Stage 2 – E-mail Content
[FOR ALL SUBJECTS]
Sent: Friday, October 28th
2011
From: Victoria Anne Shineman [email protected]
Subject: San Francisco Survey - You Have Completed the First Survey! (details for Survey #2
Included)
Date: Friday, October 28th
, 2011
Dear Participant,
Thank you for participating in this research study. You have completed the first survey. The
second survey begins on November 9th, 2011.
On Wednesday November 9th, 2011, I will send you an e-mail including a personalized link to a
website, where you can fill out the second survey. The second survey must be filled out online,
and you can fill it out any time that week, up until November 15th. As soon as you complete the
second survey, your payment will be processed, and I will send you a $25 check immediately via
postal mail. You should have your payment within seven days of when you complete the second
survey.
[FOR SUBJECTS RECEIVING THE MOBILIZATION TREATMENT ONLY]
Your $25 prepaid gift card will be activated after the November 8th, 2011 election. However, if
you do not cast a ballot in this election for any reason, I will cancel your gift card, and take the
money back. I will send you a letter in the mail, as well as a letter by e-mail, informing you
whether or not your card has been activated. If you cast a ballot in the election, your card will be
active, and you are then free to use that card to buy anything you want.
As I explained before, and as is stated on the handout you were given after the first survey, I will
verify your turnout record using the official voter history file. This file is produced by the
Election Office, and it records whether or not you submit a ballot in each election. This is the
only way to verify whether or not you voted. You do not need to save your ballot stub or call or
e-mail to tell me when you vote. This is not necessary, and will not help your card get activated
sooner. Your participation will be recorded automatically by the government, and I will use
official government records to verify your status
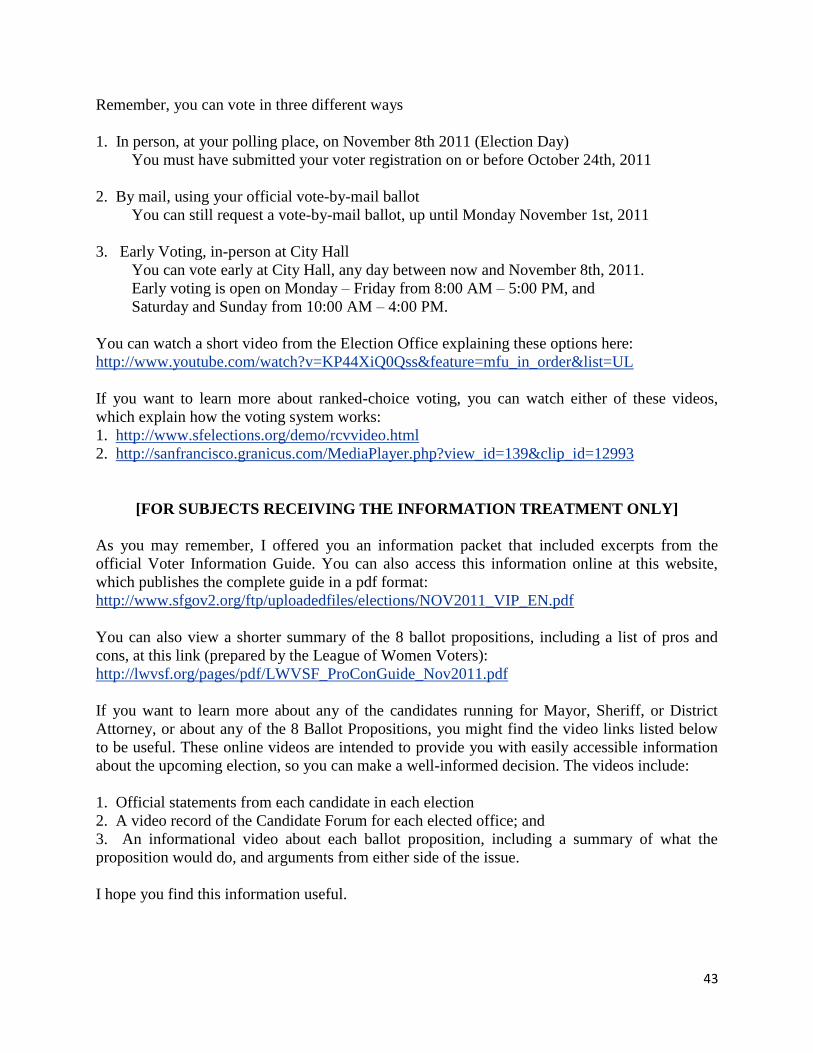
43
Remember, you can vote in three different ways
1. In person, at your polling place, on November 8th 2011 (Election Day)
You must have submitted your voter registration on or before October 24th, 2011
2. By mail, using your official vote-by-mail ballot
You can still request a vote-by-mail ballot, up until Monday November 1st, 2011
3. Early Voting, in-person at City Hall
You can vote early at City Hall, any day between now and November 8th, 2011.
Early voting is open on Monday – Friday from 8:00 AM – 5:00 PM, and
Saturday and Sunday from 10:00 AM – 4:00 PM.
You can watch a short video from the Election Office explaining these options here:
http://www.youtube.com/watch?v=KP44XiQ0Qss&feature=mfu_in_order&list=UL
If you want to learn more about ranked-choice voting, you can watch either of these videos,
which explain how the voting system works:
1. http://www.sfelections.org/demo/rcvvideo.html
2. http://sanfrancisco.granicus.com/MediaPlayer.php?view_id=139&clip_id=12993
[FOR SUBJECTS RECEIVING THE INFORMATION TREATMENT ONLY]
As you may remember, I offered you an information packet that included excerpts from the
official Voter Information Guide. You can also access this information online at this website,
which publishes the complete guide in a pdf format:
http://www.sfgov2.org/ftp/uploadedfiles/elections/NOV2011_VIP_EN.pdf
You can also view a shorter summary of the 8 ballot propositions, including a list of pros and
cons, at this link (prepared by the League of Women Voters):
http://lwvsf.org/pages/pdf/LWVSF_ProConGuide_Nov2011.pdf
If you want to learn more about any of the candidates running for Mayor, Sheriff, or District
Attorney, or about any of the 8 Ballot Propositions, you might find the video links listed below
to be useful. These online videos are intended to provide you with easily accessible information
about the upcoming election, so you can make a well-informed decision. The videos include:
1. Official statements from each candidate in each election
2. A video record of the Candidate Forum for each elected office; and
3. An informational video about each ballot proposition, including a summary of what the
proposition would do, and arguments from either side of the issue.
I hope you find this information useful.

44
[FOR ALL SUBJECTS]
Sincerely,
Victoria Shineman
PhD Candidate
Department of Politics
New York University
[FOR SUBJECTS RECEIVING THE INFORMATION TREATMENT ONLY]
San Francisco Mayoral Election, November 2011
Mayoral Forum:
http://sanfrancisco.granicus.com/MediaPlayer.php?view_id=139&clip_id=13385
Mayoral Candidate Statements (All):
http://sanfrancisco.granicus.com/MediaPlayer.php?view_id=139&clip_id=13144
Jeff Adachi – Individual Statement:
http://www.youtube.com/user/SFVotes2011#p/c/3041565B65A0AF0D/0/vQ17mR9O60k
Michela Alioto-Pier – Individual Statement:
http://www.youtube.com/user/SFVotes2011#p/c/3041565B65A0AF0D/1/Pj0dL06BpCM
Cesar Ascarrunz – Individual Statement:
http://www.youtube.com/user/SFVotes2011#p/c/3041565B65A0AF0D/2/1yFWFHMKIcU
Terry Baum – Individual Statement:
http://www.youtube.com/user/SFVotes2011#p/c/3041565B65A0AF0D/3/w6--8Fhk09Y
David Chiu – Individual Statement:
http://www.youtube.com/user/SFVotes2011#p/c/3041565B65A0AF0D/4/LzegNMYbJ7A
Paul Currier – Individual Statement:
http://www.youtube.com/user/SFVotes2011#p/c/3041565B65A0AF0D/5/_tpaOklUPJk
Bevan Dufty – Individual Statement:
http://www.youtube.com/user/SFVotes2011#p/c/3041565B65A0AF0D/6/Pa3NJGEBv3w
45
Tony Hall – Individual Statement:
http://www.youtube.com/user/SFVotes2011#p/c/3041565B65A0AF0D/7/bpTtmI6-LhU
Dennis Herrera – Individual Statement:
http://www.youtube.com/user/SFVotes2011#p/c/3041565B65A0AF0D/8/u8bvykSgF50
Ed Lee – Individual Statement:
http://www.youtube.com/user/SFVotes2011#p/c/3041565B65A0AF0D/9/78H2948kRLk
Wilma Pang – Individual Statement:
http://www.youtube.com/user/SFVotes2011#p/c/3041565B65A0AF0D/10/sXxI7WokPl4
Joanna Rees – Individual Statement:
http://www.youtube.com/user/SFVotes2011#p/c/3041565B65A0AF0D/11/dDZJgTaT7vM
Phil Ting – Individual Statement:
http://www.youtube.com/user/SFVotes2011#p/c/3041565B65A0AF0D/12/pHb4CniorWE
Leland Yee – Individual Statement:
http://www.youtube.com/user/SFVotes2011#p/c/3041565B65A0AF0D/13/11Q6iVGT0yM
San Francisco Sheriff’s Election, November 2011
Sheriff Forum:
http://sanfrancisco.granicus.com/MediaPlayer.php?view_id=139&clip_id=13298
Sheriff Candidate Statements (All): http://sanfrancisco.granicus.com/MediaPlayer.php?view_id=139&clip_id=13143
Chris Cunnie – Individual Statement:
http://www.youtube.com/user/SFVotes2011#p/c/B0F122C401419240/0/i0cC5R9ov-Q
Ross Mirkarimi – Individual Statement:
http://www.youtube.com/user/SFVotes2011#p/c/B0F122C401419240/1/PMtsT6_07C8
Paul Miyamoto – Individual Statement:
http://www.youtube.com/user/SFVotes2011#p/c/B0F122C401419240/2/IbJ4zQBYI_g
David Wong – Individual Statement:
http://www.youtube.com/user/SFVotes2011#p/c/B0F122C401419240/3/CEfXMlaW81I
46
San Francisco District Attorney Election, November 2011
District Attorney Forum:
http://sanfrancisco.granicus.com/MediaPlayer.php?view_id=139&clip_id=13070
District Attorney Candidate Statements (All):
http://sanfrancisco.granicus.com/MediaPlayer.php?view_id=139&clip_id=13142
Sharmin Bock – Individual Statement:
http://www.youtube.com/user/SFVotes2011#p/c/B5709B6563D883B4/0/GZfXUp4J5FY
Bill Fazio – Individual Statement:
http://www.youtube.com/user/SFVotes2011#p/c/B5709B6563D883B4/1/EVk-zCUUwkc
George Gascon – Individual Statement:
http://www.youtube.com/user/SFVotes2011#p/c/B5709B6563D883B4/2/ywm5ozenSn0
David Onek – Individual Statement:
http://www.youtube.com/user/SFVotes2011#p/c/B5709B6563D883B4/3/AoJsoRdXVKE
Vu Trinh – Individual Statement:
http://www.youtube.com/user/SFVotes2011#p/c/B5709B6563D883B4/4/SedYf7wYQL4
San Francisco Ballot Propositions, November 2011
Proposition A – School Bonds:
http://www.youtube.com/watch?v=_49otM5jltw&NR=1
Proposition B – Road Repaving & Street Safety Bonds:
http://www.youtube.com/watch?v=fFllExvBQ5w&feature=related
Proposition C – City Pension & Health Care Benefits:
http://www.youtube.com/watch?v=l2vq_ZOaRFY&feature=related
Proposition D – City Pension Benefits:
http://www.youtube.com/watch?v=GRKyjYtTQQU&feature=related
Proposition E – Amending or Repealing Initiative Ordinances & Declarations of Policy:
http://www.youtube.com/watch?v=jmFRicDCnYY&feature=related
Proposition F – Campaign Consultant Disclosures:
http://www.youtube.com/watch?v=LF4cm1TNfF8&feature=related

47
Proposition G – Sales Tax:
http://www.youtube.com/watch?v=2AbvnANsNmg&feature=mfu_in_order&list=UL
Proposition H – School District Student Assignment:
http://www.youtube.com/watch?v=IwJnwmZi1nA&feature=mfu_in_order&list=UL

48
Appendix E: Stage 3 – E-mail Content
[FOR ALL SUBJECTS]
Sent: Monday November 7th
2011
From: Victoria Anne Shineman [email protected]
Subject: Reminder: Survey #2 Begins Wednesday November 9th, Election Day is Tomorrow
(November 8th), and $100 Bonus!
Date: Monday, November 7, 2011, 5:48 PM
Dear Participant,
As you remember, you signed up for this research study, where you receive $25 in exchange for
completing two surveys. You already completed the first survey, at my office in downtown San
Francisco.
This is a final reminder that the second survey will begin in 2 days, on Wednesday November
9th, 2011. I will send you an e-mail on Wednesday including a link to a website, and you can fill
out the survey on that website any time between November 9th - November 15th. You must
complete the second survey by November 15th to receive the $25, and I encourage you to fill it
out as early as possible.
As an added incentive to encourage you to complete the second survey early, if you
complete the second survey within 24 hours, you will be eligible for a $100 bonus. This $100
bonus is in addition to the $25 you will already receive for completing the survey, as well as the
$25 gift card you received for voting.
All participants who complete the second survey online within the first 24 hours will be entered
in a lottery, and one eligible participant will be randomly selected as the winner. Your odds of
winning this lottery depend on how many people finish within the first 24 hours. This bonus will
be paid by check and will be sent to the winner along with the $25 check for taking the survey.
[FOR SUBJECTS RECEIVING THE MOBILIZATION TREATMENT ONLY]
The $25 check and the $100 bonus lottery are both in addition to the $25 gift card you received
after you took the first survey.
Remember, your ballot must be received by the time the polls close tomorrow, Tuesday
November 8th, 2011.
Otherwise your gift card will be canceled,
and I will take the $25 back.
49
If you have not submitted your ballot yet, you can do this in several ways:
1. Vote In Person at Your Local Election Precinct: You can go to your polling precinct in the
city, and cast a ballot any time between 7:00 AM – 8:00 PM on Tuesday November 8th, 2011.
You must be in line by 8:00 PM to vote in person at any precinct. Not sure where your precinct
is? You can look it up here: http://gispubweb.sfgov.org/website/pollingplace/
2. You can vote in the Election Office at City Hall, any time between 7:00 AM – 8:00 PM. San
Francisco City Hall is located at 1 Dr. Carlton B. Goodlett Place. You can drop off your vote-by-
mail ballot or pick up a new ballot.
3. Vote-By-Mail – Important – If you haven’t mailed your vote-by-mail ballot yet, don’t
mail it now! It will not be received in time.
However, you can still make sure your ballot is received by 8:00 PM on Election Day. You can
drop off your vote-by-mail ballot at any of the precinct stations around the city. All precincts will
be open from 7:00 AM – 8:00 PM. You can look up the closest station to you on this website:
http://gispubweb.sfgov.org/website/pollingplace/
You can also drop off your vote-by-mail ballot at City Hall, 1 Dr. Carlton B. Goodlett Place.
Did you lose your original ballot, or make a mistake when marking it? You can still submit a
ballot before the election is over! You can request a replacement ballot and submit it
provisionally at any polling place in the city, or at City Hall. Once the Election Office confirms
that your original vote-by-mail ballot was not received, your provisional ballot will be counted.
You can verify that your ballot was counted online here: http://www.sfelections.org/pv/
[FOR ALL SUBJECTS]
Please feel free to contact me if you have any questions. I will send you the second survey on
Wednesday, and look forward to receiving the results. As before, all answers are confidential.
Sincerely,
Victoria Shineman
Ph.D. Candidate
Department of Politics
New York University

50
Appendix F: Stage 1 – Information Treatment – Handout
The information handout included a 42-page packet of information about the candidates and
ballot referenda. You can download a complete copy of this packet here:
https://docs.google.com/file/d/0B1gapkqmiF36aTh0Y2RBSjNZYWc/edit?usp=sharing

51
Appendix G: Descriptive Statistics of Sample, by Treatment Group
Baseline
Information
Only
Mobilization
Only
Information
+
Mobilization
Total
Sample
Percent
Female
52.81
(50.20)
54.22
(50.12)
51.14
(50.27)
51.72
(50.26)
52.45
(50.01)
Percent
White
57.61
(49.69)
50.56
(50.28)
53.33
(50.17)
51.69
(50.25)
53.33
(49.96)
Percent
Asian
18.48
(39.02)
16.85
(37.65)
22.22
(41.81)
22.47
(41.98)
20.00
(40.06)
Percent
Black
8.70
(28.33)
8.99
(28.76)
11.11
(31.60)
10.11
(30.32)
9.72
(29.67)
Percent
Hispanic
6.52
(24.83)
13.48
(34.35)
12.22
(32.94)
8.99
(28.76)
10.28
(30.41)
Percent
Mixed Race
6.52
(24.83)
10.11
(30.32)
8.89
(28.62)
10.11
(30.32)
8.89
(28.50)
Percent
Employed
Full Time
31.52
(46.71)
28.09
(45.20)
28.89
(45.58)
21.35
(41.21)
27.50
(44.71)
Percent
Employed
Part Time
29.35
(45.79)
29.21
(45.73)
22.22
(41.81)
33.71
(47.54)
28.61
(45.26)
Percent in
School
Full Time
16.30
(37.14)
32.58
(47.13)
27.78
(45.04)
31.46
(46.70)
26.94
(44.43)
Percent in
School
Part Time
15.22
(36.12)
15.73
(36.61)
16.67
(37.48)
13.48
(34.35)
15.28
(36.03)
Percent High
School
Graduates
34.78
(47.89)
52.81
(50.20)
42.22
(49.67)
48.31
(50.25)
44.44
(49.76)
Percent
Associate
Degree
7.61
(26.66)
8.99
(28.76)
10.00
(30.17)
10.11
(30.32)
9.17
(28.90)
Percent
College
Degree
36.96
(48.53)
24.72
(43.38)
33.33
(47.40)
23.60
(42.70)
29.72
(45.77)
Percent
Advanced
Degree
20.65
(40.70)
13.48
(34.35)
14.44
(35.35)
17.98
(38.62)
16.67
(37.32)
Percent
Married
8.70
(28.33)
10.11
(30.32)
8.89
(28.62)
8.99
(28.76)
9.17
(28.90)
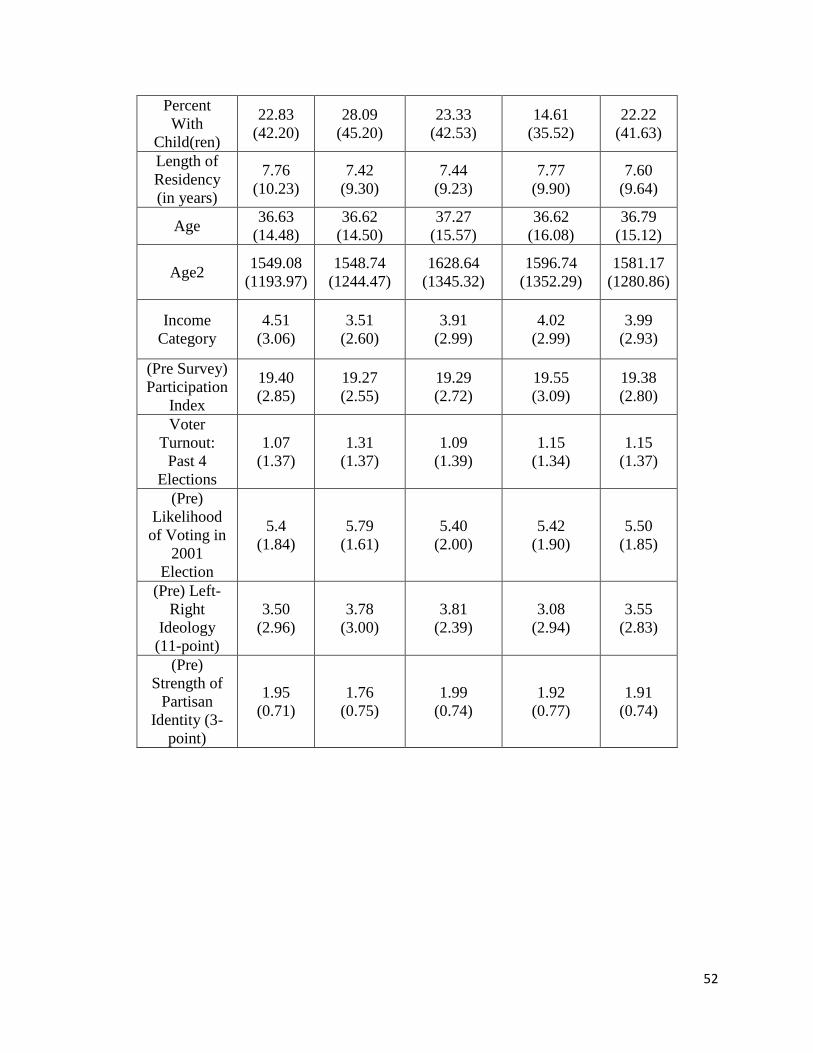
52
Percent
With
Child(ren)
22.83
(42.20)
28.09
(45.20)
23.33
(42.53)
14.61
(35.52)
22.22
(41.63)
Length of
Residency
(in years)
7.76
(10.23)
7.42
(9.30)
7.44
(9.23)
7.77
(9.90)
7.60
(9.64)
Age 36.63
(14.48)
36.62
(14.50)
37.27
(15.57)
36.62
(16.08)
36.79
(15.12)
Age2 1549.08
(1193.97)
1548.74
(1244.47)
1628.64
(1345.32)
1596.74
(1352.29)
1581.17
(1280.86)
Income
Category
4.51
(3.06)
3.51
(2.60)
3.91
(2.99)
4.02
(2.99)
3.99
(2.93)
(Pre Survey)
Participation
Index
19.40
(2.85)
19.27
(2.55)
19.29
(2.72)
19.55
(3.09)
19.38
(2.80)
Voter
Turnout:
Past 4
Elections
1.07
(1.37)
1.31
(1.37)
1.09
(1.39)
1.15
(1.34)
1.15
(1.37)
(Pre)
Likelihood
of Voting in
2001
Election
5.4
(1.84)
5.79
(1.61)
5.40
(2.00)
5.42
(1.90)
5.50
(1.85)
(Pre) Left-
Right
Ideology
(11-point)
3.50
(2.96)
3.78
(3.00)
3.81
(2.39)
3.08
(2.94)
3.55
(2.83)
(Pre)
Strength of
Partisan
Identity (3-
point)
1.95
(0.71)
1.76
(0.75)
1.99
(0.74)
1.92
(0.77)
1.91
(0.74)

53
Works Cited
Angrist, Joshua D., Guido W. Imbens, and Donald B. Rubin. 1996. “Identification of Causal
Effects Using Instrumental Variables. Journal of the American Statistical Association 91(June):
444–55.
Anderson, Christopher and Andrew LoTempio, “Winning, Losing and Political Trust in
America.” British Journal of Political Science, 32 (2002), 335–51.
Baloyra, Enrique A and John D. Martz. 1980. “Political Attitudes in Venezuela: Societal
Cleavages and Political Opinion.” Canadian Journal of Political Science, Vol. 13, No. 2 (Jun.,
1980), pp. 431-432.
Berggren, Heidi. 2001. “Institutional Context and Reduction of the Resource Bias in Political
Sophistication.” Political Research Quarterly, Vol. 54, No. 3 (Sep., 2001), pp. 531-552.
Bilodeau A, Blais Andre. 2005. “Le vote obligatoire a-t-il un effet de socialisation politique? ”
Presented to Colloque int. vote obligatoire, Inst. d’Etudes Polit. Lille, Oct. 20–21. CITED BY:
Loewen et. Al, 2008.
Borgers T. 2004. “Costly Voting.” American Economic Review 94(1):57–66
Brockington, David. 2005. “Compulsory Voting and Political Information: A Cross-National
Examination.” Paper Presented at 2005 Annual Meeting of the American Political Science
Association, Washington, D.C.
Broomall, John M. 1893. “Compulsory Voting.” Annals of the American Academy of Political
and Social Science, Vol. 3 (Mar., 1893), pp. 93-97.
Citrin, J., E. Schickler, and J. Sides. 2003. "What if Everyone Voted? Simulating the Impact of
Increased Turnout in Senate Elections." American Journal of Political Science 47.1 (2003): 75-
90.
Converse, Phillip. 1964. "The Nature of Belief Systems in Mass Publics" in D. Apter (ed.),
Ideology and Discontent. New York: Free Press, pp. 206–61.
Czesnik, M. 2007. "Is Compulsory Voting a Remedy? Evidence from the 2001 Polish
Parliamentary Elections". ECPR Joint Sessions workshop, “Compulsory Voting: Principles and
Practice,” Helsinki. Print.
David Easton, A Systems Analysis of Political Life (New York: John Wiley, 1965); David
Easton, ‘A Re-Assessment of the Concept of Political Support’, British Journal of Political
Science, 5 (1975), 435–57.
Engelen, Bart. 2007. "Why Compulsory Voting can Enhance Democracy." Acta politica 42(1):
23-39.
54
Engelen, Bart. 2009. "Why Liberals can Favour Compulsory Attendance." Politics 29(3): 218-
22.
Evans, T. 2005. "Compulsory Voting in Australia." Australian Electoral Commission 16.
Feddersen, T. J. and W Pesendorfer. 1996. “The Swing Voter's Curse.” American Economic
Review, 86, 408-424.
Feddersen, T. and W. Pesendorfer. 1997. “Voting Behavior and Information Aggregation in
Elections with Private Information.” Econometrica, 65: 1029-1058.
Franklin, M. N. 1999. "Electoral Engineering and Cross-National Turnout Differences: What
Role for Compulsory Voting?" British Journal of Political Science 29.01 (1999): 205-16.
Funk, Patricia. 2004. “Is There an Expressive Function of Law? An Empirical Analysis of
Voting Laws with Symbolic Fines.” Available at SSRN: http://ssrn.com/abstract=624504 or
doi:10.2139/ssrn.624504
Gallego, Aina. 2007. “Does Compulsory Voting Reduce Inequality in Turnout? An Examination
of its Impact on Educational Biases.” Paper to be presented at the ECBR Joint Sessions in
Helsinki 2007 Workshop 7 “Compulsory Voting: Principles and Practice.”
Gerardi, D., Margaret A. McConnell, Julian Romero and Leeat Yariv. 2009. "Get Out the
(Costly) Vote: Institutional Design for Greater Participation." Carlo Alberto Notebooks, No. 121,
December 2009.
Ghosal, S., and B. Lockwood. 2009. "Costly Voting when both Information and Preferences
Differ: Is Turnout Too High Or Too Low?" Social Choice and Welfare 33.1 (2009): 25-50.
Gordon, S. & Segura, G. 1997. “Cross-National Variation in the Political Sophistication of
Individuals: Capability or Choice?” Journal of Politics, Vol. 59, 1:126-147.
Gosnell, Harold F. 1930. Why Europe Votes. Chicago: University of Chicago Press.
Gneezy, Uri, and Aldo Rustichini (2000). “A Fine Is a Price.” Journal of Legal Studies, 29, 1–
17.
Green, Donald P., Alan S. Gerber, and David W. Nickerson. 2003. “Getting Out the Vote in
Local Elections: Results from Six Door-to-Door Canvassing Experiments. Journal of Politics
65(November): 1083–96.
Großer, J., and T. Giertz. 2009. “Candidates, Voters, and Endogenous Group Formation: An
Experimental Study.” Presented at Second Annual CESS-NYU Experimental Political Science
Conference, New York University, February 2009.
55
Hasen, Richard L. 1996. “Voting Without Law?” University of Pennsylvania Law Review, 144
(May): 2135-2179.
Hasen, Richard. 2000. “Vote Buying.” California Law Review, Issue 5, October 2000, pp. 1323-
1372.
Helmke, G. and B.M. Meguid. 2008. “Endogenous Institutions: The Origins of Compulsory
Voting Laws,” Paper prepared for the Political Institutions and Economic Policy Conference at
Princeton University on May 10, 2008, Department of Political Science, University of Rochester.
Hirczy, Wolfgang. 1994. “The Impact of Mandatory Voting Laws on Turnout: A Quasi
Experimental Approach.” Electoral Studies, Vol. 13: 64-76.
Hooghe, Marc and K. Pelleriaux. 1998. “Compulsory Voting and Belgium: An Application of
the Lijphart Thesis.” Electoral Studies, Volume 17, Number 4, December 1998 , pp. 419-424(6)
Huber, John and Ronald Inglehart. 1995. “Expert Interpretations of Party Space and Party
Locations in 42 Societies.” Party Politics, 1(1): 73-111.
Irwin, Galen A. 1974. "Compulsory Voting Legislation: Impact on Voter Turnout in the
Netherlands." Comparative Political Studies 7 (October):292-315.
Jackman, R. 1987. “Political institutions and voter turnout in the industrial democracies.”
American Political Science Review, 81(2), 405–423.
Jakee, Keith and Guang-Zhen Sun. 2006. “Is compulsory voting more democratic?” Public
Choice, Vol. 129: 61-75.
Keaney E and Rogers B. 2006. “A Citizen’s Duty: Voter Inequality and the Case for Compulsory
Turnout,” London: Institute for Public Policy Research
Krasa, S., and M. K. Polborn. 2009. "Is Mandatory Voting Better than Voluntary Voting?"
Games and Economic Behavior 66.1 (2009): 275-91.
Krishna, V., and J. Morgan. 2009. “Voluntary Voting: Costs and Benefits.” Working Paper.
Laver, M. & Hunt, W.B. (1992). Policy and party competition. London: Routledge.
Lijphart, A. 1997. “Unequal Participation: Democracy's Unresolved Dilemma.” American
Political Science Review, 91(1), 1-14.
Loewen, Peter J, Henry Milner, and Bruck Hicks. 2008. “Does Compulsory Voting Lead to
More Informed and Engaged Citizens? An Experimental Test.” Canadian Journal of Political
Science 41(3): 655-672.
56
Mackerras, Malcolm and Ian McAllister. 1999. “Compulsory Voting, Party Stability and
Electoral Advantage in Australia.” Electoral Studies 18: 217-33.
Mariën, Sophie. 2007. “Is Compulsory Voting a Good Idea? The Consequences of Compulsory
Voting in Belgium.” PartiRep Working Paper, PartiRep Research Network, Brussels/Leuven,
October 2007.
Massicotte, L., Blais, A., & Yoshinaka, A. 2003. Establishing the Rules of the Game: Election
Laws in Democracies. Toronto: University of Toronto Press.
McAllister, Ian. 1986. “Compulsory Voting, Turnout, and Party Advantage in Australia.”
Australian Journal of Political Science, Volume 21, Issue 1, May 1986, pp 89-93.
Milazzo, Caitlin. "Institutions and Engagement: The Impact of Compulsory Voting on Political
Discussion in Switzerland" Paper presented at the annual meeting of the Midwest Political
Science Association 67th Annual National Conference, The Palmer House Hilton, Chicago, IL,
Apr 02, 2009
Nadeau, Richard, and Andre´ Blais, “Accepting the Election Outcome: The Effect of
Participation on Losers’ Consent.” British Journal of Political Science, 23 (1993), 553–63.
Nerincx, A. 1901. “Compulsory Voting in Belgium.” The Annals of the American Academy of
Political and Social Science, Vol. 18; 87.
Nichter, Simeon. 2008. “Vote buying or turnout buying? Machine politics and the secret ballot.”
American Political Science Review, 102:19-31.
Palfrey, T. R., and K. T. Poole. 1987. "The Relationship between Information, Ideology, and
Voting Behavior." American Journal of Political Science 31.3 (1987): 511-30.
Panagopoulos, Costas. 2008. "Turning Out, Cashing In: Extrinsic Rewards, Intrinsic Motivation
and Voting," Paper presented at the annual meeting of the Midwest Political Science Association
67th Annual National Conference, The Palmer House Hilton, Chicago, IL
Saunders, B. 2010. "Increasing Turnout: A Compelling Case?" Politics 30.1 (2010): 70-7.
Selb, P., & Lachat, R. 2009. “The more, the better? Counterfactual evidence on the effect of
compulsory voting on the consistency of party choice.” European Journal of Political Research,
48, 573–597.
Semetko, Holli, and Patti Valkenburg. “The Impact of Attentiveness on Political Efficacy:
Evidence from a Three-Year German Panel Study.” International Journal of Public Opinion
Research (1998) 10(3): 195-210.