islamic republic of pakistan cosop completion review · pdf filemiop microfinance innovation...
TRANSCRIPT
For: Information
Islamic Republic of Pakistan
COSOP completion review

i
Contents
Abbreviations and acronyms ii
I. Assessment of programme performance 1
A. Introduction 1
B. Portfolio analysis 2
1. Rural poverty impact 2
2. Project performance 4
3. Other performance criteria 7
C. Assessment of non-lending activities 7
1. Policy dialogue 7
2. Knowledge management 8
3. Partnership building 8
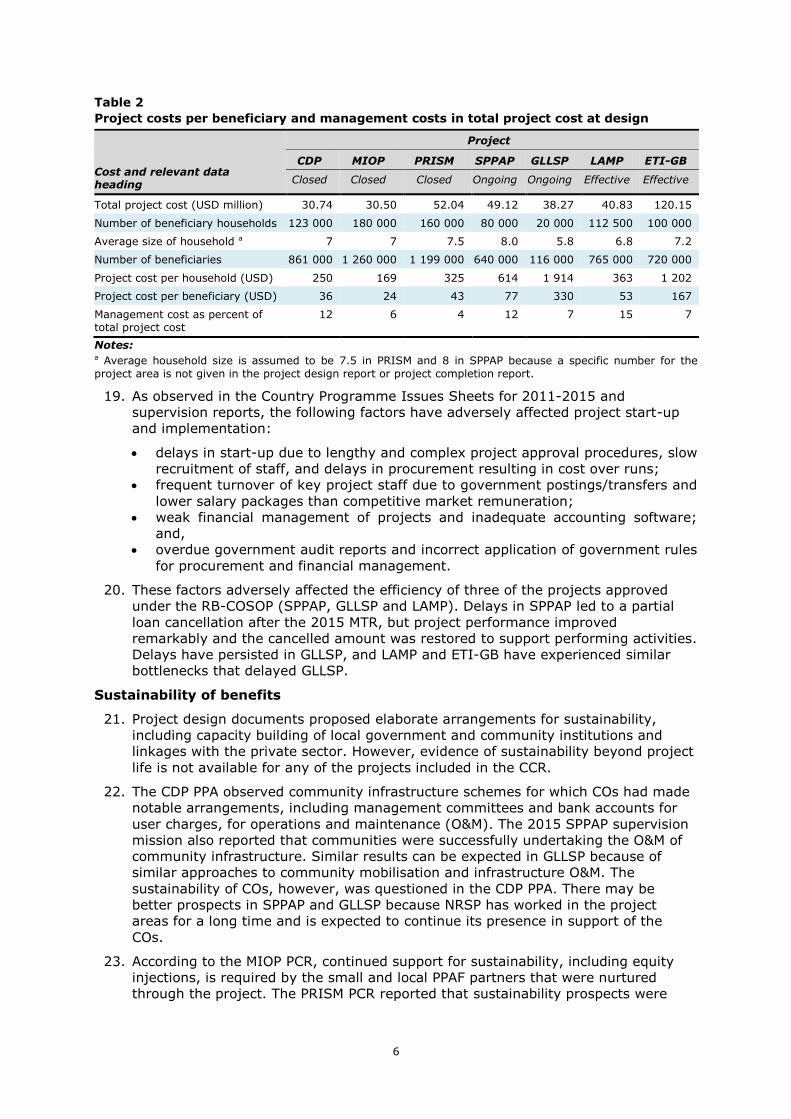
4. Grants 9
D. COSOP performance 9
II. IFAD’s performance 10
III. Lessons learned and recommendations 10
Appendices
Appendix I: Country background 1
Appendix II: Key elements of the Pakistan COSOP, 2009 6
Appendix III: COSOP results management framework (at design) 8
Appendix IV: COSOP results management framework: progress since
COSOP results review 10
Appendix V: Ratings matrix (in line with IOE evaluation methodology) 18
Appendix VI: Comments from the Borrower 19

ii
Abbreviations and acronyms
ACTED Agency for Technical Cooperation and Development
CCR RB-COSOP Completion Review
CDP Community Development Project
CO Community Organisation
DPAP Diamer Poverty Alleviation Programme
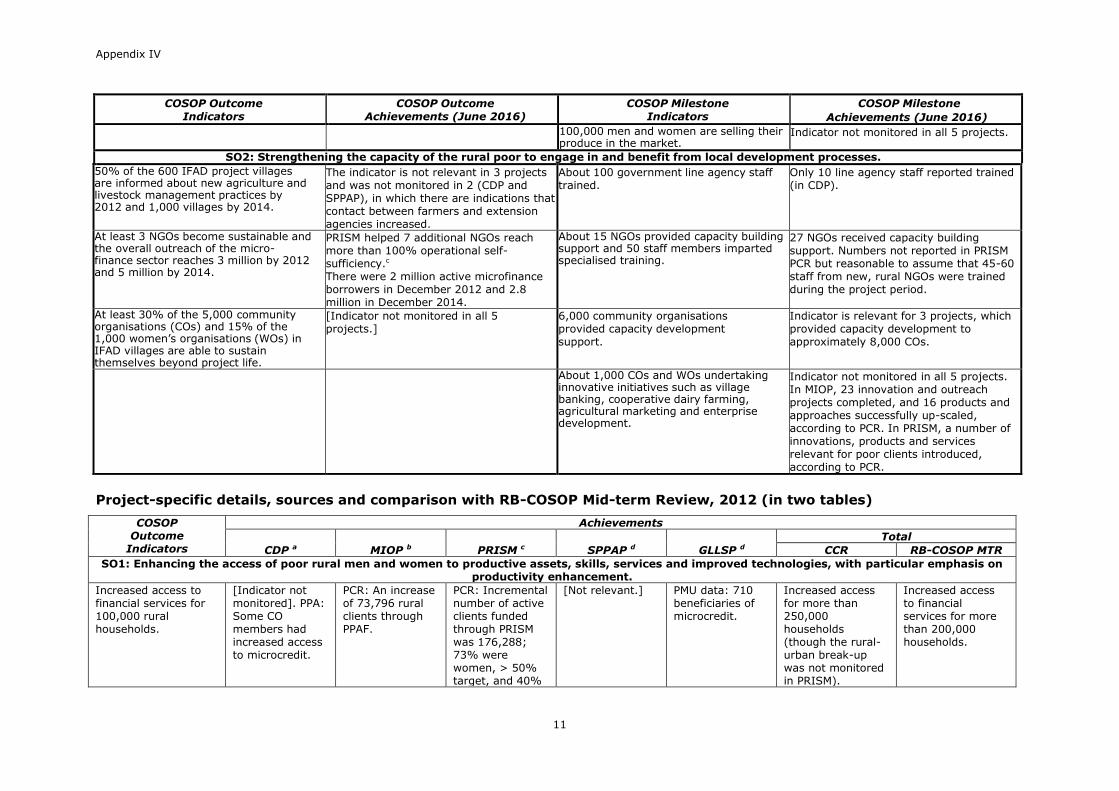
EAD Economic Affairs Division
ETI-GB Economic Transformation Initiative - Gilgit-Baltistan
GLLSP Gwadar-Lasbela Livelihoods Support Project
IFAD International Fund for Agricultural Development
IOE Independent Office of Evaluation (of IFAD)
LAMP Livestock and Access to Markets Project
M&E Monitoring & Evaluation
MIOP Microfinance Innovation and Outreach Programme
MTR Mid-term Review
NGO Non-Governmental Organisation
PCR Project Completion Report
PPA Project Performance Assessment
PKR Pakistani Rupee
PMD Programme Management Department
PPAF Pakistan Poverty Alleviation Fund
PRISM Programme for Increasing Sustainable Microfinance
PSC Poverty Score Card
RB-COSOP Results-Based Country Strategic Opportunities Programme
SO Strategic Objective
SPPAP Southern Punjab Poverty Alleviation Programme
SSN-TUP Social Safety Net– Targeting Ultra-Poor

iii
Map of IFAD-funded operations in the country

1
Islamic Republic of Pakistan
COSOP completion review
I. Assessment of programme performance
A. Introduction
1. The previous Results-Based Country Strategic Opportunities Programme (RB-
COSOP) for Pakistan, covering 2010-2015, was approved by the IFAD Executive
Board in April 2009. The RB-COSOP had two strategic objectives (SOs): enhancing
the access of poor rural men and women to productive assets, skills, services and
improved technologies, with particular emphasis on productivity enhancement, and
strengthening the capacity of the rural poor to engage in and benefit from local
development processes. It had eight outcome and 12 milestone indicators, but the
projects monitored only 11 of these 20 indicators, with some information available
on five of the remaining nine. Data on impacts and achievement of project
objectives were also lacking, which was an additional challenge in assessing project
and programme results. Subject to these limitations, the RB-COSOP Completion
Review (CCR) assesses seven loan-funded projects listed in Table 1, including the
four that were approved and the three that closed during this period. It also
includes two grant-funded projects approved during the period.
Table 1 List of projects covered by the CCR
Project Name Board Approval
Effective Closing Project
Cost (in
million US$)
IFAD
Loan (in
million US$)
IFAD
Grant (in
million US$)
Percent
Disbur-sement1
Community Development Programme (CDP) a
Dec. 2003 Sep. 2004
Mar. 2013
30.74 21.77 100%
Microfinance Innovation and Outreach Programme (MIOP) a
Dec. 2005 Sep. 2006
Mar. 2012
30.50 26.46 100%
Programme for Increasing Sustainable Microfinance (PRISM) a
Sep. 2007 May
2008
Mar. 2014
52.04 35.00 100%
Southern Punjab Poverty Alleviation Programme (SPPAP) b
Additional financing
Dec. 2010
Dec. 2015
Sep. 2011
Mar. 2018
49.12 30.17
10.00
97%
0%
Gwadar-Lasbela Livelihood Support Project (GLLSP) b
May 2011 Jan.
2013
Sep. 2019
38.27 30.00 3.00 35%
Livestock and Access to Markets Project (LAMP) c
Dec. 2013 Feb. 2015
Sep. 2021
40.83 34.50 0.59 3%
Economic Transformation Initiative Gilgit-Baltistan (ETI-GB) c
Apr. 2015 Sep. 2015
Mar. 2023
120.15 67.00 2%
Total 361.65 254.90 3.59
Notes: a Closed project, assessed with reference to all Independent Office of Evaluation (IOE) evaluation criteria. b Ongoing project, assessed with reference to all IOE evaluation criteria, with effectiveness, rural poverty impact and sustainability assessments based on performance to date and likely performance. c Implementation not yet started; project assessed with reference to the relevance criterion. Efficiency issues, as observed to date, also included.
1 Disbursement rates as of 10 October 2016.
2
2. The review period was characterised by significant institutional and economic
developments in the country, as well as growing concern for social indicators and
climate change2. The country’s governance became increasingly consolidated at the
provincial level, with devolution from the federal government3 and substantial roll-
back of local government powers. Growth in agriculture remained around three per
cent per annum, as farmers experienced increased cost of production and low
returns in addition to persisting problems such as lack of innovation, infrastructure,
services and inputs, and a restrictive business environment.
3. Inability to generate a dividend from the demographic transition attracted growing
attention to low labour productivity and its links to basic, technical and vocational
education and consequences such as rural-urban and gender gaps and
unemployment among rural youth. Social safety nets expanded considerably,
guided by sharply-focused pro-poor targeting through the Poverty Score Card
(PSC). Microfinance services also witnessed a large expansion. Reports and
initiatives appearing in 2015 and 2016, in particular, highlighted food security,
under-nourishment and the effects of climate change as pressing challenges for
large segments of the population, particularly the poor and vulnerable.
B. Portfolio analysis
1. Rural poverty impact
4. CDP, SPPAP and GLLSP are area-based, multi-sector rural and agricultural
development projects, while MIOP and PRISM were national microfinance initiatives,
focusing on rural areas. The area-based projects invested in community
mobilisation as a foundation for delivering assets and services to communities,
households and individuals, while MIOP and PRISM supported the Pakistan Poverty
Alleviation Fund (PPAF) and its partner organisations in expanding the outreach,
range and sustainability of financial services. CDP, SPPAP and GLLSP adopted a
combination of geographic and household targeting, which enabled interventions to
focus increasingly sharply on three categories of the rural poor (extremely poor,
chronically poor and transitory poor) after the introduction of the PSC approach
(described in Appendix I). MIOP and PRISM did not include mechanisms for
household targeting, except in MIOP’s pilot Social Safety Net–Targeting Ultra Poor
(SSN-TUP) Programme.
5. SSN-TUP provided assets (62 per cent of which were livestock), training for using
these assets, a subsistence allowance (PKR 1,000 per month for 10-12 months),
and health insurance to 1,000 households in 85 villages, which was one-half of a
group of poor households, and compared the status of the treatment and control
groups through a survey at the end of the programme4. Beneficiaries’ incomes
increased by 178 per cent during 2008-2012, compared with an increase of 41 per
cent among non-beneficiaries, and their assets increased by 189 per cent,
compared with 90 per cent for non-beneficiaries. At least 44 per cent of the
treatment households (according to the survey), and possibly more (according to
the implementing partners) graduated out of poverty.
2 The country context, including the Poverty Score Card approach, is described in detail in Appendix I. 3 The loan approved for the Crop Maximisation Programme was cancelled because of the devolution of relevant responsibility from the federal government to the provinces. 4 “Assessment Survey of the PPAF’s Social Safety Net–Targeting Ultra Poor (TUP) Programme,” by Innovative Development Strategies, Islamabad, 2012. The sample consisted of 200 beneficiaries and 100 non-beneficiaries.

3
6. An ex post impact evaluation of MIOP and PRISM5 generated mixed findings about
the impact of microfinance on poverty, showing a positive impact on poverty
reduction in Sindh Province, but not in Punjab. Assessing project design and
relevant literature, the evaluation observed that access to microcredit is insufficient
to move households out of poverty. The Project Completion Reports (PCRs) for
MIOP and PRISM cited anecdotal data (and, for PRISM, a Gallup Pakistan study6)
that income and assets had increased as a result of these projects. The ex post
evaluation, however, discounted the study’s findings that income and agricultural
productivity had increased, on the grounds that the study suffered from
methodological weaknesses. The study also reported that beneficiary household
assets did not increase.
7. Survey-based impact assessments are not available for other projects. The CDP
Project Performance Assessment (PPA) and SPPAP and GLLSP reports show,
however, that these projects provided assets including poultry, livestock, orchards,
plant and fish nurseries, plots of land and low-cost houses to 40,072 households.
The CDP PPA reported that goat and chicken distribution improved the incomes of
the poorest households and kitchen gardening was a popular activity replicated by
women. SPPAP and GLLSP distributed goats to 28,000 poor households and a
SPPAP report7 found that goats multiplied well, increased household milk
consumption, and encouraged women to plan increases in assets and income.
SPPAP also reported increased production and income for poor households from
kitchen gardening, the reclamation of saline land through gypsum application, and
provision of farm implements through community service providers.8 These
observations are consistent with the findings of a previous evaluation in Punjab,
which estimated high rates of return for investments in land rehabilitation through
gypsum application, community-based implement pools, and kitchen gardens.9
8. None of the five projects monitored agricultural productivity and food security
indicators. The MIOP PCR observed anecdotally that the project led to increased
productivity and the PRISM PCR asserted that the project would have contributed to
increased food security. There are stronger, evidence-backed indications in the CDP
PPA and SPPAP reports that crop and livestock productivity as well as food security
improved as a result of various interventions, including 164 irrigation schemes and
eight productivity-enhancement interventions for 13,538 households in SPPAP.
9. The MIOP and PRISM PCRs did not report on the community organisations (COs)
engaged through these projects. The CDP PPA and SPPAP and GLLSP reports show
that these projects mobilised 167,182 rural men and women in 8,629 COs. The CDP
PPA rated the project as satisfactory in terms of human and social capital and
empowerment, while noting that there was lack of clarity in the targeting approach
and no effective strategy or tools for targeting the poorest. In SPPAP and GLLSP,
community mobilisation has effectively laid the basis for including the poorest, and
interventions are matched with specific groups of the poor by applying the PSC
criteria. The three area-based projects also created substantial human capital by
5 “Measuring the Impact of Microfinance in Pakistan,” by the Agency for Technical Cooperation and Development (ACTED), Islamabad, August 2016. The sample consisted of 1,800 beneficiary households and 2,160 in the control group. 6 “PPAF Micro Credit Financing: Assessment of Outcomes,” Gallup Pakistan, Islamabad, May 2013. 7 Report on the impact on the lives of the beneficiaries, by National Rural Support Programme (NRSP), 2015. The income generating impact of goats for the rural poor in southern Punjab is confirmed by a research study, “Goat Production in Rural Areas in Pakistan: A Detailed Survey through Participatory Rural Appraisal,” International Livestock Research Institute, n.d. (http://prr.hec.gov.pk/Chapters/2610S-3.pdf). 8 Op. cit. and report on the impact of Community Service Providers, by NRSP, n.d. 9 “Mid-term Review of the Government of Punjab-UNDP Project for the Rehabilitation of Salt-affected and Waterlogged Lands – Bio-saline-II,” February 2009, by Eduardo Quiroga, Tariq Husain and Zakiullah Mian.

4
training approximately 6,500 men and women in improved agriculture and livestock
management, and more than 38,000 men and women in various productive skills.
2. Project performance
Relevance
10. The objectives of the seven projects were closely aligned with the RB-COSOP SOs10.
All project designs were aligned with the prevailing IFAD Strategic Framework and
policies and strategies. They also addressed the key recommendations of the 2008
Country Programme Evaluation, particularly those calling for a differentiated
approach in selecting project areas, greater emphasis on non-farm income sources
for the rural poor, and greater attention to sustainability.
11. Project designs also paid attention to the government’s high-level plans and
strategies, including Vision 2030, the Medium-Term Development Framework 2010-
2015 and the Poverty Reduction Strategy Paper II, as well as specific provincial
priorities. The designs reflected in-depth situation analysis of the respective project
areas, including the resource base, sources of livelihood, local needs, and the roles
and capacities of relevant government, non-government, community and private
sector institutions.
12. The two microfinance projects responded creatively to the lack of product
innovation and donor funding that afflicted the sector at the time, taking a sector-
wide approach to engage non-governmental organisations (NGOs), commercial
institutions, and government regulators and policy makers. The area-based projects
(including LAMP and ETI-GB) were designed to cover a wide range of relevant
institutional and technical interventions for agricultural (including livestock)
development, with particular emphasis on value chains in ETI-GB. The CDP PPA
observed, however, that the objective to “lay the basis for a successful devolution
process” was disconnected from existing national legal and institutional framework,
and that resources (particularly for agriculture and livestock) were spread too thinly
to have a pronounced impact. The SPPAP design also included two sub-components
with a large number of technology and agricultural interventions that spread
resources thinly and were dropped at the Mid-term Review (MTR).
13. The RB-COSOP noted that specific target groups for a given project would be
defined through poverty mapping exercises undertaken as part of the project
design. For targeting at the household level, four of the projects (PRISM, SPPAP,
GLLSP and LAMP) were designed to identify categories of the rural poor through the
PSC approach. In the case of ETI-GB, the design calls for focusing on smallholders
with an average landholding of less than one hectare and women-headed and
landless households, because PSC data are not available in most of the project
area.
14. The RB-COSOP also called for gender mainstreaming to promote equality and the
empowerment of women and address the issues of exclusion and marginalisation.
Project designs introduced specific interventions and targets for women and (in the
area-based projects) emphasised women’s inclusion in COs. Loans and training for
women in productive skills were consistent and important themes in project design.
The ETI-GB design as well as entrepreneurship training in SPPAP also emphasised
the inclusion of youth.
Effectiveness
15. The objectives11 of the five projects that were closed or approved during the review
period focused on increased access to microfinance (in MIOP, with a wider range of
10 The objectives and other key features of the RB-COSOP are summarised in Appendix II. 11 This refers to objectives as stated in the President’s Report.

5
products, and PRISM), enhanced income and/or livelihoods (CDP, SPPAP and
GLLSP), increased agricultural productivity and production (CDP and SPPAP),
enhanced employment potential (SPPAP), and improved social and economic
infrastructure (CDP). Income and agricultural productivity are also impact domains
that have been discussed above. Increased income and productivity were not
among the objectives of MIOP and PRISM, and the evidence is insufficient that such
changes materialised in these projects. They did, however, achieve stated
objectives: the PCRs reported 23 innovation and outreach projects completed and
16 products and approaches successfully scaled up in MIOP, and 250,000
incremental microcredit clients through the two projects. MIOP and PRISM PCRs
acknowledged PPAF’s role as a competent and efficient apex institution as key to
the projects’ achievements. The PRISM PCR also highlighted the pivotal role played
by commercial banks and NGOs in contributing to a revitalised microfinance sector.
16. CDP, according to its PPA, improved the access of rural communities to social and
economic infrastructure. GLLSP, due to inadequate resources, had to abandon the
construction of jetties and allied infrastructure for landing fish, and this has made it
challenging for the project to achieve its objective of increasing the incomes of
fishers. In CDP, SPPAP and GLLSP, the large-scale distribution of agricultural and
livestock assets mentioned in the impact section reportedly led to increased
production and income, thereby contributing to project effectiveness. It is also
evident that the wide range of productivity-enhancement interventions in CDP and
SPPAP generated improvements in agricultural productivity. In relation to SPPAP’s
employment objective, the project reports that 60 per cent of those (11,593) who
received vocational training and were included in a follow-up (7,157) were gainfully
employed, 15 per cent of those (3,081) who received entrepreneurship training had
started a new business, and 60 per cent had increased their business.
17. The targeting approach in MIOP and PRISM, judging from the PCRs, mainly focused
on women through financial products, women-only lending partners in MIOP, and
project-level targets for women clients in PRISM. The CDP PPA noted some
conscious targeting of vocational training, goat and chicken packages, etc. on the
poor and disadvantaged, especially women, and the absence of strategy and tools
for targeting the poorest. In SPPAP and GLLSP, pro-poor targeting has been highly
effective (according to the SPPAP MTR and 2015 GLLSP supervision mission)
because of the identification of specific categories of rural poor and poor women
through the PSC, interventions focused on these categories, and the responsibility
given for community mobilisation and targeting to NRSP, which is one of the most
experienced poverty alleviation organisations in the country.
Efficiency
18. The relevant costs for the seven projects, as designed, are shown in Table 2. The
management cost as a percentage of total project cost was 4-15 percent at design,
the higher percentages reflecting the more decentralised and spread out
implementation arrangements in SPPAP and LAMP. The cost per beneficiary varies
from USD 24 in MIOP to USD 330 in GLLSP. MIOP relied for management on a
network of NGOs, whereas GLLSP included high-cost fisheries-related infrastructure
and a population thinly spread over a large area. Economies of scale are also
evident, the management cost per beneficiary decreasing with an increase in the
number of beneficiaries.
6
Table 2
Project costs per beneficiary and management costs in total project cost at design
Cost and relevant data heading
Project
CDP MIOP PRISM SPPAP GLLSP LAMP ETI-GB
Closed Closed Closed Ongoing Ongoing Effective Effective
Total project cost (USD million) 30.74 30.50 52.04 49.12 38.27 40.83 120.15
Number of beneficiary households 123 000 180 000 160 000 80 000 20 000 112 500 100 000
Average size of household a 7 7 7.5 8.0 5.8 6.8 7.2
Number of beneficiaries 861 000 1 260 000 1 199 000 640 000 116 000 765 000 720 000
Project cost per household (USD) 250 169 325 614 1 914 363 1 202
Project cost per beneficiary (USD) 36 24 43 77 330 53 167
Management cost as percent of total project cost
12 6 4 12 7 15 7
Notes: a Average household size is assumed to be 7.5 in PRISM and 8 in SPPAP because a specific number for the
project area is not given in the project design report or project completion report.
19. As observed in the Country Programme Issues Sheets for 2011-2015 and
supervision reports, the following factors have adversely affected project start-up
and implementation:
delays in start-up due to lengthy and complex project approval procedures, slow
recruitment of staff, and delays in procurement resulting in cost over runs;
frequent turnover of key project staff due to government postings/transfers and
lower salary packages than competitive market remuneration;
weak financial management of projects and inadequate accounting software;
and,
overdue government audit reports and incorrect application of government rules
for procurement and financial management.
20. These factors adversely affected the efficiency of three of the projects approved
under the RB-COSOP (SPPAP, GLLSP and LAMP). Delays in SPPAP led to a partial
loan cancellation after the 2015 MTR, but project performance improved
remarkably and the cancelled amount was restored to support performing activities.
Delays have persisted in GLLSP, and LAMP and ETI-GB have experienced similar
bottlenecks that delayed GLLSP.
Sustainability of benefits
21. Project design documents proposed elaborate arrangements for sustainability,
including capacity building of local government and community institutions and
linkages with the private sector. However, evidence of sustainability beyond project
life is not available for any of the projects included in the CCR.
22. The CDP PPA observed community infrastructure schemes for which COs had made
notable arrangements, including management committees and bank accounts for
user charges, for operations and maintenance (O&M). The 2015 SPPAP supervision
mission also reported that communities were successfully undertaking the O&M of
community infrastructure. Similar results can be expected in GLLSP because of
similar approaches to community mobilisation and infrastructure O&M. The
sustainability of COs, however, was questioned in the CDP PPA. There may be
better prospects in SPPAP and GLLSP because NRSP has worked in the project
areas for a long time and is expected to continue its presence in support of the
COs.
23. According to the MIOP PCR, continued support for sustainability, including equity
injections, is required by the small and local PPAF partners that were nurtured
through the project. The PRISM PCR reported that sustainability prospects were

7
very high and the project helped seven additional NGOs reach more than 100 per
cent operational self-sufficiency.
3. Other performance criteria
Gender equality and women’s empowerment
24. As noted above, project design and implementation emphasised women’s inclusion
in COs and other interventions by focusing certain interventions on women and
setting targets for women’s participation. The CDP PPA rated the project as
satisfactory on gender equality and women’s empowerment, noting, in particular,
that 44 per cent of the CO members were women, and women benefited from asset
transfers and training to a considerable extent. A similar approach has been
followed in SPPAP and GLLSP, with the addition that the PSC has been used to
target the poor and the poorest among women (including those heading their
households) and the assets (particularly goats in both projects, and plots of land
and low-cost houses in SPPAP) are much more valuable.
25. The MIOP PCR reported that the project designed innovative products specifically
for women or women dominated enterprises and included many partner
organisations that focused on women borrowers. The PRISM PCR observed that 73
per cent of the project’s incremental borrowers were women. The ACTED study on
MIOP and PRISM cited above concluded that microfinance had a positive impact on
women’s empowerment in both Punjab and Sindh.
Innovation and scaling-up
26. The RB-COSOP mentions three opportunities for innovation (refer to Appendix II).
One of these (new microfinance products) is articulated clearly enough to be
assessed with reference to the microfinance projects included in the CCR. As
mentioned above, MIOP was designed with this objective in mind and achieved its
objective with 23 innovations, including 16 that were scaled up. Innovation was not
an objective for PRISM, but it also developed new products such as livestock
insurance and index-based crop insurance, according to the ACTED study. The main
innovation in SPPAP is the use of the PSC for targeting, supported by validation at
the community level, an approach that was also adopted in GLLSP and sharpened
pro-poor targeting.
Environment and natural resources management
27. CDP included a component for natural resources management (NRM) and a related
objective, and the PPA rated it as moderately unsatisfactory because of its limited
contribution. The SPPAP MTR rated the project as moderately satisfactory, while
reporting that household latrines have high demand and reduce open defecation,
leading to improved sanitation conditions. In GLLSP, large ponds have been built for
preserving rainwater in Gwadar, where underground water is not available, and the
overall focus on the environment is judged to be moderately satisfactory.
Adaptation to climate change
28. The 2015 GLLSP supervision mission and the SPPAP MTR assessed the projects’
focus on climate as moderately satisfactory. The CDP PPA rated the project as
moderately unsatisfactory, observing that crop diversification could have
contributed to adaptation to climate change but was not included in the project.
C. Assessment of non-lending activities
1. Policy dialogue
29. The RB-COSOP highlights five policy linkages under its two SOs (refer to Appendix
II). Evidence is available on one of them, namely, enhanced access to microfinance
in rural areas: the MIOP PCR reported that the project facilitated policy dialogue to
enhance standards, initiatives and policy design in microfinance, and PPAF

8
partnered with the State Bank of Pakistan and the Pakistan Microfinance Network to
establish policy fora. The SPPAP project design speaks of generating knowledge to
influence future investment decisions and policy making on agricultural, livestock
and rural development initiatives. The GLLSP design included a reference to the
need for a policy decision allowing direct export of fish from Gwadar in order to end
the monopoly of exporters from Karachi. The MTRs and supervision reports have
not reported on these policy issues.
30. At a higher level, however, the portfolio review forum chaired by the Economic
Affairs Division (EAD) of the federal government contributed significantly to sharing
experiences and converting learning into actions. Policy level issues were raised at
various high level fora, including the Pakistan Development Forum and donor
groups on poverty, aid harmonisation and microfinance, as well as the United
Nations Heads of Agencies/Country Team and the United Nations thematic working
group on agriculture, rural development and poverty alleviation.
2. Knowledge management
31. The RB-COSOP identified the following priorities for knowledge management: (i)
formulate strategic action plan; (ii) focus on areas that contribute to RB-COSOP
SOs, plus those of generic relevance for rural poverty reduction; (iii) at country
level, use local expertise to exchange experiences at intra-programme and inter-
development-sector levels; (iv) at the project level, include knowledge
management or learning agenda in design. The last point is reflected in project
design, generally linked to monitoring and evaluation (M&E). For example, SPPAP
and GLLSP were designed to produce product profiles, case studies and learning
notes to be disseminated reports and workshops and seminars. Knowledge
management activities in MIOP extended across the microfinance sector to develop
innovative loan products and improved governance and efficient operations among
PPAF partners.
32. A learning process spanning design and implementation was also in evidence at the
project level and across projects. During implementation, supervision missions and
the MTRs picked up on the need for course correction and modified approaches
accordingly. Examples include: the modification of the asset transfer interventions,
by eliminating poultry and restricting asset transfer to goats, and adding low-cost
housing to the small plot of land transferred to very poor women; and dropping two
sub-components judged to generate low impact and adding food banks and
revolving funds for agricultural inputs. Learning based on previous projects was
also reflected in the design of new projects. Examples include the use of the PSC
and the importance given to asset transfers for the poor in projects designed after
SPPAP.
3. Partnership building
33. The RB-COSOP speaks of the need to expand IFAD’s partnerships with national
stakeholders, including NGOs, other civil society organisations, research institutions
and universities, and the private sector, as well as the United Nations and various
bilateral and multilateral development agencies. IFAD maintained regular
interaction with relevant government agencies and participation in donor fora and
the United Nations Country Team meetings. It also maintained regular interaction
with bilateral and multilateral development partners for coordination and possible
co-financing, one result of which was supplementary financing for GLLSP from the
Saudi Fund for Development (which has not yet been utilised). At the project level,
partnership with national partners was considered to be satisfactory with PPAF (in
MIOP and PRISM) and satisfactory (in SPPAP) and moderately satisfactory (in
GLLSP) with NRSP.

9
4. Grants
34. The following grants are assessed here:
USD 200,000 for Support for Institution-Building of the Diamer Poverty
Alleviation Programme (DPAP), awarded to the DPAP (located in Gilgit-
Baltistan), which became effective in December 2010 and was completed in
December 2013; and,
USD 340,000 for Measuring the Impact of Microfinance in Pakistan, awarded to
ACTED), which became effective in December 2014 and was completed in 2016.
35. The DPAP grant had four objectives aimed at strengthening DPAP to promote the
sustainability of 604 village organisations formed through the (closed) IFAD-
assisted Northern Areas Development Project and their linkages to service providers
and markets. These objectives are consistent with the SOs. The purpose of the
ACTED grant was to inform policy making and programming in rural microfinance
on the basis of lessons from IFAD-funded interventions. This is also consistent with
the RB-COSOP. Available information available is insufficient for assessing grant
effectiveness.
D. COSOP performance
36. The RB-COSOP demonstrated a keen awareness of the development context
prevailing in Pakistan when it was formulated. It was consistent with relevant
national strategies and plans that prevailed at the time and also took note of the
five overarching recommendations of the 2008 country programme evaluation. It
provided a set of clear guidelines for targeting, including the identification of
specific groups of women and other rural poor, while giving flexibility during project
design to propose project-specific approaches, an approach that enhanced the
relevance of project design and implementation to poverty and gender targeting. It
also identified opportunities for innovation, policy linkages, a strategy for
knowledge management, and potential partnerships.
37. The COSOP results framework is reproduced in Appendix III. It has eight outcome
indicators, five of which were not monitored, but some relevant information is
available on two of them. There are also 12 milestone indicators, four of which were
not monitored, but some relevant information is available on three. Available
information is summarised in Appendix IV and shows substantial outcome-level
achievements in access to microfinance and increase in household assets, with
evidence also pointing to increased agricultural productivity and increased contact
between farmers and extension agencies. In terms of milestones, it shows
widespread engagement of target groups through community organisation,
microfinance and related innovative approaches, and agricultural, entrepreneurial
and vocational training, with evidence also pointing to improved access to markets.
38. As discussed in the portfolio analysis, microfinance overall had a mixed impact on
poverty (positive in one of the two main provinces) and a positive impact on
women’s empowerment. Asset transfers to the poorest, particularly in the form of
livestock and land, worked in the direction of lifting the poor out of poverty and
increasing production and incomes. There is also evidence of increased productivity
from irrigation schemes and agricultural interventions, but the depth and scale of
impact could not be assessed. The indications are that vocational and
entrepreneurial training can enhance employment and earnings, but the limited
amount of available evidence does not include post-project follow-up. Increased
access to markets and services through roads is also a realistic expectation.
Effective targeting of women and the rural poor, and their mobilisation at the
community level, were major contributors to the effectiveness of the country
strategy. The sustainability of COs raises questions, but the risk is mitigated where
the social mobilisation partner is expected to continue operations when the project
ends.

10
39. Among non-lending activities, policy dialogue was evident in MIOP and high-level
government and donor fora not linked to specific projects. Knowledge management
in MIOP contributed demonstrably to innovative loan product development and
strengthening of microfinance institutions. More broadly, learning in design and
implementation was evident as a result of supervision missions and MTRs. In terms
of partnership-building, tangible outcomes were achieved as a result of IFAD-
government cooperation, particularly in portfolio review and facilitating improved
performance. Project-level partnerships among implementers in government
departments and NGOs were also strong.
II. IFAD’s performance
40. IFAD paid considerable attention in project design to targeting, inclusion of women,
selection of interventions appropriate to women and specific categories of the rural
poor, and implementation and coordination arrangements commensurate with
institutional roles and capacities. Recent project designs sought to be innovative
and proposed measures for enhancing sustainability. They also included provisions
for M&E, knowledge management and, in the two recent projects (LAMP and ETI-
GB), specific sub-components and resources for policy dialogue. Challenges remain
in strengthening project M&E capacities and supporting investment projects with
relevant and adequately-resourced non-lending activities.
III. Lessons learned and recommendations
41. Social mobilisation, combined with the use of the PSC, is an effective approach to
poverty targeting, women’s inclusion and empowerment, community ownership of
activities led by women and the poor, linkages with government and private sector
service providers, and the sustainability of benefits of local-level investments. The
RB-COSOP’s approach of providing a clear framework for targeting, including
specific groups of women and other rural poor, while leaving flexibility during
project design and implementation, allowed the inclusion of relevant geographic
and socio-economic targeting criteria in project design and relevant household-level
criteria during implementation.
42. Asset creation for the extremely poor and the chronically poor, particularly women,
is a promising instrument for sustainable poverty reduction and the empowerment
of poor, women and youth. SPPAP has demonstrated a workable model in a
challenging operating environment, which could be replicated and scaled-up by
ongoing and future projects. However, SPPAP needs to be assessed as a whole to
determine how best to combine asset transfer with other potentially high-impact
interventions.
43. New technologies are important for increased agricultural productivity and
production but need to be assessed carefully at the design stage in view of their
resource requirements. Project design and implementation should focus on a few
appropriate technologies that can attract a large number of small and resource-
poor farmers in a relatively short time. Similarly, training activities expected to
enhance productivity and employment should also be included selectively, based on
critical analysis.
44. Access to markets and a value chain approach to agriculture and livestock
production with the private sector would be useful for enhancing the possibilities
open to the rural poor. It may be challenging to create and sustain value chains in
a cost-effective manner, particularly in relatively remote and neglected areas, but
active private sector participation and appropriate financing could make it possible
in selected activities.
45. The identification of policy issues that are linked directly to project objectives, as in
the LAMP and ETI-GB designs, tends to create synergy between policy dialogue and
other project activities with the country programme. Providing resources to achieve

11
desirable policy outcomes would improve the effectiveness of policy dialogue as well
as the projects concerned.
46. In order to add value to policy and operations, knowledge management needs to be
operationalised systematically as knowledge for management at various levels. As
such, it could focus on one or more of three types of products, namely,
promotional, operational and inspirational, while recognising that there will be some
overlap in their contents.
47. M&E systems have generally succeeded, albeit, with difficulties in staff recruitment,
in reporting at the input and output levels but have struggled, without much
success, in assessing impact and outcomes. This is a continuing countrywide
challenge that suggests the need for creative approaches to capacity building. It
also suggests the need for greater clarity in project design and implementation for
using suitable quantitative and qualitative approaches, which would also require
capacity building.
48. The devolution of powers from the federal to provincial governments points towards
provincial rather than national projects in the future, unless exceptional
circumstances call for the latter. Within provinces, partnerships with provincial
governments, selected NGOs that mobilise and build community capacities, and
private sector institutions that enhance value added and sustainability represent
potential synergy. Building on tested partnerships to enhance impact in a known
operating environment is an attractive choice.

Appendix I
1
Appendix
I
Appendix I: Country background
1. Economic growth. Pakistan’s economy grew slowly during 2010-11 to 2014-15,
with the annual GDP growth rate increasing from 3.6 per cent to 4.0 per cent, and
projected to reach 4.7 per cent in 2015-1612. An annual population growth rate of
1.9 per cent suggests that per capita GDP growth has been small. The services
sector contributed the most to GDP growth during this period and agriculture the
least, the latter growing at less than 3 per cent.
2. Agriculture sector challenges and government response. The government’s
most recent assessment of the agriculture sector’s performance13 identifies several
problem areas, including the slow rate of technological innovation, limited adoption
of new farming techniques, problems with the quality, quantity and timeliness of
input supply, limited investment in construction and maintenance of infrastructure,
marketing and trade restrictions, pest and livestock disease problems, and limited
amounts of credit for agricultural production and processing. The government is
cognisant of the low returns to farmers because of the increased cost of production
and considers value addition at the farm level and industrial linkages as solutions.
The government is also supporting rural youth in acquiring new skills for
establishing agro-based businesses linked to livestock, horticulture and fisheries as
well as non-farm enterprises.
3. Long-term structural and productivity trends. Initiatives for agricultural value
addition, skill development and agro-based and non-farm enterprises have a long-
term structural context. Long-term trends indicate that Pakistan’s economy is
evolving from an agricultural base to services, largely bypassing industry14. The
economy is agricultural in terms of employment (agriculture’s share is 44 per cent)
and a service economy in terms of the structure of output (59 per cent of the GDP
is from services)15.
Growth in services labour productivity has been lower than in
agricultural and industrial labour productivity, which has constrained the average
rate of growth of the economy because of the large share of services in the GDP16.
4. Productivity and education. Moreover, the overall level of labour productivity has
increased very slowly since the 1970s. This suggests that improvements in the
average levels of literacy and education17
have not translated adequately into
productivity gains. This is consistent with the widespread view that the overall
quality of education in Pakistan has deteriorated steadily for more than a
generation. Moreover, rural areas have been left behind in terms of human capital
formation, and this affects the prospects for rural people, particularly the youth, to
get out of poverty18. More broadly, the expectation that the demographic transition
12 This information is taken from the Asian Development Outlook Update, September 2016 (https://www.adb.org/sites/default/files/publication/197141/ado2016-update.pdf), which is based on official Government of Pakistan sources, including the Ministry of Finance, Pakistan Economic Survey 2015-16 (http://www.finance.gov.pk) and State Bank of Pakistan Economic Data (http://www.sbp.org.pk). 13 Ministry of Finance, Pakistan Economic Survey 2015-16 (http://www.finance.gov.pk), chapter 2 (Agriculture). 14 Asian Development Outlook 2015 (https://www.adb.org/sites/default/files/publication/154508/ado-2015.pdf), p. 200. 15 Ministry of Finance, Pakistan Economic Survey 2014-15, Statistical Appendices (http://www.finance.gov.pk/survey_1415.html), Table 12.11 for employment share and Table 1.2 for GDP. 16 Jesus Felipe, “A Note on Competitiveness and Structural Transformation in Pakistan;” Manila: Asian Development Bank, ERD Working Paper No. 110, December 2007. The report includes analysis of trends in labour productivity during 1973-2002. 17 As highlighted, for example, by G. M. Arif and Nusrat Chaudhry, “Demographic Transition, Education and Youth Unemployment in Pakistan,” n.d. 18 Arif and Chaudhry, op. cit.

Appendix I
2
Appendix
I
that started in the mid-1990s could yield a dividend through higher per capita
output remains questionable19.
5. Productivity and skills. In the government’s assessment, a number of factors
(skills) other than education also contribute to the productivity of workers and have
received insufficient attention in the past20; these are described in terms of the skills
pyramid:
Advanced technical and professional skills, which involve substantial
investment in learning and are of value to employers in a wide range of
industries.
General and specific skills, which are skills (such as computer literacy) that are
transferable across employers.
Basic skills, which include analytical skills such as calculation and problem
solving.
Foundational skills, which include literacy, numeracy and citizenship.
6. Technical and vocational education. There are 1,647 public and private
Technical and Vocational Education and Training (TVET) institutes in Pakistan21.
TVET in Pakistan has operated largely through public sector institutions and to a
lesser extent through the private sector’s apprenticeship system in companies. All
the provinces have a Technical and Vocational Education and Training Authority
(TVETA) and a Trade Testing Board for testing and certification of all vocational
courses offered by public and private sector institutes. The National Vocational and
Technical Training Commission (NAVTTC) is the apex body at the federal level. The
principal sources of TVET are public sector programmes, skills training provided to
staff by employers, training provided by non-governmental organisations, training
offered by for-profit providers, and informal training such as the ustad-shagird
(apprenticeship) tradition. Although a major source of funding for TVET, public
funding provision is small, serving about 7 per cent of the population aged 15-24
years. Additionally, there is a mismatch between the outcomes of the training
programmes and the needs of the employers in the current system. Public
investment is low and irregular and there is a lack of quality standards and national
certification arrangements.
7. Social safety initiatives. There is also a growing, federally-coordinated social
safety initiative in the country, which the government describes in terms of the
following institutions and activities22:
19 As a result of declining fertility and mortality rates, Pakistan has been experiencing a demographic transition since the mid-1990s that is projected to last until 2040. During this phase, the proportion of working age adults (15-64 years old) in the population and of young persons in the working-age population will increase. This is viewed as a potential demographic dividend because it could lead to higher per capita output. The key assumption is that society will invest in education and human resource development to produce a more skilled, technically qualified and educated workforce among the large cohort of young people. Based on trends in the level of education, the evidence is mixed on the issue of whether society has made the investment required to benefit from the demographic dividend (Arif and Chaudhry, op. cit.). See also Rashid Amjad, “Why Has Pakistan Not Reaped Its Demographic Dividend?” chapter 4 in Zeba A. Sathar, Rabbi Royan and John Bongaarts (eds.), Capturing the Demographic Dividend in Pakistan; New York: The Population Council, 2013. 20 Pakistan Employment Trends 2007 – Skills, p. 19; Islamabad: Government of Pakistan, Ministry of Labour, Manpower and Overseas Pakistanis, Labour Market Information and Analysis Unit. 21 This paragraph is based on “Skills for Growth & Development, A Draft National Technical and Vocational Education and Training (TVET) Policy Consultation Document of the National TVET Policy Task Group,” Government of Pakistan, November 2014 (http://planipolis.iiep.unesco.org/upload/Pakistan/Pakistan_National_TVET_Policy_Draft_Consultation_2014.pdf). 22 Ministry of Finance, Pakistan Economic Survey 2015-16 (http://www.finance.gov.pk), chapter 15 (Social safety nets).

Appendix I
3
Appendix
I
the Pakistan Poverty Alleviation Fund (PPAF), an apex non-profit organisation
for community-driven development working throughout the country with 129
non-governmental partner organisations. PPAF aims to be the leading catalyst
in improving the quality of life, broadening the range of opportunities and
socio-economic mainstreaming of the poor and disadvantaged, especially
women, through microfinance, employment and enterprise development, and
wide range of community infrastructure and training activities;
the Benazir Income Support Programme (BISP), which is the largest cash
transfer programme in Pakistan, with a projected 5 million beneficiaries in
2014-15. It provides PKR 1,500 (approximately US$15) per month to the
poorest of the poor and also provides stipends for enrolling children in school,
vocational training, self-employment among women, and health care;
Zakat and Pakistan Bait-ul-Mal, which are smaller programmes focused on the
poor with contributions based on religious obligations; and,
the Employees Old Age Benefit Institution (EOBI) and the Workers Welfare
Fund (WWF).
8. The government also considers the microfinance industry to be part of the social
safety net and reports significant increases in micro-credit, micro-savings and
micro-insurance in recent years. By the first quarter of 2016, there were more than
4 million microfinance borrowers, 13.7 million savers and 5.5 million micro-
insurance policy holders23. The penetration rate reported by the Pakistan
Microfinance Network was 19.5 per cent (for the estimated market of 20.5 million).
The network includes 11 microfinance banks (which are licensed and regulated by
the central bank), 16 microfinance institutions providing specialised microfinance
services, 6 multi-sector Rural Support Programmes, and 18 other organisations
providing microfinance services as part of multidimensional operations.
9. Poverty targeting and estimates. BISP developed an objective targeting system
using a door-to-door-based census, called the Poverty Scorecard Survey (PSC), in
2010-11, which resulted in the National Socio-Economic Registry (NSER) with a
database of 27.4 million households. The PSC approach classifies households into
six categories, according to scores ranging from 1 to 100, and the lowest three of
these categories are considered poor. The categories and corresponding scores are:
non-poor (poverty score 51-100);
transitory non-poor (poverty score: 35-50);
transitory vulnerable (poverty score: 24-34);
transitory poor (poverty score: 19-23);
chronically poor (poverty score: 12-18); and,
extremely poor (poverty score: 0-11).
10. The 2013 estimates were that 9.43 million (32 percent) households out of a total of
29.36 million were poor, distributed across three categories as illustrated in Figure
1. The government revised the poverty line in 2015, as a result of which 59 million
(30 per cent) of the population are considered to be poor and an additional 20
million as vulnerable.
11. The NSER’s targeting performance compares well with the world’s top ranked
programmes of similar nature24. At present, more than 38 federal and provincial
organisations are using this registry to improve the pro-poor orientation of their
social sector programmes. The BISP has recently launched an update of the NSER
23 Pakistan Microfinance Network, MicroWatch, Issue 39, Quarter 1, January-March 2016 (http://www.pmn.org.pk/assets/articles/67c46230ff56934efe801fd0e1c4b25f.pdf). 24 This paragraph is based on a newspaper article written by the BISP chairperson: “Pakistan’s National Socio-Economic Registry: a national asset,” by Marvi Memon, The Express Tribune, 20 September 2016 (http://tribune.com.pk/story/1185259/pakistans-national-socio-economic-registry-national-asset/).

Appendix I
4
Appendix
I
with the objective of transforming it into a dynamic registry to ensure that it
remains the most credible database on the socio-economic status of the households
in the country.
Figure 1. Household distribution by poverty status, 2013 estimates (million households)
Note:
Based on monetised consumption/caloric intake (PKR per capita, per month), with a poverty line of PKR 1,959 per capita, calculated by using an average national household size of 6.3.
Source: CPLPM (Masim, QAU).
12. Food security and nutrition. Nutrition and year-round access to adequate food
are also major challenges for most of the population, particularly the rural poor. In
2016, Pakistan ranked 78 out of 113 on the Global Food Security Index and 22 per
cent of the population was undernourished25. The prevalence of stunting among
children in 2015 was 45 per cent; Pakistan ranked 125 out of 132 countries on this
indicator and 180 out of 185 on the prevalence of anaemia26. Limited food access
remains the main constraint on household food security27. Two‐thirds (66.7 per
cent) of Pakistani households are unable to afford the nutritious diet with their
current food expenditure. On a positive note, food prices, particularly of staples
stabilised during 2015-16, thus easing pressure on economic access, especially for
the poor and food insecure households.
13. Climate change. Changing patterns of snowmelt and precipitation have had
unsettling effects on the lives and livelihoods of the population in recent years,
including frequent floods, unseasonal torrential rains and prolonged droughts in arid
zones. Lack of environmental flows to the deltaic area is likely to expose
approximately 2.3 million mainly poor people to water scarcity, rising sea levels and
food insecurity. In the mountainous north, however, areas around the river are
threatened by Glacial Lake Outburst Floods28. Moreover, Pakistan is moving from a
water-stressed to a water-scarce country due to anthropogenic activity and the
changing climate, with consequences for the country’s agricultural and energy
production.
25 Economist Intelligence Unit, Global Food Security Index 2016 (http://foodsecurityindex.eiu.com/Country/Details#Pakistan). 26 International Food Policy Research Institute, Global Nutrition Report, 2016 (http://ebrary.ifpri.org/utils/getfile/collection/p15738coll2/id/130354/filename/130565.pdf). 27 World Food Programme, Vulnerability Analysis and Mapping Unit, Pakistan Food Security Bulletin Issue 4 – July 2015-June 2016 (September 2016: http://reliefweb.int/report/pakistan/pakistan-food-security-bulletin-issue-4-july-2015-june-2016-september-2016). 28 Ali Hassan Shabbir, University of Agriculture, Faisalabad, Pakistan, “Climate change and its realities for Pakistan” (http://agrihunt.com/articles/pak-agri-outlook/climate-change-and-its-realities-for-pakistan-2/).
0.48
3.05
5.90
5.98
9.46
4.49
- 1.00 2.00 3.00 4.00 5.00 6.00 7.00 8.00 9.00 10.00
Extremely poor: poverty score 0-11
Chronically poor: poverty score 12-18
Transitory poor: poverty score 19-23
Transitory vulnerable: poverty score 24-34
Transitory non-poor: poverty score 35-50
Non-poor: poverty score 51-100

Appendix I
5
Appendix
I
14. Devolution from federal to provincial governments. The Eighteenth
Constitutional Amendment of April 2010 devolved major responsibilities for service
delivery to the provinces and re-aligned Pakistan’s multi-level governance at the
federal, inter-provincial and provincial level. The state is now a predominantly
decentralised federation. While 17 federal ministries or divisions were abolished29,
the pace of change has varied across provinces and sectors, and some of the
federal-provincial issues, particularly in inter-provincial coordination and reporting
on international obligations, remain to be resolved. Since 2010, there has also been
substantial roll-back in the devolution from provincial to local governments that was
introduced by a military government in 2001. As a result of these two trends, there
has been a transfer of authority from both the federal and local governments in
favour of the provinces, leaving them with more responsibilities and powers than
ever before in the country’s history.
29 The abolished ministries and divisions were responsible for food and agriculture, livestock and dairy development, environment, health, education, social welfare and special education, tourism, special initiatives, population planning, local government and rural development, Zakat and Ushr, youth affairs, culture, sports, women development, minorities’ affairs, and labour and manpower.

Appendix II
6
Appendix
I
Appendix II: Key elements of the Pakistan COSOP, 2009
Key element Description
General and
strategic objectives
There is no explicitly stated general objective in the COSOP but the first
sentence under the heading of strategic objectives says that “The IFAD country programme will support the Government’s poverty reduction initiatives and assist in stimulating the growth of the rural economy.” This is followed by two strategic objectives (SOs):
SO1: Enhancing the access of poor rural men and women to productive assets, skills, services and improved technologies, with particular emphasis on productivity enhancement.
SO2: Strengthening the capacity of the rural poor to engage in and benefit from local development processes.
Main categories of intervention
Project-based interventions:
Under SO1: (i) access to credit, certified seeds, training, farm equipment, appropriate extension advice, etc.; (ii) investments in marketing
infrastructure, such as small rural roads, post- harvest storage, rural market facilities, etc.
Under SO2: strengthen the capacity of: (i) government line agencies at the local level, especially of those working in remote and vulnerable areas; and, (ii) community-based organisations.
Policy linkages:
Under SO1: (i) land distribution schemes, linked to a land distribution project which, if successful, could contribute to a realistic strategy for poor households to gain access to land; and (ii) enhanced access to microfinance
in rural areas, which is a key area of endeavour for IFAD.
Under SO2: (i) support institutional change in organisations such as line agencies with a view to ensuring their performance orientation, community participation and employment of women; (ii) determine whether there is need for legal changes in order to assist community organisations; and (iii) closely follow progress and opportunities for reform in microfinance sector
through participation in the Informal Donor Group on Microfinance. (The RB-COSOP does not provide any further explanation for these.)
Opportunities for innovation:
(i) Test pilot scheme on land distribution at invitation of Government of Punjab; (ii) new microfinance products: ongoing and planned projects expected to lead to innovation in financial products made available (e.g., micro-savings, micro health insurance, etc.), as well as to promote the creation of links between microfinance NGOs and commercial banks; and (iii) market access.
Knowledge management:
(i) Formulate strategic action plan; (ii) focus on areas that contribute to COSOP strategic objectives, plus those of generic relevance for rural poverty reduction (e.g., land-lease arrangements for private-sector investments); (iii)
at country level, use local expertise to exchange experiences at intra-programme and inter-development-sector levels; (iv) at project level, include knowledge management or learning agenda in design.
Targeting approach
Target areas with high incidence of poverty or which suffer from specific development problems due to their geographic location (e.g., mountainous regions, the coastal belt and low-rainfall areas).
Within the selected areas, community organizations will organize poor households and identify the most vulnerable among them.
Main target groups: (i) small farmers with limited land and livestock ownership; (ii) landless farmers (including small livestock herders and
fishermen) whose survival strategy is based on a combination of on-farm and off-farm wage employment; and (iii) women-headed households and women in poor households who have little access to resources, services or assets of their own.

Appendix II
7
Appendix
I
Specific target groups for a given project will be defined on the basis of poverty mapping exercises undertaken as part of the project design.
For all country programme activities, IFAD will focus on gender mainstreaming to promote equality and the empowerment of women and to
help address the issues of exclusion and marginalisation.
Main
implementing partners
EAD and provincial governments.
Country programme management
COSOP annual implementation progress report will be prepared by the Country Programme Management Team (CPMT).
Existing semi-annual country portfolio review meeting, chaired by EAD, will continue to be the forum for portfolio management and project performance review
COSOP mid-term review will be undertaken in late 2012.

Appendix III
8
Appendix III: COSOP results management framework (at design)
Country strategy alignment COSOP Strategic
Objectives
COSOP Outcome
Indicators
COSOP Milestone
Indicators
COSOP Institutional/Policy Objectives (in partnership
mode)
Vision 2030 A key pillar of this policy document is economic justice in which the State is an enabler for access to essential public goods such as education, employment, health and safety.
MTDF (2005-10) The MTDF’s rural and agriculture development strategy emphasizes enhancing the asset ownership of the poor by improving access to land, water and livestock; provision of agricultural inputs; access to new technologies, agricultural credit; marketing infrastructure, etc.
PRSP It gives a key role to the rural sector in accelerating growth and reducing rural poverty, playing major emphasis on employment generation.
Baseline Data Proportion of population below 2350 calories (poverty line) per day is 23%.
Proportion of children under 5 years who are underweight for their age is 35%.
Almost 50% of rural households own no land.
Only 1 out of 10 poor people who need credit have access to it.
SO1: Enhancing the access of poor rural men and women to productive assets, skills, services and improved technologies, with particular emphasis on productivity enhancement
Increased access to financial services for 100,000 rural households.
50% of the 200,000 households participating in the IFAD programme report improvement in household assets by 2014.
70% of the 120,000 rural households participating in the IFAD programme report an increase in productivity by 2012 and 200,000 by 2014.
Less than 20% of the children under five are underweight in the 120,000 participating households by 2012 and 200,000 participating households by 2014.
About 90% of the participating households have a dietary energy consumption of more than 2,350 calories per day.
80% of the rural men and women in the participating communities are organized into 8,500 community organizations.
About 50,000 households benefit through investments in small scale infrastructure projects.
Increased skills for 10,000 men and women.
About 100,000 men and women have access to financial services and 75,000 have received loans.
Increased market access for 100,000 rural households.
10,000 men and women have received training in improved agriculture and livestock management.
3,000 men and women have received training in vocational and enterprise development.
100,000 men and women are selling their produce in the market.
Advocacy for increase in female extension workers from the current 1% to 5% in Government line agencies especially the livestock extension department.
Collaborate with Government of Punjab to test its land reform initiative
Closely engage in micro-finance policy issues through participation in the Informal Donor Group to advocate specific policy issues such as cash flow based lending, debt-equity ratio cap, etc.

Appendix III
9
Vision 2030 Wider participation of rural population in the development of their communities through their own associations and organizations together with local
government and facilitating private sector participation.
MTDF (2005-10) The MTDF sees the participation of local communities, local government agencies, NGOs, the civil society and the private sector as key for balanced development in rural areas.
Baseline Data Only 50,000 CCBs have been registered so far and less than 20% of the rural poor are organized into community groups.
There is limited service delivery by government agencies and the private sector in rural areas.
SO2: Strengthening the capacity of the rural poor to engage in and benefit from local development processes
50% of the 600 IFAD project villages are informed about new agriculture and livestock management practices by 2012 and 1,000 villages by 2014.
At least 3 NGOs become sustainable and the overall outreach of the micro-finance sector reaches 3 million by 2012 and 5 million by 2014.
At least 30% of the 5,000 community organisations (COs) and 15% of the 1,000 women’s organisations (WOs) in IFAD villages are able to sustain themselves beyond project life.
About 100 government line agency staff trained.
About 15 NGOs provided capacity building support and 50 staff members imparted specialised training.
6,000 community organizations provided capacity development support.
About 1,000 COs and WOs undertaking innovative initiatives such as village banking, cooperative dairy farming, agricultural marketing and enterprise development.
Advocate institutional reform to ensure a more participatory system of planning and engaging of line agencies with community organisations.

Appendix IV
10
Appendix IV: COSOP results management framework: progress since COSOP results review 30
COSOP Outcome Indicators
COSOP Outcome Achievements (June 2016)
COSOP Milestone Indicators
COSOP Milestone
Achievements (June 2016)
SO1: Enhancing the access of poor rural men and women to productive assets, skills, services and improved technologies, with particular emphasis on productivity enhancement.
Increased access to financial services for 100,000 rural households.
Increased access for more than 250,000 households (though the rural-urban break-up was not monitored in PRISM).
80% of the rural men and women in the participating communities are organized into 8,500 community organisations (COs).
Percentage not monitored in all 5 projects, and number of COs not monitored in MIOP and PRISM. Remaining 3 projects organised 167,182 rural men and women in 8,629 organisations.
50% of the 200,000 households participating in the IFAD programme report improvement in household assets by 2014.
Indicator not monitored. Survey of PPAF-PRISM did not find increase in beneficiary assets. 3 projects reported giving assets including poultry, livestock, orchards, plant and fish nurseries, plots of land and low-cost houses to 40,072 households.
About 50,000 households benefit through investments in small scale infrastructure projects.
Indicator is relevant for 3 projects, which have benefitted at least 19,000 households directly.
70% of the 120,000 rural households participating in the IFAD programme report an increase in productivity by 2012 and 200,000 by 2014.
Indicator was not monitored in all 5 projects, but productivity is likely to have increased in CDP and SPPAP because of various productivity-enhancement interventions.
Increased skills for 10,000 men and women.
Indicator is relevant for 3 projects, which engaged more than 38,000 men and women in skill development.
Less than 20% of the children under five are underweight in the 120,000 participating households by 2012 and 200,000 participating households by 2014.
[Indicator not monitored in all 5 projects.]
About 100,000 men and women have access to financial services and 75,000 have received loans.
More than 260,000 received loans, including some un-determined double counting.
About 90% of the participating households have a dietary energy consumption of more than 2,350 calories per day.
[Indicator not monitored in all 5 projects.]
Increased market access for 100,000 rural households.
Indicator not monitored but access would have increased in CDP and SPPAP because of the link roads completed.
10,000 men and women have received training in improved agriculture and livestock management.
Indicator is relevant for 2 projects, which engaged 6,492 men and women in this training.
3,000 men and women have received training in vocational and enterprise development.
Indicator is relevant for 4 projects, which engaged more than 23,000 men and women in this training.
30 Project-specific details and sources for the 5 closed and ongoing projects are given in the tables that follow this table, together with comparisons with the RB-COSOP.
Appendix IV
11
COSOP Outcome
Indicators
COSOP Outcome
Achievements (June 2016)
COSOP Milestone
Indicators
COSOP Milestone
Achievements (June 2016)
100,000 men and women are selling their produce in the market.
Indicator not monitored in all 5 projects.
SO2: Strengthening the capacity of the rural poor to engage in and benefit from local development processes.
50% of the 600 IFAD project villages are informed about new agriculture and livestock management practices by 2012 and 1,000 villages by 2014.
The indicator is not relevant in 3 projects and was not monitored in 2 (CDP and SPPAP), in which there are indications that contact between farmers and extension agencies increased.
About 100 government line agency staff trained.
Only 10 line agency staff reported trained (in CDP).
At least 3 NGOs become sustainable and the overall outreach of the micro-finance sector reaches 3 million by 2012 and 5 million by 2014.
PRISM helped 7 additional NGOs reach more than 100% operational self-sufficiency.c There were 2 million active microfinance borrowers in December 2012 and 2.8 million in December 2014.
About 15 NGOs provided capacity building support and 50 staff members imparted specialised training.
27 NGOs received capacity building support. Numbers not reported in PRISM PCR but reasonable to assume that 45-60 staff from new, rural NGOs were trained during the project period.
At least 30% of the 5,000 community organisations (COs) and 15% of the 1,000 women’s organisations (WOs) in IFAD villages are able to sustain themselves beyond project life.
[Indicator not monitored in all 5 projects.]
6,000 community organisations provided capacity development support.
Indicator is relevant for 3 projects, which provided capacity development to approximately 8,000 COs.
About 1,000 COs and WOs undertaking innovative initiatives such as village banking, cooperative dairy farming, agricultural marketing and enterprise development.
Indicator not monitored in all 5 projects. In MIOP, 23 innovation and outreach projects completed, and 16 products and approaches successfully up-scaled, according to PCR. In PRISM, a number of innovations, products and services relevant for poor clients introduced, according to PCR.
Project-specific details, sources and comparison with RB-COSOP Mid-term Review, 2012 (in two tables)
COSOP Outcome
Indicators
Achievements
CDP a MIOP b PRISM c SPPAP d GLLSP d
Total
CCR RB-COSOP MTR
SO1: Enhancing the access of poor rural men and women to productive assets, skills, services and improved technologies, with particular emphasis on productivity enhancement.
Increased access to financial services for 100,000 rural households.
[Indicator not monitored]. PPA: Some CO members had increased access to microcredit.
PCR: An increase of 73,796 rural clients through PPAF.
PCR: Incremental number of active clients funded through PRISM was 176,288; 73% were women, > 50% target, and 40%
[Not relevant.] PMU data: 710 beneficiaries of microcredit.
Increased access for more than 250,000 households (though the rural-urban break-up was not monitored in PRISM).
Increased access to financial services for more than 200,000 households.

Appendix IV
12
COSOP Outcome
Indicators
Achievements
CDP a MIOP b PRISM c SPPAP d GLLSP d
Total
CCR RB-COSOP MTR
poor in PSC terms. [Rural number not monitored.]
50% of the 200,000 households participating in the IFAD programme report improvement in household assets by 2014.
[Indicator not monitored.] PPA: 3,074 poultry and livestock recipients. PCR: Also 776 demonstration orchards, 65 nurseries and 4,033 fish seed nurseries. Total: 7,948.
[Indicator not monitored, except in SSN-TUP under MIOP through a small sample survey.]
[Indicator not monitored.] PCR mission’s observation: Beneficiaries created physical assets. PCR quoting Gallup Study on PPAF: No significant improvements regarding possession of household assets.
[Indicator not monitored.] PMU data: 30,079 poor households received goats and poultry, 1,303 landless women received plots, and 850 of them received houses.
[Indicator not monitored.] PMU: 742 men and women given goats.
Indicator was not monitored. Gallup Study of PPAF-PRISM did not find increase in assets of beneficiaries. 3 projects reported giving assets including poultry, livestock, orchards, plant and fish nurseries, plots of land and low-cost houses to 40,072 households.
Increase in asset ownership was not measured for all participating households. However, some of the projects which were directly distributing assets such as livestock and reconstructing houses estimate that they have benefited 23,000 households.
70% of the 120,000 rural households participating in the IFAD programme report an increase in productivity by 2012 and 200,000 by 2014.
[Indicator not monitored.] PPA: Productivity likely to have increased [in a wide range of crops and livestock, but indicator not monitored].
[Indicator not monitored.]
[Indicator not monitored.]
[Indicator not monitored.] PMU data: productivity is likely to have increased from 164 irrigation schemes (3,527 beneficiaries) and 8 productivity
enhancement initiatives (10,011 beneficiaries), total 13,538 beneficiaries.
[Indicator not monitored and there is no sign of productivity enhancement.]
Indicator was not monitored in all 5 projects, but productivity is likely to have increased in CDP and SPPAP because of various productivity-
enhancement interventions.
NADP and REACH are the only two projects which reported on increase in productivity in any significant manner. NADP reported that more than 127,000
people experienced increase in productivity.
Less than 20% of the children under five are underweight in the 120,000 participating households by 2012 and 200,000 participating households by 2014.
[Indicator not monitored.]
[Indicator not monitored.]
[Indicator not monitored.]
[Indicator not monitored.]
[Indicator not monitored.]
[Indicator not monitored.]
None of the projects have reported on this indicator.

Appendix IV
13
COSOP Outcome
Indicators
Achievements
CDP a MIOP b PRISM c SPPAP d GLLSP d
Total
CCR RB-COSOP MTR
About 90% of the participating households have a dietary energy consumption of more than 2,350 calories per day.
[Indicator not monitored.]
[Indicator not monitored.]
[Indicator not monitored.]
[Indicator not monitored.]
[Indicator not monitored.]
[Indicator not monitored.]
None of the projects have reported on this indicator.
SO2: Strengthening the capacity of the rural poor to engage in and benefit from local development processes
50% of the 600 IFAD project villages are informed about new agriculture and livestock management practices by 2012 and 1,000 villages by 2014.
[Indicator not monitored.] PPA: Contact between farmers and extension agencies increased.
[Not relevant.] [Not relevant.] [Indicator not monitored.] PMU data suggest: Contact between farmers and extension agencies increased.
[Not relevant.] The indicator is not relevant in 3 projects and was not monitored in 2 (CDP and SPPAP), in which there are indications that contact between farmers and extension agencies increased.
Participants in 1,126 project villages were informed about new management practices.
At least 3 NGOs
become sustainable and the overall outreach of the microfinance sector reaches 3 million by 2012 and 5 million by 2014.
[Not relevant.] [Not relevant.] PCR: 10 of the
participating MFIs operate at above 100% operational self-sufficiency. 3 were sustainable at design. Microfinance reached 2.6 million borrowers by September 2013.
[Not relevant.] [Not relevant.] PRISM helped 7
additional NGOs reach more than 100% operational self-sufficiency.c There were 2 million active microfinance borrowers in December 2012 and 2.8 million in December 2014 e.
PRISM has not
reported on this aspect. The outreach of the sector was reported to be more than 2 million at the end of December 2011.
At least 30% of the 5,000 community organisations (COs) and 15% of the 1,000 women’s organisations (WOs) in IFAD villages are able to sustain themselves beyond project life.
PPA: Sustainability not certain [but indicator not monitored].
[Indicator not monitored.]
[Indicator not monitored.]
[Indicator not monitored.]
[Indicator not monitored.]
[Indicator not monitored.]
The projects report that 1,700 COs and 130 WOs reported being able to sustain themselves.
Sources:
a IOE, Community Development Programme Project Performance Assessment (PPA), April 2015; Project Completion Report, July 2012.

Appendix IV
14
b Aide memoire of the Project Completion Mission, November-December 2011, Annex 1 (Results Framework – Updated Status). c Project Completion Report, September 2014 (mission date November 2013). d Information provided by the Project Management Unit. e Pakistan Microfinance Review 2014 (http://microfinanceconnect.info/assets/articles/6a6d84c7346aa2f278887b911b1fe1d7.pdf).
COSOP Milestone Indicators
Achievements
CDP a MIOP b PRISM c SPPAP d GLLSP d
Total
CCR RB-COSOP MTR
SO1: Enhancing the access of poor rural men and women to productive assets, skills, services and improved technologies, with particular emphasis on productivity enhancement.
80% of the rural men and women in the participating communities are organised into 8,500 community organisations (COs).
[Percentage not monitored.] PPA: 2,960 COs with 73,265 members [but indicator denominator not monitored]. PCR: 2,983 COs with 72,923 members.
[Indicators not monitored.]
[Indicator not monitored.]
[Percentage not monitored.] PMU data: 3,755 COs formed and strengthened for 63,117 households.
[Percentage not monitored.] PMU data: 1,914 COs formed or revitalised for 30,800 households.
Percentage not monitored in all 5 projects, and number of COs not monitored in MIOP and PRISM. Remaining 3 projects organised 167,182 rural men and men in 8,629 organisations.
More than 500,000 households had benefitted from project activities and 7,500 COs had been formed.
About 50,000 households benefit through investments in small scale infrastructure projects.
PPA: Many more than 73,265 members [implies at least 10,465 households].
[Not relevant.] [Not relevant.] PMU data: Approx. 6,000 households have benefitted from small scale infrastructure.
PMU data: 2,517 beneficiaries of 71 completed schemes, assuming average of 35 households taken from March 2015 supervision.
Indicator is relevant for 3 projects, which have benefitted at least 19,000 households directly.
It was estimated that more than 173,000 households had benefitted from infrastructure projects.
Increased skills for 10,000 men and women.
PPA: Training provided to > 20,000 persons, including possible double counting.
[Not relevant.] [Not relevant.] PMU data: approx. 14,800 women engaged in skill development.
PMU data: 3,586 engaged in skill development (2,619 CO office bearers trained in CMST and FMST, 316 in vocational skills, 114 in productivity enhancement, and 537 in O&M.)
Indicator is relevant for 3 projects, which engaged more than 38,000 men and women in skill development.
More than 40,000 households had benefitted from increased skills.
About 100,000 men and women have access to financial
PPA: 17,074 loanees, including repeat
PCR: An increase of 73,796 rural clients through
PCR: Incremental number of active clients funded
[Not relevant.] PMU data: 710 beneficiaries of microcredit.
More than 260,000 received loans, including some un-
More than 300,000 households were reported to have

Appendix IV
15
COSOP Milestone Indicators
Achievements
CDP a MIOP b PRISM c SPPAP d GLLSP d
Total
CCR RB-COSOP MTR
services and 75,000 have received loans.
borrowers. PPAF. through PRISM was 176,288. [Rural number not monitored.]
determined double counting.
access to increased financial services.
Increased market access for 100,000 rural households.
[Indicator not monitored.] PPA: Access likely increased because of roads and relevant training.
[Not relevant.] [Not relevant.] [Indicator not monitored but market access would have increased through 71 completed link roads.]
[Indicator not monitored. No roads completed.]
Indicator not monitored but access would have increased in CDP and SPPAP because of the link roads completed.
More than 300,000 households reported benefitting from market access.
10,000 men and women have received training in improved agriculture and livestock management.
PPA: Training provided but [data not cited]. PCR: 6,378 men and women trained.
[Not relevant.] [Not relevant.] [Not relevant – sub-component dropped at MTR.]
PMU data: 114 men trained in productivity enhancement.
Indicator is relevant for 2 projects, which engaged 6,492 men and women in this training.
More than 22,800 men and women reported receiving this training.
3,000 men and women have received
training in vocational and enterprise development.
PPA: Training provided [but
data not cited]. PCR: 3,626 trained through TEVTA, 4,594 through Soc. Welf. & Wom. Dev. Dept. [possible duplication].
[Not relevant.] PCR: PPAF gave enterprise and
technical skills training to borrowers [but numbers not reported.]
PMU data: 14,741 women
given entrepreneurial and vocational training.
PMU data: 316 trained in
vocational skills.
Indicator is relevant for 4
projects, which engaged more than 23,000 men and women in this training.
More than 17,000 men and women
had received vocational and enterprise development training.
100,000 men and women are selling their produce in the market.
[Indicator not monitored.]
[Not relevant.] [Not relevant.] [Indicator not monitored.]
[Indicator not monitored.]
Indicator not monitored in all 5 projects.
No systematic reporting of this indicator.
SO2: Strengthening the capacity of the rural poor to engage in and benefit from local development processes
About 100 government line agency staff trained.
PPA: Government staff trained [but data not cited]. PCR: 10 line agency staff.
[Not relevant.] [Not relevant.] [Not relevant.] [Not relevant.] Only 10 line agency staff reported trained (in CDP).
1,877 government staff were trained.
About 15 NGOs provided capacity building support and 50 staff members
[Not relevant.] [Not relevant.] PCR: 27 POs received support under the Technical Support
[Not relevant.] [Not relevant.] 27 NGOs received capacity building support. Numbers not reported in
[This cell is blank in the MTR.]

Appendix IV
16
COSOP Milestone Indicators
Achievements
CDP a MIOP b PRISM c SPPAP d GLLSP d
Total
CCR RB-COSOP MTR
imparted specialised training.
and Institutional Strengthening component. Small, rural new POs were given training through consultants for key periods, particularly for quarterly reviews, annual budgeting, accounts and audit processes [but staff numbers not reported.]
PRISM PCR but reasonable to assume that 45-60 staff from new, rural NGOs were trained during the project period.
6,000 community organisations provided capacity development support.
PPA: Capacity development undertaken [but data not cited]. PCR: Managerial training for 2,889 men and 1,820 women, total [suggests CD for approx. 2,355 COs]
[Not relevant.] [Not relevant.] PMU data: 3,755 COs formed and strengthened through CD.
PMU data: 1,914 COs formed or revitalised, and strengthened through CD.
Indicator is relevant for 3 projects, which provided capacity development to approximately 8,000 COs.
3,000 COs provided capacity support.
About 1,000 COs and WOs undertaking innovative initiatives such as village banking, cooperative dairy farming, agricultural marketing and enterprise development.
PPA: No innovation. [Indicator not monitored.]
PCR: 23 innovation and outreach projects completed. 16 products and approaches successfully up-scaled. [Number of COs not monitored.]
[Indicator not monitored.] PCR: Designed and tested a number of innovations, products and services which are very relevant for poor clients, in particular in the domains of insurance, value chain development and finance,
[Indicator not monitored.]
[Indicator not monitored.]
Indicator not monitored in all 5 projects. In MIOP, 23 innovation and outreach projects completed, and 16 products and approaches successfully up-scaled. In PRISM, a number of innovations, products and services relevant for poor clients
No systematic reporting of this indicator.

Appendix IV
17
COSOP Milestone Indicators
Achievements
CDP a MIOP b PRISM c SPPAP d GLLSP d
Total
CCR RB-COSOP MTR
branchless banking, and others. Some of these await scaling up.
introduced.
Sources:
a IOE, Community Development Programme Project Performance Assessment (PPA), April 2015; Project Completion Report, July 2012. b Aide memoire of the Project Completion Mission, November-December 2011, Annex 1 (Results Framework – Updated Status). c Project Completion Report, September 2014 (mission date November 2013). d Information provided by the Project Management Unit.

Appendix V
18
Appendix
III [C
lick h
ere
and in
sert E
B ../../R
..] Appendix
III
[Clic
k h
ere
and in
sert E
B ../../R
..]
Appendix V: Ratings matrix (in line with IOE evaluation
methodology)
Assessment of country program Rating (1-6 scale)
Rural poverty impact 4.0
Relevance 5.0
Effectiveness 4.5
Efficiency 4.0
Sustainability of benefits 4.0
Gender equality 4.5
Innovation and scaling up 4.0
Natural resource management 4.0
Adaptation to climate change 4.0
Policy dialogue 4.0
Knowledge management 4.0
Partnership building 4.0
Overall country programme achievements Rating 4.2
Assessment of performance Rating 4.2
IFAD performance 4.0
Borrower performance 4.0

Appendix VI
19
Appendix
III [C
lick h
ere
and in
sert E
B ../../R
..] Appendix
III
[Clic
k h
ere
and in
sert E
B ../../R
..]
Appendix VI: Comments from the Borrower