islamic republic of afghanistan understanding ... · islamic republic of afghanistan ... poverty...
TRANSCRIPT

The National Disability Survey in Afghanistan was carried out in 2005. It is the fi rst study that covered the entire territory. Based on the International Classifi cation of Functioning, Disability and Health of the World Health Organization, and the Capabilities Approach of Amartya Sen, the NDSA aims to provide insight into the living conditions, needs and hopes of Afghans with disability and their families.The present volume of the NDSA results looks more closely at employment, income and livelihoods of persons with disability. A common belief is that persons with disability, suffering from discrimination and exclusion, are unable to access existing resources and are more at risk of poverty than non-disabled people. Comparing the situation of families living with persons with disability to those composed only of persons considered as non-disabled; the present report examines vulnerability of Afghans to shocks, and tries to identify signs and indicators of poverty. A major result is that access to basic commodities, adequate housing conditions, labour market or even social participation is not inevitably worse for households with a person with disability. The situation concerning livelihood dimensions is particularly diffi cult for families headed by a woman.
United NationsEuropean Union
NATIONAL DISABILITY SURVEY IN AFGHANISTAN, 2005 UNDERSTANDING VULNERABILITY OF AFGHANS W
ITH DISABILITY
UNDERSTANDING VULNERABILITY OF AFGHANS WITH DISABILITY
LIVELIHOODS, EMPLOYMENT, INCOME
Islamic Republic of Afghanistan
NATIONAL DISABILITY SURVEY IN AFGHANISTAN 2005

iDefi nition and Context
UNDERSTANDING VULNERABILITY
OF AFGHANS WITH DISABILITY
NATIONAL DISABILITY SURVEY IN AFGHANISTAN 2005
LIVELIHOODS, EMPLOYMENT, INCOME
© Handicap International 2006
ISBN : 978-2-909064-78-9
AuthorsParul Bakhshi, [email protected]çois Trani, [email protected] from Jean-Luc Dubois [email protected]
Editing, design and printingNew Concept Information Systems Pvt. Ltd.New Delhi, India
Published byHandicap International14, Avenue Berthelot69361 Lyon Cedex 07, FranceTel +33 (0) 4 78 69 79 79Fax +33 (0) 4 78 69 79 94email: [email protected]
Photographs Handicap International Afghanistan ProgrammeHouse No. 133Qala-e-Fatullah, 5th street,Kabul, Afghanistan

Contents
Acknowledgements xAbbreviations xiPreface xiiExecutive Summary xiiiIntroduction xiv
Definition and Context
A Few Defi nitions 1What is Poverty? 1From Vulnerability to Poverty: Facing Risk and Enduring Shocks 1Livelihood, Poverty and Disability from a Global Perspective 3Poverty and Disability in Afghanistan 3Poverty from a Gender Perspective 3Gathering Data for Poverty Analysis of a Small Population Group: a Major Challenge 4
Poverty of Living Conditions: Identifying Benchmarks
Inequality in the Access to Basic Goods 5Diffi cult Access to Drinking Water 5Sources of Light: Paucity of Resources 7Energy for Cooking: the Massive Use of Firewood a Cause for Concern? 9Access to Modern Toilet Facilities: a Benchmark for Wealth? 10Standards of Living: Main Features 10Size of Houses and Size of Households: Over Crowded Living Spaces 10Supply and Access to Food: Insuffi cient Quantity, Lack of Diversity 14Activity and Income: Struggling for Survival 17Activity and Unemployment in an Economy under Reconstruction 17Major Characteristics of the Labour Force and Market 18Activity and Disability 24Less Child Labour in Afghanistan? 26High Inequality of Income in Afghanistan 29Comparing Income of Persons with Disability and Non-Disabled 32Concluding Remarks 33
Fewer Assets for Persons with Disability: a Vulnerability Issue
Durable Goods: Relative Indicators of Well-Being 35Equipment of the House and Common Goods: Benchmarks for Wealth 35
iv Understanding Vulnerability of Afghans with Disability
Widespread Ownership of Livestock 38Land Ownership: Do Households of Persons with Disability have Smaller Land Holdings? 42Concluding on Durable Goods: Fighting Poverty in a Comprehensive Manner 44Debt and Donation: Assets or Factors of Vulnerability? 45Resort to Loan and Level of Debt: Higher for Persons with Disability 45Concluding on Borrowing Practices: Risk Factor or Capability Asset? 56Income through the Social Network: the Social Income 56Concluding on Social Income 58
General Conclusions
Disability: a Dormant Factor? 59Urban or Rural Settings: an Expected Difference 59Female-headed Households: the most Vulnerable and the Poorest 59Access to the Labour Market: a Matter of Perception 60The Way Forward: Mainstreaming, Empowerment, Participation of Persons with Disability 60
Bibliography 61
Annexure 63Tables Related to Water Supply 63Tables Related to Light Supply 65Tables Related to Cooking Energy Supply 67Tables Related to Toilet Facilities 68Tables Related to Housing 69Tables Related to Food Supply 71Tables Related to Activity and Employment 73Tables Related to Income 82Tables Related to Durable Goods 83Tables Related to Livestock Ownership 86Tables Related to Land Ownership 92Tables Related to Debt 95Tables Related to Social Income 103

v
Lst of TablesTable 1. Distribution of Households according to Location and Gender of the Head of the Household 4Table 2. Distribution of Households of Persons with Disability and the Non-Disabled according to the Gender of the Head of the Household 4Table 3. Average Ratio of Number of Members by Room and Number of Household Members according to the Number of Rooms in the House 12Table 4. Distribution of Active People by Main Professions 22Table 5. Distribution of Active People by Sectors of Activity 23Table 6. Activities of Children Aged 6 to 14 28Table 7. Gini Coeffi cient for Income from Activity 30Table 8. Poverty and Inequality in the South Asia Region 30Table 9. Ownership of Livestock: Comparing NRVA 2003 and NDSA 2005 41Table 10. Gini Coeffi cient of Land Ownership 44Table 11. Average Amount of Loan for Urban and Rural Households 49Table 12. Distribution of Households according to the Location of Drinking Water 63Table 13. Distribution of Households according to the Time Needed to Fetch Drinking Water 63Table 14. Distribution of Households according to Types of Water Supply Available 64Table 15. Distribution of Households according to Location of Drinking Water in Urban and Rural Areas 64Table 16. Distribution of Households according to Location of Drinking Water Available in Urban and Rural Areas and Gender of the Head of Household. 65Table 17. Distribution of Households according to Sources of Light Supply Available 65Table 18. Distribution of Households according to Sources of Light Supply Available in Urban and Rural Areas 66Table 19. Distribution of Households according to Gender of the Head of the Household and Sources of Light Supply Available 66Table 20. Distribution of Households according to Sources of Energy for Cooking 67Table 21. Distribution of Households according to Sources of Energy for Cooking in Urban and Rural Settings 67Table 22. Distribution of Households according to Access to Types of Toilet Facilities 68Table 23. Distribution of Households according to Access to Types of Toilet Facilities in Urban and Rural Settings 68Table 24. Distribution of Households by Number of Rooms in the House 69Table 25. Distribution of Number of Household Members and Number of Rooms in the House 69Table 26. Distribution of People according to Number of Rooms in the House by Urban and Rural Settings 70Table 27. Distribution of Households according to Gender of the Head of the Household by Number of Rooms in the House 70Table 28. Distribution of Households according to Sources for Supply of Food 71Table 29. Distribution of Households in Urban and Rural Areas according to Sources of Supply of Food 71Table 30. Distribution of Households according to Suffi ciency of Food 72Table 31. Distribution of Households in Urban or Rural Settings according to Suffi ciency of Food 72Table 32. Distribution of Households according to Gender of the Head of the Household and Suffi ciency of Food 73Table 33. Distribution of Persons with Disability and Non-disabled Aged 15-64 according to the Employment Situation 73Table 34. Distribution of Household according to the Ratio of Employed Members 74
Contents

vi Understanding Vulnerability of Afghans with Disability
Table 35. Distribution of Persons with Disability and Non-Disabled Aged 15-64 according to Employment Situation and Gender 74Table 36. Distribution of Persons with Disability and Non-Disabled Between 14 and 65 according to Employment Situation and Gender (analysis on series of questions) 75Table 37. Distribution of People Above 14 according to Employment Situation Gender and the Situation in the Household 75Table 38. Distribution of People according to Profession 76Table 39. Distribution of Persons with Disability and Non-Disabled Above 14 according to Activity Status 77Table 40. Distribution of Persons with Disability and Non-Disabled Above 14 according to Farmer Status 78Table 41. Distribution of Persons with Disability and Non-Disabled Age 15-64 according to Diffi culties Faced in the Workplace 78Table 42. Distribution of Children with Disability and Non-Disabled Children Aged 7 to 15 according to Activity and Gender 79Table 43. Distribution of Children with Disability and Non-Disabled Children Aged 7 to 15 according to Time Spent in Household Tasks and Gender 79Table 44. Distribution of Children with Disability and Non-Disabled Children Aged 7 to 15 according to Types of Household Tasks and Gender 80Table 45. Distribution of Boys with Disability and Non-Disabled Boys Aged 7 to 15 according to Types of Field Work 81Table 46. Distribution of Boys with Disability and Non-Disabled Boys Aged 7 to 15 according to Types of Jobs 81Table 47. Monthly Activity Income of Active People 82Table 48. Distribution of Active Persons Aged 15-64 with Disability and Non-Disabled according to Monthly Professional Income 82Table 49. Distribution of Active Males Aged 15-64 with Disability and Non-Disabled according to Monthly Professional Income 83Table 50. Distribution of Persons with Disability and Non-Disabled Living in Households Possessing the Following Goods 83Table 51. Distribution of Households Possessing the Following Goods and Equipments 84Table 52. Distribution of Households according to the Ownership of Goods and Equipments by Urban and Rural Settings 85Table 53. Distribution of Households according to Gender of the Head of the Household and Ownership of Goods and Equipments 86Table 54. Distribution of Persons with Disability and Non-Disabled Living in Households Possessing Livestock 86Table 55. Distribution of Households according to Ownership of Livestock 87Table 56. Distribution of People in Urban and Rural Areas Living in Households Possessing Livestock 87Table 57. Distribution of People according to Gender of the Head of the Household and Possession of Livestock 87Table 58. Distribution of Households of Persons with Disability and Non-Disabled according to Ownership of Livestock by Type of Animals 87Table 59. Distribution of Households according to Ownership of Different Types of Animals 89Table 60. Distribution of People according to Gender of the Head of the Household and Ownership of Animals by Types of Animals 91Table 61. Distribution of Households according to Ownership of Land 92Table 62. Distribution of Persons with Disability and Non-reporting Ownership of Land 92Table 63. Distribution of Household according to Ownership of Land by Urban and Rural Areas 93

vii
Table 64. Distribution of Households according to Gender of the Head of the Household and Ownership of Land 93Table 65. Distribution of Households according to Gender of the Head of the Household and Personal Ownership of Land 93Table 66. Distribution of Households according to the Size of the Land 93Table 67. Distribution of Households according to the Size of the Land which is Cultivable 94Table 68. Distribution of Households according to Gender of the Head of the Household and the Size of the Land of the Family 94Table 69. Distribution of Households according to Gender of the Head of the Household and to the Size of the Land of the Family which is Cultivable 95Table 70. Distribution of Persons with Disability and Non-Disabled Above 14 Having Taken a Loan in the Last 5 Years according to Activity 95Table 71. Distribution of Persons with Disability and Non-Disabled above 14 Having Taken a Loan in the Last 5 Years according to Gender and Age 96Table 72. Distribution of Persons with Disability and Non-Disabled above 14 Having Taken a Loan in the Last 5 Years according to the Area of Living 96Table 73. Distribution of Persons with Disability and Non-Disabled Above 14 Having Taken a Loan in the Last 5 Years according to Major Geographical Areas 97Table 74. Distribution of Persons with Disability and Non-Disabled above 14 according to Amounts of Loans 97Table 75. Distribution of Persons with Disability and Non-Disabled above 14 according to Amounts of Loans and Age Groups 98Table 76. Distribution of Persons with Disability and Non-Disabled above 14 according to Amounts of Loans and Gender 98Table 77. Distribution of Persons with Disability and Non-Disabled above 14 according to Amounts of Loans and Living Area 99Table 78. Distribution of Persons with Disability and Non-Disabled above 14 according to the Level of Debt 99Table 79. Distribution of Persons with Disability and Non-Disabled above 14 according to the Level of Debt by Age Group 100Table 80. Distribution of Persons with Disability and Non-Disabled above 14 according to the Level of Debt by Gender 100Table 81. Distribution of Persons with Disability and Non-disabled Above 14 according to the Level of Debt by Living Area 101Table 82. Distribution of Persons with Disability and Non-Disabled above 14 according to the Level of Debt and the Situation of Activity 101Table 83. Distribution of Persons with Disability and Non-Disabled above 14 according to the Purpose of Loan 102Table 84. Distribution of Persons with Disability and Non-Disabled above 14 according to the Money Lender 102Table 85. Distribution of Persons with Disability and Non-Disabled above 14 Having Received Money according to Gender 103Table 86. Distribution of Persons with Disability and Non-Disabled above 14 Having Received Money according to Donors 103Table 87. Distribution of Persons with Disability and Non-Disabled above 14 Having Received Money according to the 3 Main Donors 104Table 88. Distribution of Persons with Disability and Non-Disabled above 14 Having Received Money according to Donors and Gender 104Table 89. Distribution of Persons with Disability and Non-Disabled above 14 Having Received Money according to Amounts 105Table 90. Distribution of Persons with Disability and Non-Disabled above 14 Having Received Money according to Amounts and Gender 105
Contents

viii Understanding Vulnerability of Afghans with Disability
List of FiguresFigure 1. Distribution of Persons and Households Having Easy Access to Drinking Water 6Figure 2. Distribution of Households according to the Time Needed to Fetch Drinking Water 6Figure 3. Distribution of People according to the Time Needed to Fetch Water in Urban/Rural Areas 7Figure 4. Distribution of Household according to Sources of Light 8Figure 5. Distribution of Households according to Main Source of Light in Urban and Rural Areas 8Figure 6. Distribution of Households according to Main Source of Light and Gender of the Head of the Household 8Figure 7. Distribution of Households according to Sources of Energy used for Cooking 9Figure 8. Distribution of Households according to Main Source of Energy for Cooking in Urban and Rural Settings 9Figure 9. Distribution of Households according to Access to Types of Toilet Facilities 10Figure 10. Distribution of Households according to the Number of Rooms in the House 11Figure 11. Distribution of People according to the Number of Rooms in the House and the Size of the Household 12Figure 12. Lorenz Curve of the Ratio of Number of Members by Room 13Figure 13. Distribution of People according to the Number of Rooms in the House by Urban and Rural Settings 13Figure 14. Distribution of People according to Gender of the Head of the Household and Number of Rooms in the House 14Figure 15. Distribution of Households regarding Sources for Supply of Food 14Figure 16. Distribution of Households Regarding Sources of Supply of Food in Urban and Rural Areas 15Figure 17. Distribution of Households regarding Amount of Food Available 16Figure 18. Distribution of People in Urban and Rural Areas regarding Amount of Food Available 16Figure 19. Distribution of People according to Gender of the Head of Household and Supply of Food 17Figure 20. Distribution of All Afghans Above 14 according to the Employment Situation 19Figure 21. Distribution of Persons Above 14 according to the Employment Situation 19Figure 22. Distribution of Households according to the Employment Ratio 20Figure 23. Distribution of Persons Aged 15-64 according to the Employment Situation and Gender 20Figure 24. Level of Employment Considering Additional Activities 21Figure 25. Distribution of Active People above 14 by Employment Status 22Figure 26. Distribution of Farmers by Types of Status 24Figure 27. Distribution of Active People by Types of Diffi culties Faced in the Workplace 25Figure 28. Distribution of Active Disabled and Non-Disabled Persons by Types of Diffi culties Faced in the Workplace 26Figure 29. Distribution of Children Between 7 and 14 Years Old according to Employment Situation 27Figure 30. Distribution of Afghan Children Between 7 and 14 Years Old according to the Activity Situation 27Figure 31. Distribution of Children Between 7 and 14 Years Old according to the Employment Situation 28Figure 32. Distribution of Monthly Activity Income for All Active People and Aged 15-64 31Figure 33. Distribution of Monthly Activity Income for Active Males Aged 15-64 31Figure 34. Distribution of Active Persons according to the Monthly Professional Income 32Figure 35. Distribution of Active Men above Aged 15-64 according to the Monthly Professional Income 32Figure 36. Distribution of Households regarding Ownership of Goods or Equipment 36

ix
Figure 37. Distribution of People Regarding Possess of Goods or Equipment in Urban and Rural Areas 37Figure 38. Distribution of Households according to Gender of the Head of the Household for Ownership of Goods or Equipment 38Figure 39. Distribution of Households according to the Ownership of Livestock 39Figure 40. Distribution of Households according to the Gender of the Head of the Household and the Ownership of Livestock 40Figure 41. Distribution of Households regarding Ownership of Livestock in Urban and Rural Areas 41Figure 42. Distribution of Households regarding Ownership of Land 42Figure 43. Lorenz Curves of Land Ownership Inequalities 43Figure 44. Distribution of Persons with Disability and Non-Disabled Above 14 with Loans Taken since 5 Years according to Situation of Activity 46Figure 45. Distribution of Persons with Disability and Non-disabled Above 14 according to the Amount of Loans and Age Groups 46Figure 46. Distribution of Persons with Disability and Non-Disabled Above 14 with Loan Taken since 5 Years according to Gender 47Figure 47. Distribution of Persons with Disability and Non-Disabled Above 14 with Loan Taken since 5 Years according to the Area of Living 47Figure 48. Distribution of All Afghans Above 14 according to the Amount of Loans 48Figure 49. Distribution of Persons with Disability and Non-Disabled Above 14 according to the Amount of Loans 48Figure 50. Distribution of Persons with Disability and Non-disabled Above 14 according to the Amount of Loans and Age Group 49Figure 51. Distribution of Persons with Disability and Non-Disabled Above 14 according to the Amount of Loans and Gender 50Figure 52. Distribution of Persons with Disability and Non-Disabled Above 14 according to the Amount of Loans and the Living Area 50Figure 53. Distribution of All Afghans Above 14 according to the Amount of Debt 51Figure 54. Distribution of Persons with Disability and Non-Disabled Above 14 according to the Level of Debt and the Age Group 51Figure 55. Distribution of Persons with Disability and Non-Disabled Above 14 according to the Level of Debt and the Age Group 52Figure 56. Distribution of Persons with Disability and Non-Disabled Above 14 according to the Level of Debt and Gender 52Figure 57. Distribution of Persons with Disability and Non-Disabled Above 14 according to the Level of Debt and the Living Area 53Figure 58. Distribution of Persons with Disability and Non-Disabled Above 14 according to the Level of Debt and the Situation of Activity 53Figure 59. Distribution of All People Above 14 Having Taken Loans according to Purpose of Loan 54 Figure 60. Distribution of Persons with Disability and Non-Disabled Above 14 according to the Purpose of Loan 54Figure 61. Distribution of all People above 14 according to the Lender 55Figure 62. Distribution of Persons with Disability and Non-Disabled Above 14 according to the Lender 56Figure 63. Distribution of Persons with Disability and Non-Disabled Above 14 receiving Money according to Gender 57Figure 64. Distribution of Persons with Disability and Non-Disabled Above 14 according to the 3 Main Donors 57Figure 65. Distribution of Persons with Disability and Non-Disabled Above 14 by Amount of Money Received and Gender 58
Contents
x Understanding Vulnerability of Afghans with Disability
Acknowledgements
Firoz Ali Alizada (HI)Elena M. Andresen (University of Florida)Parween Azimi (NPAD)Mario Biggeri (University of Florence)Federica Biondi (INTERSOS)Tania Burchardt (London School of Economics)Alberto Cairo (ICRC)Sonia Cautin (HI)Fiona Gall (SGAA)Flavio Comin (Sd Edmonds College, Cambridge University)Heather Dawson (HI)Elias Hameedi (Afghan Human Right Commission)Peter Hansen (JHU)Susan Helseth (UNMACA)Chris Lang (NPAD)Ashraf Mashkoor (MoPH, HMIS)Kim Mikenis (HI)Dan Mont (World Bank)Sue McKey (HI)Cécile Rolland (HI)Bjorn Schranz (HI)Arnault Serra Horguelin (UNAMA)Lorella Terzi (University of London)Frederic Tissot (French Embassy)Erik Vandissel (MoLSA/UNICEF)Peter Ventevogel (Health Net International)Lakwinder P Singh (JHU Team)
The Government of AfghanistanMinistry of Martyrs and Disabled and Social Affairs Ministry of Public Health Central Statistics Offi ce
Non Governmental Organisations � Afghan National Association for the Deaf� Aide Médicale Internationale� Afghan Research and Evaluation Unit� Agroaction� Community Center for Disabled� CHA, Coordination of Humanitarian Assistance
� Handicap International Belgium� Healthnet International � IAM, International Assistance Mission� ICRC, International Committee of the Red Cross� INTERSOS Humanitairan Aid Organization� MADERA � Medecins du Monde� National Afghan Disabled Women Association� National Association for Disabled of Afghanistan� National Disability Union� National Programme for Action on Disability � People in Need� Sandy Gall’s Afghanistan Appeal� SERVE, Serving Emergency Relief and Vocational
Enterprises� Swedish Committee of Afghanistan� UNICEF� World Bank, Disability Unit
We are grateful to our donors:� The European Commission� UNOPS/UNDP� UNMAS (Volunteer Trust Fund)� Ambassade de France� Swiss Agency for Development and Cooperation
A special thank you to the Monitor and Master Trainers, the 200 surveyors without whom this survey would never have been carried out and the families who accepted to answer the questionnaire.
The NDSA team consists of: � Jean François Trani, NDSA Manager� Parul Bakhshi, Consultant� Layla Lavasani, Regional Manager� Steffen Schwarz, Regional Manager� Jean-Luc Dubois, Scientifi c Advisor� Dominique Lopez, Statistics Advisor

xi
Abbreviations
AFAs AfghanisBPDS Basic Package of Disability ServicesBPHS Basic Package of Health ServicesCDAP Comprehensive Disabled Afghans’ Program CDC Central for Disease ControlCI Confi dence IntervalCSO Central Statistics Offi ceDPO Disabled People OrganizationEU European UnionGoA Government of AfghanistanHA HectareHDI Human Development IndexHH HouseholdHI Handicap InternationalHrs HoursICRC International Committee of Red CrossINGO International Non Government OrganizationLSP Livelihoods and Social Protection MDG Millennium Development GoalsMICS Multi Indicators Cluster SurveyMins MinutesMMDSA Ministry of Martyrs, Disabled and Social Affairs MoPH Ministry of Public HealthMoWA Ministry of Women’s AffairsMoPW Ministry of Public WorksMRRD Ministry for Reconstruction and Rural DevelopmentNDC National Disability CommissionNDS National Disability StrategyNDSA National Disability Survey in AfghanistanNDF National Development FrameworkNEEP National Emergency Employment Programme NGO Non Governmental OrganizationNPAD National Programme for Action on DisabilityNRVA National Risk and Vulnerability AssessmentNSP National Strategic Plan NVP National Vulnerability ProgrammePIP Public Investment ProgrammePNA Preliminary Needs AssessmentPTSD Post Traumatic Stress Disorder PwD Persons with DisabilitySQ. MT. Square MeterTOT Training of TrainersUN United NationsUNAMA United Nations Assistance Mission for AfghanistanUNDP HDI United Nations Development Programme Human Development IndexUNDP United Nations Development ProgrammeUNICEF United Nation’s Children’s FundUNOPS United Nations Offi ce for Project ServicesWHO World Health Organization
Abbreviations
xii Understanding Vulnerability of Afghans with Disability
Like many other organisations working in the disability sector in Afghanistan over the last 20 years, at SGAA we have become progessively aware that the medical model of physical rehabilitation is not enough. Yes, it is tremendously satisfying to see a small girl with polio walk for the fi rst time with callipers in our workshop or to see a paraplegic propel himself home in his new wheelchair, or to watch a young, strong, amputee stride out of the door with his new prosthesis, completely independent once more. But mobility and physical rehabilitation are only the beginning. Increasingly over the years the disabled have been asking us to provide them training, employment opportunities and loans to start their own businesses and we have tried to meet some of these needs. Mobility can be solved relatively easily, but social and economic integration is a lifelong challenge for the majority of our disabled friends in Afghanistan. We need to support and lobby the Government of Afghanistan to draw up labour laws that encourage employment of the disabled and include provisions in other laws to make sure that the disabled are provided equal access to health, education, skills training and public life.
As this report documents, lack of clean drinking water, insuffi cient food and low income are diffi culties faced by a majority of poor households in Afghanistan. Poverty is a great leveller and affects equally families with able members as it does families with a disabled member. The report notes that women-headed households are particularly vulnerable among the low income groups. Within a poor family the burden of a member with a disability can negatively affect the coping strategy of the family. It is also much harder and more diffi cult for the individual with a disability to be valued in the family if he or she cannot participate in many of the domestic chores or employment generating activities of the family. Yet, if a person with a disability can receive education or learn a skill this can help provide them a specifi c role in the family and wider social acceptance. We can see great examples of men and women with disabilities fi nding work and becoming the bread-winners in their families around us today in Afghanistan.
With the information and recommendations from this third report in the NSDA series all of us engaged in development in Afghanistan can identify the main priorites that need to be followed to improve liveliehoods for the disabled and other vulnerable groups – empowerment, mainstreaming and equalisation of opportunities.
Fiona GallProject Consultant
Sandy Gall’s Afghanistan Appeal
Preface
xiiiExecutive Summary
Executive Summary
The National Disability Survey in Afghanistan was carried out by Handicap International for the Ministry of Martyrs and Disabled and Social Affairs (MMDSA) and the Ministry of Public Health (MoPH) and with the support of the Central Statistics Offi ce (CSO) of the Ministry of Economics. This survey aims at: � Evaluating the prevalence of disability;� Developing a general typology of persons with disability;� Evaluating the access to public services mainly educational, social and medical services for persons with disability;� Gathering quality information in order to further defi ne policy priorities aiming at mainstreaming persons with disability, capability
development, autonomy and social integration.
The methodology applied is based on the following rules:� A probabilities proportional to population size sampling procedure with a national wide sample of 5250 households (all 34
provinces) using pre-census data to control the sample size of clusters (little size variation);� A screening questionnaire of 27 questions to identify “diffi culties” in terms of ability/inability (avoiding direct simple questions on
disability) with a large reference to ICF and Sen`s Capabilities Approach adapted to the Afghan cultural context;� A one and a half month training (theoretical and practical) of the team of monitors/supervisors and a three weeks training of
all surveyors on all disability issues, cluster household survey principles, the questionnaire, the sampling but also security and organisational problems.
A test of all tools, especially the questionnaire (elaborated by specialists and reviewed by experts, Afghan organisations of persons with disability), in both rural and urban areas.
The present third volume of the NDSA results looks more closely at employment, income and livelihoods of persons with disability. A common belief is that persons with disability, suffering from discrimination and exclusion, are unable to access existing resources and are more at risk of poverty than non-disabled people. This report aims at identifying the differences between households of persons with and without disability in terms of livelihoods, to understand in what ways or on which specifi c aspects are disabled people among the poorest of the poor in Afghanistan in particular, as it seems to be the case across the world in general.
The main fi nding of this analysis is the fact that when considering situations of severe or chronic poverty, disability is more of a ‘dormant’ factor. In other words, households of persons with disability are not signifi cantly worse off than non-disabled households in terms of livelihoods, commodities and assets. The factors that do seem to play an important role on livelihood indicators are the living settings (urban or rural) and the gender of the head of the household. However, disability does have an impact on the livelihoods of the more advantaged sections of society, suggesting that disability does come into play once the living situation improves. As a result, the households that have a person with disability may not be poorer at this point, but they are defi nitely more vulnerable in the long term. This in turn leads to believe that if policies and programmes are not set up in order to target this vulnerable group, then they will be left behind in the development effort.

xiv Understanding Vulnerability of Afghans with Disability
MessageIntroduction
There is ongoing worldwide debate over what poverty means in terms of everyday life and how it impacts the individual and the community. Looking at poverty in solely monetary terms is not suffi cient for assessing the situation. In the past decade focus has shifted from looking at poverty in terms of income and assets to including other factors that impact quality of life. These may include health and education indicators as well as the social and family resources that a person can rely upon. Moreover, poverty must be looked at in the long term if sustainable development is the goal. This implies that not only should the focus be on the present situation of persons (with disability in this case), but also on indicators of how this situation is likely to evolve in the medium and long-term. Looking at these aspects entails giving attention to the vulnerability of individuals and groups, to their ability to draw on various resources in order to deal with the unpredictable, on their social resources and support systems. For persons with disability, this aspect is crucial in order to assess their quality of life, as well as to identify the mechanisms that already do exist for them to fall back upon and to strengthen these, along with defi ning ways to fi ghting poverty and vulnerability in the long-run.
The present third volume of the NDSA results looks more closely at employment, income and livelihoods of persons with disability. A common belief is that persons with disability, suffering from discrimination and exclusion, are unable to access existing resources and are more at risk of poverty than non-disabled people. This report aims at identifying the differences between households of people with and without disability in terms of livelihoods, in order to better understand in what ways or on which specifi c aspects persons with disability are in fact not only one of the poorest groups in Afghanistan, but also one of the most vulnerable.
This report on employment, income and living conditions is closely related to the notion of poverty, as well as that of vulnerability. Even though Afghanistan still continues to rank among the lowest on the Human Development Index (HDI), it is relevant to think about what forms rapid development will take and who might get left behind. In the last fi ve years, Afghanistan has been benefi ting from the support of the international community with the aim to build sustainable infrastructures and systems . Considerable efforts have been made to improve the economic situation, and worldwide attention is currently focused on what is happening in the country.
However, there remain a few domains where these efforts seem not to have met the expectations of the population. Many voices are now raising only to underline the lack of effectiveness and achievements of the various partners working on disability, but also the lack of fi nancial commitment of the international community after half a decade of support. More Afghans are showing disappointment as violence has increased sharply and the capacity to provide better service and facilities, including school, health facilities, clean water, sanitation, roads, and electricity for the population, still leaves a lot to be desired. A holistic and comprehensive view of the situation is a pre-requisite to defi ning and implementing programs that will be accepted by the benefi ciaries.
The fi ndings related to livelihoods and living conditions have a unique characteristic in the series of reports of the NDSA. Whereas other reports are based upon the ‘individual’ perspective and compare answers given by persons in different situations, this report is based on answers regarding the household, as a unit. Thus,

xv
Foreword
Introduction
1 VULNERABILITY ANALYSIS AND MAPPING UNIT OF THE WORLD FOOD PROGRAMME AND THE VULNERABILITY ANALYSIS UNIT OF THE MINISTRY OF RURAL REHABILITATION AND DEVELOPMENT (2004), Report on Findings from the 2003 National Risk and Vulnerability Assessment (NRVA) in Rural Afghanistan, December 2004, 123 p., http://www.mrrd.gov.af/vau/.
this report looks at the impact of disability, not just on the individual, but also on the family as a whole. How exactly does disability of one member weigh upon their living conditions; does it impact the livelihoods of the entire household? Wherever it is possible, results will be compared to those of NRVA 20031 for which reports are available. In fact, some of the questions, notably about possession of assets, were voluntarily identical with the NRVA questions in order to make comparison over time possible.


1Defi nition and Context
This fi rst section attempts to defi ne a few concepts that will be referred to throughout this report: poverty and vulnerability, and the links with sustainable development. It will also look at some of the specifi cities of the context that the NDSA was carried out in.
A Few Definitions
What is Poverty?When travelling through Afghanistan, a general observation that can be made is the discernible diffi culty of ways of ensuring livelihoods, for a great majority of the population. What exactly is poverty? Defi nitions of poverty vary widely and as a consequence, ways of fi ghting poverty are multiple.
Monetary Income PovertyStudying livelihoods of the Afghan population leads to taking into consideration monetary poverty. Absolute monetary poverty can be defi ned as the insuffi ciency of income to be able to get the daily food ratio. Poverty, in terms of livelihoods is the consequence of paucity of adequate nutrition, lack of clothes, of accommodation, etc. Poverty of potentiality is the lack of education, equipment, social networks and support systems. Thus, the most common and traditional way of defi ning poverty is in terms of monetary income poverty. The way chosen to measure poverty, on which experts continue to debate, is as essential as the multiple meanings this word encompasses. Currently, economic policy choices and the effi ciency of these choices depend on the accuracy and reliability of the tools used to collect relevant information. If only monetary poverty is taken into consideration, it is obvious that this aspect has varied greatly and increased during the last 25 years in Afghanistan. Focusing on poverty of resources and of choices available in the larger sense paint a different picture. On these aspects the country is characterised by shortage of basic social services: education, health, water sanitation, shelter.
Poverty of CapabilitiesHowever, over the last decade, a more comprehensive view has emerged, mostly pushed forward by the Human Development reports and the theories of Amartya Sen to look at poverty in terms of capabilities. The Capabilities Approach2 is based on “beings and doings that an individual has reason to value”, thus shifting the focus from the specifi cities of the disabling situation to how to look at establishing equality in terms of possibilities and choices. Amartya Sen’s Capabilities Approach looks at not what a person actually does (functionings) but at the range of possibilities that he/she chooses that specifi c functioning from – this is the capability set. Taking the view of the individual shifts the focus to the interaction between the person, with his/her limitations in functioning (which may or may not be permanent) and the context, which consists of a number of resources as well as expectations, stereotypes and often prejudice and discrimination. As a result, looking at poverty of capabilities does not stop at just what the person does but what his/her choices are. These choices are infl uenced by the social and human resources, especially in traditional contexts.
From Vulnerability to Poverty: Facing Risk and Enduring ShocksVulnerability is defi ned as “the probability of having his/her own situation worsens when facing a dramatic event.
2 See SEN A., (1999) Development as Freedom, Oxford University Press, Oxford.
Definition and Context

2 Understanding Vulnerability of Afghans with Disability
A worsening, which can lead, depending on various factors, to poverty”3. In other words vulnerability refers to the incapability of people or households, or even the community at large, to transform assets and income into capabilities. It is the inability to resist an external or covariate4 shocks or to face risks that threaten and reduce their well-being. External shocks such as violence or insecurity, drought, fl ood, late frosts are common in Afghanistan. During the fi eldwork in June 2005, a complete cluster in Faryab province has been destroyed by a fl ood. People were interviewed in front of ruins of their houses or in tents handed over by relief agencies. During the summer 2006, a drought has threatened the country due to inadequate rainfall in the months of April and May 20065. In November 2006, fl oods killed 40 people and injured 20 others in Uruzgan province. Some 300 houses and hundreds of acres of farmland were also destroyed in this province.
Many factors determine the level of vulnerability. The ownership of goods, land or animals are assets against vulnerability. The benefi t of a large social network can also be of assistance in trying times. The level of activity measured by the number of active people inside the household and other income-generating activities have an impact on the level of vulnerability and, as a consequence, infl uence falling into a situation of poverty. If it is essential to measure the phenomenon through indicators such as proportion of people living below the poverty line or probability of occurrence of a shock, it is also important to look more closely at the factors which help a person stay out of poverty, and help him/her face risks in the long term. Fighting vulnerability by increasing capabilities to resist shocks is what can be called reducing the vulnerability of disadvantaged groups.
The Human Development Report has put forward the Human Development Index (HDI) that examines the dynamic aspect of development by focusing on a variety of factors. It is very possible that a certain population does not seem worse off than another in terms of monetary poverty, but may be more vulnerable. This means that when faced with risks and challenges (such as illness, disease, unemployment…) these vulnerable groups are at a greater risk of falling (back) into poverty: their potentialities are weak and the way they adjust their livelihood strategies to cope with shocks might not be adapted or suffi cient to cope with them to escape from poverty.
The NRVA 2003 has shown that years of war and drought have had a very negative impact on the rural average household’s ability to acquire and maintain assets as well as their ability to handle the adverse effects of multiple shocks to their livelihood6. The present report analyses attempt to present the features that determine the vulnerability of persons with disability as well as of the households they live in: what is the link between the number of people working, the assets of an household and poverty? What is the impact of the level of education or the state of unemployment of the head of household on the livelihoods of the household? How does disability impact the living conditions of the entire household unit? Answering these questions will in turn help to determine poverty and vulnerability of households that have a disabled member and look at ways of enhancing their capabilities. “These capabilities can be enhanced by public policy, but also, on the other side, the direction of public policy can be infl uenced by the effective use of participatory capabilities by the public.7”
3 See DUBOIS J.L., ROUSSEAU S., (2001), “Reinforcing Household’s Capabilities as a Way to Reduce Vulnerability and Prevent Poverty in Equitable Terms”, paper presented at the fi rst Conference on the Capability Approach, Justice and Poverty: Examining Sen’s Capability Approach, June 5th-7th 2001, Von Hugel Institute, St Edmund’s College, Cambridge University, http://www.st-edmunds.cam.ac.uk/vhi/.4 NRVA (2003) use the term of covariate shock for a shock independent of the family, to differentiate from idiosyncratic shocks which typically occur at a household level, like loss of employment or death of a member. See VULNERABILITY ANALYSIS AND MAPPING UNIT OF THE WORLD FOOD PROGRAMME AND THE VULNERABILITY ANALYSIS UNIT OF THE MINISTRY OF RURAL REHABILITATION AND DEVELOPMENT (2004), op. cit., p. 53.4 SEN A., (1999) , op. cit., p. 18.5 United Nations Assistance Mission in Afghanistan (UNAMA) July 25, 2006, To support the urgent needs of more than 2.5 million peopled affected by drought and food insecurity, the Government of Afghanistan and the United Nations today launched an appeal for nearly $76.4 million, covering an initial period of six months. That is on top of the 6.5 million the World Food Programme estimates were already at risk of hunger.6 VULNERABILITY ANALYSIS AND MAPPING UNIT of the World Food Programme and the VULNERABILITY ANALYSIS UNIT of the Ministry of Rural Rehabilitation and Development (2004), op. cit.7 SEN A., (1999), op. cit, p 18.

3Defi nition and Context
Livelihood, Poverty and Disability from a Global PerspectiveIt is a widespread belief that persons with disability are among the more disadvantaged groups, especially in developing and transitional countries. Experts refer to exclusion and discrimination, less access to food or poor quality of food, inadequate health care and incapacity of the education system to include them. Finally, persons with disability are believed to have reduced capabilities for work. In Afghanistan, where 71.6% of inhabitants live in rural areas, livelihood is based largely on agricultural activities: “All (these reasons) contribute to less opportunities for disabled people and reduced income generating capabilities8”. They are often considered as being more at risk of falling into poverty and thus being more vulnerable than the non-disabled population. On the other hand, people living in poverty are more likely to become disabled due to a lack of access to basic services, illness, malnutrition... This correlation between disability and risk of poverty has been described in a number of different studies. But from correlation to causality, it is diffi cult to conclude clearly on which factor is predominant in a certain situation and determines the others. Poor households, because they lack adequate food, basic sanitation, good housing or access to health services, particularly preventive health services, are more at risk of disabling diseases. Or, what could be a temporary and curable disease, might transform into a permanent disability. It is stated in the UN Compendium that “in many respects, the disability rate is a socioeconomic indicator, a type of poverty index, or index of development9”.
Poverty and Disability in AfghanistanThe only mechanism of public policy that specifi cally addresses poverty of persons with disability in Afghanistan is the pension welfare system of the Ministry of Martyrs and Disabled and Social Affairs. This Ministry was established in the Soviet infl uenced era of Afghanistan as a pensions and welfare organisation catering specially to the war related disabled and the families of the martyrs. The role of the ministry was expanded in 2002 under the Transitional Islamic State of Afghanistan to become the lead government agency to advocate, facilitate coordination and dissemination of information regarding persons with disability. Despite this role given to the MMDSA, line ministries were and still are responsible for integrating the needs of the disabled population in their policies and programs. An effi cient coordination body is still missing in order to bridge communication, coordination and cooperation gaps between the various ministries.
According to NRVA 200310, poverty is strongly correlated with the presence of disabled members in the household, among other attributes. It is also correlated with lack of access to infrastructures and services, lack of access to school and health centres, lack of capital assets such as land and livestock. Landownership also appears to be a good divider between rich and poor11. The present report tries to further investigate this possible link, emphasising the analysis by comparing the situation of households with a person with disability and those without any person with disability.
Poverty from a Gender PerspectiveAn interesting perspective to look at livelihood and poverty in Afghanistan is provided by the gender approach. It is often emphasised that women are in general more disadvantaged than men in Afghanistan, especially in terms of income and livelihoods. Therefore, it is relevant to assess the major differences in the livelihood situation between households according to the gender of the head of the household in order to determine if women with disability are more vulnerable to (chronic) poverty than men with disability.
8 HOOGEVEEN J. G. (2005), Measuring Welfare for small Vulnerable Groups. Poverty and Disability in Uganda, Journal of African Economies, 2005 14(4):603-631.9 STATISTICAL OFFICE, DEPARTMENT OF INTERNATIONA L ECONOMIC AND SOCIAL AFFAIRS, UNITED NATIONS (1990), “Disability Statistics Compendium”, Statistics on Special Population Groups, Series Y, No. 4, New York.10 VULNERABILITY ANALYSIS AND MAPPING UNIT OF THE WORLD FOOD PROGRAMME AND THE VULNERABILITY ANALYSIS UNIT OF THE MINISTRY OF RURAL REHABILITATION AND DEVELOPMENT (2004), op. cit.11 For a very interesting and clarifying analysis of land system in Afghanistan see ALDEN W. L. (2004), “Looking for Peace in the Pastures: Rural Land Relations in Afghanistan”, Afghanistan Research and Evaluation Unit, AREU, December 2004, 125 pp., p.14.

4 Understanding Vulnerability of Afghans with Disability
Table 1. Distribution of Households according to Location and Gender of the Head of the Household
Location of Household† Man Head of the HH
Woman Head of the HH Total
UrbanNumber 5323 427 5750
% in location 24.0** (1) 38.4**(1) 24.7
RuralNumber 16888 685 17573
% in location 76.0 61.6 75.3
Total Number 22211 1112 23323
Source: NDSA. Note: † Weighted by the number of household in the cluster without persons with disabilities living there. (1) Test of comparison between head of households` gender. ** Signifi cant at p<0.001. * Signifi cant at p<0.05. (2) Test Chi 2 of Pearson of independence. ** Signifi cant at p<0.01 * Signifi cant at p<0.05.
Table 1 shows that households with a woman as head of the household (which do remain far less in number), are relatively more present in urban areas than in rural areas. This may be due to less stigmatisation of women alone with children and less social pressure of community in urban areas as well as more opportunities and support from various organisations. In villages, women who are alone usually are widows. Some of them, especially in areas close to foreign borders, are left alone for limited periods of time by their husband who went abroad to get a job. In both cases, these women usually go back to the house of their father or of a brother. Also widows and women whose husbands are away go to town to live with members of the family hoping to have more chances to fi nd a work or for a better life.
Table 2. Distribution of Households of Persons with Disability and the Non-Disabled according to the Gender of the Head of the Household
Presence of a Person with Disability in the Household†
Man Head of the HH
Woman Head of the HH Total
HH without PwDNumber 20473 1044 21517
% in category 92.2 93.9 92.3
HH with PwDsNumber 1738 68 1806
% in category 7.8 6.1 7.7
Total Number 22211 1112 23323
Source: NDSA. Note: † Weighted by the number of household in the cluster without persons with disabilities living there. (1) Test of comparison between head of households` gender. ** Signifi cant at p<0.001. * Signifi cant at p<0.05. (2) Test Chi 2 of Pearson of independence. ** Signifi cant at p<0.01 * Signifi cant at p<0.05.
There is no signifi cant difference of number of persons with disability in households headed by a woman compared to those headed by a man.
Gathering Data for Poverty Analysis of a Small Population Group: a Major ChallengeTo use a national sample survey to gather data on living conditions of persons with disability is a major challenge. The size of the sample might be too small for welfare estimates and poverty indicators to be statistically signifi cant. Wherever there are not enough observations, this is specifi ed in the table note. Most of the time, the sample is large enough to provide a good insight into the livelihoods, poverty and vulnerability of households. This report questions the assertion that there is an obvious relationship between disability and poverty and vulnerability. Poverty is studied through livelihood situations and characteristics of households in Afghanistan, comparing the situation of households with a person with disability to those without. The results are weighted for most tables using the coeffi cient of the ratio of the number of households in the country to the number of households in the sample.
5Poverty of Living Conditions: Identifying Benchmarks
A study focusing on livelihoods of persons with disability compares the situation of this vulnerable group with that of the non-disabled, by taking into consideration a series of indicators and items. As discussed in the introduction, it appears that the livelihood picture is a complex one. The indicators considered in this report were those selected in the interview as valid benchmarks for comparison of well-being and quality of life. Three major fi elds are considered here: access to basic goods, standards of living and activity and main sources of income.
Inequality in the Access to Basic GoodsAccess to basic commodities and utilities help characterise living conditions for households that include persons with disability as well as those with non-disabled persons as an expression of the level of poverty. It is a basic needs’ approach, which tries to evaluate the current situation of people regarding basic goods. These living conditions are assessed through the following items:� Access to drinking water;� Source of lighting;� Energy used for cooking;� Toilet facilities;� Supply and access to food.
For all these items, the report presents the situation of the two types of households in order to assess the impact of disability on the living conditions of the entire unit. It is important to state that questions regarding livelihoods were asked to one member of the family, as it was assumed that they would be valid for all members living under the same roof.
Difficult Access to Drinking WaterAccess to drinking water is, needless to mention, essential. Sometimes, in the dry season, it is necessary to walk one entire day to go and catch water at a river. Inadequate access to drinking water constitutes a major burden and strongly infl uences standard of living. In 2003, according to NRVA results12, only 24% of households reported accessing water from safe sources. Figure 1 (and Table 12 in Annexure) looks at the distribution of persons with disability and the non-disabled on one hand, and the households that they live in on the other hand, regarding access to drinking water. The responses are similar for households with persons with disability and for non-disabled households. A large majority of people in Afghanistan (74.3%) have to go outside the compound to fetch water. Nevertheless, people living in households without any person with disability were signifi cantly slightly more (5.6% more) to declare having to go outside the compound.
Poverty of Living Conditions: Identifying Benchmarks
12 VULNERABILITY ANALYSIS AND MAPPING UNIT OF THE WORLD FOOD PROGRAMME AND THE VULNERABILITY ANALYSIS UNIT OF THE MINISTRY OF RURAL REHABILITATION AND DEVELOPMENT (2004), op. cit.

6 Understanding Vulnerability of Afghans with Disability
Figure 1. Distribution of Persons and Households Having Easy Access to Drinking Water
35
30
25
20
15
10
5
0Source of Water within the Compound/House
� Non-Disabled � Persons with Disability
� Households without Persons with Disability
� Households with Persons with Disability
A large majority of Afghans (95.6%, see Table 14 in the Annexure) do not have a pipe supply of water and need to walk more than 5 minutes to the nearest source of drinking water (63.7% of them, see Figure 2 and Table 13 in the Annexure). If a majority (54.5%) has to walk only 10 minutes to fetch water, in some villages, a small minority (6.8%) has to walk more than 2 hours. This is mainly due to drought that has made sources of water dry. The rest of the population (35%) needs between 10 minutes and 1 hour to fetch water: and this household task is carried out by children and women every day, along with number of other tasks. On the positive side, more households with a person with disability have less than 10 mins to go to fetch water than households without a person with disability.
Figure 2. Distribution of Households according to the Time Needed to Fetch Drinking Water
Less than 5 Mins 6 to 10 Mins 11 to 15 Mins 16 to 20 Mins 30 Mins and More21 to 30 Mins
� Households without Persons with Disability
� Households with Persons with Disability 45
40
35
30
25
20
15
10
5
0
Table 14 in the Annexure shows that a majority of Afghans have access to water that is not always drinkable, supporting the NRVA 2003 results. The use of water in hygiene is an important preventive measure; contaminated water remains an important cause of diarrhoea and other ailments. Cholera and dysentery cause severe, sometimes life threatening forms of diarrhoea, especially when it comes to very young children who get dehydrated at an alarming rate.
Less than 8% of the population have access to a private or public tap, which do not reliably and systematically provide safe water. 23.8% have access to hand pumps and 29.5% to a well, among them, 9.4% of the wells

7Poverty of Living Conditions: Identifying Benchmarks
13 Kariz (also known as kareze or qanat) is an ancient underground channel irrigation system invented in Persia (Iran). It is a slopping tunnel that brings water from an underground source in a range of hills down to a dry plain at the foot of these hills. Its advantage over an open air aqueduct is that less water is lost by evaporation on its way from the hill to the plain. In the high and dry plains of Afghanistan, agriculture is often impossible without irrigation. The Afghans have put in place a system for harnessing the water: the kareze tunnels. Part of the network of kareze as been destroyed during the confl ict.14 World Health Organization, Water Sanitation and Health (WSH) Water-related diseases.
are open well or Kariz13. 2.6% more households with a person with disability have access to a well in the residence compared to non-disabled households. Another 39.3% go to rivers, ponds, lakes, streams or fi nd a way to collect rainwater. In periods of drought, the level of wells and other natural sources can become so low that water provision becomes a challenge: this requires walking long distances to fi nd an alternative source of water. Use of water with mud in unsafe ponds with stagnant water where insects breed then becomes common. As a result, the drinking water supply, which is normally safe, becomes unreliable. Spreading of diseases, and widespread diarrhoea thus increase. Diarrhoea is a symptom of infection caused by a host of bacterial, viral and parasitic organisms most of which can be spread by contaminated water. All these are more common when there is a shortage of clean water for drinking, cooking and cleaning, and when basic hygiene is diffi cult to maintain14.
A statistically signifi cant higher proportion of urban households (56.5%) have access to water inside their compound than those in rural areas (15.5%) as shown in Table 15 in the Annexure. Such a result is expected, as it is easier to develop water sanitation supply in towns. The difference is also statistically signifi cant between households where the head is a woman compared to those where the head is a man: 63.2% of those headed by a woman have water inside the compound. This is explained by a relatively highly higher presence of women head of households in towns and cities than in villages.
Sources of Light: Paucity of Resources Afghan households often use two or more sources of energy for light. Responses in following Figure 4 in next page (and Tables 17 in the Annexure) are considering two possible answers. Among all sources of light, only a minority of Afghan households (12.3%) use main power. The large majority of these live in towns: 27.9% of those who live in towns and cities declare using main power as the major source of light, and only 4.3% of those who live in rural areas declare using it. These households are usually located in villages that are close to urban areas and not in remote areas (see Table 18 in the Annexure). But even for those households that are connected to electricity, the shortage of supply is recurrent.
Taking into account only the fi rst answer given during the interview, thus considering only the main source of light, as in Figure 5 next page, 41% of households in urban areas use main power. However, they also need to rely on an alternate source of lighting (generator, kerosene lamps or candles) in case of power shortage,
Figure 3. Distribution of People according to the Time Needed to Fetch Water in Urban/Rural Areas
Less than 5 Mins 6 to 10 Mins 11 to 15 Mins 16 to 20 Mins 30 Mins and More21 to 30 Mins
� Urban
� Rural70
60
50
40
30
20
10
0

8 Understanding Vulnerability of Afghans with Disability
which remains frequent. This is why when one considers both answers, the percentage of households using main power within the total supply, decreases. Kerosene, petrol or gas lamps are mainly used in rural areas as the fi rst source of lighting. This was also true in towns in 2005. During winter, each block of Kabul received power only a few hours a day, at best.
Figure 4. Distribution of Household according to Sources of Light
Main Power Generator/Battery/Invertor
Kerosene Petrol/Gas
Candles Others
� Households without Persons with Disability
� Households with Persons with a Disability
80
70
60
50
40
30
20
10
0
Figure 5. Distribution of Households according to Main Source of Light in Urban and Rural Areas
Main Power Generator/Battery/Invertor
Kerosene Petrol/Gas
Candles Others
� Urban
� Rural90
80
70
60
50
40
30
20
10
0
However, there is no statistically signifi cant difference between households with a person with disability and households without a person with disability for this indicator.
Figure 6. Distribution of Households according to Main Source of Light and Gender of the Head of the Household
Main Power Generator/Battery/Invertor
Kerosene Petrol/Gas
Candles Others
� Man Head of the Household
� Woman Head of the Household80
70
60
50
40
30
20
10
0

9Poverty of Living Conditions: Identifying Benchmarks
On the other hand, statistically signifi cant differences between households where the head is a woman to those where the head is a man are evident (Figure 6 and Table 19 in the Annexure):� 19.9% of female headed households have access to main power against only 11.9% for households
headed by a man;� 16.3% of these use mainly a generator, battery or invertors against only 8.8% for households headed
by a man.
These results can be easily explained by a higher number of woman-headed households in urban areas where main power and generators are accessible than in rural areas.
Energy for Cooking: the Massive Use of Firewood a Cause for Concern?The use of fi rewood (47.9% of all source of cooking used), or dung is still the main and most commonly used source of energy for cooking (Figure 7 and Table 20 in the Annexure). There is no signifi cant difference between households with a person with disability and households without a person with disability.
Figure 7. Distribution of Households according to Sources of Energy used for Cooking
Gas Stove with Kerosene/Petrol
Firewood Dung OtherCharcoal
� Households without Persons with Disability
� Households with Persons with Disability50
45
40
35
30
25
20
15
10
5
0Electricity
It is only in towns and cities that 40% of households use gas as a main source of energy for cooking (See Figure 8), but even there fi rewood is the major energy for cooking. Charcoal and electricity are rarely used even in towns for cooking (See Table 21 in the Annexure). Some research in developing countries has shown that if in the short term, deforestation is due to population growth and agricultural expansion, over the long-term deforestation is aggravated by wood harvesting for fuel and export15. This might be one of the challenges for the coming years.
Figure 8. Distribution of Households according to Main Source of Energy for Cooking in Urban and Rural Settings
Gas Stove with Kerosene/Petrol
Firewood Dung OtherCharcoal
� Urban
� Rural80
70
60
50
40
30
20
10
0Electricity
15 ALLEN, J. C. & BARNES, D. F. (1985), “The Causes of Deforestation in Developing Countries”, Annals of the Association of American Geographers 75 (2), 163-184.
10 Understanding Vulnerability of Afghans with Disability
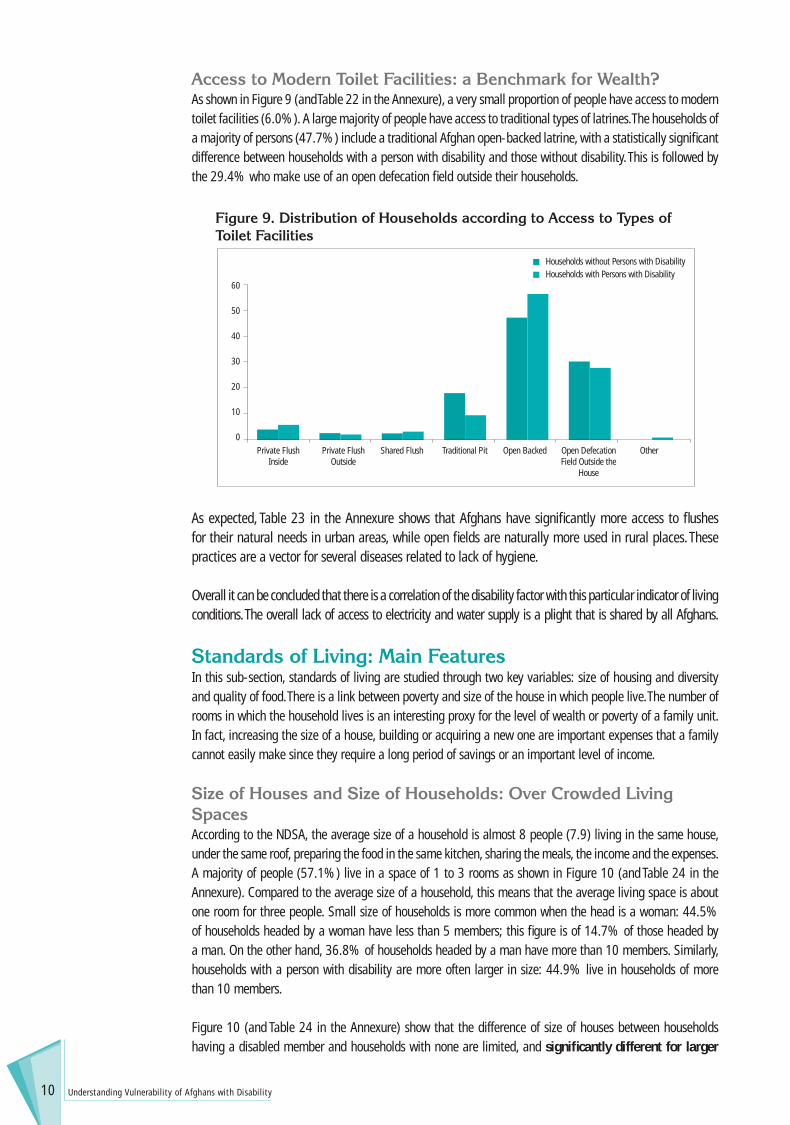
Access to Modern Toilet Facilities: a Benchmark for Wealth?As shown in Figure 9 (and Table 22 in the Annexure), a very small proportion of people have access to modern toilet facilities (6.0%). A large majority of people have access to traditional types of latrines. The households of a majority of persons (47.7%) include a traditional Afghan open-backed latrine, with a statistically signifi cant difference between households with a person with disability and those without disability. This is followed by the 29.4% who make use of an open defecation fi eld outside their households.
Figure 9. Distribution of Households according to Access to Types of Toilet Facilities
Private Flush Inside
Private Flush Outside
Shared Flush Traditional Pit OtherOpen Backed
� Households without Persons with Disability
� Households with Persons with Disability60
50
40
30
20
10
0Open Defecation Field Outside the
House
As expected, Table 23 in the Annexure shows that Afghans have signifi cantly more access to fl ushes for their natural needs in urban areas, while open fi elds are naturally more used in rural places. These practices are a vector for several diseases related to lack of hygiene.
Overall it can be concluded that there is a correlation of the disability factor with this particular indicator of living conditions. The overall lack of access to electricity and water supply is a plight that is shared by all Afghans.
Standards of Living: Main FeaturesIn this sub-section, standards of living are studied through two key variables: size of housing and diversity and quality of food. There is a link between poverty and size of the house in which people live. The number of rooms in which the household lives is an interesting proxy for the level of wealth or poverty of a family unit. In fact, increasing the size of a house, building or acquiring a new one are important expenses that a family cannot easily make since they require a long period of savings or an important level of income.
Size of Houses and Size of Households: Over Crowded Living SpacesAccording to the NDSA, the average size of a household is almost 8 people (7.9) living in the same house, under the same roof, preparing the food in the same kitchen, sharing the meals, the income and the expenses. A majority of people (57.1%) live in a space of 1 to 3 rooms as shown in Figure 10 (and Table 24 in the Annexure). Compared to the average size of a household, this means that the average living space is about one room for three people. Small size of households is more common when the head is a woman: 44.5% of households headed by a woman have less than 5 members; this fi gure is of 14.7% of those headed by a man. On the other hand, 36.8% of households headed by a man have more than 10 members. Similarly, households with a person with disability are more often larger in size: 44.9% live in households of more than 10 members.
Figure 10 (and Table 24 in the Annexure) show that the difference of size of houses between households having a disabled member and households with none are limited, and signifi cantly different for larger
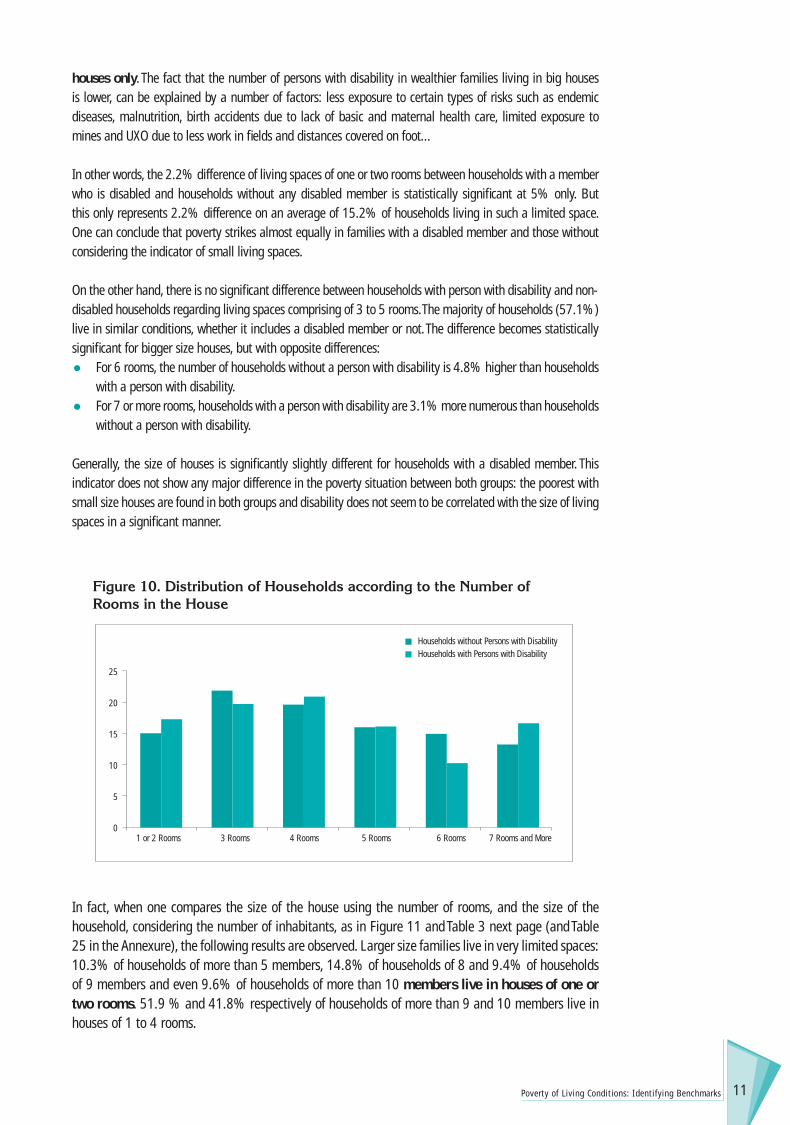
11Poverty of Living Conditions: Identifying Benchmarks
houses only. The fact that the number of persons with disability in wealthier families living in big houses is lower, can be explained by a number of factors: less exposure to certain types of risks such as endemic diseases, malnutrition, birth accidents due to lack of basic and maternal health care, limited exposure to mines and UXO due to less work in fi elds and distances covered on foot…
In other words, the 2.2% difference of living spaces of one or two rooms between households with a member who is disabled and households without any disabled member is statistically signifi cant at 5% only. But this only represents 2.2% difference on an average of 15.2% of households living in such a limited space. One can conclude that poverty strikes almost equally in families with a disabled member and those without considering the indicator of small living spaces.
On the other hand, there is no signifi cant difference between households with person with disability and non-disabled households regarding living spaces comprising of 3 to 5 rooms. The majority of households (57.1%) live in similar conditions, whether it includes a disabled member or not. The difference becomes statistically signifi cant for bigger size houses, but with opposite differences: � For 6 rooms, the number of households without a person with disability is 4.8% higher than households
with a person with disability.� For 7 or more rooms, households with a person with disability are 3.1% more numerous than households
without a person with disability.
Generally, the size of houses is signifi cantly slightly different for households with a disabled member. This indicator does not show any major difference in the poverty situation between both groups: the poorest with small size houses are found in both groups and disability does not seem to be correlated with the size of living spaces in a signifi cant manner.
Figure 10. Distribution of Households according to the Number of Rooms in the House
1 or 2 Rooms 3 Rooms 4 Rooms 5 Rooms 7 Rooms and More6 Rooms
� Households without Persons with Disability
� Households with Persons with Disability
25
20
15
10
5
0
In fact, when one compares the size of the house using the number of rooms, and the size of the household, considering the number of inhabitants, as in Figure 11 and Table 3 next page (and Table 25 in the Annexure), the following results are observed. Larger size families live in very limited spaces: 10.3% of households of more than 5 members, 14.8% of households of 8 and 9.4% of households of 9 members and even 9.6% of households of more than 10 members live in houses of one or two rooms. 51.9 % and 41.8% respectively of households of more than 9 and 10 members live in houses of 1 to 4 rooms.

12 Understanding Vulnerability of Afghans with Disability
Table 3. Average Ratio of Number of Members by Room and Number of Household Members According to the Number of Rooms in the House
Number of Rooms
Ratio Number of Members by
Room
Number of Members in all
Households
Ratio Number of Members by Room in Households with
PwDs
Number of members in
Households with PwDs
Ratio Number of Members by Room
in Households without PwDs
Number of members in Households
without PwDs
1 Room 5.6 4.6 5.4 4.2 5.6 4.6
2 Rooms 3.3 5.0 3.3 5.2 3.3 5.0
3 Rooms 2.2 5.3 2.5 5.8 2.2 5.3
4 Rooms 1.9 6.0 2.0 6.3 1.9 5.9
5 Rooms 1.6 6.0 1.7 6.5 1.6 6.0
6 Rooms 1.3 6.0 1.6 6.8 1.3 6.0
7 Rooms 1.3 6.3 1.4 6.9 1.3 6.2
8 Rooms 1.1 7.1 1.4 7.4 1.1 7.1
9 Rooms and more 0.9 6.1 1.1 7.1 0.9 6.1
Total 2.0 5.7 2.2 6.2 2.0 5.7
Table 3 and Figure 11 lead to the following conclusions. � There is a general proportionally positive relationship between the number of people in the household
and size of the house. Households with persons with disability are a little bigger in size, but the general ratio is similar for both households with and without persons with disability.
� This leads to confi rm the fact that when there is a possibility, people do occupy the living space that is available. This is not the case in all traditional cultures.
� The curves in Figure 11 intersect for a household with a living space between 1 and 2 rooms and having a size of 4 to 5 people living together. This could be considered by convention as a relative poverty threshold. Below this point, houses can be considered as overcrowded. Above this point, the house can be considered as better off. This reference point can be used as a social norm for poverty reduction policy when considering housing policy in general.
Figure 11. Distribution of People according to the Number of Rooms in the House and the Size of the Household
1 Room 2 Rooms 3 Rooms 4 Rooms 5 Rooms 6 Rooms 7 Rooms 8 Rooms 9 Roomsand More
Ratio Number of Members by RoomNumber of Members in All HouseholdsRatio Number of Members by Room in Households with Persons with DisabilityNumber of Members in Households with Persons with DisabilityRatio Number of Members by Room in Households without Persons with DisabilityNumber of Members in Households without Persons with Disability
8
7
6
5
4
3
2
1
0
Source: NDSA

13Poverty of Living Conditions: Identifying Benchmarks
16 The Lorenz curve, a cumulative frequency curve that compares the distribution of a specifi c variable (ratio of number of people per room) with the uniform distribution that represents equality. This equality distribution is represented by a diagonal line, and the greater the deviation of the Lorenz curves from this line, the greater the inequality.
The Afghans, not considering the situation with regards to disability, are in very different conditions in terms of housing as shown in Figure 12. Figure 12 shows the Lorenz16 curve for the proportion of households and the ratio of number of people by room. Globally, 50% of:� All households have more than 1.6 people living by room;� Households with persons with disability have more than 2 people living by room;� Households without a person with disability have only more than 1.6 people living by room.
This shows that additional living space that may be attributed to a member of a household where a person with disability lives is probably smaller than that for members of non-disabled households. This furthermore suggests that disability does impact living standards when these tend to improve.
Figure 12. Lorenz Curve of the Ratio of Number of Members by Room
100
90
80
70
60
50
40
30
20
10
00 10 20 30 40 50 60 70 80 90 100
It is noteworthy to see how and to what extent the most disadvantaged households living in rural settings are living in small houses: 18% more of rural households (41.2%) live in houses of 1 to 3 rooms than urban households (23.2%). This occurs even if living spaces in large towns and cities are much more expensive than in villages. In contrast, 22.7% more of urban households (60.8%) live in houses of at least 5 rooms compared with rural households (38.1%). This indicates higher standards of living in urban settings. A further calculation shows that the gap between households living in the largest houses (more than 7 rooms) is 17% when one compares the largest urban centres (Kabul, Herat, Jalalabad, Mazar-I-Sharif, Kandahar and Kunduz) to the rest of the country. Largest houses are found most often in major urban areas.
Figure 13. Distribution of People according to the Number of Rooms in the House by Urban and Rural Settings
1 or 2 Rooms 3 Rooms 4 Rooms 5 Rooms 7 Rooms and More6 Rooms
� Urban
� Rural
25
20
15
10
5
0
14 Understanding Vulnerability of Afghans with Disability
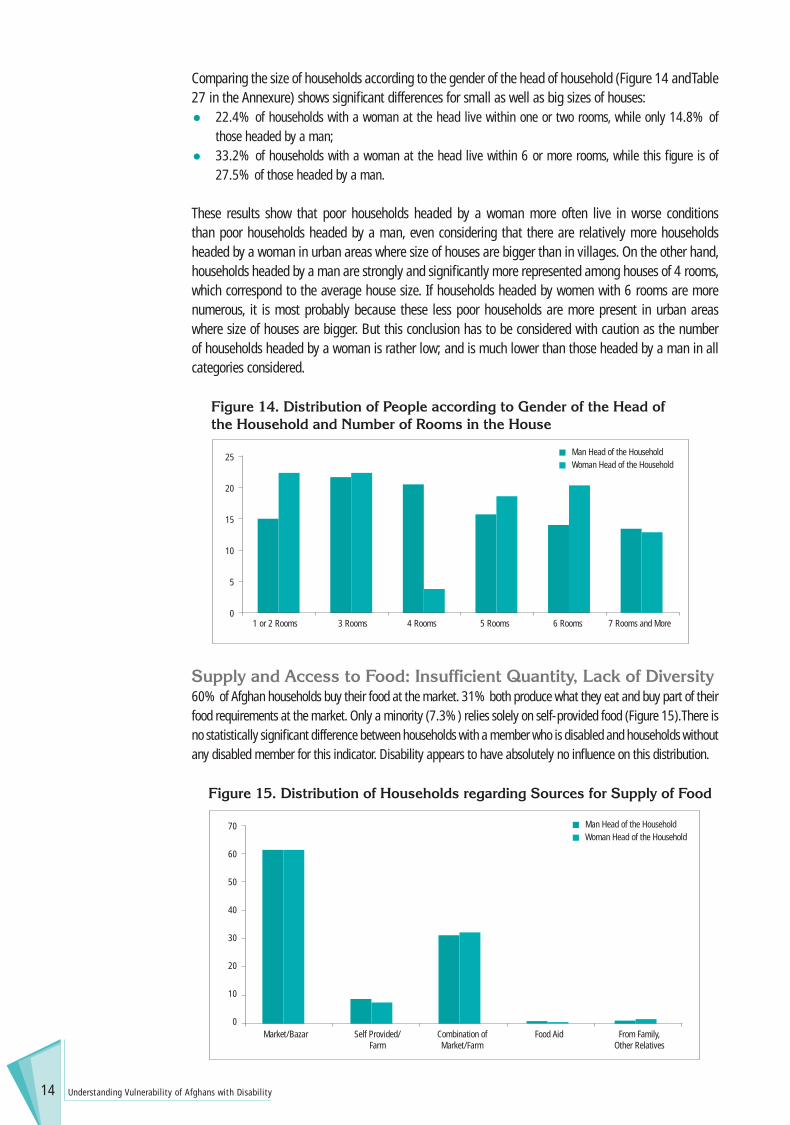
Comparing the size of households according to the gender of the head of household (Figure 14 and Table 27 in the Annexure) shows signifi cant differences for small as well as big sizes of houses: � 22.4% of households with a woman at the head live within one or two rooms, while only 14.8% of
those headed by a man;� 33.2% of households with a woman at the head live within 6 or more rooms, while this fi gure is of
27.5% of those headed by a man.
These results show that poor households headed by a woman more often live in worse conditions than poor households headed by a man, even considering that there are relatively more households headed by a woman in urban areas where size of houses are bigger than in villages. On the other hand, households headed by a man are strongly and signifi cantly more represented among houses of 4 rooms, which correspond to the average house size. If households headed by women with 6 rooms are more numerous, it is most probably because these less poor households are more present in urban areas where size of houses are bigger. But this conclusion has to be considered with caution as the number of households headed by a woman is rather low; and is much lower than those headed by a man in all categories considered.
Figure 14. Distribution of People according to Gender of the Head of the Household and Number of Rooms in the House
1 or 2 Rooms 3 Rooms 4 Rooms 5 Rooms 7 Rooms and More6 Rooms
� Man Head of the Household
� Woman Head of the Household25
20
15
10
5
0
Supply and Access to Food: Insufficient Quantity, Lack of Diversity60% of Afghan households buy their food at the market. 31% both produce what they eat and buy part of their food requirements at the market. Only a minority (7.3%) relies solely on self-provided food (Figure 15). There is no statistically signifi cant difference between households with a member who is disabled and households without any disabled member for this indicator. Disability appears to have absolutely no infl uence on this distribution.
Figure 15. Distribution of Households regarding Sources for Supply of Food
Market/Bazar Self Provided/Farm
Combination of Market/Farm
Food Aid From Family, Other Relatives
� Man Head of the Household
� Woman Head of the Household70
60
50
40
30
20
10
0

15Poverty of Living Conditions: Identifying Benchmarks
Figure 16 shows that the proportion of people buying all their food at the bazaar is higher in urban areas. Only 2.3% rely only on their own fi eld production in urban areas. A larger minority buy part of their food at the bazaar, and produce food for their own needs in rural area.
In urban areas, because only a minority of families have access to the land for farming activities, 85.5% of households rely on market for their food supply. Food aid in urban areas comes after market and farm supply, and represent a very small proportion of households relying on it.
In rural areas, market provides food for only half (51.1%) of the households. Only a minority never go to the bazaar for food purchases (9%). But a large number of households (38.8%) declare both buying and producing food. Family outside the household very rarely provide food (0.8%).
Figure 16. Distribution of Households Regarding Sources of Supply of Food in Urban and Rural Areas
Market/Bazar Self Provided/Farm
Combination of Market/Farm
Food Aid From Family, Other Relatives
� Urban
� Rural
90
80
70
60
50
40
30
20
10
0
In terms of consumption of food, a majority of people (52.4%) report having food shortage. When one adds people who declare receiving enough food in quantity but with poor quality, insuffi cient quality or quantity of food affects the large majority (83.9%) of the Afghan population. These results are in accordance with NRVA 2003 results and analysis17. The authors noticed that in 2003, the main coping strategy in case of shock was a reduction in diet quality or quantity. The fact that persons respond to a shock by curbing a basic survival need also shows vulnerability of the population.
When the situation of households with a member who is disabled and households without any disabled member is compared, very limited and non signifi cant differences can be observed (Figure 17 in next page and Table 30 in the Annexure):� 52% and 52.5% respectively of households with a member who is disabled and households without
any disabled member complain about food scarcity;� 87.1% and 83.6% respectively of households with a member who is disabled and households without
any disabled member either lack food or receive enough food but of poor quality;� The only signifi cant differences between the two types of households concerns those having enough to
eat: 3.8% more among households without any disabled member report having enough to eat.
Similarly, the difference is also statistically signifi cant for households having enough food but of poor quality: 4.2%, but this time households with a member who is disabled are more to be in this situation.
17 VULNERABILITY ANALYSIS AND MAPPING UNIT OF THE WORLD FOOD PROGRAMME AND THE VULNERABILITY ANALYSIS UNIT OF THE MINISTRY OF RURAL REHABILITATION AND DEVELOPMENT (2004), op. cit.
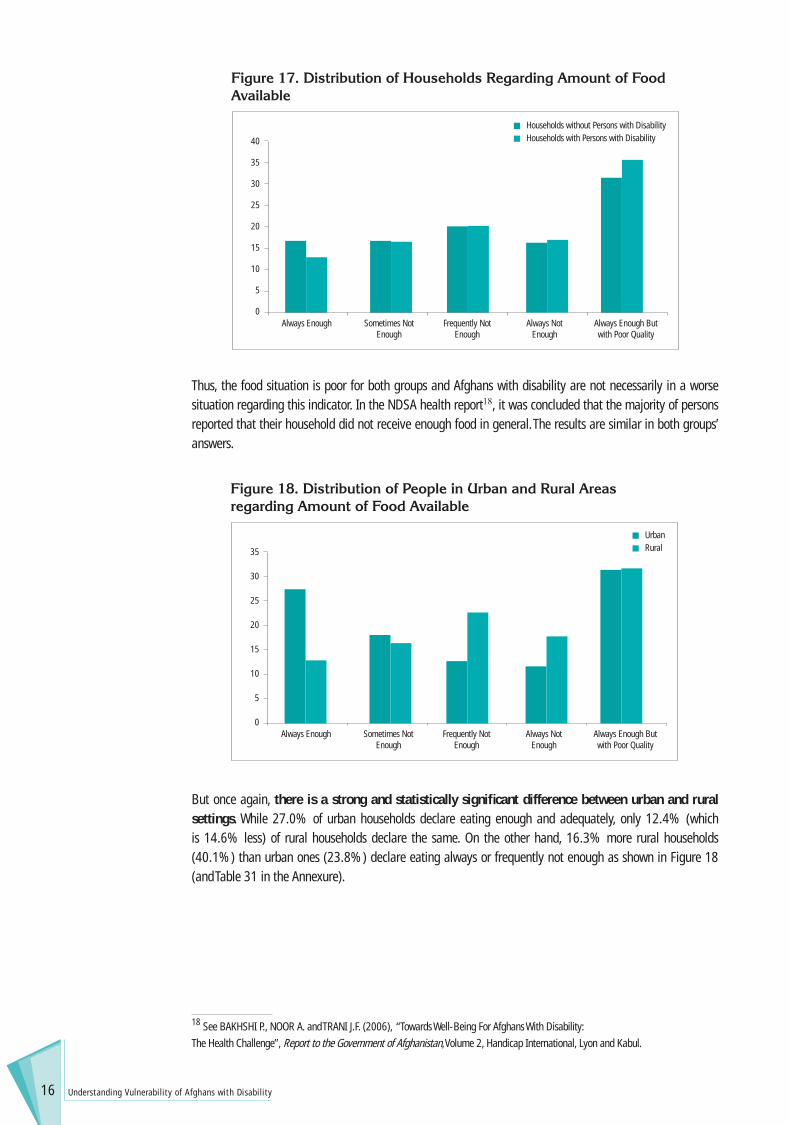
16 Understanding Vulnerability of Afghans with Disability
Thus, the food situation is poor for both groups and Afghans with disability are not necessarily in a worse situation regarding this indicator. In the NDSA health report18, it was concluded that the majority of persons reported that their household did not receive enough food in general. The results are similar in both groups’ answers.
Figure 17. Distribution of Households Regarding Amount of Food Available
Always Enough Sometimes Not Enough
Frequently Not Enough
Always Not Enough
Always Enough But with Poor Quality
� Households without Persons with Disability
� Households with Persons with Disability40
35
30
25
20
15
10
5
0
But once again, there is a strong and statistically signifi cant difference between urban and rural settings. While 27.0% of urban households declare eating enough and adequately, only 12.4% (which is 14.6% less) of rural households declare the same. On the other hand, 16.3% more rural households (40.1%) than urban ones (23.8%) declare eating always or frequently not enough as shown in Figure 18 (and Table 31 in the Annexure).
18 See BAKHSHI P., NOOR A. and TRANI J.F. (2006), “Towards Well-Being For Afghans With Disability: The Health Challenge”, Report to the Government of Afghanistan, Volume 2, Handicap International, Lyon and Kabul.
Figure 18. Distribution of People in Urban and Rural Areas regarding Amount of Food Available
Always Enough Sometimes Not Enough
Frequently Not Enough
Always Not Enough
Always Enough But with Poor Quality
� Urban
� Rural35
30
25
20
15
10
5
0
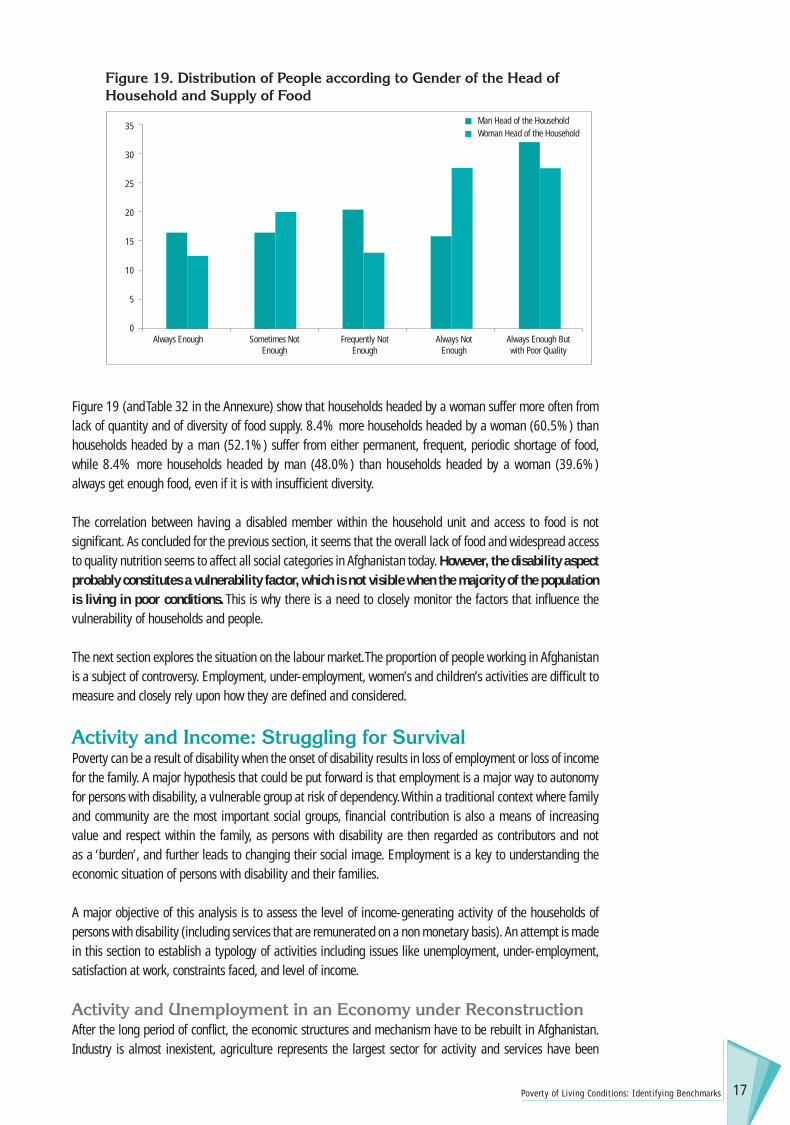
17Poverty of Living Conditions: Identifying Benchmarks
Figure 19 (and Table 32 in the Annexure) show that households headed by a woman suffer more often from lack of quantity and of diversity of food supply. 8.4% more households headed by a woman (60.5%) than households headed by a man (52.1%) suffer from either permanent, frequent, periodic shortage of food, while 8.4% more households headed by man (48.0%) than households headed by a woman (39.6%) always get enough food, even if it is with insuffi cient diversity.
The correlation between having a disabled member within the household unit and access to food is not signifi cant. As concluded for the previous section, it seems that the overall lack of food and widespread access to quality nutrition seems to affect all social categories in Afghanistan today. However, the disability aspect probably constitutes a vulnerability factor, which is not visible when the majority of the population is living in poor conditions. This is why there is a need to closely monitor the factors that infl uence the vulnerability of households and people.
The next section explores the situation on the labour market. The proportion of people working in Afghanistan is a subject of controversy. Employment, under-employment, women’s and children’s activities are diffi cult to measure and closely rely upon how they are defi ned and considered.
Activity and Income: Struggling for SurvivalPoverty can be a result of disability when the onset of disability results in loss of employment or loss of income for the family. A major hypothesis that could be put forward is that employment is a major way to autonomy for persons with disability, a vulnerable group at risk of dependency. Within a traditional context where family and community are the most important social groups, fi nancial contribution is also a means of increasing value and respect within the family, as persons with disability are then regarded as contributors and not as a ‘burden’, and further leads to changing their social image. Employment is a key to understanding the economic situation of persons with disability and their families.
A major objective of this analysis is to assess the level of income-generating activity of the households of persons with disability (including services that are remunerated on a non monetary basis). An attempt is made in this section to establish a typology of activities including issues like unemployment, under-employment, satisfaction at work, constraints faced, and level of income.
Activity and Unemployment in an Economy under ReconstructionAfter the long period of confl ict, the economic structures and mechanism have to be rebuilt in Afghanistan. Industry is almost inexistent, agriculture represents the largest sector for activity and services have been
Figure 19. Distribution of People according to Gender of the Head of Household and Supply of Food
Always Enough Sometimes Not Enough
Frequently Not Enough
Always Not Enough
Always Enough But with Poor Quality
� Man Head of the Household
� Woman Head of the Household35
30
25
20
15
10
5
0

18 Understanding Vulnerability of Afghans with Disability
increasing at a high pace for the last fi ve years at least in urban areas. What is the situation of the labour market in Afghanistan? What exactly is the work offer?
According to an International Rescue Committee survey carried out in 2003, the unemployment rate represents 32% of the active population. But what does this fi gure stand for? Unemployment is considered as the situation of a person without an ‘income generating activity’, effectively looking for a job and ready to take it immediately if an opportunity occurs19. In large areas of the country, women are not allowed to work in the fi eld but carry out all the household tasks. In this case, the rate of unemployment is of 45.6% among the 15-65 years old of both sexes: it includes all women declaring that they undertake the household chores. But if one sticks strictly to the international ILO defi nition, only 2.4% of Afghans above 14 are not working and effectively looking for a job.
Another diffi culty is linked to the complexity of the land ownership system and the diversity of status of people working on this land: landowners, mortgagers, tenants who share the crops and those who pay a rent, simple labourers (Kargar), etc. Beyond this complexity of the land system in rural areas, the possessions of land and of a house remain reliable benchmarks for remaining out of poverty20.
Assessing the level of income-generating activity of persons with disability (including services that are paid on a non monetary basis) will help establishing a typology of activities that includes unemployment, under-employment, work satisfaction, constraints to employment or in the workplace and levels of income. Lack of employment is a major obstacle to achieving self-suffi ciency and fi nancial independence, especially for persons with disability who are at high risk of lifetime dependency on others. Employment also modify the perception of the person considered as participating to the family welfare, thus enhancing her/his social image and status. Identifying differences of employment situation and strategies and the link with different kind of disabilities help to identify inequalities. One important belief in Afghanistan that must be assessed against scientifi c evidence is the idea that landmine and war survivors benefi t from a better situation than other persons with disability, especially when compared to those with intellectual disability or mental illness.
The picture of the employment situation of persons with disability is characterised by diversity: the types of employment that they have, the duration in terms of hours, days and months, the stability of this work as well as the need for secondary jobs. Results will also be presented with regards to children’s work and their contribution to the family.
Major Characteristics of the Labour Force and Market
A High Level of Unemployment?Figure 20 shows that active people represent 40.4% of the population aged 15 and more, 21.5% of the entire population and 41.4% if one considers the population aged 15 to 64 years old. People in charge of household tasks, essentially women aged above 14 represent 43.2% of the population of working age (age 15 to 64 ). This means that the level of unemployment is high. But if is measured only the persons unemployed, immediately available for a work and effectively looking for a job, then the level of unemployment drops considerably to 2.4% of the population aged 15 to 64. In this case, women in charge of household tasks are not considered as unemployed. Measure of unemployment is thus a complex matter that relies on a defi nition that excludes work inside the house because not generating any income.
19 For more information about unemployment measure see http://www.ilo.org/public/english/employment/strat/kilm/. 20 See ALDEN W. L. (2004); op cit.

19Poverty of Living Conditions: Identifying Benchmarks
Figure 21 (and Table 33 in the Annexure) show that the situation regarding employment is quite different for persons with disability and the non-disabled. The difference between the two groups is statistically signifi cant. The same observation goes for people in charge of household tasks. Disability impedes both professional activities and household tasks. In the fi rst case, men are a majority; in the second it is the women who are primarily concerned.
Figure 21. Distribution of Persons Above 14 according to the Employment Situation
Working Household Tasks
Student/Scholar
Too Young to Work
Long Disease
� Non-Disabled
� Persons with Disability
50
45
40
35
30
25
20
15
0Seeking
JobToo Old to
WorkNot Working, Not Looking
for a Job
Other
The proportion of active members in a household is a relevant indicator of vulnerability. The risk of shocks leading to poverty is lower when more active people can face the unexpected diffi culty. Only a minority of households do not have any working member. These households rely on relatives outside the household for their subsistence and they are most probably particularly at risk of falling into poverty. There is a signifi cant difference between households with persons with disability and households with non-disabled. A large majority of both groups of households reported having less than 25% of household members working. A higher proportion (62.6%) is observed for lower employment ratio among households with a person with disability than in non-disabled households (59.0%). Hence, this constitutes a distinct indicator of higher proportion of households at risk of unpredicted shocks. On the other hand, a signifi cant higher proportion of households without persons with disability reported having more than 25% of active members.
Figure 20. Distribution of All Afghans Above 14 according to the Employment Situation
� Working (41.4%)
� Seeking Job (2.4%)
� Persons in Change of the
Household Tasks (43.3%)
� Student (9.1%)
� Too Old to Work (2.6%)
� Long Disease (0.9%)
� Not Working, Not Looking
for a Job (0.2%)
� Too Young to Work (0.0%)
� Other (0.0%)43.3%
2.4%
41.4%
9.1%2.6%
0.0%
0.9% 0.2%0.1%
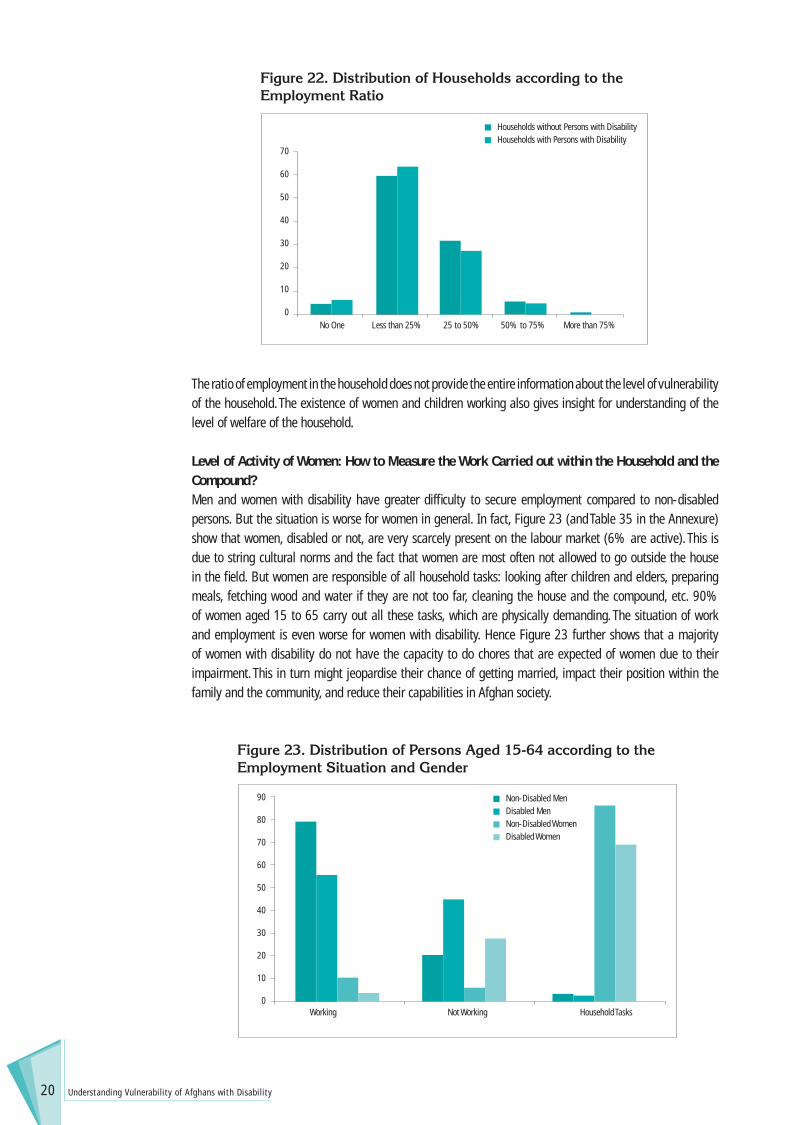
20 Understanding Vulnerability of Afghans with Disability
Figure 22. Distribution of Households according to the Employment Ratio
No One Less than 25% 50% to 75% More than 75%
� Households without Persons with Disability
� Households with Persons with Disability70
60
50
40
30
20
10
025 to 50%
The ratio of employment in the household does not provide the entire information about the level of vulnerability of the household. The existence of women and children working also gives insight for understanding of the level of welfare of the household.
Level of Activity of Women: How to Measure the Work Carried out within the Household and the Compound?Men and women with disability have greater diffi culty to secure employment compared to non-disabled persons. But the situation is worse for women in general. In fact, Figure 23 (and Table 35 in the Annexure) show that women, disabled or not, are very scarcely present on the labour market (6% are active). This is due to string cultural norms and the fact that women are most often not allowed to go outside the house in the fi eld. But women are responsible of all household tasks: looking after children and elders, preparing meals, fetching wood and water if they are not too far, cleaning the house and the compound, etc. 90% of women aged 15 to 65 carry out all these tasks, which are physically demanding. The situation of work and employment is even worse for women with disability. Hence Figure 23 further shows that a majority of women with disability do not have the capacity to do chores that are expected of women due to their impairment. This in turn might jeopardise their chance of getting married, impact their position within the family and the community, and reduce their capabilities in Afghan society.
Figure 23. Distribution of Persons Aged 15-64 according to the Employment Situation and Gender
Working Not Working Household Tasks
� Non-Disabled Men
� Disabled Men
� Non-Disabled Women
� Disabled Women
90
80
70
60
50
40
30
20
10
0

21Poverty of Living Conditions: Identifying Benchmarks
Sometimes alongside household chores, women have an income-generating activity or a few agricultural tasks: farming and herding livestock. Yet, in Pashto areas particularly, women are often not allowed to farm and herd livestock. Therefore, the fi gure of 6% probably underestimates the exact level of activity of women. In reality, when asked more in-depth questions21 about income-generating activities, the rate of employment of women reaches 13% for non-disabled women and 10% for women with disability as shown in Figure 24 (and Table 36 in the Annexure).
Figure 24. Level of Employment Considering Additional Activities
Male Paid Employment Female Paid Employment
� Non-Disabled
� Persons with Disability
90
80
70
60
50
40
30
20
10
0
The difference of level of employment, especially for women (as shown between Tables 35 and 36 in the Annexure) is due to two phenomena. Firstly, people tend to consider that women do not work when they have a small job with little and irregular income. When surveyors pursued and asked about the activity during the day, then it sometimes appeared that the interviewee was in fact carrying out some kind of work. Secondly, women declare their household activities: therefore they are not registered as having a paid employment in the family questionnaire. In the adult questionnaire, they are asked about both types of activities.
The fact of being head of the household is closely linked to the employment situation, more so than age or status. Table 37 in the Annexure shows that both men and women, when they are head of their household, are most often active. Even if only 2.6% of women are at the head of the household, 30.6% of them are active, while only 6.0% of other women aged above 14 years old are active. A similar disparity exists between men heads of household: 87.6% of these have employment, whereas the proportion of active men is 59.7% among the other men in the household.
Professions of Afghans: A Majority of Farmers Among those who are working, Figure 25 in next page shows that 35.7% of active Afghans are owners of the land they cultivate or have it under mortgage. In second position, people having another type of independent activity represent 18.6% of the active employed population. Considered together, it appears than more than half of the active employed population is composed of self-employed people. 15.6% are wageworkers, which is a more stable status. These persons usually benefi t from a monthly wage and they have (well) defi ned working conditions: fi xed working hours, fi xed wage, specifi c tasks and working location. The rest of the active employed people (30%) all have a precarious working status: family helpers, seasonal and occasional workers, and daily workers. Only 0.1% of Afghans employ other people in their business, which represents just a few thousand people.
21 The questions in the adult questionnaire are: Do you currently have a (regular or irregular) work? Did you work or have a job for at least one hour per day during last week? Did you work or have a job for at least one day during last month? If you are not working, for what reason? Even if you stated that you have not worked last month, have you carried out one of the following activities to help? (and follow a list of occurrences of possible tasks).
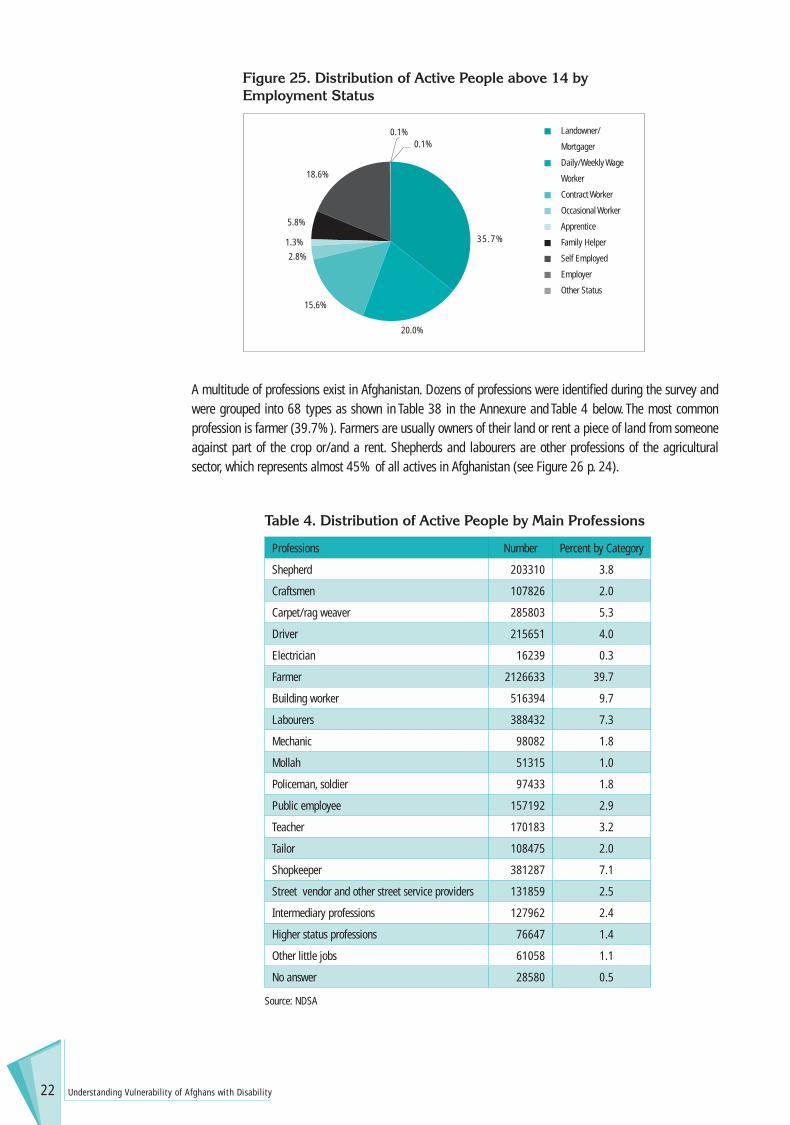
22 Understanding Vulnerability of Afghans with Disability
Figure 25. Distribution of Active People above 14 by Employment Status
� Landowner/
Mortgager
� Daily/Weekly Wage
Worker
� Contract Worker
� Occasional Worker
� Apprentice
� Family Helper
� Self Employed
� Employer
� Other Status
15.6%
20.0%
35.7%
0.1%0.1%
2.8%
1.3%
5.8%
18.6%
A multitude of professions exist in Afghanistan. Dozens of professions were identifi ed during the survey and were grouped into 68 types as shown in Table 38 in the Annexure and Table 4 below. The most common profession is farmer (39.7%). Farmers are usually owners of their land or rent a piece of land from someone against part of the crop or/and a rent. Shepherds and labourers are other professions of the agricultural sector, which represents almost 45% of all actives in Afghanistan (see Figure 26 p. 24).
Table 4. Distribution of Active People by Main Professions
Professions Number Percent by Category
Shepherd 203310 3.8
Craftsmen 107826 2.0
Carpet/rag weaver 285803 5.3
Driver 215651 4.0
Electrician 16239 0.3
Farmer 2126633 39.7
Building worker 516394 9.7
Labourers 388432 7.3
Mechanic 98082 1.8
Mollah 51315 1.0
Policeman, soldier 97433 1.8
Public employee 157192 2.9
Teacher 170183 3.2
Tailor 108475 2.0
Shopkeeper 381287 7.1
Street vendor and other street service providers 131859 2.5
Intermediary professions 127962 2.4
Higher status professions 76647 1.4
Other little jobs 61058 1.1
No answer 28580 0.5
Source: NDSA
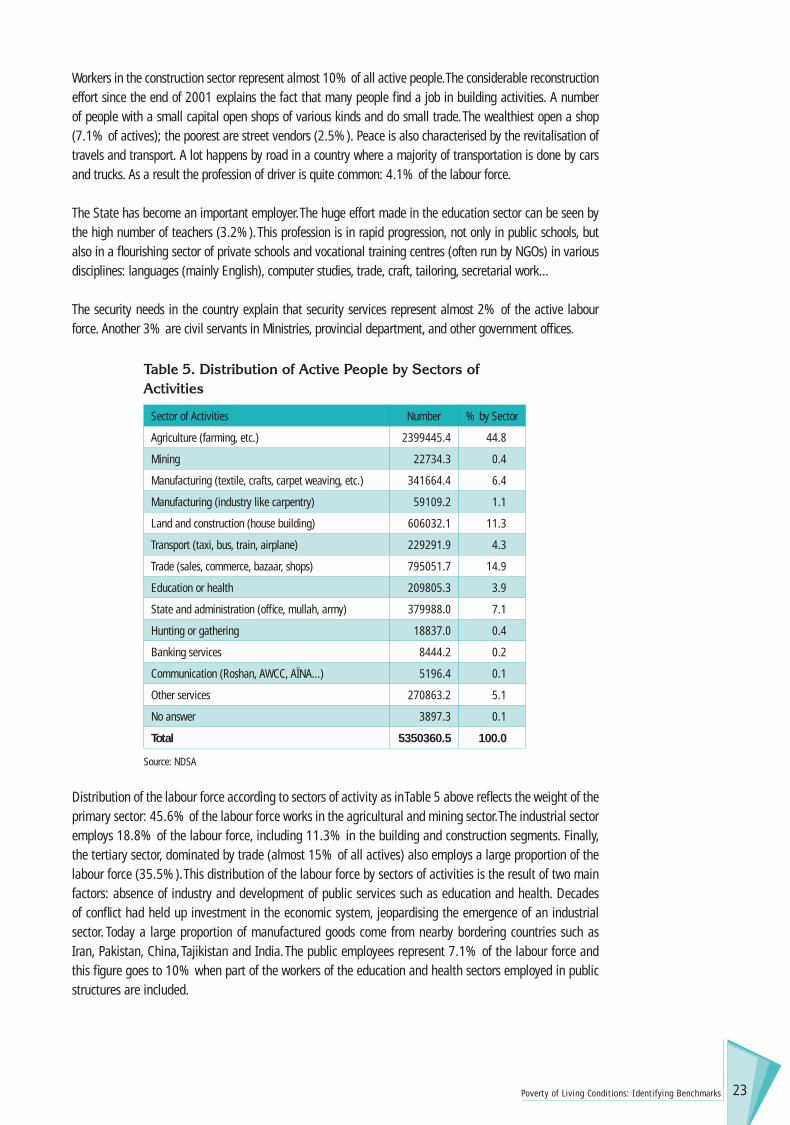
23Poverty of Living Conditions: Identifying Benchmarks
Workers in the construction sector represent almost 10% of all active people. The considerable reconstruction effort since the end of 2001 explains the fact that many people fi nd a job in building activities. A number of people with a small capital open shops of various kinds and do small trade. The wealthiest open a shop (7.1% of actives); the poorest are street vendors (2.5%). Peace is also characterised by the revitalisation of travels and transport. A lot happens by road in a country where a majority of transportation is done by cars and trucks. As a result the profession of driver is quite common: 4.1% of the labour force.
The State has become an important employer. The huge effort made in the education sector can be seen by the high number of teachers (3.2%). This profession is in rapid progression, not only in public schools, but also in a fl ourishing sector of private schools and vocational training centres (often run by NGOs) in various disciplines: languages (mainly English), computer studies, trade, craft, tailoring, secretarial work…
The security needs in the country explain that security services represent almost 2% of the active labour force. Another 3% are civil servants in Ministries, provincial department, and other government offi ces.
Table 5. Distribution of Active People by Sectors of Activities
Sector of Activities Number % by Sector
Agriculture (farming, etc.) 2399445.4 44.8
Mining 22734.3 0.4
Manufacturing (textile, crafts, carpet weaving, etc.) 341664.4 6.4
Manufacturing (industry like carpentry) 59109.2 1.1
Land and construction (house building) 606032.1 11.3
Transport (taxi, bus, train, airplane) 229291.9 4.3
Trade (sales, commerce, bazaar, shops) 795051.7 14.9
Education or health 209805.3 3.9
State and administration (offi ce, mullah, army) 379988.0 7.1
Hunting or gathering 18837.0 0.4
Banking services 8444.2 0.2
Communication (Roshan, AWCC, AÏNA...) 5196.4 0.1
Other services 270863.2 5.1
No answer 3897.3 0.1
Total 5350360.5 100.0
Source: NDSA
Distribution of the labour force according to sectors of activity as in Table 5 above refl ects the weight of the primary sector: 45.6% of the labour force works in the agricultural and mining sector. The industrial sector employs 18.8% of the labour force, including 11.3% in the building and construction segments. Finally, the tertiary sector, dominated by trade (almost 15% of all actives) also employs a large proportion of the labour force (35.5%). This distribution of the labour force by sectors of activities is the result of two main factors: absence of industry and development of public services such as education and health. Decades of confl ict had held up investment in the economic system, jeopardising the emergence of an industrial sector. Today a large proportion of manufactured goods come from nearby bordering countries such as Iran, Pakistan, China, Tajikistan and India. The public employees represent 7.1% of the labour force and this fi gure goes to 10% when part of the workers of the education and health sectors employed in public structures are included.

24 Understanding Vulnerability of Afghans with Disability
Farmers: Heterogeneity and Diversity of StatusWhat exactly is the status of the 44.9% of active people working in the agricultural sector? They are mainly in agriculture activities, the mining sector representing only 0.4% of employment. Heterogeneity is the norm for farmers’ status.
Figure 26. Distribution of Farmers by Types of Status
� Landlord / Khan (4.8%)
� Landowner/Malik/
Zamindar/Mulkadar
(16.7%)
� Farmer/Sharecropper/
Mortgager (39.8%)
� Tenant/Khistmand
(7.3%)
� Labourer/Worker/Kargar
(27.4%)
� Family Helper (4.0%)
7.3%
39.8%
4.8%
27.4%
4.0%
16.7%
A major distinction can be made between those who own land and those who do not. A small group of farmers (4.8%) are landlords, owning more than 200 jeribs (40 ha). A second group of farmers (16.7%) is composed of landowners who have less than 200 jeribs. The majority of farmers are sharecroppers and mortgagers (39.8%) who own small land and are constrained to rent more land for farming. On the land they rent, they provide all materials needed (seeds, plough, animals and labour), however they keep only part of the crop (often less than 50%). They might have a garden but rent fi elds for wider cultivation such as food crops or poppy cultivation.
A third group is composed of tenants who do not possess land but rent it according to different modalities: usually, in exchange of a part of the crop against the use of the land, payment of a rent, etc. Helpers are usually members of the family, mainly young boys, who help their father or brothers to cultivate the family land.
The most vulnerable are undoubtedly the landless labourers who work for farmers and landowners on a daily, weekly or seasonal basis. Part of this group is also homeless and moves from village to village to offer their services. They have trouble fi nding work as villagers prefer to hire members of the family (who they sometimes do not have to pay) or other members of the village they know. Moreover, in case of natural disasters as it has been the case recently, this category of farmers is often without work.
Activity and DisabilityTo what extent are persons with disability working in Afghanistan? Figure 21 page 19 above (and Table 33 in the Annexure) show that the rate of employment of persons with disability (33.8%) is a lot lower than the one of non-disabled people (41.7%).
Different Types of Activities and More Precarious Status for Persons with DisabilityWhen they are active, persons with disability are in similar proportions and occupy jobs that have a more or less comparable status to those held by the non-disabled. Yet, as expected, persons with disability are less present in professions requiring physical strength and abilities: farmers, house-workers, drivers, mechanics… They are however, in signifi cantly higher proportion working as street vendors, shopkeepers and other small

25Poverty of Living Conditions: Identifying Benchmarks
jobs. Non-disabled persons are a larger proportion of landowners or land mortgagers, while persons with disability are more often occasional workers. The latter are also slightly in higher proportion in self-employed activities which is often the status used for shopkeepers or street vendors.
Table 40 in the Annexure shows that persons with disability are proportionally half the number of the non-disabled among wealthy landlords (2.7% against 5.7% for non-disabled). Nevertheless, the proportion of smaller landowners is the same for both categories (around 17%). On the other hand, persons with disability are proportionally more in the three most vulnerable statuses: tenants, labourers and family helpers. These results may lead to the same conclusion for Afghanistan as Erb and Harris-White made for India22: in an agrarian economy, only extreme disability is a barrier for employment in fi eldwork. But furthermore in Afghanistan, persons with disability are more vulnerable on the labour market. They occupy the most insecure employment status.
Diffi culties in the WorkplaceWhen asked about the diffi culties they face in their work place, a majority (58.8%) of active Afghans declared spontaneously facing no particular diffi culty. This is not the case for persons with disability who were only 26.3% to report the same.
22 ERB S. and HARRIS-WHITE B. (2001), Outcast from Social Welfare: Adult Disability and Incapacity in Rural South India, Books for Change, Bangalore.
Persons with disability face far more often diffi culties in their workplace than non-disabled persons as shown in Table 41 in the Annexure and Figure 28 in next page. This is observed for all types of diffi culties directly related to the work situation. Accessibility of the workplace is a problem in a country with poor road networks: it is a key problem in 24.7% of cases for persons with disability and only in 11% of cases for non-disabled people. Diffi culties due to physical discomfort or pain as well as dangerous positions are also frequent for persons with disability (37.4%). But these problems also exist for non-disabled people (23.7%). Inequality of wages (14.6% and 7.5% respectively for persons with disability and non-disabled) and misunderstanding of the boss or co-workers (2.5% and 0.0%) are also more frequent for persons with disability than for non-disabled. The level of diffi culty is similar for both groups with regards to corruption (obligation to pay bribes) or bad weather.
Figure 27. Distribution of Active People by Types of Difficulties Faced in the Workplace
� Diffi cult to Reach my Work Place (10.4%)
� Work Painful/Dangerous (17.3%)
� Problem with Coworkers/Employer (0.0%)
� Wage Problem (5.1%)
� Corruption (0.2%)
� Bad Weather (2.8%)
� Other/Dont Know (5.3%)
� No Diffi culty (58.8%)58.8%
17.3%
10.4%
5.1%
0.0%
0.2%2.8%
5.3%

26 Understanding Vulnerability of Afghans with Disability
In conclusion, the level of diffi culties is signifi cantly different between the non-disabled and persons with disability. Globally analysis shows that persons with disability experience a higher cost of working due to greater diffi culties faced in the workplace: securing employment requires greater efforts than for non-disabled people. There are a wide range of diffi culties: some are due to lack of adaptation of the work, inaccessibility of the place, stigma and misunderstanding of co-workers, unequal wage scales…
Less Child Labour in Afghanistan?According to the International Labour Organization (ILO)23, “Economic activity is a statistical concept that encompasses most productive activities undertaken by children, whether for the market or not, paid or unpaid, for a few hours or full time, on a casual or regular basis, legal or illegal; it excludes chores undertaken in the child’s own household. To be economically active, a child must have worked for at least one hour on any day during a seven-day reference period.”
The ILO states24 that there were about 317 million economically active children aged 5 to 17 in 2004, of whom 218 million could be regarded as child labourers. Of the latter, 126 million were engaged in hazardous work. 165.8 million children between the ages of 5 and 14 are estimated to work in the world—at least 74.4 million in hazardous work. The number of child labourers in both age groups of 5-14 and 5-17 fell by 11% over the four years from 2000 to 2004. However, the decline was much greater for those engaged in hazardous work: the fi gure fell by 26% for the 5-17 age group, and 33% for the 5-4 age group. The incidence of child labour25 (percentage of children working) in 2004 is estimated by ILO to be at 13.9% for the 5-17 age group, compared to 16% in 2000. The proportion of girls among child labourers, however, remained steady. The vast majority (70%) of these children are working in agriculture. Many children work as domestic help; urban children work in trade and services, with fewer in manufacturing and construction. Most of the active children are situated in Asia: 61% are in Asia, 32% in Africa, and 7% in Latin America. In Asia and the Pacifi c, the activity rate among children aged 5-14 was of 19.4% in 2000 and of 18.8% in 2004. The decline is limited, whereas it is massive in Latin America and the Caribbean26.
Figure 28. Distribution of Active Disabled and Non-Disabled Persons by Types of Difficulties Faced in the Workplace
Diffi cult to Reach My Work
Place
Problem with Coworkers/Employer
Wage Problem
Bad Weather Other/Don’t Know
� Non-Disabled
� Persons with Disability70
60
50
40
30
20
10
0Work Painful/
DangerousCorruption No Diffi culty
23 See, INTERNATIONAL LABOR OFFICE (2006a), Out Of Work and in School: Our Development Challenge, Asia-Pacifi c Economic Cooperation, Publication of Project Experiences, 2001-2006 http://www.ilo.org/public/english/region/asro/bangkok/apec/download/book.pdf, p. 15.24 See INTERNATIONAL LABOR OFFICE (2006b), The end of child labour: Within reach, International Labour Conference 95th Session 2006 Report I (B), Geneva, http://www.ilo.org/public/english/standards/relm/ilc/ilc95/pdf/rep-i-b.pdf. 25 To the international community, the term “child labour” does not encompass all work performed by children under the age of 18 years. The consensus view is that work that falls within the legal limits and does not interfere with children’s health and development or prejudice their schooling can be a positive experience. See Inter-PARLIAMENTARY UNION/ILO (2002), Eliminating the worst forms of child labour: A practical guide to ILO Convention No. 182, Handbook for parliamentarians No. 3-2002, (Geneva, p. 15.26 From 16.1% to 5.1% according to ILO (2006), op. cit., fi gure 1.2 p. 20.
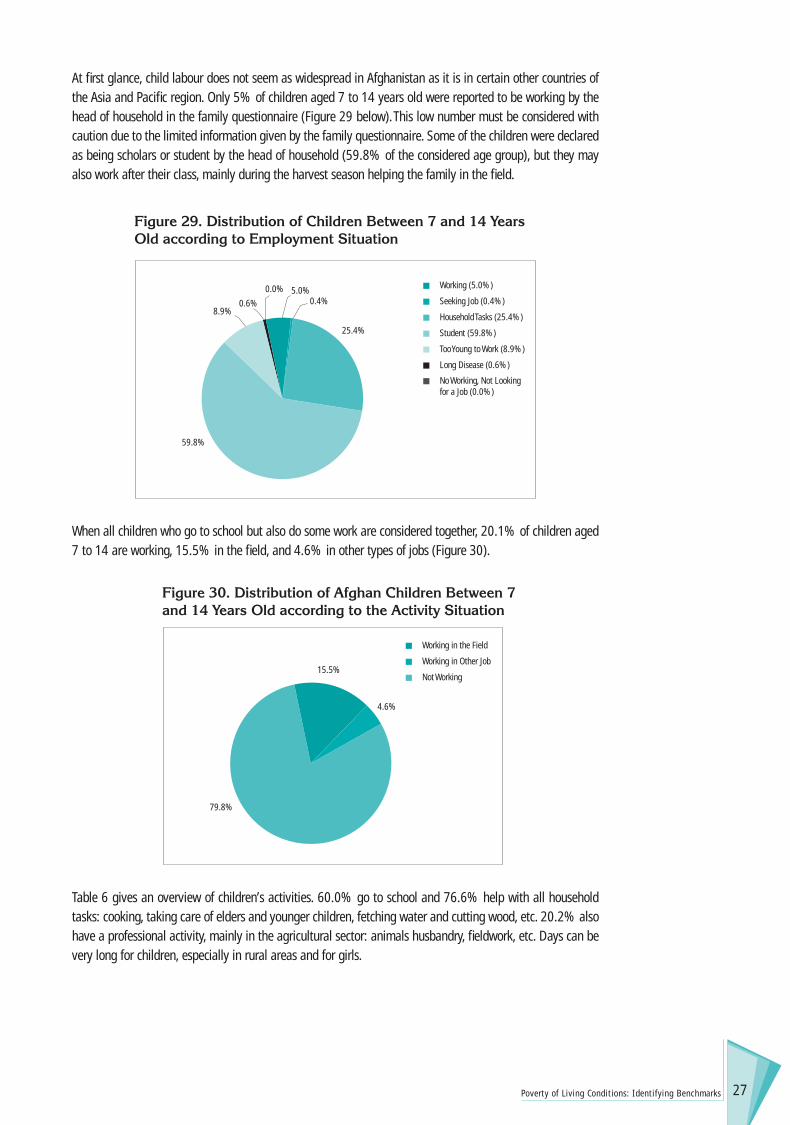
27Poverty of Living Conditions: Identifying Benchmarks
At fi rst glance, child labour does not seem as widespread in Afghanistan as it is in certain other countries of the Asia and Pacifi c region. Only 5% of children aged 7 to 14 years old were reported to be working by the head of household in the family questionnaire (Figure 29 below). This low number must be considered with caution due to the limited information given by the family questionnaire. Some of the children were declared as being scholars or student by the head of household (59.8% of the considered age group), but they may also work after their class, mainly during the harvest season helping the family in the fi eld.
When all children who go to school but also do some work are considered together, 20.1% of children aged 7 to 14 are working, 15.5% in the fi eld, and 4.6% in other types of jobs (Figure 30).
Figure 30. Distribution of Afghan Children Between 7 and 14 Years Old according to the Activity Situation
� Working in the Field
� Working in Other Job
� Not Working
79.8%
15.5%
4.6%
Table 6 gives an overview of children’s activities. 60.0% go to school and 76.6% help with all household tasks: cooking, taking care of elders and younger children, fetching water and cutting wood, etc. 20.2% also have a professional activity, mainly in the agricultural sector: animals husbandry, fi eldwork, etc. Days can be very long for children, especially in rural areas and for girls.
Figure 29. Distribution of Children Between 7 and 14 Years Old according to Employment Situation
� Working (5.0%)
� Seeking Job (0.4%)
� Household Tasks (25.4%)
� Student (59.8%)
� Too Young to Work (8.9%)
� Long Disease (0.6%)
� No Working, Not Looking for a Job (0.0%)
59.8%
0.4%8.9%
0.6%
0.0% 5.0%
25.4%

28 Understanding Vulnerability of Afghans with Disability
Table 6. Activities of Children Aged 6 to 14
Children Activities Number %
Going To School 3841451 59.8
Working in the Field 1996463 15.5
Working in Other Job 597198 4.6
Household Tasks 10884804 76.6
Source: NDSA. Note: some children have more than one activity, total not equal to 100%.
The incidence of child labour in Afghanistan is thus above the regional average of 18.8%. But according to ILO27, “the labour force participation rate of children aged from 10 to 14 years is extremely high at 30-60% in countries with a per capita income of US$500 or less”. Afghanistan ranges at this category28, yet its level of child activity is slightly lower.
Figure 31 shows that children with disability work less often than other children, especially for fi eldwork. They also help signifi cantly less within the house. This is explained by the physically demanding nature of the work both in the fi eld and in major household tasks such as fetching water, cleaning, cooking, cutting wood. The same trend is observed in town and in villages.
Figure 31. Distribution of Children Between 6 and 14 Years Old according to the Employment Situation
Help in the Field Other Work Help in the House
No Activity
� Non Disabled
� Children with Disability
90
80
70
60
50
40
30
20
10
0
The frequency of children working inside the house is attested in the Figure 31.
Household TasksContribution of children to the household chores is very high. Tables 43 and 44 in the Annexure show that both boys and girls participate in household tasks and that for girls it is systematic: 91.5% of all girls carry out some of the household tasks. Even children with disability, especially girls (61.2%) participate in chores within the house. The large majority (58.7%) of children with disability work one or two hours while non-disabled children often work more than 3 hours (50.5% of them), especially girls (60.4% work more than 3 hours). If children with disability work less in terms of duration, and are a smaller proportion to do household chores, the proportion
27 ILO (2006), op. cit., p. 22.28 Evaluations of per capita income for Afghanistan varies. Per capita income is evaluated at 822 USD in Purchasing Power Parity (PPP)-adjusted. UNDP (2004), “Security with a Human Face: Challenges and Responsibilities”, Afghanistan National Human Development Report, Kabul. According to DFID, average income would rather be about 300 USD per person, see http://www.dfi d.gov.uk/countries/asia/afghanistan.asp.

29Poverty of Living Conditions: Identifying Benchmarks
by types of tasks done is similar. Fewer boys with disability clean the house, fetch water or do the grocery than non-disabled boys, probably because of physical limitations of movement. Similarly, girls with disability are proportionately less to cook, clean, fetch water, do the laundry than non-disabled girls.
Mainly Boys Help in the FieldsWorking in the fi eld is essentially a male affair. Girls do not frequently go out to work in the fi eld, except maybe in some Uzbek or Hazara regions. In Pashto areas and even in Tadjik ones, women and girls almost never work in the fi elds. When they do work in the fi eld, boys with disability work only one or two hours, whereas non-disabled boys can work up to eight or more hours when they do not go to school. A large majority, however, works less than four hours. It is mainly for harvesting, sowing and reaping that boys of the house are expected to help. Some of them are also in charge of an animal husbandry when the family possesses some livestock, and in this activity boys with disability are particularly present.
Other JobsMainly in urban areas, a few boys have other types of jobs. A majority of young boys with disability are in apprenticeship (54.5%), more than the non-disabled boys (31.8%). The rest of the non-disabled active boys are equally distributed between fi xed jobs, helping someone, occasional jobs and independent jobs. A higher proportion of disabled boys also take on occasional and unstable jobs.
A major benchmark to differentiate between poor people and those better off is the level of income. Yet, this information is not often reliable in surveys, especially in developing and transition countries and in traditional contexts. Whatever the context, people are reluctant to provide information pertaining to their income. As a result, income cannot be the only indicator to measure poverty but it can complement the analysis of basic goods and employment.
High Inequality of Income in AfghanistanMeasuring level of income is a challenge in many contexts. Earnings are taboo in many cultures and individuals do not easily reveal sources and amounts of their income. Nevertheless, economists and other specialists of poverty have developed several indicators based on income measures. These tools are useful for cross-country comparisons of distribution of income and other assets.
Complexity of Measurement of IncomeEvaluation of income is a very complex issue. People always underestimate their income, sometimes because of lack of knowledge, sometimes in order to hide it. In fact, many activities generate irregular income. For a shopkeeper, the level of income is directly linked to the demand for his/her products. Farming income varies during the year, and is the highest after the harvest season. It also depends on the deal with the landowner for those who rent the land as well as landless labourers. Carpet weaving is also linked to the completion of a carpet. Thus, income may come in a household not on a monthly base: it may be seasonal, daily, weekly, quarterly… and very often irregular. The sale of newspapers or the repair of shoes is largely dependent each day on the number of clients. In all these cases, it becomes very diffi cult for the interviewees to give an estimation of their monthly income.
Researchers have developed several techniques to evaluate income of households through surveys. The best way to measure activity income is to leave a notebook for accountability during a certain period of time, and then come to recollect it. But this was not possible during the NDSA, because of the cost of such a technique, the diffi cult access of some places and the security constraints. Another way to proceed is to collect information about expenses and savings. Doing so gives an idea of the income of an household.
Moreover, very often, income is underestimated due to the fact that people tend to hide the real amount. Many reasons can explain this. Firstly some interviewees may have had hopes that the survey would bring some help: therefore, as already explained29, the team of survey always tried to make it clear that there

30 Understanding Vulnerability of Afghans with Disability
would be no direct help linked to the survey. Secondly, people were not willing to openly claim their earnings for fear of being asked for money by their relatives or by the community if they found out about it and become the subject of envy and even jealousy.
Lastly, income in Afghanistan is not systematically an individual indicator. Many people are working but earning little or no direct individual income in exchange for their work. All the men in the family may work in the fi eld but the crop will be sold by the head of the family who is in charge of the whole family and decides what expenditures need to be made. The same can be said for a shopkeeper working with his sons. The former will not grant a wage but will take care of all the needs of the latter. The same can be stated for a carpet weaver. The ladies and the children living in the household will all work on the carpet weaving but the income will usually be collected by the fi rst wife or the head of the household. Therefore, many working persons are considered as family helpers and do not directly earn any income. However, the NDSA team did not directly ask the amount of the household income since this does not always account for inequalities between family members.
Measuring Inequality of IncomeA widespread measure of inequality is given by the Gini coeffi cient. The Gini coeffi cient is a measure of inequality of a distribution. It is defi ned as the ratio of area between the Lorenz curve of the distribution and the curve of the uniform distribution, and the area under the uniform distribution. It is often used to measure income inequality. In simple terms, experts use it to measure inequality regarding income. The Gini coeffi cient is measured between 0 (which corresponds to perfect equality e.g. everyone has the same income) and 1 (which corresponds to perfect inequality, e.g. one person gets all the income, and everyone else has no income).
Table 7. Gini Coefficient for Income from Activity
Estimated
Value Standard Deviation Lower Bound Upper Bound
Confi dence Level in (%)
Actives Including Family Helpers 0.414 0.025 0.364 0.463 95
Actives 0.404 0.026 0.354 0.455 95
Source: NDSA. Note: DAD® Software.
Inequality of income is rather high in Afghanistan, when measured with the Gini coeffi cient (See Table 7 above). When family helpers working without earning a direct income are included in the analysis, the Gini coeffi cient for Afghanistan is of 0.41. On the other hand, if family helpers without direct income are excluded from the calculation, the Gini coeffi cient is of 0.40. Table 8 below provides an overview of inequality in the South Asia Region
29 See BAKHSHI P. and al. (2006), op. cit.
Table 8. Poverty and Inequality in the South Asia Region
Inequality (Gini coeffi cient) Poverty headcount rateNotes
% Year % Year % Year % Year
Afghanistan n/a n/a 41.4 2005 n/a n/a n/a n/a For Gini coeffi cient, NDSA data.Bangladesh 25.9 1991-92 30.6 2000 58.8 91-92 49.8 2000 World Bank (2003)
India (i) 29.0 93-94 32.0 1999-00 29.2 93-94 22.7 99-00Staff estimation and Deaton and Dreze (2002), the variance of the logarithm of per capita expenditure is used for inequality measure
India (ii) n/a 93-94 33.0 1999-00 36.0 93-94 28.6 99-00 WDR 2006Nepal 34.2 1995-96 41.4 2003-04 41.8 95-96 30.9 2003-04 World Bank (2005)Pakistan 30.6 1998-99 28.4 2001-02 32.0 98-99 35.2 2001-02 Kijima, et.al. (2005)Sri Lanka 32 1990-91 40.0 2002 26.1 90-91 22.7 2002 Narayan and Yoshida (2004)Maldives n/a n/a 34.8 2002/03 n/a n/a 17.3 2002/03 Murgai (2004)Bhutan n/a n/a 41.6 2003 n/a n/a 31.7 2003 National Statistical Bureau, Bhutan (2004)
Source:http://siteresources.worldbank.org/INTSAREGTOPPOVRED/Countries/20816264/regionaldataonpovertyandinequality.pdf Note: Poverty lines are defi ned differently across countries; so poverty headcount ratios are not comparable across countries.
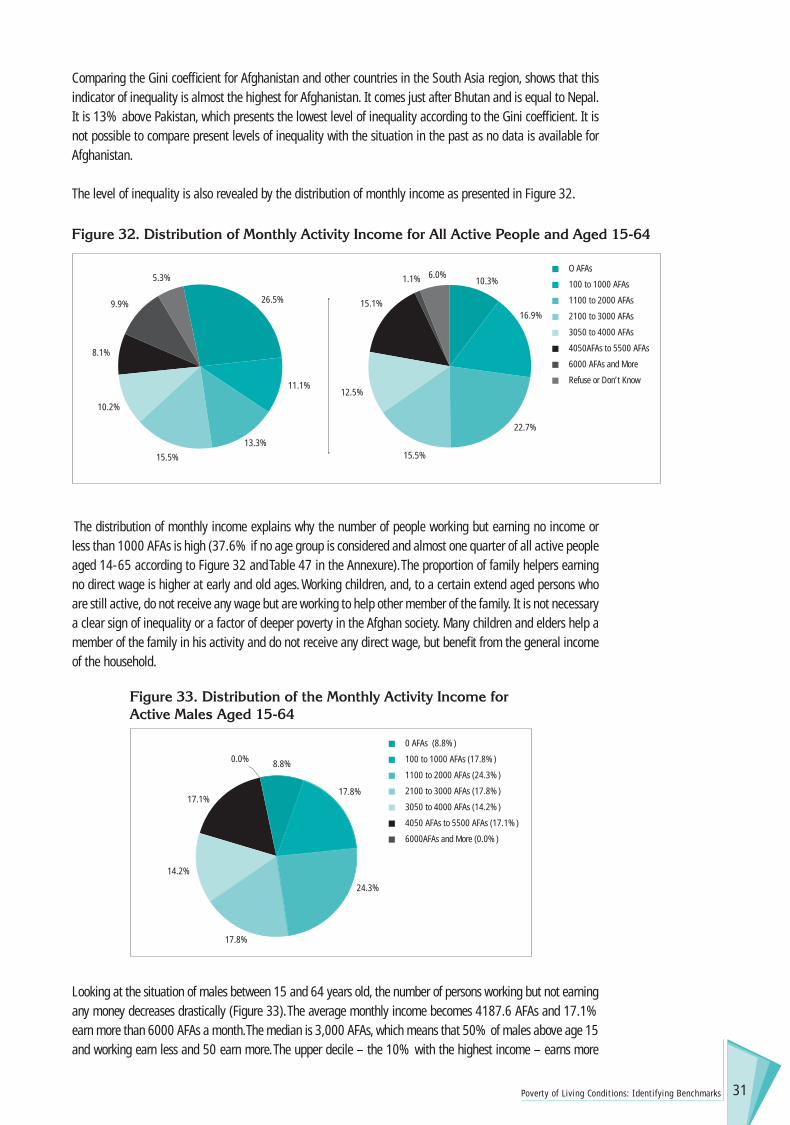
31Poverty of Living Conditions: Identifying Benchmarks
Comparing the Gini coeffi cient for Afghanistan and other countries in the South Asia region, shows that this indicator of inequality is almost the highest for Afghanistan. It comes just after Bhutan and is equal to Nepal. It is 13% above Pakistan, which presents the lowest level of inequality according to the Gini coeffi cient. It is not possible to compare present levels of inequality with the situation in the past as no data is available for Afghanistan.
The level of inequality is also revealed by the distribution of monthly income as presented in Figure 32.
Figure 32. Distribution of Monthly Activity Income for All Active People and Aged 15-64
� O AFAs
� 100 to 1000 AFAs
� 1100 to 2000 AFAs
� 2100 to 3000 AFAs
� 3050 to 4000 AFAs
� 4050AFAs to 5500 AFAs
� 6000 AFAs and More
� Refuse or Don’t Know
10.2%
26.5%
11.1%
13.3%
15.5%
8.1%
9.9%
5.3% 6.0%10.3%
16.9%
22.7%
15.5%
12.5%
15.1%
1.1%
The distribution of monthly income explains why the number of people working but earning no income or less than 1000 AFAs is high (37.6% if no age group is considered and almost one quarter of all active people aged 14-65 according to Figure 32 and Table 47 in the Annexure). The proportion of family helpers earning no direct wage is higher at early and old ages. Working children, and, to a certain extend aged persons who are still active, do not receive any wage but are working to help other member of the family. It is not necessary a clear sign of inequality or a factor of deeper poverty in the Afghan society. Many children and elders help a member of the family in his activity and do not receive any direct wage, but benefi t from the general income of the household.
Figure 33. Distribution of the Monthly Activity Income for Active Males Aged 15-64
� 0 AFAs (8.8%)
� 100 to 1000 AFAs (17.8%)
� 1100 to 2000 AFAs (24.3%)
� 2100 to 3000 AFAs (17.8%)
� 3050 to 4000 AFAs (14.2%)
� 4050 AFAs to 5500 AFAs (17.1%)
� 6000AFAs and More (0.0%)
17.8%
8.8%
17.8%
24.3%
14.2%
17.1%
0.0%
Looking at the situation of males between 15 and 64 years old, the number of persons working but not earning any money decreases drastically (Figure 33). The average monthly income becomes 4187.6 AFAs and 17.1% earn more than 6000 AFAs a month. The median is 3,000 AFAs, which means that 50% of males above age 15 and working earn less and 50 earn more. The upper decile – the 10% with the highest income – earns more

32 Understanding Vulnerability of Afghans with Disability
than 7,500 AFAs a month. The 1% with the highest income earns more than 20,000 AFAs a month (400 USD), almost 7 times more than the median income and 4.8 times more than the average income.
Comparing Income of Persons with Disability and Non-DisabledComparing monetary income must be done with a lot of caution. Firstly, because, as already explained above, many active people do not receive an individual wage; it is included in the family income. According to Figure 34 (and Table 48 in the Annexure), many active people are not paid, and there are probably more non-disabled persons in this case than persons with disability. This is explained by a higher rate of employment among non-disabled people who contribute to the family income by participating in a large array of activities for which the head of household is paid. In high ranges of income, the proportion of persons without disability is higher. But the level of disparity is not statistically signifi cant for higher levels of income; it is however signifi cant for the lowest levels (less than 2000 AFAs). Hence, persons with disability are signifi cantly a higher proportion to earn smaller wages than the non-disabled.
Figure 34. Distribution of Active Persons according to the Monthly Professional Income
� Non-Disabled
� Persons with Disability
0 AFAs 1100 to 2000
AFAs
30
25
20
15
10
5
0100 to1000 AFAs
2100 to 3000
AFAs
3050 to 4000
AFAs
4050 AFAs to 5500AFAs
6000 AFAs and
More
0 AFAs 1100 to 2000
AFAs
30
25
20
15
10
5
0100 to1000 AFAs
2100 to 3000
AFAs
3050 to 4000
AFAs
4050 AFAs to 5500AFAs
6000 AFAs and
More
Active Age 15-64Active All Ages
Focusing the analysis only on active men above age 15 as in Figure 35 (and Table 49 in the Annexure), clearly shows differences of level of income between disabled and non-disabled. Almost 50% of men with disability earn less than 2000 AFAs a month, while only 28.8% of non-disabled men earn the same. A proportion of 46.3% of non-disabled men earns more than 3000 AFAs a month while only 28.1% of disabled men earn that much.
Figure 35. Distribution of Active Men above Aged 15-64 according to the Monthly Professional Income
� Persons with Disability
� Non-Disabled30
25
20
15
10
5
00 AFAs 1100 to 2000
AFAs100 to 1000
AFAs2100 to 3000
AFAs3050 to 4000
AFAs4050 AFAs to 5500 AFAs
6000 AFAs and More

33Poverty of Living Conditions: Identifying Benchmarks
Among higher monthly income, the difference of earnings is between non-disabled males and those with disability is statistically signifi cant.
If professional income is concentrated among a few active people in the household, then redistribution of money and goods is also a widespread phenomenon inside the household and in the family. The individuals working usually give their income to the head of household, or to the woman in charge of expenditure. If any of them has specifi c requirements he/she requests the money from the head of the household. For this reason, disparity in earnings does not refl ect totally inequity among individuals as an important redistribution of resources takes place inside the household.
Concluding RemarksThe Afghan labour market is characterised by a dominant agricultural sector, which represents the majority of the Afghan work force. Men with disability have more diffi culty to work in the fi elds due to some impairments that make diffi cult to carry out physical tasks. It might be challenging in the near future to organise accessibility for farming. Yet, many other actions can be planed.
Accessibility of women to the labour market is a fi rst important step to be taken. A large majority of women do not have income generating employment.
On the other hand, children with disability aged 6-14 do work: they are just as many as non-disabled children in all jobs except fi eldwork. Almost half of them contribute to household tasks. Promoting school enrolment is the most effi cient way to reduce the most alarming child labour activities. By knowing to read and write, developing analytical skills and critical thinking, these children are more able to deal with their environment and get better working conditions in the future.
Persons with disability, when they participate in the labour market, are present in the same professions as other Afghan workers. Yet, they occupy the most precarious positions: occasional workers, family helpers, etc. They also earn lower wages, especially women with disability. Equalisation of opportunities, promoting equal wages and fair labour conditions together with an employment obligation could be a signifi cant step forward.
Disabled men do not work due to their impairment. Finding the way to allow them to contribute to the family welfare by their activity is a step towards alleviation of poverty. Access to employment for persons with disability is an effective way to fi ght poverty, reduce vulnerability, and strengthen social inclusion. Whenever a person contributes to the family welfare, her/his social status within the family improves. An obligation of employment, of at least 5% of persons with disability in the public sector, if correctly and effectively enforced, is a strong impetus towards ensuring that persons with disability have an equal access to the labour market. However, going a step ahead would mean including persons with disability in mainstream labour market programmes (private and public) and activities wherever it is possible, as a priority group. Persons with disability should also be offered equal opportunities and full participation in programmes such as cash for work or food for work or the National Solidarity Programme of Afghanistan, that aim to provide jobs in projects undertaken at the community level.


35Fewer Assets for Persons with Disability: a Vulnerability Issue
Afghans are systematically at risk of falling into more severe poverty, especially in rural areas: this constitutes their vulnerability. These forms of vulnerability are studied through the evaluation of assets possessed by the household as a unit. As the NRVA 2003 puts it “those households with a fewer assets are more likely to report a worse economic situation30”. At this point it seems essential to ask what the assets relevant in order to overcome unexpected external shocks are. Various ways of classifying durable goods can be suggested:� Common goods, usually for consumption or production;� Luxury goods which are sign of the social position: big size house, costly animals, TV set and car;� Assets that can be used to fi ght against vulnerability and are useful to overcome shocks: equipment for
agriculture and for the house.
High amount of material possession is a relative indicator of well being of the household. Yet, possession of vast land on one hand and reliable and extensive social networks on the other, are invaluable assets useful to escape poverty and face risks, and not being vulnerable to unexpected shocks. Having more assets increases the capability to overcome diffi culties. It is a determinant factor in the capacity that individuals have for resilience.
In this section, comparison with NRVA 2003 will be provided wherever it is relevant. Globally, it appears that major trends are similar in both surveys, even if fi gures can be different for some assets.
Durable Goods: Relative Indicators of Well-BeingOne can considers different ways of classifying durable goods according to:� Their function: equipment for production (tractor), or home appliances (radio, refrigerator, TV set...);� The way they symbolise the standard of living of the house: a kerosene lamp is a major asset for a poor
family, which is used for light, whereas it is basic equipment for the majority of Afghan families.
In both cases, durable goods can be considered as assets for the household since they can be used to increase capability and therefore, reduce vulnerability.
Equipment of the House and Common Goods: Benchmarks for WealthDuring the survey, people were asked about the possession of goods and equipment by any member of the household or by the household as a whole. These include very basic and non-costly goods such as kerosene lamps, which almost all families own except the poorest strata (97.3% of households reported having one), pressure cooker or radio are respectively present in 62% and 68.9% of Afghan households. Other more costly goods or equipments such as cars or television sets are owned by 4% and 21.1% of Afghan households.
Fewer Assets for Persons with Disability: a Vulnerability Issue
30 VULNERABILITY ANALYSIS AND MAPPING UNIT OF THE WORLD FOOD PROGRAMME AND THE VULNERABILITY ANALYSIS UNIT OF THE MINISTRY OF RURAL REHABILITATION AND DEVELOPMENT (2004), op. cit. p.52.

36 Understanding Vulnerability of Afghans with Disability
31 In Figure 36 and Table 51 the number of households without disabled members is weighted using the ratio of the number of households in the country divided by the number of households without a person with disability in the sample. The methodology used is based on the interview of one control non-disabled person every fi ve households without people with disability. Each of the non-disabled persons interviewed living in a household with non-disabled, represents all of them. See BAKHSHI P. et al. (2006b), “Conducting Surveys on Disability: a Comprehensive Toolkit”, Handicap International and Government of Afghanistan, Lyon and Kabul.32 See BAKHSHI P. et al. (2006a), op. cit. for more about ability to drive a bicycle…
Another striking result is that 77.4% of Afghan families possess their house. The ownership of a house is an important asset to reduce vulnerability.
These results are not very different for persons with disability and non-disabled. A statistically signifi cant difference of 5.3% exists for possession of a sewing machine between the two types of households; this difference is of 4% for a radio. But for ownership of other goods and equipment there is little difference: ranging from 0.3% for cars or ovens, to 2.1% for generators or 2.2% for televisions. When calculated by referring to the number of households possessing these items, the difference is extremely limited and non-signifi cant.
Figure 36 (and Table 51 in the Annexure) compares the situation of the two types of households for possession of material goods and equipment. It further explains the similarity between the two pertaining to the ownership of goods. With slightly different weighting between the two types of cross tabulations31, results are very similar. The statistically signifi cant differences are for:� Radio (4.5% more households of non-disabled own one);� Pressure cooker (4.8% more households with non-disabled members have one);� Motorbike (3.2% more households with non-disabled members have one);� Tractor (0.9% more households with non-disabled members have one);� Sewing machine (6.7% more households with non-disabled members have one).
Kerosene lamps and pressure cookers are not considered as luxury goods except for the extremely poor households, who cannot afford one. The fi gures above demonstrate that households with persons with disability consistently have fewer assets and are more vulnerable for all durable goods and equipment except for basic goods such as a pressure cooker.
In the case of motorbikes, the hypothesis that some of these households do not have use of a motorbike if no one is able to drive it32, can be put forward. For ownership of other items, the variations are again very low: the highest is 1.7% for the motorbike. The lowest is 0.2% for ovens and hotplates, which are certainly not an expensive equipments characteristic of wealth, but the lack of electricity makes their use limited. For tractors, the difference is small but statistically signifi cant due to the low numbers of households having one: this might indicate that in very wealthy households differences between households with persons with disability and non-disabled households are signifi cant.
Figure 36. Distribution of Households regarding Ownership of Goods or Equipment
Radio
� Households without Persons with Disability
� Households with Persons with Disability
100
90
80
70
60
50
40
30
20
10
0
Televi
sion
Pressu
re
Cooke
r Oven,
Hotplat
e
Refrige
rator
Bukhari
Bicycle
Motorbi
ke Car
Tracto
r
Generat
or
Keros
ene
Lamp
Sewing
Machine
House
or
Apart
ment

37Fewer Assets for Persons with Disability: a Vulnerability Issue
Figure 37 (and Table 52 in the Annexure) show strong statistically signifi cant differences between urban and rural settings, with an exception for kerosene lamps that are owned by almost all households. Rural households generally possess fewer assets than urban ones, except for houses: this might indicate that rural households are poorer but less vulnerable in case of an external shock. In fact, owning a house can avoid becoming homeless as a direct consequence of an external shock except in some cases of fl ood... It is probable that people who have a partial mortgage on the house also declare themselves as being owners.
In rural areas, 67.7% of households owned a radio in 2005, and this result is consistent with NRVA 200333 result, which found 65% of households. 86.7% of urban households own a radio. For sewing machines, the proportion of rural households owning one is higher than in the NRVA 2003. 46.2% of rural households own a sewing machine (64.3% of urban households) according to the NDSA data, while only 31% of rural households were reported owning one by the NRVA 2003 survey. The gap is diffi cult to explain and nothing indicates a sole valid reason that could explain the increase of more than 10% of acquisitions of such equipment during the two-year period between the surveys. Is the reason to be fi nd in the aid of INGOs ? Some distribute sewing machines through livelihood projects…
The difference for tractors is signifi cant but almost nobody has one. It is probable that urban households owning one have fi elds just outside town. It is striking how much better off, in terms of possession of goods and equipment, urban households are:
� The highest difference is for television sets: 58.6% of urban households own one against only 9.8% of rural ones, which is understandable mostly because of lack of main power in rural areas and because of the still relatively high price of a TV set. There is also a concept of community televisions, which is widespread in these rural areas, where TV sets are usually in a shop or tea-house (Tchaikhana) and are watched by a number of people.
� Car (10.8% of households own one in town, 2.2% in rural areas; NRVA 2003 found 4% for ownership of car or truck in rural areas);
� Bicycle (respectively 53.8% urban and 24.6% rural; 25% in NRVA 2003 for rural households);� Motorbike (respectively 15.7% urban and 8.2% rural, almost the same as in NRVA 2003: 8%);� Refrigerator (respectively 20.6% urban and 0.3% rural);� Generator (respectively 27.8% urban and 7.0% rural), etc.
Figure 37. Distribution of People regarding Possess of Goods or Equipment in Urban and Rural Areas
Radio
� Urban
� Rural100
90
80
70
60
50
40
30
20
10
0
Televi
sion
Pressu
re
Cooke
r Oven,
Hotplat
e
Refrige
rator
Bukhari
Bicycle
Motorbi
ke Car
Tracto
r
Generat
or
Keros
ene
Lamp
Sewing
Machine
House
or
Apart
ment
34 VULNERABILITY ANALYSIS AND MAPPING UNIT OF THE WORLD FOOD PROGRAMME AND THE VULNERABILITY ANALYSIS UNIT OF THE MINISTRY OF RURAL REHABILITATION AND DEVELOPMENT (2004), op. cit., p. 41.

38 Understanding Vulnerability of Afghans with Disability
The quantity of equipment possessed by rural households is very low, and this illustrates the high difference in livelihood assets and wealth between rural and urban Afghanistan. The only exception is for ownership of houses: rural households usually own their houses (82.3% of them). Renting of houses is far more common in towns where one-third of households rent their living spaces. The prices of real estate – especially in regional centres and above all in Kabul city where the international community is very present – are skyrocketing, this factor may also explain this difference.
As shown in Figure 38, even if households headed by a woman are relatively more present in urban areas than those headed by a man, they systematically possess less goods, and equipments, with the exception of sewing machines that are often used by women for income generating activities.
Figure 38. Distribution of Households according to Gender of the Head of the Household for Ownership of Goods or Equipment
Radio
� Man Head of the Household
� Woman Head of the Household100
90
80
70
60
50
40
30
20
10
0
Televi
sion
Pressu
re
Cooke
r Oven,
Hotplat
e
Refrige
rator
Bukhari
Bicycle
Motorbi
ke Car
Tracto
r
Generat
or
Keros
ene
Lamp
Sewing
Machine
House
or
Apart
ment
Thus, households headed by a woman are statistically signifi cantly less than men headed households to own:� Radio set (52.5% against 73.2% for households headed by a man);� Pressure cooker (50.8% against 59.0% for households headed by a man);� Refrigerator (2.8% against 5.5% for households headed by a man);� Car (0% against 4.5% for households headed by a man).
If households headed by a woman owning a motorbike are as numerous as those headed by a man, a possible explanation might be that men living in the households headed by women buy it whenever they can for transportation.
72% of households headed by a woman own their house, which is a strong warrantee against the risk of falling into poverty. Yet, the remaining third of these households are particularly vulnerable because they do not own their house and in fact, barely have anything to call their own.
Overall, more than a third of all households do not possess anything except a kerosene lamp. Results further indicate that households headed by a woman are more at risk of poverty. Here again, the disability factor does not seem to have a strong impact on ownership of goods.
Widespread Ownership of LivestockResults regarding the ownership of livestock are in line with the analysis above that indicates the general similarity of livelihood level between persons with disability and non-disabled. A high number of Afghan households possess at least one animal. Livestock is a good indicator of the ability to face unexpected shocks and of the decrease of vulnerability.

39Fewer Assets for Persons with Disability: a Vulnerability Issue
The analysis in terms of households with persons with disability and households without persons with disability leads to similar conclusions. A large number of both groups of households possess livestock (See Figure 39 and Table 58 in the Annexure). It is interesting to notice that households without persons with disability more often own livestock, which is expensive, and are considered more valuable such as cows, horses, donkeys, roosters and camels. This means that households with persons with disability are among the most vulnerable as they do not own as many useful assets.
Figure 39. Distribution of Households according to the Ownership of Livestock
Owns Animals
� Households without Persons with Disability
� Households with Persons with Disability80
70
60
50
40
30
20
10
0Sheeps Cows Goats Horses Donkeys Chickens Rooster Camles
More in-depth analyses of ownership of livestock by type of animal yield no signifi cant differences between persons with disability and non-disabled at the level of individuals. But at the households level, a few differences are signifi cant between the two types of households (see Table 59 in the Annexure). Nevertheless, the percentage of differences remains limited.
The highest difference observed between households is a statistically signifi cant 4.7% for families not possessing goats: a higher proportion of households with persons with disability do not own goats.
Statistically signifi cant differences are observed in two situations, but in both cases, the difference is a few percentages:� On one hand, households with persons with disability own fewer animals that are most commonly
owned such as poultry, sheep, cows, and goats;� On the other hand, they less often own very expensive animals such as roosters (used among other
things for fi ghting), horses or camels.
As a conclusion, it can be noted that the difference between households is not signifi cantly observable among poor households, but that it becomes more important among households, which are better off. This leads to believe that poverty is often chronic and multifaceted, infl uenced by a number of variables. Disability affects living conditions once all the other factors have been tackled, making persons with disability more vulnerable and more at risk of remaining in poverty. Policies geared towards fi ghting poverty must also focus on ensuring security and strengthening capability by reducing vulnerability of households that have a disabled member.
As shown in Figure 40, the same conclusion can be made for households headed by men or women. Both possess livestock. To go one step further in the analysis, it is interesting to distinguish between types of animals owned: it is not the same to own a chicken or two own four horses for Buskachi! While households
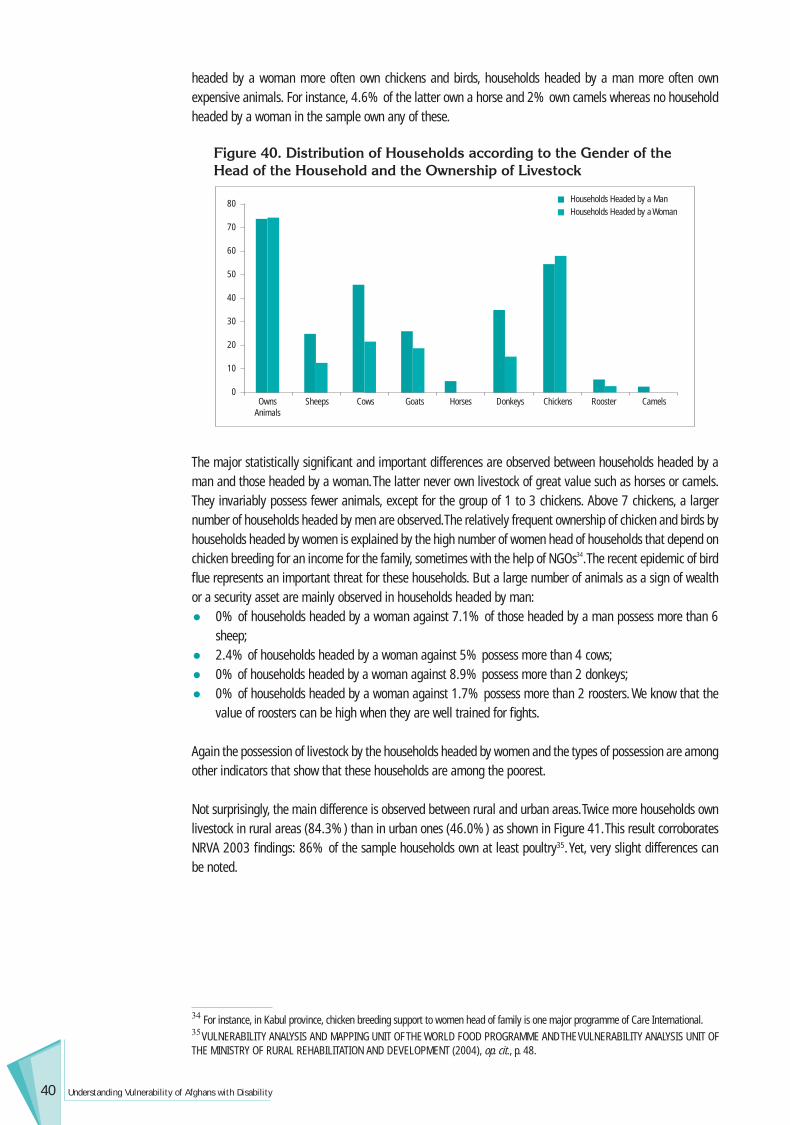
40 Understanding Vulnerability of Afghans with Disability
headed by a woman more often own chickens and birds, households headed by a man more often own expensive animals. For instance, 4.6% of the latter own a horse and 2% own camels whereas no household headed by a woman in the sample own any of these.
Figure 40. Distribution of Households according to the Gender of the Head of the Household and the Ownership of Livestock
Owns Animals
� Households Headed by a Man
� Households Headed by a Woman80
70
60
50
40
30
20
10
0Sheeps Cows Goats Horses Donkeys Chickens Rooster Camels
The major statistically signifi cant and important differences are observed between households headed by a man and those headed by a woman. The latter never own livestock of great value such as horses or camels. They invariably possess fewer animals, except for the group of 1 to 3 chickens. Above 7 chickens, a larger number of households headed by men are observed. The relatively frequent ownership of chicken and birds by households headed by women is explained by the high number of women head of households that depend on chicken breeding for an income for the family, sometimes with the help of NGOs34. The recent epidemic of bird fl ue represents an important threat for these households. But a large number of animals as a sign of wealth or a security asset are mainly observed in households headed by man: � 0% of households headed by a woman against 7.1% of those headed by a man possess more than 6
sheep;� 2.4% of households headed by a woman against 5% possess more than 4 cows;� 0% of households headed by a woman against 8.9% possess more than 2 donkeys;� 0% of households headed by a woman against 1.7% possess more than 2 roosters. We know that the
value of roosters can be high when they are well trained for fi ghts.
Again the possession of livestock by the households headed by women and the types of possession are among other indicators that show that these households are among the poorest.
Not surprisingly, the main difference is observed between rural and urban areas. Twice more households own livestock in rural areas (84.3%) than in urban ones (46.0%) as shown in Figure 41. This result corroborates NRVA 2003 fi ndings: 86% of the sample households own at least poultry35. Yet, very slight differences can be noted.
34 For instance, in Kabul province, chicken breeding support to women head of family is one major programme of Care International.35 VULNERABILITY ANALYSIS AND MAPPING UNIT OF THE WORLD FOOD PROGRAMME AND THE VULNERABILITY ANALYSIS UNIT OF THE MINISTRY OF RURAL REHABILITATION AND DEVELOPMENT (2004), op. cit., p. 48.

41Fewer Assets for Persons with Disability: a Vulnerability Issue
Table 9. Ownership of Livestock: Comparing NRVA 2003 and NDSA 2005
Types of Livestock NRVA NDSA Rural
NDSA Urban
Donkeys 55.0% 41.2% 11.4%
Cows 45.0% 52.5% 20.0%
Horses 4.0% 5.2% 0.9%
Camels 2.0% 2.4% 0.4%
NRVA 2003 found that 55% of rural households own donkeys, 45% milking cows, 4% at least one horse and 2% a camel. NDSA results show that in 2005:� 41.2% of rural households and 11.4% of urban households own at least one donkey;� 52.5% of rural households and 20% of urban households own at least one cow;� 5.2% of rural households and 0.9% of urban households own at least one horse;� 2.4% of rural households and 0.4% of urban households own at least one camel.
Considering the confi dence interval for this data, the results appear to be similar with the exception of the proportion of households possessing donkeys. The difference in proportion of possession of cows might be explained by the fact that NDSA did not differentiate between milking and non-milking cows.
Again livestock can be classifi ed into various different types: � Some are considered as assets used for transportation, agricultural production (ploughing);� Some are used for consumption: cows or chicken;� Some directly provide an income when bred for selling: chicken, roosters.The degree to which they contribute to the reduction of vulnerability will depend upon other factors, but in general they all contribute to enhancing household capabilities.
Figure 41. Distribution of Households regarding Ownership of Livestock in Urban and Rural Areas
Owns Animals
� Urban Households
� Rural Households90
80
70
60
50
40
30
20
10
0Sheeps Cows Goats Horses Donkeys Chickens Rooster Camels
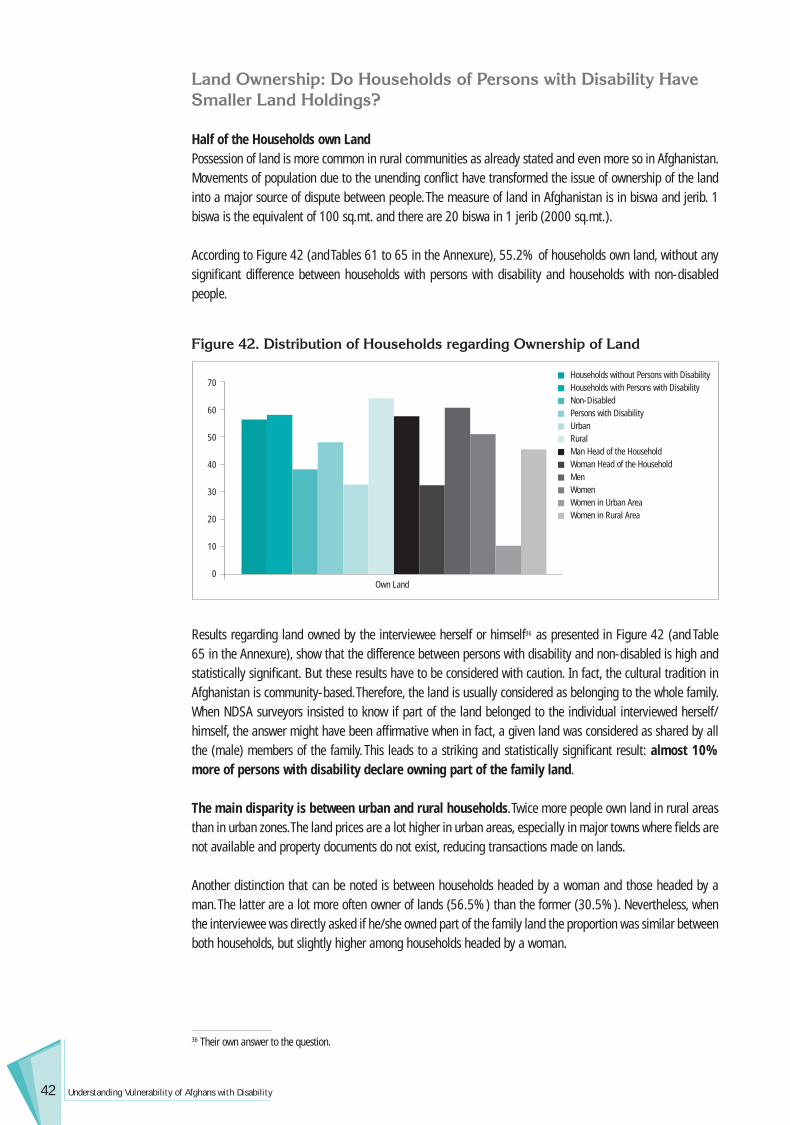
42 Understanding Vulnerability of Afghans with Disability
Land Ownership: Do Households of Persons with Disability Have Smaller Land Holdings?
Half of the Households own LandPossession of land is more common in rural communities as already stated and even more so in Afghanistan. Movements of population due to the unending confl ict have transformed the issue of ownership of the land into a major source of dispute between people. The measure of land in Afghanistan is in biswa and jerib. 1 biswa is the equivalent of 100 sq.mt. and there are 20 biswa in 1 jerib (2000 sq.mt.).
According to Figure 42 (and Tables 61 to 65 in the Annexure), 55.2% of households own land, without any signifi cant difference between households with persons with disability and households with non-disabled people.
Figure 42. Distribution of Households regarding Ownership of Land
70
60
50
40
30
20
10
0Own Land
� Households without Persons with Disability
� Households with Persons with Disability
� Non-Disabled
� Persons with Disability
� Urban
� Rural
� Man Head of the Household
� Woman Head of the Household
� Men
� Women
� Women in Urban Area
� Women in Rural Area
Results regarding land owned by the interviewee herself or himself36 as presented in Figure 42 (and Table 65 in the Annexure), show that the difference between persons with disability and non-disabled is high and statistically signifi cant. But these results have to be considered with caution. In fact, the cultural tradition in Afghanistan is community-based. Therefore, the land is usually considered as belonging to the whole family. When NDSA surveyors insisted to know if part of the land belonged to the individual interviewed herself/himself, the answer might have been affi rmative when in fact, a given land was considered as shared by all the (male) members of the family. This leads to a striking and statistically signifi cant result: almost 10% more of persons with disability declare owning part of the family land.
The main disparity is between urban and rural households. Twice more people own land in rural areas than in urban zones. The land prices are a lot higher in urban areas, especially in major towns where fi elds are not available and property documents do not exist, reducing transactions made on lands.
Another distinction that can be noted is between households headed by a woman and those headed by a man. The latter are a lot more often owner of lands (56.5%) than the former (30.5%). Nevertheless, when the interviewee was directly asked if he/she owned part of the family land the proportion was similar between both households, but slightly higher among households headed by a woman.
36 Their own answer to the question.

43Fewer Assets for Persons with Disability: a Vulnerability Issue
The size of land also varies widely among households and families. The difference between households with persons with disability and households with non-disabled people regarding ownership of land is only statistically signifi cant for large size of lands (See Table 66 in the Annexure). This is even more striking for cultivable land (See Table 67 in the Annexure). If the proportion of households which do not own any land is the same for both types of households; the difference is of 2.5% more for households of non-disabled people only when the land considered is more than 40 biswas. This difference is of 3.4% for land which is cultivable. It can be assumed that if the difference between the two types of households is not important or signifi cant when under or close to the poverty line, the difference becomes signifi cant for wealthy family. Thus, among families owning land, the average size of land is respectively 102 and 120 biswa (between 1000 and 1200 sq. mt.) in urban and rural areas for family with a person with disability, and respectively 154 and 113 (between 1540 and 1130 sq. mt.) in urban and rural areas for family without a person with disability.
All together, the average size of land owned is 149 and 113.5 biswa (1490 and 1135 sq. mt.) respectively in urban and rural areas. It seems that wealthy families owning large size of lands often live in urban areas, even if the land is possessed in the village of origin.
Tables 68 and 69 in the Annexure show that households headed by a woman are statistically signifi cantly a lower proportion to own land (30.5%) especially cultivable land (29.9%), than those headed by a man (respectively 56.5% and 54.3%). This result is different from NRVA 2003 that found that 56% of female headed of household own some land. But if only rural areas are considered, women head of households are a proportion of 44.5% owning land in their own right (but only 8% in urban areas). For larger size lands, almost fi ve times more of households headed by a man own fi elds of more than 40 biswa. The gap is slightly less for cultivable land.
Women heads of household own land, but other women also do (see Figure 42 in previous page). No law in Afghanistan prohibits women from possessing land. Of course, especially in Pashto tradition, women are scarcely landowners and rarely cultivate fi elds. Yet, some do. Women receive land through inheritance from their fathers or their husbands, even if their share is less important than the share of the men. Sometime, daughters give up their right on the land to their brother. Widows usually keep their land when they do not live with their sons, even if someone else is cultivating them.
Measure of Inequality: Lorenz Curves and Gini Coeffi cientsThe Lorenz curve measures inequalities. It is a graphical representation of the proportionality of a distribution (the cumulative percentage of the values of land). The curves look at the distribution of land among individuals and households.
DAD® Software.
Figure 43. Lorenz Curves of Land Ownership Inequalities
0.000
0.025
0.050
0.075
0.100
0.125
0.150
0.175
0.200
0.225
0.250
0.275
0.300
0.325
0.350
0.375
0.400
0.425
0.450
0.475
0.500
0.525
0.550
0.575
0.600
0.625
0.650
0.675
0.700
0.725
0.750
0.775
0.800
0.825
0.850
0.875
0.900
0.925
0.950
0.975
0.000
1.000.950.900.850.800.750.700.650.600.550.500.450.400.350.300.250.200.150.100.050.00
Cum
ulat
ive
Dist
ribut
ion
of L
and
� Land Ownership Households without Persons with Disability � Land Ownership Households with Persons with Disability
� Land Ownership All Households � Cultivable Land Ownership All Households
Cumulative Distribution of Land
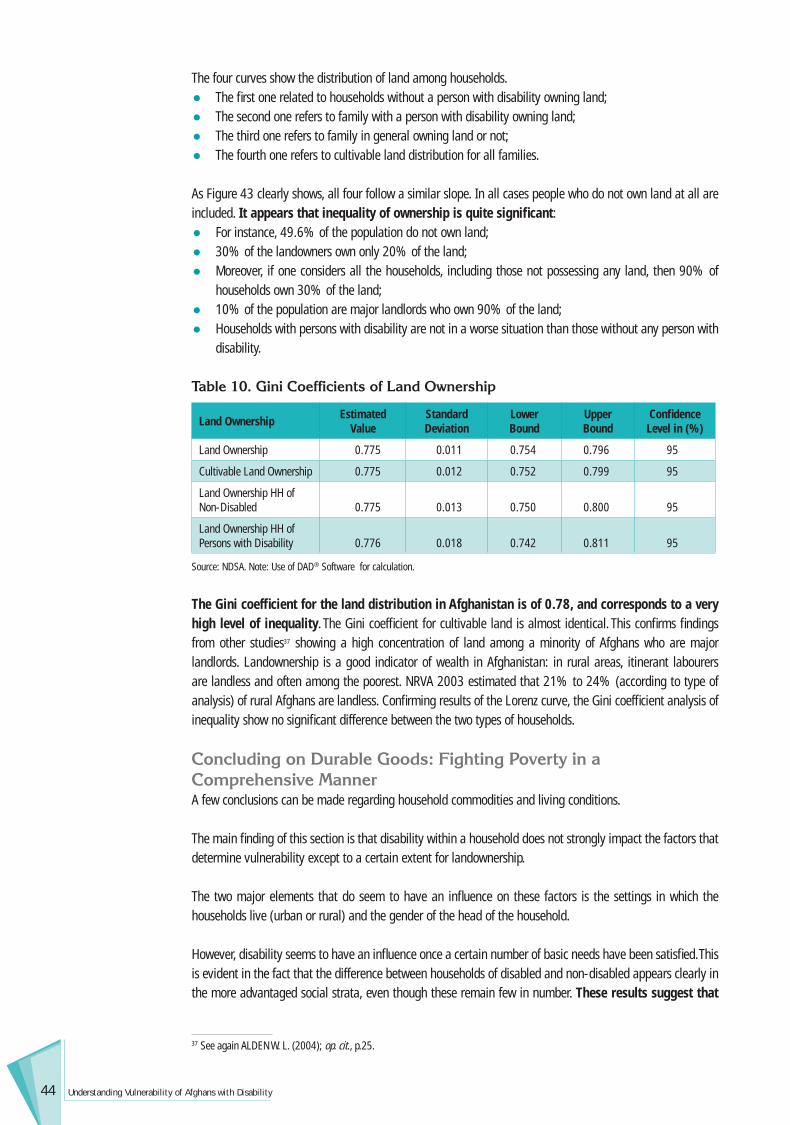
44 Understanding Vulnerability of Afghans with Disability
The four curves show the distribution of land among households. � The fi rst one related to households without a person with disability owning land;� The second one refers to family with a person with disability owning land; � The third one refers to family in general owning land or not; � The fourth one refers to cultivable land distribution for all families.
As Figure 43 clearly shows, all four follow a similar slope. In all cases people who do not own land at all are included. It appears that inequality of ownership is quite signifi cant: � For instance, 49.6% of the population do not own land;� 30% of the landowners own only 20% of the land;� Moreover, if one considers all the households, including those not possessing any land, then 90% of
households own 30% of the land;� 10% of the population are major landlords who own 90% of the land;� Households with persons with disability are not in a worse situation than those without any person with
disability.
Table 10. Gini Coefficients of Land Ownership
Land Ownership Estimated Value
Standard Deviation
Lower Bound
Upper Bound
Confi dence Level in (%)
Land Ownership 0.775 0.011 0.754 0.796 95
Cultivable Land Ownership 0.775 0.012 0.752 0.799 95
Land Ownership HH of Non-Disabled 0.775 0.013 0.750 0.800 95
Land Ownership HH of Persons with Disability 0.776 0.018 0.742 0.811 95
Source: NDSA. Note: Use of DAD® Software for calculation.
The Gini coeffi cient for the land distribution in Afghanistan is of 0.78, and corresponds to a very high level of inequality. The Gini coeffi cient for cultivable land is almost identical. This confi rms fi ndings from other studies37 showing a high concentration of land among a minority of Afghans who are major landlords. Landownership is a good indicator of wealth in Afghanistan: in rural areas, itinerant labourers are landless and often among the poorest. NRVA 2003 estimated that 21% to 24% (according to type of analysis) of rural Afghans are landless. Confi rming results of the Lorenz curve, the Gini coeffi cient analysis of inequality show no signifi cant difference between the two types of households.
Concluding on Durable Goods: Fighting Poverty in a Comprehensive MannerA few conclusions can be made regarding household commodities and living conditions.
The main fi nding of this section is that disability within a household does not strongly impact the factors that determine vulnerability except to a certain extent for landownership.
The two major elements that do seem to have an infl uence on these factors is the settings in which the households live (urban or rural) and the gender of the head of the household.
However, disability seems to have an infl uence once a certain number of basic needs have been satisfi ed. This is evident in the fact that the difference between households of disabled and non-disabled appears clearly in the more advantaged social strata, even though these remain few in number. These results suggest that
37 See again ALDEN W. L. (2004); op. cit., p.25.

45Fewer Assets for Persons with Disability: a Vulnerability Issue
it is when the living conditions improve that the impact of disability is stronger as this weighs down on the entire household. Thus, once fi ght against monetary poverty is underway, the main challenge remains to reduce vulnerability in the long-term. Public action will need to be focused on increasing assets, improving functionings and generally empowering persons with disability ensuring that their concerns are mainstreamed and they do not remain at risk of falling back into poverty when faced with unexpected external shocks.
Debt and Donation: Assets or Factors of Vulnerability?This section looks at a wider defi nition of income: income through the social capital, i.e. the network of an individual that is supporting her/him. Usually this term is related to the monetary amounts that a person receives. But in traditional structures such as Afghanistan, it is essential to also take into account the other goods (food and clothing for example) that a person receives. This aspect of income is crucial for persons with disability since it determines the consideration and support that he/she has within the household. Moreover, in such social and cultural structures, the salaries are often paid in non-monetary terms, or given to the head of household for an effort of the family unit. All these aspects of “income” make it diffi cult to assess in terms of “how much” exactly is received by the individual.
However, income remains different from donation since the former is remuneration for an effort, some form of work. A donation is money, goods or presents that are given by solidarity for example. A donation is defi ned by the fact that nothing is (offi cially) expected in return38. Lastly, a donation differs from a loan, which not only is explicit in monetary terms but is also expected to be paid back. Questions regarding income are asked directly to the interviewee and donations are an evaluation of money and goods given.
Resort to Loan and Level of Debt: Higher for Persons with DisabilityThe level of debt can be a factor of risk of falling into poverty or a way of drawing on resources to achieve certain functionings and increase capabilities. In fact, as loan is often a family matter in Afghanistan, if a person or his/her relatives cannot face his/her obligations of repayment, there is a propensity of selling or mortgaging assets to pay back the debt. 35.8% of all Afghans aged over 14, female and male, had taken a loan, whatever the amount might be, in the 5 years preceding the interview. This fi gure refl ects a frequent practice, especially if one considers that the loan is often taken for a family need and is paid back by all the active members in the family.
What are the characteristics of debt of Afghans today? Understanding these will help to evaluate the risk of falling into poverty for the people indebted and to assess how vulnerable they may be. One major aspect to keep in mind is that people who lend money do not often ask for interests to be paid. Even if usury is a forbidden practice in a Muslim country, it is important to note that mortgager gets back the amount lent, even if various generations have to pay it off.
Diversity of Borrowers’ Profi lesSince a loan needs to be paid back, a majority of active persons report having taken one (46.2%) as shown in Figure 44 (and Table 70 in the Annexure). Nevertheless, more than a quarter (27.6%) of inactive people have also taken loans in the last fi ve years. Among these, a large part of people looking for a job have taken loans (55.9%), this is also the case for a large proportion of old people (52.9%) who do not work anymore but have different sources of income coming from house rent, fi eld rent, etc. There is a statistically signifi cant difference between persons with disability taking a loan (36.1%) and the non-disabled (30.5%). This difference is even higher when active people are taken into account: active persons with disability are 60% to be indebted while active non-disabled are only 45.7%.
39 Here we specify ‘offi cially’ because a donation always implies a relationship of dominance between giver and receiver. It aslo defi nes social and family dynamics and implies the authority of the donor.
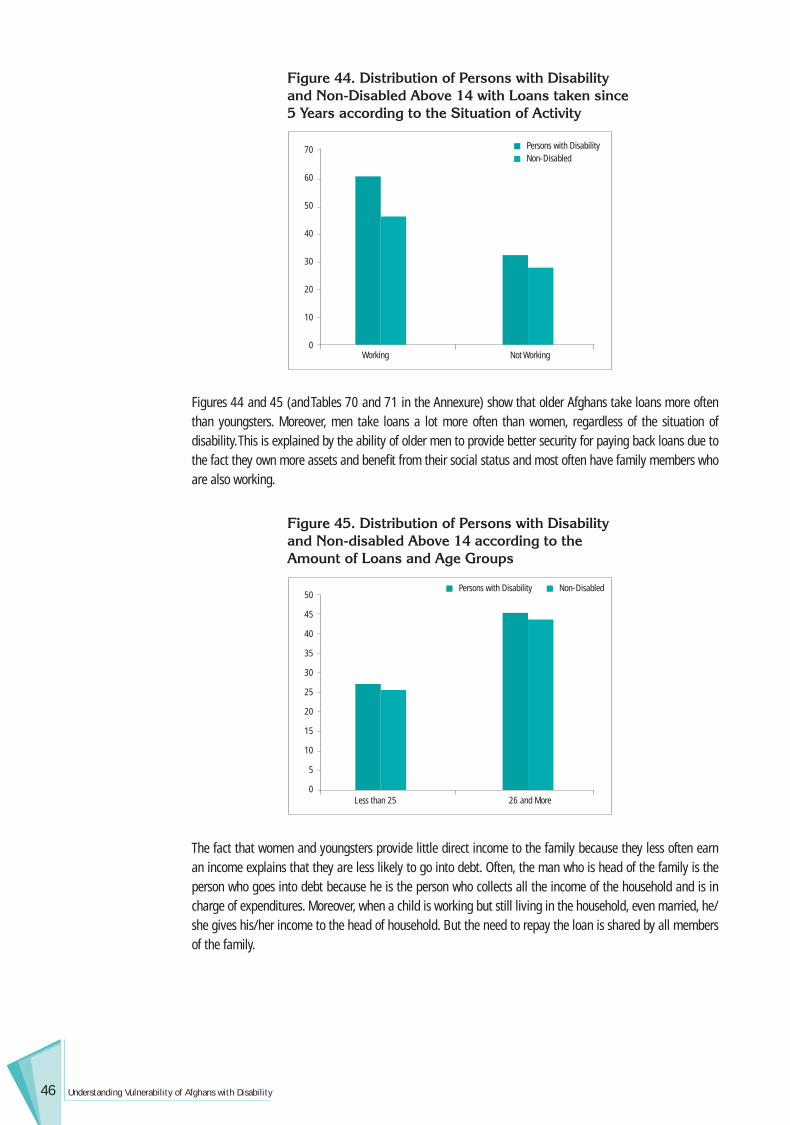
46 Understanding Vulnerability of Afghans with Disability
Figure 44. Distribution of Persons with Disability and Non-Disabled Above 14 with Loans taken since 5 Years according to the Situation of Activity
70
60
50
40
30
20
10
0Working Not Working
� Persons with Disability
� Non-Disabled
Figures 44 and 45 (and Tables 70 and 71 in the Annexure) show that older Afghans take loans more often than youngsters. Moreover, men take loans a lot more often than women, regardless of the situation of disability. This is explained by the ability of older men to provide better security for paying back loans due to the fact they own more assets and benefi t from their social status and most often have family members who are also working.
Figure 45. Distribution of Persons with Disability and Non-disabled Above 14 according to the Amount of Loans and Age Groups
50
45
40
35
30
25
20
15
10
5
0Less than 25 26 and More
� Persons with Disability � Non-Disabled
The fact that women and youngsters provide little direct income to the family because they less often earn an income explains that they are less likely to go into debt. Often, the man who is head of the family is the person who goes into debt because he is the person who collects all the income of the household and is in charge of expenditures. Moreover, when a child is working but still living in the household, even married, he/she gives his/her income to the head of household. But the need to repay the loan is shared by all members of the family.

47Fewer Assets for Persons with Disability: a Vulnerability Issue
Figure 46. Distribution of Persons with Disability and Non-Disabled Above 14 with Loan taken since 5 Years According to Gender
60
50
40
30
20
10
0Males Females
� Persons with Disability
� Non-Disabled
Figure 47 (and Table 72 in the Annexure) show that persons with disability take a loan more often when they live in urban areas than when they live in rural ones. This result is inversed for the non-disabled. The difference of proportion is statistically signifi cant between persons with disability and non-disabled taking a loan in urban areas; but not in rural ones.
Figure 47. Distribution of Persons with Disability and Non-Disabled Above 14 with Loan taken since 5 Years According to the Area of Living
50
45
40
35
30
25
20
15
10
5
0Urban Rural
� Persons with Disability
� Non-Disabled
Similar results, even more prominent, are found when taking into account only the major towns of the country such as Kabul, Herat, Jalalabad, Kandahar, Mazar-I-Sharif and Kunduz on one hand and the rest of the country on the other (see Table 73 in the Annexure). This is explained by various factors. There are a higher number of persons with disability in major towns, and they more often work than those living in villages. They also have a higher standard of living and probably a larger social network, making it easier to obtain a loan in such settings.
High Amount of Loans TakenThe amount of the loans taken is an interesting way of having an overview on income. In fact, people are less reluctant in Afghanistan to talk about the loans they take than the income they get. If 36.7% of Afghans contract a loan, they are only a small proportion to have taken more than one in the last 5 years. 17.5% took a second one, 7.2% a third one, 1.7% a fourth one and 0.7% a fi fth one. These fi gures must be interpreted
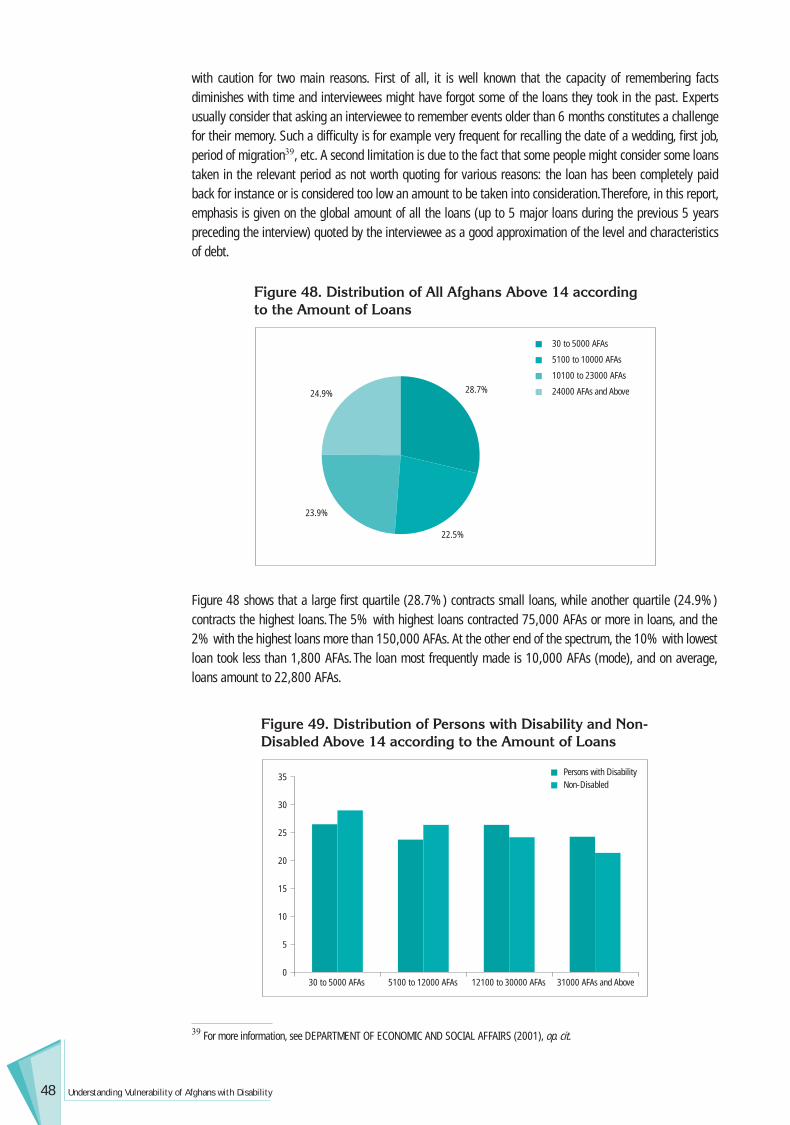
48 Understanding Vulnerability of Afghans with Disability
with caution for two main reasons. First of all, it is well known that the capacity of remembering facts diminishes with time and interviewees might have forgot some of the loans they took in the past. Experts usually consider that asking an interviewee to remember events older than 6 months constitutes a challenge for their memory. Such a diffi culty is for example very frequent for recalling the date of a wedding, fi rst job, period of migration39, etc. A second limitation is due to the fact that some people might consider some loans taken in the relevant period as not worth quoting for various reasons: the loan has been completely paid back for instance or is considered too low an amount to be taken into consideration. Therefore, in this report, emphasis is given on the global amount of all the loans (up to 5 major loans during the previous 5 years preceding the interview) quoted by the interviewee as a good approximation of the level and characteristics of debt.
Figure 48. Distribution of All Afghans Above 14 according to the Amount of Loans
� 30 to 5000 AFAs
� 5100 to 10000 AFAs
� 10100 to 23000 AFAs
� 24000 AFAs and Above
23.9%
22.5%
28.7%24.9%
Figure 48 shows that a large fi rst quartile (28.7%) contracts small loans, while another quartile (24.9%) contracts the highest loans. The 5% with highest loans contracted 75,000 AFAs or more in loans, and the 2% with the highest loans more than 150,000 AFAs. At the other end of the spectrum, the 10% with lowest loan took less than 1,800 AFAs. The loan most frequently made is 10,000 AFAs (mode), and on average, loans amount to 22,800 AFAs.
Figure 49. Distribution of Persons with Disability and Non-Disabled Above 14 according to the Amount of Loans
35
30
25
20
15
10
5
030 to 5000 AFAs 5100 to 12000 AFAs
� Persons with Disability
� Non-Disabled
12100 to 30000 AFAs 31000 AFAs and Above
39 For more information, see DEPARTMENT OF ECONOMIC AND SOCIAL AFFAIRS (2001), op. cit.

49Fewer Assets for Persons with Disability: a Vulnerability Issue
Figure 49 (and Table 75 in the Annexure) show that persons with disability have a tendency to borrow more money than non-disabled Afghans. This might be explained by increased expenditure due to health cure as well as the need for support and devices, for instance.
Table 11. Average Amount of Loan for Urban and Rural Households
HouseholdsUrban Rural
Mean (AFAs) Mean (AFAs)
Households without Persons with Disability 23346.8 20581.2
Households with Persons with Disability 41024.9 28508.0
Source: NDSA
Table 11 shows that the average loan is almost twice as high in urban areas for households with a person with disability, and almost 50% higher in rural areas than for households without a person with disability. Considering that the sources for livelihood of these households is not very different in terms of poverty level than households with only non-disabled, the need for money might be explained by specifi c expenses that non-disabled household do not face or face to a less extent, such as health expenses40.
40 See BAKHSHI P. et. al. (2006), op. cit.
Figure 50. Distribution of Persons with Disability and Non-Disabled Above 14 according to the Amount of Loans and the Age Group
100%
80%
60%
40%
20%
0%Non-Disabled<26
� 31000 AFAs and Above
� 12100 to 30000 AFAs
� 5100 to 12000 AFAs
� 30 to 5000 AFAs
5.9
30.0
29.6
34.6
28.0
21.2
24.6
26.2
8.9
28.9
22.2
40.0
27.1
25.3
24.0
23.6
Non-Disabled>26 Persons with Disability<26 Persons with Disability>26
Figure 50 (and Table 75 in the Annexure) show that older Afghans, regardless of disability, are more likely to take high amount loans (27.5% of Afghans older than age 26 take loan of more than 31,000 AFAs) than younger people (only 7.3% of Afghans younger than age 26 take loans above 31,000 AFAs). The latter take loans most often of less than 5,000 AFAs: 37.3% among them versus a proportion of only 26.3% among older people. The probability of becoming indebted logically increases with age.

50 Understanding Vulnerability of Afghans with Disability
Figure 51. Distribution of Persons with Disability and Non-Disabled Above 14 according to the Amount of Loans and Gender
100%
80%
60%
40%
20%
0%Non-Disabled Males
� 31000 AFAs and Above
� 12100 to 30000 AFAs
� 5100 to 12000 AFAs
� 30 to 5000 AFAs
23.5
24.8
28.0
23.6
12.7
20.8
20.3
46.1
24.1
30.2
23.6
22.1
23.9
14.1
23.9
38.0
Non-Disabled Females Persons with Disability Males Persons with Disability Females
Figure 51 (and Table 76 in the Annexure) show that Afghan men do take loans of higher amount than women, but a notable result is that disabled women also take loans of high amounts: more than 23% of men and only 12.7% of women (but 23.9% of women with disability). The need to face high expenditures, particularly in the health sector, sometimes explains the necessity to borrow money.
Figure 52. Distribution of Persons with Disability and Non-Disabled Above 14 according to the Amount of Loans and the Living Area
100%
80%
60%
40%
20%
0%Non-Disabled Urban
� 31000 AFAs and Above
� 12100 to 30000 AFAs
� 5100 to 12000 AFAs
� 30 to 5000 AFAs
24.2
25.8
21.7
28.3
20.0
23.3
27.7
29.0
31.1
25.6
23.3
20.0
20.6
26.1
23.9
29.4
Non-Disabled Rural Persons with Disability Urban Persons with Disability Rural
Figure 52 (and Table 77 in the Annexure) show that urban Afghan people take higher amount of loans, especially persons with disability: 31.1% of urban Afghans with disability and 24.2% of urban non-disabled Afghans took loans worth more than 31,000 AFAs whereas rural Afghans are respectively 20% of non-disabled and 20.6% of persons with disability to take loans of such high amounts. The difference between urban and rural Afghans for highest and lowest amounts of loans is statistically signifi cant for persons with disability.
A Limited Level of DebtThe level of debt is measured by the amount of money still owed by the borrower. It is the difference between the amount of money borrowed globally and the amount of money already paid back at the time of the interview. Figure 53 shows that 27.6% of all borrowers owe less than 1500 AFAs, and a further 20.2% owe nothing, having paid back all the money. This means, grouped with the 64.2% of Afghans over age 14 who did not take a loan in the last 5 years, 84.2% of the Afghan population of this age is not in debt or has loans older than 5 years.
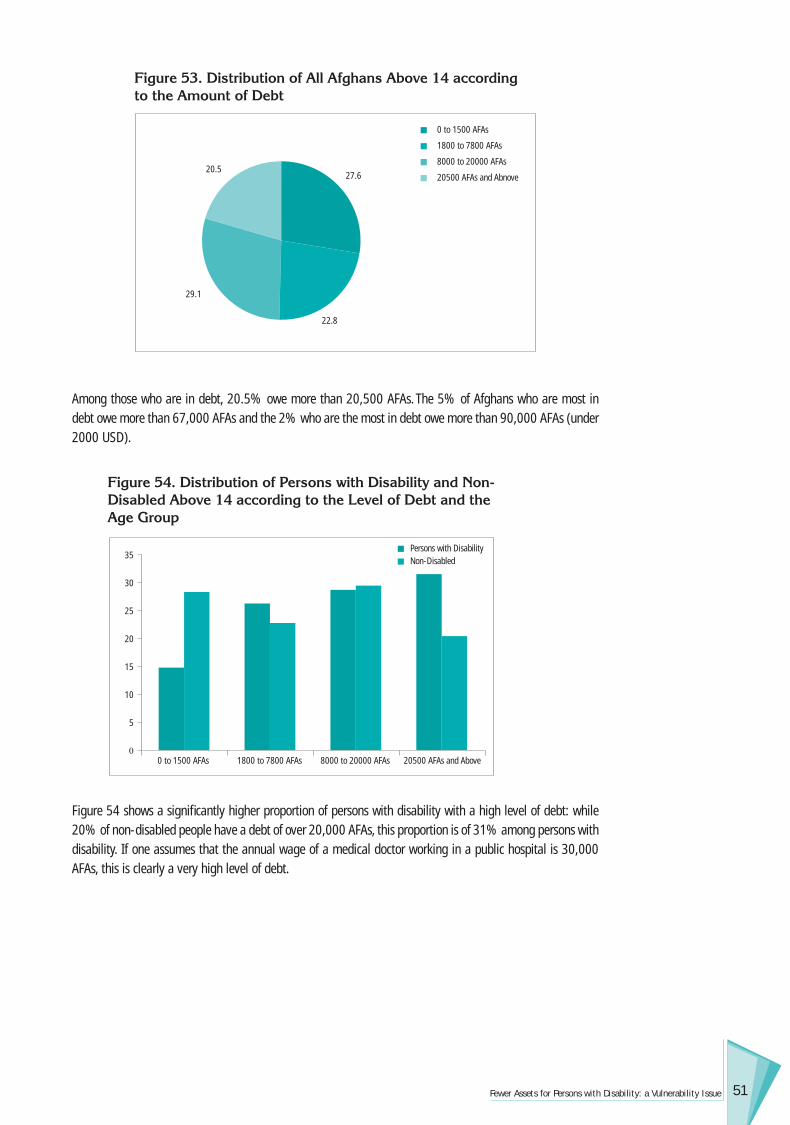
51Fewer Assets for Persons with Disability: a Vulnerability Issue
Among those who are in debt, 20.5% owe more than 20,500 AFAs. The 5% of Afghans who are most in debt owe more than 67,000 AFAs and the 2% who are the most in debt owe more than 90,000 AFAs (under 2000 USD).
Figure 53. Distribution of All Afghans Above 14 according to the Amount of Debt
� 0 to 1500 AFAs
� 1800 to 7800 AFAs
� 8000 to 20000 AFAs
� 20500 AFAs and Abnove
29.1
22.8
27.620.5
Figure 54. Distribution of Persons with Disability and Non-Disabled Above 14 according to the Level of Debt and the Age Group
35
30
25
20
15
10
5
00 to 1500 AFAs 1800 to 7800 AFAs
� Persons with Disability
� Non-Disabled
8000 to 20000 AFAs 20500 AFAs and Above
Figure 54 shows a signifi cantly higher proportion of persons with disability with a high level of debt: while 20% of non-disabled people have a debt of over 20,000 AFAs, this proportion is of 31% among persons with disability. If one assumes that the annual wage of a medical doctor working in a public hospital is 30,000 AFAs, this is clearly a very high level of debt.
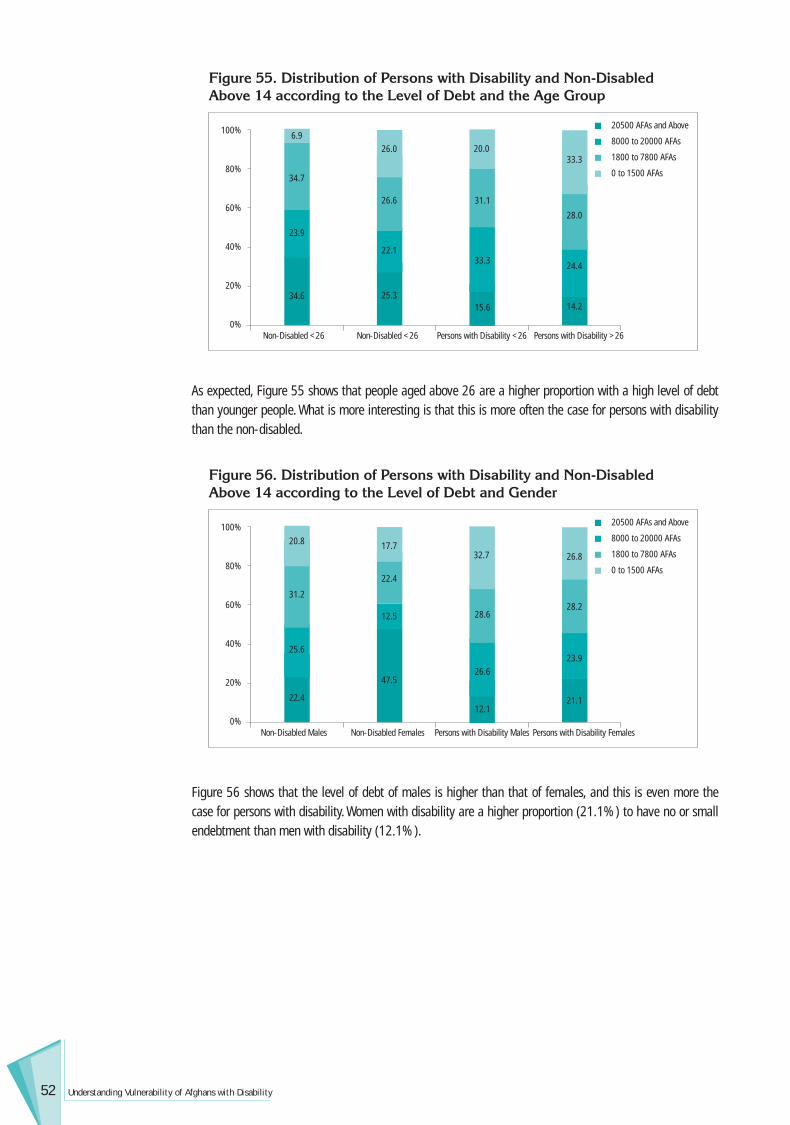
52 Understanding Vulnerability of Afghans with Disability
As expected, Figure 55 shows that people aged above 26 are a higher proportion with a high level of debt than younger people. What is more interesting is that this is more often the case for persons with disability than the non-disabled.
Figure 55. Distribution of Persons with Disability and Non-Disabled Above 14 according to the Level of Debt and the Age Group
100%
80%
60%
40%
20%
0%Non-Disabled <26
� 20500 AFAs and Above
� 8000 to 20000 AFAs
� 1800 to 7800 AFAs
� 0 to 1500 AFAs
6.9
34.7
23.9
34.6
26.0
26.6
22.1
25.3
20.0
31.1
33.3
15.6
33.3
28.0
24.4
14.2
Non-Disabled <26 Persons with Disability <26 Persons with Disability >26
Figure 56. Distribution of Persons with Disability and Non-Disabled Above 14 according to the Level of Debt and Gender
100%
80%
60%
40%
20%
0%Non-Disabled Males
� 20500 AFAs and Above
� 8000 to 20000 AFAs
� 1800 to 7800 AFAs
� 0 to 1500 AFAs
20.8
31.2
25.6
22.4
17.7
22.4
12.5
32.7
28.6
26.6
12.1
26.8
28.2
23.9
21.1
Non-Disabled Females Persons with Disability Males Persons with Disability Females
47.5
Figure 56 shows that the level of debt of males is higher than that of females, and this is even more the case for persons with disability. Women with disability are a higher proportion (21.1%) to have no or small endebtment than men with disability (12.1%).

53Fewer Assets for Persons with Disability: a Vulnerability Issue
Figure 57. Distribution of Persons with Disability and Non-Disabled Above 14 according to the Level of Debt and the Living Area
100%
80%
60%
40%
20%
0%Non-Disabled Urban
� 20500 AFAs and Above
� 8000 to 20000 AFAs
� 1800 to 7800 AFAs
� 0 to 1500 AFAs
32.5
21.6
8.6
37.3
16.0
31.6
27.2
38.9
25.6
22.2
13.3
27.2
30.0
27.8
15.0
Non-Disabled Rural Persons with Disability Urban
Persons with Disability Rural
25.2
The situation is slightly different when comparing living areas. There is no signifi cant difference for level of debt between rural and urban areas for persons with disability, except for debts above 20,500 AFAs for which persons with disability are signifi cantly more numerous to be indebt in urban areas. Differences between non-disabled living in urban and rural areas are signifi cant at all levels. Urban people are in majority to be at the extremes: having high levels of debt (32.5% of them have a debt above 20,500 AFAs) or very low level (37.3% have less than 1,500 AFAs). Rural people are mainly around an average level of debt (58.8% between 1,800 AFAs and 20,000 AFAs). Few have very high debt and a quarter has low debt. This result corroborates the fact that households among the poorest and those among the wealthiest are present in towns.
Figure 58. Distribution of Persons with Disability and Non-Disabled Above 14 according to the Level of Debt and the Situation of Activity
100%
80%
60%
40%
20%
0%Non-Disabled Not Active
� 20500 AFAs and Above
� 8000 to 20000 AFAs
� 1800 to 7800 AFAs
� 0 to 1500 AFAs
3.16.15.6
85.2
11.3
14.8
10.6
9.1
8.9
7.4
74.7
20.1
17.2
17.2
45.5
Non-Disabled Active Persons with Disability Not Active
Persons with Disability Active
63.3
Figure 58 (and Table 82 in the Annexure) show that active people, especially among persons with disability, have a tendency to have higher debt. They take loans that they know they will be able to pay back. Nevertheless, the level of debt is not linked to the number of working people in the household; it does not increase according to the number of active people.

54 Understanding Vulnerability of Afghans with Disability
Purpose of Loan: a Yardstick of Poverty?Why do Afghans need to take loans? The fi rst reason is food. Almost a third of Afghans took a loan at least once in the last 5 years to get some food for the family. Food and health requirements often constitute emergency expenditures: there is realisation of a risk, lack of food or accident, disease, etc. Suddenly the family faces an unexpected expenditure and is forced to take a loan. In these circumstances, taking a loan is clearly an indication of vulnerability.
Figure 59. Distribution of All People Above 14 Having Taken Loans according to the Purpose of Loan
� Food (31.4%)
� School Expenditure (2.9%)
� Health Expenditure (17.8%)
� Professional Equipment (10.1%)
� House Equipment (16.5%)
� Ceremony (11.8%)
� Dowry (0.6%)
� Land Purchase/Rent (2.5%)
� Property Purchase (1.5%)
� Good Purchase for Business (1.5%)
� Other (3.5%)
10.1%
2.9%
31.4%0.6%
17.8%
16.5%
11.8%
2.5%1.5%1.5% 3.5%
Is there a difference between persons with disability and non-disabled concerning the reasons why a loan has been taken? Actually, a major and statistically signifi cant difference is for health expenditures: persons with disability, because of their health needs, more often take a loan to cover such expenditures. On the other hand, non-disabled persons signifi cantly take loans more often to pay for professional equipment purchase or to cover ceremony expenditures. Persons with disability slightly more often use loans for food, while non-disabled use it more for professional reasons (15.8% of non-disabled, 6.7% of persons with disability) or house equipment (21.9% of Non-disabled, 17.0% of persons with disability).
Figure 60. Distribution of Persons with Disability and Non-Disabled Above 14 according to the Purpose of Loan
Food
� Persons with Disability
� Non-Disabled50
45
40
35
30
25
20
15
10
5
0School
ExpenditureHealth
ExpenditureHouse
EquipmentCeremony Dowry Land
Purchase/RentProperty purchase
Good Purchase
Prof. Equipment
Other Purpose

55Fewer Assets for Persons with Disability: a Vulnerability Issue
Whereas persons with disability usually use loans for emergency expenditures to cover basic needs such as nutrition and health, non-disabled have a tendency to use loans more for professional investment, equipment or social expenditure. It is a tool used to improve a personal or family situation. Thus, borrowing money and being indebted can be regarded as a factor of vulnerability in the case of persons with disability
Loan is a Family and “Friendly” MatterLenders are most often friends of the borrower (47.9% of all cases) and children or other relatives (37.3%). There is no wide “business” of loan in Afghanistan, except in the emerging banking system, which started only in the last years and is solely implemented in main towns. Mostly people rely on their community and family network. Borrowing does not exist inside the household. Husband and wife do not borrow money from each other either; this is logical as money is dealt in common within the household.
Figure 61. Distribution of all People Above 14 according to the Lender
� Husband/Wife (7.3%)
� Father/Mother (37.3%)
� Brother/Sister (47.9%)
� Child/Other Relative
(11.8%)
� Friend (0.1%)
� Local/Religious Leader
(0.9%)
� Bank/Saving and Loans
(2.5%)
� Boss (0.4%)
� Professional Money Lender
� NGOs
� Other People
Figure 62 (and Table 84 in the Annexure) show that persons with disability and non-disabled both rely fi rst of all on friends to get money when they need it. But this phenomenon is statistically signifi cantly more common for the non-disabled. Non-disabled persons benefi t more often from the support of their social network. In other words, their social capital seems slightly more effi cient. On the other hand, persons with disability rely more on family: children especially (40.3% of them borrow from their children which is logical because persons with disability are older), but also siblings (11.3%) and parents (2%). Still, friends also are requested to lend money by 36.3% of persons with disability. Lenders who are not in the family are a higher proportion to lend money to persons with disability. This can be explained by the emergency of some needs. When a person needs to buy food or drugs, then he/she starts looking fi rst within the personal network, then, in case of lack of fund or sometime refusal, they seek the professional owners, employer, in some case banks. NGOs are mentioned as loans providers by 1.4% of persons with disability and by 0.15% of non-disabled.
7.3%
0.4%1.7%
37.3%
47.9%
0.9%
0.1%
2.5%
0.4%0.2%
1.2%
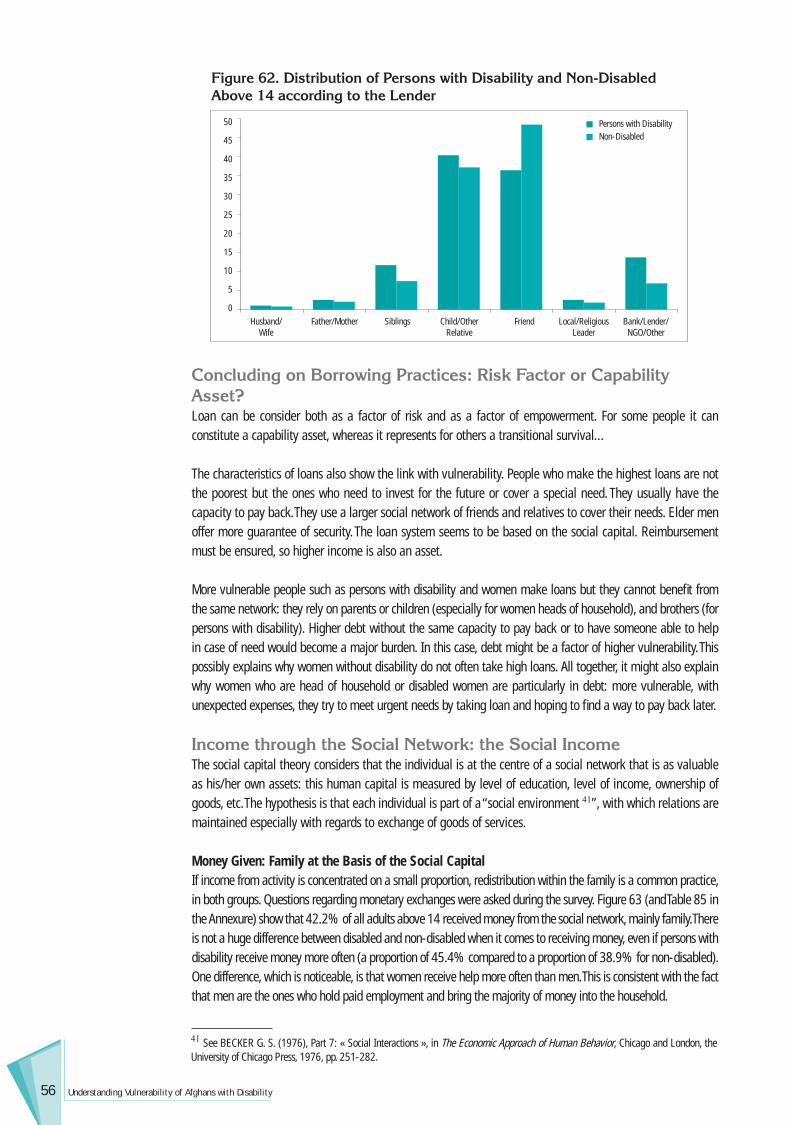
56 Understanding Vulnerability of Afghans with Disability
Figure 62. Distribution of Persons with Disability and Non-Disabled Above 14 according to the Lender
� Persons with Disability
� Non-Disabled
50
45
40
35
30
25
20
15
10
5
0Husband/
WifeSiblingsFather/Mother Child/Other
RelativeFriend Local/Religious
LeaderBank/Lender/NGO/Other
Concluding on Borrowing Practices: Risk Factor or Capability Asset?Loan can be consider both as a factor of risk and as a factor of empowerment. For some people it can constitute a capability asset, whereas it represents for others a transitional survival…
The characteristics of loans also show the link with vulnerability. People who make the highest loans are not the poorest but the ones who need to invest for the future or cover a special need. They usually have the capacity to pay back. They use a larger social network of friends and relatives to cover their needs. Elder men offer more guarantee of security. The loan system seems to be based on the social capital. Reimbursement must be ensured, so higher income is also an asset.
More vulnerable people such as persons with disability and women make loans but they cannot benefi t from the same network: they rely on parents or children (especially for women heads of household), and brothers (for persons with disability). Higher debt without the same capacity to pay back or to have someone able to help in case of need would become a major burden. In this case, debt might be a factor of higher vulnerability. This possibly explains why women without disability do not often take high loans. All together, it might also explain why women who are head of household or disabled women are particularly in debt: more vulnerable, with unexpected expenses, they try to meet urgent needs by taking loan and hoping to fi nd a way to pay back later.
Income through the Social Network: the Social IncomeThe social capital theory considers that the individual is at the centre of a social network that is as valuable as his/her own assets: this human capital is measured by level of education, level of income, ownership of goods, etc. The hypothesis is that each individual is part of a “social environment 41”, with which relations are maintained especially with regards to exchange of goods of services.
Money Given: Family at the Basis of the Social CapitalIf income from activity is concentrated on a small proportion, redistribution within the family is a common practice, in both groups. Questions regarding monetary exchanges were asked during the survey. Figure 63 (and Table 85 in the Annexure) show that 42.2% of all adults above 14 received money from the social network, mainly family. There is not a huge difference between disabled and non-disabled when it comes to receiving money, even if persons with disability receive money more often (a proportion of 45.4% compared to a proportion of 38.9% for non-disabled). One difference, which is noticeable, is that women receive help more often than men. This is consistent with the fact that men are the ones who hold paid employment and bring the majority of money into the household.
41 See BECKER G. S. (1976), Part 7: « Social Interactions », in The Economic Approach of Human Behavior, Chicago and London, the University of Chicago Press, 1976, pp. 251-282.

57Fewer Assets for Persons with Disability: a Vulnerability Issue
Figure 64 (and Table 86 in the Annexure) show a breakdown of persons with disability and non-disabled according to the donors. In both cases, a huge majority of the donors are from the family itself:� For non-disabled persons, fi rst come the parents (28.9%) followed closely by the spouse (27.8%),
then come brother and sister (23.2%) and children and other relatives in fourth position but far behind (10.9%);
� For persons with disability, fi rst come children and other relatives (24.6%), before brother and sister (22.6%), the spouse (19.7%) and parents (17.9%).
The differences between both groups are highly statistically signifi cant. The major difference regarding the money received from children is probably due to the needs of persons with disability to get support. This is also in line with the NDSA results that show a high number of persons over the age of 45 among the persons with disability42. The children support their parents as they become disabled with age and/or disease.
A minority of people receives money from persons outside the family. Friends are 5.4% to give money. Then other donors are quoted such as NGOs or employers mainly for persons with disability.
Figure 63. Distribution of Persons with Disability and Non-Disabled Above 14 Receiving Money according to Gender
80
70
60
50
40
30
20
10
0Non-Disabled Males Non-Disabled Females
� Received
� Not Received
Males with Disability Females with Disability
42 See BAKHSHI P. et. al. (2006), op. cit.
Figure 64. Distribution of Persons with Disability and Non-Disabled Above 14 according to the 3 Main Donors
Husband/Wife
� Persons with Disability
� Non-Disabled
30
25
20
15
10
5
0Father/Mother Brother/Sister Children and
other Family Members
Friends State Pension Local or Religious Leader
Employer, NGOs or
Other

58 Understanding Vulnerability of Afghans with Disability
If one considers the order of the answers separately as in Table 87 in the Annexure, one fi nds that:� For non-disabled people, the spouse appears to be quoted as the main donor in the 3 possible answers
and even represents 66.6% of all the donors in the third answer;� For persons with disability, the children and other family members appear to be the major donor whatever
the answer considered. � If NGOs and employers are quoted in the fi rst answer for the few persons with disability they give money
to, it is probably because the amount of money is signifi cant, particularly over the recent years.� State pensions or leaders of the community are quoted mainly in the third answer.
Table 88 in the Annexure gives an overview according to gender of who the main donors are. In both groups, persons with disability and non-disabled, women receive a lot more from their husbands, which is logical considering the general family dynamics. This also seems obvious given the social and cultural context and the gender dynamics.
Amounts Donated: Higher for MenFigure 65 (and Tables 89 and 90 in the Annexure) show that males more often receive higher amounts of money than women, independently from the disability factor. 58.6% of non-disabled women and 58.3% of disabled women receive less than 3,200 AFAs a year whereas more than 25% of males disabled or not, receive more than 12,000 AFAs.
Figure 65. Distribution of Persons with Disability and Non-Disabled above 14 by Amount of Money received and Gender
� Non-Disabled Males
� Non-Disabled Females
� Males with Disability
� Females with Disability
Less than 700 AFAs
40
35
30
25
20
15
10
5
0710 to 3200 AFAs 3300 to 12000 AFAs 12030 AFAs and Above
Concluding on Social IncomeMen more often give money to the members of their social network, particularly to their spouses. If they are a lower proportion to receive money, they receive higher amounts than women. Donation of money is also part of the social control of men on women. Women are not allowed to work, especially in rural areas, so men provide the resources for their needs. If they inherit part of the family land, they hand it over to the male of the family (sister to a brother, widow to a son) against a commitment of the latter to cover her needs.
59
General Conclusions
43 SCHUTTE S, (2006), “Poverty amid Prosperity: Urban Livelihood in Herat”, Afghanistan Research and Evaluation Unit, AREU, May 2006, 61 pp.
General Conclusions
Disability: a Dormant Factor?In Afghanistan, poverty appears as a “great leveller”. This is evident in some of the fi ndings of the present report and can be said with regards to commodities, living spaces as well as other assets. Disability does not have an impact when the general population is faced with severe and chronic poverty. The lack of water, electricity and general commodities of the overall population lead to a very minimal difference between households of persons with disability and non-disabled households. The persons with disability are not necessarily the poorest of the poor. On the contrary, the low level of life standard is shared on an equal basis by all. An exception is the case of women, especially isolated women, who suffer from more discrimination and appear to be among the poorest, and this is true both in towns and rural areas.
However, it is also essential to focus upon the few results that have been found regarding the small proportion of the population that is better off than the majority. The trends observed lead to believe that with regards to livelihoods and living conditions, disability impacts the more advantaged social groups. This in turn led us to put forward the strong assumption that as conditions in general improve, the impact of disability on livelihoods becomes salient. In order words, as households get out of poverty, households that have a disabled member will have to face more diffi culties, need more resources in order to improve their living conditions. Disability is thus a ‘dormant’ factor that is not on the forefront when faced with extreme poverty. However, at the second stage, this factor may have a heavy impact by keeping certain households more vulnerable to poverty and less equipped to face risks in life.
Urban or Rural Settings: an Expected DifferenceUrban livelihood seems to be a little wealthier: better access to water, main power, fl ush, diet diversity, more equipment, larger size of houses and household… Unlike Schutte43 who found more widespread nuclear households in Herat, urban households seem to be more extended. But the picture is not always positive. Ownership of house is less important. In case of incapacity to pay a rent, or if the person who provides the housing needs the house back, the family loses a major asset. Unemployment, underemployment and precarious conditions are more frequent in urban areas.
Female-headed Households: the most Vulnerable and the PoorestHouseholds headed by a woman are both the poorest and the most vulnerable. This fi nding corroborates NRVA 2003 analysis that identifi ed such households among the poor and very poor wealth groups. As shown by the NRVA 2003, NDSA 2005 fi nds that women head of household are a higher proportion having an income generating activity. These households have lower assets ownership and poor dietary diversity. They also face more isolation, thus are not able to rely on a strong social capital in case of shock occurrence.
Households headed by women are more present in urban areas, probably because of highest isolation from the rest of the family who is in the village. Acceptance of women heads of household might be also higher in

60 Understanding Vulnerability of Afghans with Disability
44 DUPREE N. H. (2004), The Family during Crisis in Afghanistan, Journal of Comparative Family Studies, Vol. 35, 311:332, 2004.
major towns and the social expectations and control a little less salient. Hence Afghan society maintains a strict control on women who must conform to traditional rules. As Dupree writes, “the hierarchical structure within families leaves little room for individualism, for senior male members, the ultimate arbiters, maintain family honour and social status by ensuring all members conform to prescribed forms of acceptable behaviour44”.
Access to the Labour Market: a Matter of PerceptionThe will to work is widespread among persons with disability and it is often a major claim they express. Opportunities of work are limited in an economy dominated by the agricultural sector, especially for the severely disabled and women with disability. Yet, the sector of services is rapidly growing stimulated by the reconstruction effort. Two major orientations could be followed in order to improve the situation. The fi rst one is the fi ght against stereotypes that lead to the belief that persons with disability, and especially women, cannot work due to their impairment. Sensitisation can also be achieved by mainstreaming persons with disability in the workplace; this is a fi rst step towards their inclusion on the labour market. Changing social attitudes and beliefs is the only way to enable persons with disability to participate in the labour market. Because sensitisation is not enough, a second set of action, complementary to the sensitisation process, is the passing and implementing of the law with a requirement for employment of persons with disability. This obligation imposed to all employers, both within the state administration and the private sector, is proactive and might decisively help persons with disability in their struggle for the right to employment.
The Way Forward: Mainstreaming, Empowerment, Participation of Persons with DisabilityGathering of knowledge on livelihood, vulnerability, risks and poverty provides understanding, information and insights necessary for policy formulation and strategic planning in the area of disability. A national disability strategy framework based on such principles as empowerment and mainstreaming aims at increasing access for persons with disability to social and economic opportunities. Designs of policies and strategies have to rely on scientifi c based knowledge and on participation of persons with disability themselves in the elaboration process.
This view, which has been put forward by a number of disabled persons’ organisations, tends to look at the barriers that exist within the social context and that prevent a person from achieving the same level of functioning as that of a non-disabled person. In this perspective it is society that needs to be redesigned in order to take into account the disabled persons’ needs. Mainstreaming persons with disability is a progressive way of reshaping society in order to better include them. Equalization of opportunities is a major goal put forward by the new United Nations Convention on the Rights of Persons with Disabilities adopted by the General Assembly on the 13th December 2006.
61Bibliography
BibliographyALDEN W., L. (2004), “Looking for Peace in the Pastures: Rural Land Relations in Afghanistan”, Afghanistan Research and Evaluation Unit, AREU, December 2004, 125 pp.
ALLEN, J. C. & BARNES, D. F. (1985), “The Causes of Deforestation in Developing Countries”, Annals of the Association of American Geographers 75 (2), 163-184.
BAKHSHI P., NOOR A. and TRANI J.F. (2006), “Towards Well-Being For Afghans With Disability: The Health Challenge”, Report to the Government of Afghanistan, Volume 2, Handicap International, Lyon and Kabul.
BAKHSHI P., TRANI J.F., ROLLAND C. (2006b), “Conducting Surveys on Disability: a Comprehensive Toolkit”, Handicap International and Government of Afghanistan, Lyon and Kabul.
BECKER G. S., (1976) “Social Interactions”, in The Economic Approach of Human Behavior, Part 7, Chicago and London, The University of Chicago Press, 1976, pp. 251-282.
COLLIER P. (1998), « Social Capital and Poverty », Social Capital Initiative, Working Paper n°4, the World Bank, Washington.
DEATON A. (1997), chapter 3: «Welfare, poverty and distribution», The Analysis of Household Surveys. A Microeconometric Approach to Development Policy, Baltimore and London, the Johns Hopkins University Press, pp. 133-202.
DUBOIS J.L., ROUSSEAU S., (2001), “Reinforcing Household’s Capabilities as a Way to Reduce Vulnerability and Prevent Poverty in Equitable Terms”, paper presented at the fi rst Conference on the Capability Approach, Justice and Poverty: Examining Sen’s Capability Approach, June 5th-7th 2001, Von Hugel Institute, St Edmund’s College, Cambridge University, http://www.st-edmunds.cam.ac.uk/vhi/.
DUCLOS J.-Y., ARAAR A. and FORTIN C., “DAD: a software for Distributive Analysis / Analyse Distributive”, MIMAP programme, International Development Research Centre, Government of Canada, and CIRPÉE, University of Laval.
DUPREE N. H. (2004), The Family during Crisis in Afghanistan, Journal of Comparative Family Studies, Vol. 35, 2004.
ELWAN, A. (1999), “Poverty and Disability, A Survey of the Literature”, Social Protection Discussion Paper Series, No. 9932, Social Protection Unit, Human Development Network, the World Bank, December 1999.
EMADI H. (2002), Repression, Resistance, and Women in Afghanistan, Praeger/Greenwood, August 2002, 216 p.
ERB S. and HARRIS-WHITE B. (2001), Outcast from Social Welfare: Adult Disability and Incapacity in Rural South India, Books for Change, Bangalore.
FOSTER J., GREER J. and THORBECKE E. (1984), « A class of decomposable poverty measures », Econometrica, 1984, vol. 52, n°3, may, pp. 761-766.

62 Understanding Vulnerability of Afghans with Disability
HOOGEVEEN J. G. (2005), “Measuring Welfare for Small but Vulnerable Groups: Poverty and Disability in Uganda”, Journal of African Economies, 2005 14(4):603-631.
INTERNATIONAL LABOR OFFICE (2006a), Out Of Work and in School: Our Development Challenge, Asia-Pacifi c Economic Cooperation, Publication of Project Experiences, 2001-2006 http://www.ilo.org/public/english/region/asro/bangkok/apec/download/book.pdf.
INTERNATIONAL LABOR OFFICE (2006b), The end of child labour: Within reach, International Labour Conference 95th Session 2006 Report I (B), Geneva, http://www.ilo.org/public/english/standards/relm/ilc/ilc95/pdf/rep-i-b.pdf.
METS R. L. (2000), “Disability Issues, Trends And Recommendations For The World Bank”, World Bank, Washington D.C.
RAVALLION M. (1998), “Poverty Lines in Theory and Practice, Living Standards Measurement Study”, Working Paper 133, World Bank, Washington DC, 1998.
RAVALLION M. (1994), “Poverty Comparisons”, Fundamentals of Pure and Applied Economics, volume 56, Harwood Academic Publishers, Switzerland, 1994.
SCHUTTE S. (2006), “Poverty amid Prosperity: Urban Livelihood in Herat”, Afghanistan Research and Evaluation Unit, AREU, May 2006, 61 pp.
TZEMACH G.(2006), Women Entrepreneurs in post-confl ict economies: A Look at Rwanda and Afghanistan, Washington D.C., Center fro International Private Entreprise, www.cipe.org.
UNITED NATIONS, DEPARTMENT OF INTERNATIONAL ECONOMIC AND SOCIAL AFFAIRS, STATISTICAL OFFICE (1990), “Disability Statistics Compendium”, Statistics on Special Population Groups, Series Y, No. 4, New York, 1990.
VULNERABILITY ANALYSIS AND MAPPING UNIT OF THE WORLD FOOD PROGRAMME AND THE VULNERABILITY ANALYSIS UNIT OF THE MINISTRY OF RURAL REHABILITATION AND DEVELOPMENT (2004), Reports on Findings from the 2003 National Risk and Vulnerability Assessment (NRVA) in Rural Afghanistan, December 2004, 123 p., http://www.mrrd.gov.af/vau/.
WOOD, W. B. (1989), “Long Time Coming: The Repatriation of Afghan Refugees”, Annals of the Association of American Geographers, 79 (3), 345-369.
WORLD BANK (2005), “Poverty, Vulnerability and Social Protection: an Initial Assessment.”, Afghanistan Report 29694-AF, 7 March 2005.
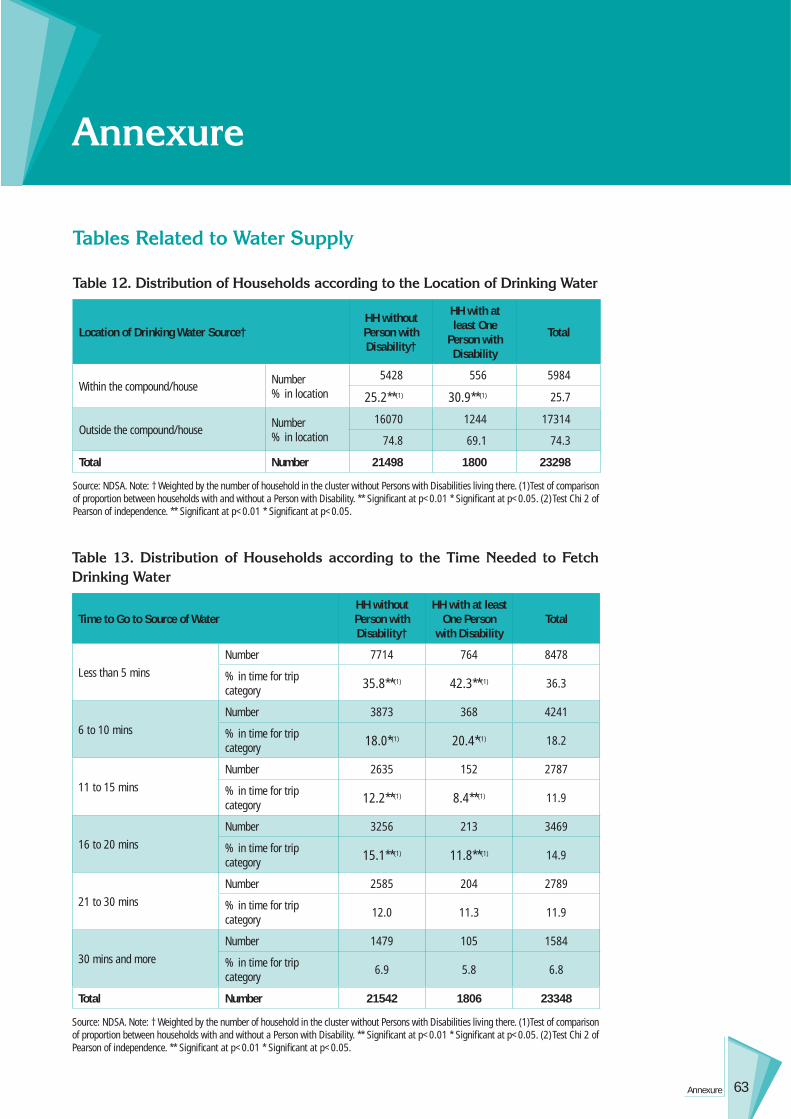
63Annexure
Annexure
Tables Related to Water Supply
Table 12. Distribution of Households according to the Location of Drinking Water
Location of Drinking Water Source†HH without Person with Disability†
HH with at least One
Person with Disability
Total
Within the compound/house Number% in location
5428 556 5984
25.2**(1) 30.9**(1) 25.7
Outside the compound/house Number% in location
16070 1244 17314
74.8 69.1 74.3
Total Number 21498 1800 23298
Source: NDSA. Note: † Weighted by the number of household in the cluster without Persons with Disabilities living there. (1)Test of comparison of proportion between households with and without a Person with Disability. ** Signifi cant at p<0.01 * Signifi cant at p<0.05. (2) Test Chi 2 of Pearson of independence. ** Signifi cant at p<0.01 * Signifi cant at p<0.05.
Table 13. Distribution of Households according to the Time Needed to Fetch Drinking Water
Time to Go to Source of WaterHH without Person with Disability†
HH with at least One Person
with DisabilityTotal
Less than 5 minsNumber 7714 764 8478
% in time for trip category 35.8**(1) 42.3**(1) 36.3
6 to 10 minsNumber 3873 368 4241
% in time for trip category 18.0*(1) 20.4*(1) 18.2
11 to 15 minsNumber 2635 152 2787
% in time for trip category 12.2**(1) 8.4**(1) 11.9
16 to 20 minsNumber 3256 213 3469
% in time for trip category 15.1**(1) 11.8**(1) 14.9
21 to 30 minsNumber 2585 204 2789
% in time for trip category 12.0 11.3 11.9
30 mins and moreNumber 1479 105 1584
% in time for trip category 6.9 5.8 6.8
Total Number 21542 1806 23348
Source: NDSA. Note: † Weighted by the number of household in the cluster without Persons with Disabilities living there. (1)Test of comparison of proportion between households with and without a Person with Disability. ** Signifi cant at p<0.01 * Signifi cant at p<0.05. (2) Test Chi 2 of Pearson of independence. ** Signifi cant at p<0.01 * Signifi cant at p<0.05.

64 Understanding Vulnerability of Afghans with Disability
Table 14. Distribution of Households according to Types of Water Supply Available
Types of Water Supply�HH without Person with Disability†
HH with at least One Person with
DisabilityTotal
Piped into residence/compound/plotNumber 1193 105 1298
% in Type of water supply 4.4 4.7 4.4
Public tapNumber 817 54 871
% in Type of water supply 3.0 2.4 3.0
Hand pump in residence/compoundNumber 1387 131 1518
% in Type of water supply 5.1 5.9 5.2
Public hand-pumpNumber 5038 418 5456
% in Type of water supply 18.6 18.9 18.6
Well in residence/compoundNumber 3566 349 3915
% in Type of water supply 13.2**(1) 15.8**(1) 13.4
Covered wellNumber 1808 153 1961
% in Type of water supply 6.7 6.9 6.7
Open well and karizNumber 2560 192 2752
% 9.5 8.7 9.4
SpringNumber 3976 262 4238
% in Type of water supply 14.7**(1) 11.8**(1) 14.5
River/streamNumber 5692 430 6122
% 21.0 19.4 20.9
Pond/lakeNumber 563 57 620
% in Type of water supply 2.1 2.6 2.1
Still water/damNumber 102 12 114
% in Type of water supply 0.4 0.5 0.4
Rain waterNumber 346 38 384
% in Type of water supply 1.3 1.7 1.3
Tanker, truck or otherNumber 9 11 20
% in Type of water supply 0.0 0.5 0.1
Total Number 27057 2212 29269**(2)
Source: NDSA. Note: �Up to three answers were possible. † Weighted by the number of household in the cluster without Persons with Disabilities living there. (1)Test of comparison of proportion between households with and without a Person with Disability. ** Signifi cant at p<0.01 * Signifi cant at p<0.05. (2) Test Chi 2 of Pearson of independence. ** Signifi cant at p<0.01 * Signifi cant at p<0.05.
Table 15. Distribution of Households according to Location of Drinking Water in Urban and Rural Areas
Location of Drinking Water Source† Urban Rural Total
Within the compound/houseNumber 3261 2723 5984
% in location category 56.5**(1) 15.5**(1) 25.7
Outside the compound/houseNumber 2514 14800 17314
% in location category 43.5 84.5 74.3
Total Number 5775 17523 23298**(2)
Source: NDSA. Note: † Weighted by the number of household in the cluster without Persons with Disabilities living there. (1)Test of comparison of proportion between households with and without a Person with Disability. ** Signifi cant at p<0.01 * Signifi cant at p<0.05. (2) Test Chi 2 of Pearson of independence. ** Signifi cant at p<0.01 * Signifi cant at p<0.05.
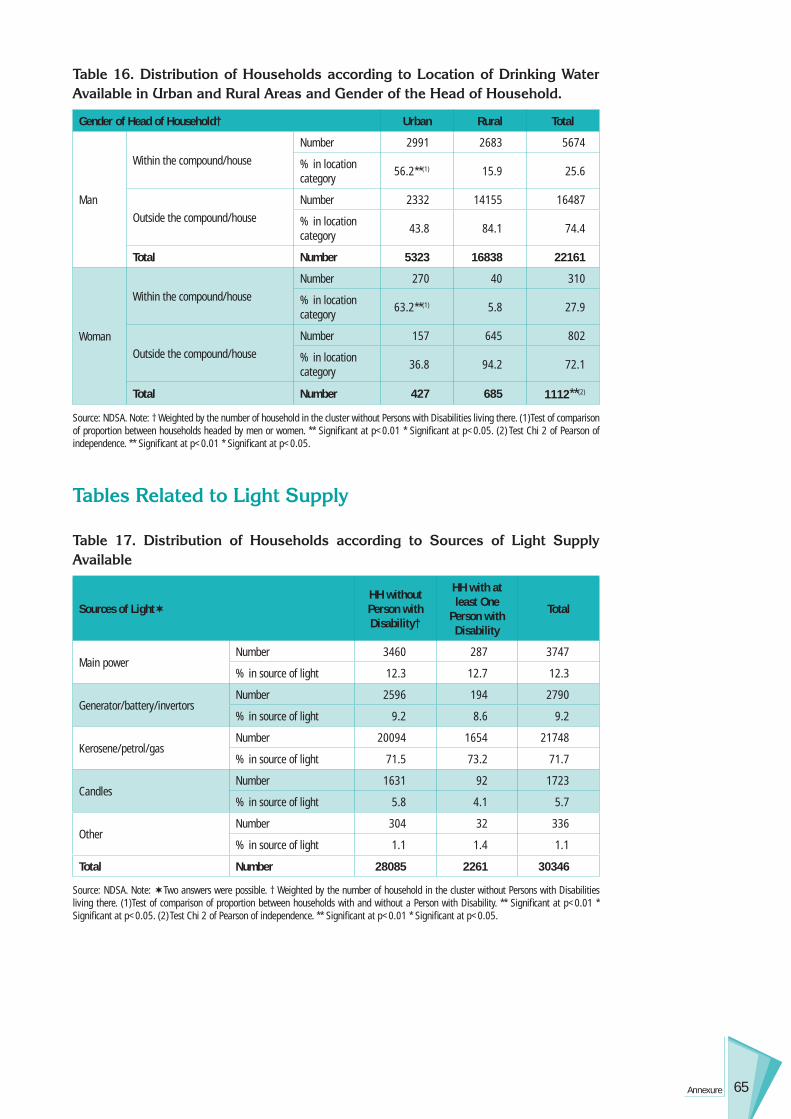
65Annexure
Table 16. Distribution of Households according to Location of Drinking Water Available in Urban and Rural Areas and Gender of the Head of Household.
Gender of Head of Household† Urban Rural Total
Man
Within the compound/houseNumber 2991 2683 5674
% in location category 56.2**(1) 15.9 25.6
Outside the compound/houseNumber 2332 14155 16487
% in location category 43.8 84.1 74.4
Total Number 5323 16838 22161
Woman
Within the compound/houseNumber 270 40 310
% in location category 63.2**(1) 5.8 27.9
Outside the compound/houseNumber 157 645 802
% in location category 36.8 94.2 72.1
Total Number 427 685 1112**(2)
Source: NDSA. Note: † Weighted by the number of household in the cluster without Persons with Disabilities living there. (1)Test of comparison of proportion between households headed by men or women. ** Signifi cant at p<0.01 * Signifi cant at p<0.05. (2) Test Chi 2 of Pearson of independence. ** Signifi cant at p<0.01 * Signifi cant at p<0.05.
Tables Related to Light Supply
Table 17. Distribution of Households according to Sources of Light Supply Available
Sources of Light�HH without Person with Disability†
HH with at least One
Person with Disability
Total
Main powerNumber 3460 287 3747
% in source of light 12.3 12.7 12.3
Generator/battery/invertorsNumber 2596 194 2790
% in source of light 9.2 8.6 9.2
Kerosene/petrol/gasNumber 20094 1654 21748
% in source of light 71.5 73.2 71.7
CandlesNumber 1631 92 1723
% in source of light 5.8 4.1 5.7
OtherNumber 304 32 336
% in source of light 1.1 1.4 1.1
Total Number 28085 2261 30346
Source: NDSA. Note: �Two answers were possible. † Weighted by the number of household in the cluster without Persons with Disabilities living there. (1)Test of comparison of proportion between households with and without a Person with Disability. ** Signifi cant at p<0.01 * Signifi cant at p<0.05. (2) Test Chi 2 of Pearson of independence. ** Signifi cant at p<0.01 * Signifi cant at p<0.05.

66 Understanding Vulnerability of Afghans with Disability
Table 18. Distribution of Households according to Sources of Light Supply Available in Urban and Rural Areas
Sources of Light Supply� Urban Rural Total
Main powerNumber 337 95 432
% in source of light 27.9**(1) 4.3**(1) 12.6
Generator/battery/invertorsNumber 165 140 305
% in source of light 13.7**(1) 6.3**(1) 8.9
Kerosene/petrol/gasNumber 669 1812 2481
% in source of light 55.4**(1) 81.8**(1) 72.5
CandlesNumber 15 141 156
% in source of light 1.2**(1) 6.4**(1) 4.6
OtherNumber 21 25 46
% in source of light 1.7 1.1 1.3
Total Number 1207 2215 3422**(2)
Source: NDSA. Note: �Two answers were possible. (1)Test of comparison of proportion between households with and without a Person with Disability. ** Signifi cant at p<0.01 * Signifi cant at p<0.05. (2) Test Chi 2 of Pearson of independence. ** Signifi cant at p<0.01 * Signifi cant at p<0.05.
Table 19. Distribution of Households According to Gender of the Head of the Household and Sources of Light Supply Available
Sources of Light Supply� Man Head of the HH
Woman Head of the HH Total
Main powerNumber 3419 303 3722
% in source of light 11.9**(1) 19.9**(1) 12.3
Generator/battery/invertorsNumber 2543 247 2790
% in source of light 8.8**(1) 16.3**(1) 9.2
Kerosene/petrol/gasNumber 20808 915 21723
% in source of light 72.3**(1) 60.2**(1) 71.7
CandlesNumber 1669 54 1723
% in source of light 5.8**(1) 3.6**(1) 5.7
OtherNumber 33 0 336
% in source of light 1.2**(1) 0.0**(1) 1.1
Total Number 28777 1519 30296**(2)
Source: NDSA. Note: �Two answers were possible. † Weighted by the number of household in the cluster without Persons with Disabilities living there. (1)Test of comparison of proportion between households with and without a Person with Disability. ** Signifi cant at p<0.01 * Signifi cant at p<0.05. (2) Test Chi 2 of Pearson of independence. ** Signifi cant at p<0.01 * Signifi cant at p<0.05.
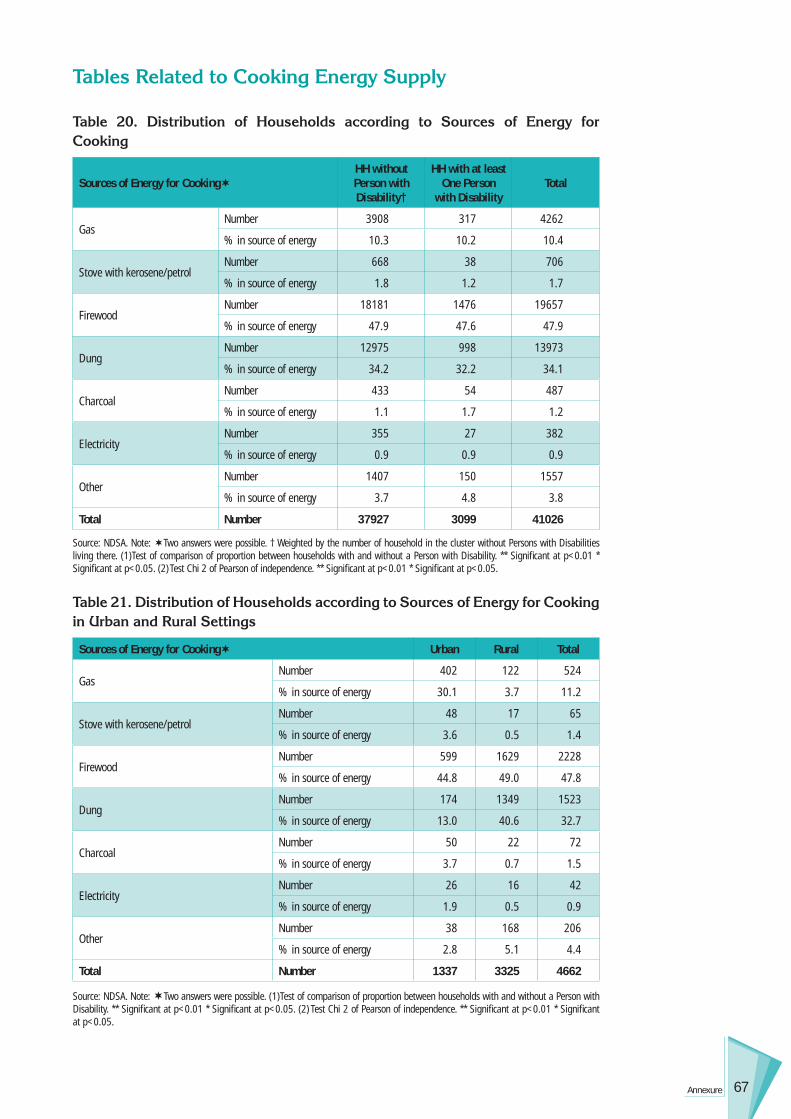
67Annexure
Tables Related to Cooking Energy Supply
Table 20. Distribution of Households according to Sources of Energy for Cooking
Sources of Energy for Cooking�HH without Person with Disability†
HH with at least One Person
with DisabilityTotal
GasNumber 3908 317 4262
% in source of energy 10.3 10.2 10.4
Stove with kerosene/petrolNumber 668 38 706
% in source of energy 1.8 1.2 1.7
FirewoodNumber 18181 1476 19657
% in source of energy 47.9 47.6 47.9
DungNumber 12975 998 13973
% in source of energy 34.2 32.2 34.1
CharcoalNumber 433 54 487
% in source of energy 1.1 1.7 1.2
ElectricityNumber 355 27 382
% in source of energy 0.9 0.9 0.9
OtherNumber 1407 150 1557
% in source of energy 3.7 4.8 3.8
Total Number 37927 3099 41026
Source: NDSA. Note: �Two answers were possible. † Weighted by the number of household in the cluster without Persons with Disabilities living there. (1)Test of comparison of proportion between households with and without a Person with Disability. ** Signifi cant at p<0.01 * Signifi cant at p<0.05. (2) Test Chi 2 of Pearson of independence. ** Signifi cant at p<0.01 * Signifi cant at p<0.05.
Table 21. Distribution of Households according to Sources of Energy for Cooking in Urban and Rural Settings
Sources of Energy for Cooking� Urban Rural Total
GasNumber 402 122 524
% in source of energy 30.1 3.7 11.2
Stove with kerosene/petrolNumber 48 17 65
% in source of energy 3.6 0.5 1.4
FirewoodNumber 599 1629 2228
% in source of energy 44.8 49.0 47.8
DungNumber 174 1349 1523
% in source of energy 13.0 40.6 32.7
CharcoalNumber 50 22 72
% in source of energy 3.7 0.7 1.5
ElectricityNumber 26 16 42
% in source of energy 1.9 0.5 0.9
OtherNumber 38 168 206
% in source of energy 2.8 5.1 4.4
Total Number 1337 3325 4662
Source: NDSA. Note: �Two answers were possible. (1)Test of comparison of proportion between households with and without a Person with Disability. ** Signifi cant at p<0.01 * Signifi cant at p<0.05. (2) Test Chi 2 of Pearson of independence. ** Signifi cant at p<0.01 * Signifi cant at p<0.05.

68 Understanding Vulnerability of Afghans with Disability
Tables Related to Toilet Facilities
Table 22. Distribution of Households according to Access to Types of Toilet Facilities
Kind of Toilet FacilityHH without Person with Disability†
HH with at least One Person with
DisabilityTotal
Private fl ush insideNumber 658 96 754% in type of toilet facility 3.1**(1) 5.3**(1) 3.2
Private fl ush outsideNumber 300 18 318% in type of toilet facility 1.4 1.0 1.4
Shared fl ushNumber 292 34 326% in type of toilet facility 1.4 1.9 1.4
Traditional pitNumber 3704 170 3874% in type of toilet facility 17.3**(1) 9.4**(1) 16.6
Open backedNumber 10103 1006 11109% in type of toilet facility 47.1**(1) 55.8**(1) 47.7
Open defecation fi eld outside the house
Number 6368 473 6841% in type of toilet facility 29.7**(1) 26.2**(1) 29.4
OtherNumber 43 5 48% in type of toilet facility 0.2 0.3 0.2
Total Number 21468 1802 23270**(2)
Source: NDSA. Note: † Weighted by the number of household in the cluster without Persons with Disabilities living there. (1)Test of comparison of proportion between households with and without a Person with Disability. ** Signifi cant at p<0.01 * Signifi cant at p<0.05. (2) Test Chi 2 of Pearson of independence. ** Signifi cant at p<0.01 * Signifi cant at p<0.05.
Table 23. Distribution of Households according to Access to Types of Toilet Facilities in Urban and Rural Settings
Kind of Toilet Facility Urban Rural Total
Private fl ush insideNon-disabled
Number 431 227 658
% in type of toilet facility 8.2**(1) 1.4**(1) 3.1
Persons with disabilityNumber 50 46 96% in type of toilet facility 9.1**(1) 3.7**(1) 5.3
Private fl ush outsideNon-disabled
Number 201 99 300% in type of toilet facility 3.8 0.6 1.4
Persons with disabilityNumber 8 10 18% in type of toilet facility 1.5 0.8 1.0
Shared fl ushNon-disabled
Number 92 200 292% in type of toilet facility 1.8 1.2 1.4
Persons with disabilityNumber 8 26 34% in type of toilet facility 1.5 2.0 1.9
Traditional pitNon-disabled
Number 1194 2510 3704% in type of toilet facility 22.8**(1) 15.5**(1) 17.2
Persons with disabilityNumber 63 107 170% in type of toilet facility 11.5**(1) 8.5**(1) 9.5
Open backedNon-disabled
Number 2915 7188 10103% in type of toilet facility 55.8**(1) 44.2**(1) 47.1
Persons with disabilityNumber 394 612 1006% in type of toilet facility 71.9**(1) 48.8**(1) 55.8
Open defecation fi eld outside the house
Non-disabledNumber 394 5974 6368% in type of toilet facility 7.5**(1) 36.8**(1) 29.7
Persons with disabilityNumber 25 448 473% in type of toilet facility 4.6**(1) 35.7**(1) 26.2
Source: NDSA. Note: (1)Test of comparison of proportion between households with and without a Person with Disability. ** Signifi cant at p<0.01 * Signifi cant at p<0.05. (2) Test Chi 2 of Pearson of independence. ** Signifi cant at p<0.01 * Signifi cant at p<0.05.
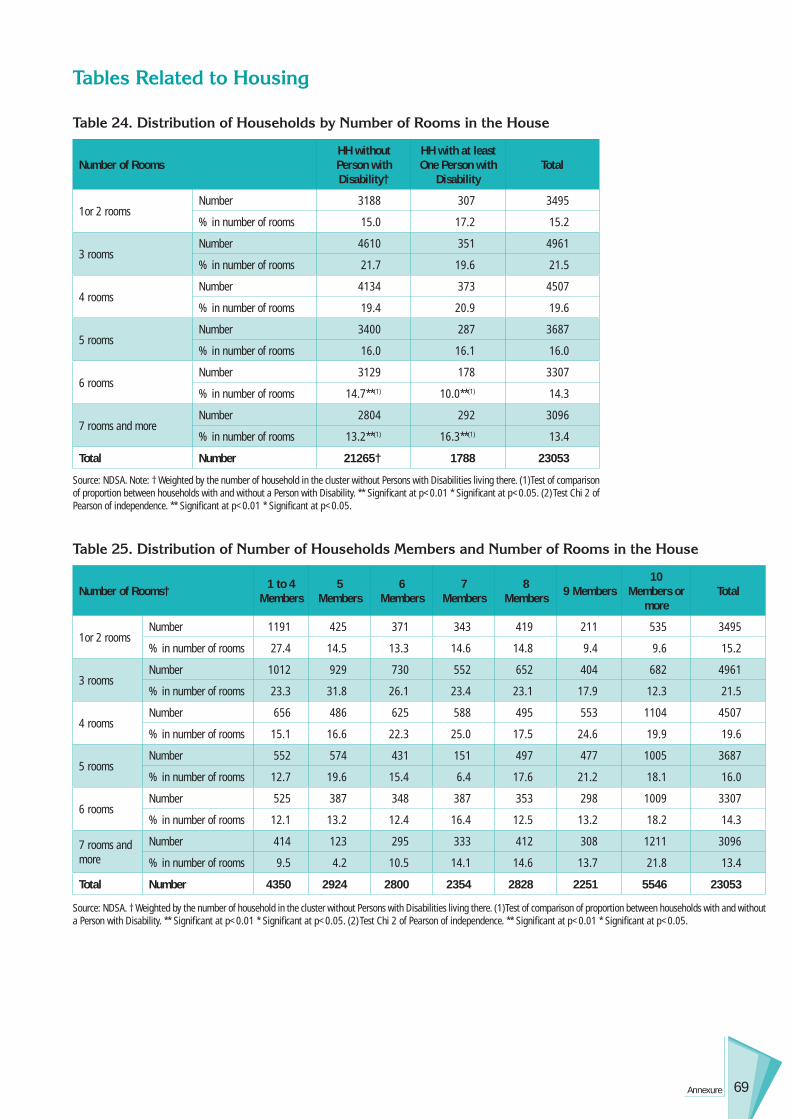
69Annexure
Tables Related to Housing
Table 24. Distribution of Households by Number of Rooms in the House
Number of RoomsHH without Person with Disability†
HH with at least One Person with
DisabilityTotal
1or 2 roomsNumber 3188 307 3495
% in number of rooms 15.0 17.2 15.2
3 roomsNumber 4610 351 4961
% in number of rooms 21.7 19.6 21.5
4 roomsNumber 4134 373 4507
% in number of rooms 19.4 20.9 19.6
5 roomsNumber 3400 287 3687
% in number of rooms 16.0 16.1 16.0
6 roomsNumber 3129 178 3307
% in number of rooms 14.7**(1) 10.0**(1) 14.3
7 rooms and moreNumber 2804 292 3096
% in number of rooms 13.2**(1) 16.3**(1) 13.4
Total Number 21265† 1788 23053
Source: NDSA. Note: † Weighted by the number of household in the cluster without Persons with Disabilities living there. (1)Test of comparison of proportion between households with and without a Person with Disability. ** Signifi cant at p<0.01 * Signifi cant at p<0.05. (2) Test Chi 2 of Pearson of independence. ** Signifi cant at p<0.01 * Signifi cant at p<0.05.
Table 25. Distribution of Number of Households Members and Number of Rooms in the House
Number of Rooms† 1 to 4 Members
5 Members
6 Members
7 Members
8 Members 9 Members
10 Members or
moreTotal
1or 2 roomsNumber 1191 425 371 343 419 211 535 3495
% in number of rooms 27.4 14.5 13.3 14.6 14.8 9.4 9.6 15.2
3 roomsNumber 1012 929 730 552 652 404 682 4961
% in number of rooms 23.3 31.8 26.1 23.4 23.1 17.9 12.3 21.5
4 roomsNumber 656 486 625 588 495 553 1104 4507
% in number of rooms 15.1 16.6 22.3 25.0 17.5 24.6 19.9 19.6
5 roomsNumber 552 574 431 151 497 477 1005 3687
% in number of rooms 12.7 19.6 15.4 6.4 17.6 21.2 18.1 16.0
6 roomsNumber 525 387 348 387 353 298 1009 3307
% in number of rooms 12.1 13.2 12.4 16.4 12.5 13.2 18.2 14.3
7 rooms and more
Number 414 123 295 333 412 308 1211 3096
% in number of rooms 9.5 4.2 10.5 14.1 14.6 13.7 21.8 13.4
Total Number 4350 2924 2800 2354 2828 2251 5546 23053
Source: NDSA. † Weighted by the number of household in the cluster without Persons with Disabilities living there. (1)Test of comparison of proportion between households with and without a Person with Disability. ** Signifi cant at p<0.01 * Signifi cant at p<0.05. (2) Test Chi 2 of Pearson of independence. ** Signifi cant at p<0.01 * Signifi cant at p<0.05.

70 Understanding Vulnerability of Afghans with Disability
Table 26. Distribution of People according to Number of Rooms in the House by Urban and Rural Settings
Number of Rooms† Urban Rural Total
1or 2 roomsNumber 458 3037 3495
% in number of rooms 8.0**(1) 17.6**(1) 15.2
3 roomsNumber 875 4086 4961
% in number of rooms 15.2**(1) 23.6**(1) 21.5
4 roomsNumber 921 3586 4507
% in number of rooms 16.0**(1) 20.7**(1) 19.6
5 roomsNumber 1074 2613 3687
% in number of rooms 18.7**(1) 15.1**(1) 16.0
6 roomsNumber 1042 2265 3307
% in number of rooms 18.1**(1) 13.1**(1) 14.3
7 rooms and moreNumber 1381 1715 3096
% in number of rooms 24.0**(1) 9.9**(1) 13.4
Total Number 5751 17302 23053**(2)
Source: NDSA. Note: † Weighted by the number of household in the cluster without Persons with Disabilities living there. (1)Test of comparison of proportion between households with and without a Person with Disability. ** Signifi cant at p<0.01 * Signifi cant at p<0.05. (2) Test Chi 2 of Pearson of independence. ** Signifi cant at p<0.01 * Signifi cant at p<0.05.
Table 27. Distribution of Households according to Gender of the Head of the Household by Number of Rooms in the House
Number of Rooms† Man Head HH Woman Head HH Total
1or 2 roomsNumber 3253 242 3495
% in number of rooms 14.8**(1) 22.4**(1) 15.2
3 roomsNumber 4720 241 4961
% in number of rooms 21.5 22.3 21.5
4 roomsNumber 4468 39 4507
% in number of rooms 20.4**(1) 3.6**(1) 19.6
5 roomsNumber 3462 200 3662
% in number of rooms 15.8**(1) 18.5**(1) 15.9
6 roomsNumber 3087 220 3307
% in number of rooms 14.1**(1) 20.4**(1) 14.4
7 rooms and moreNumber 2957 139 3096
% in number of rooms 13.5 12.9 13.4
Total Number 21947 1081 23028**(2)
Source: NDSA. Note: † Weighted by the number of household in the cluster without Persons with Disabilities living there. (1)Test of comparison of proportion between households with and without a Person with Disability. ** Signifi cant at p<0.01 * Signifi cant at p<0.05. (2) Test Chi 2 of Pearson of independence. ** Signifi cant at p<0.01 * Signifi cant at p<0.05.
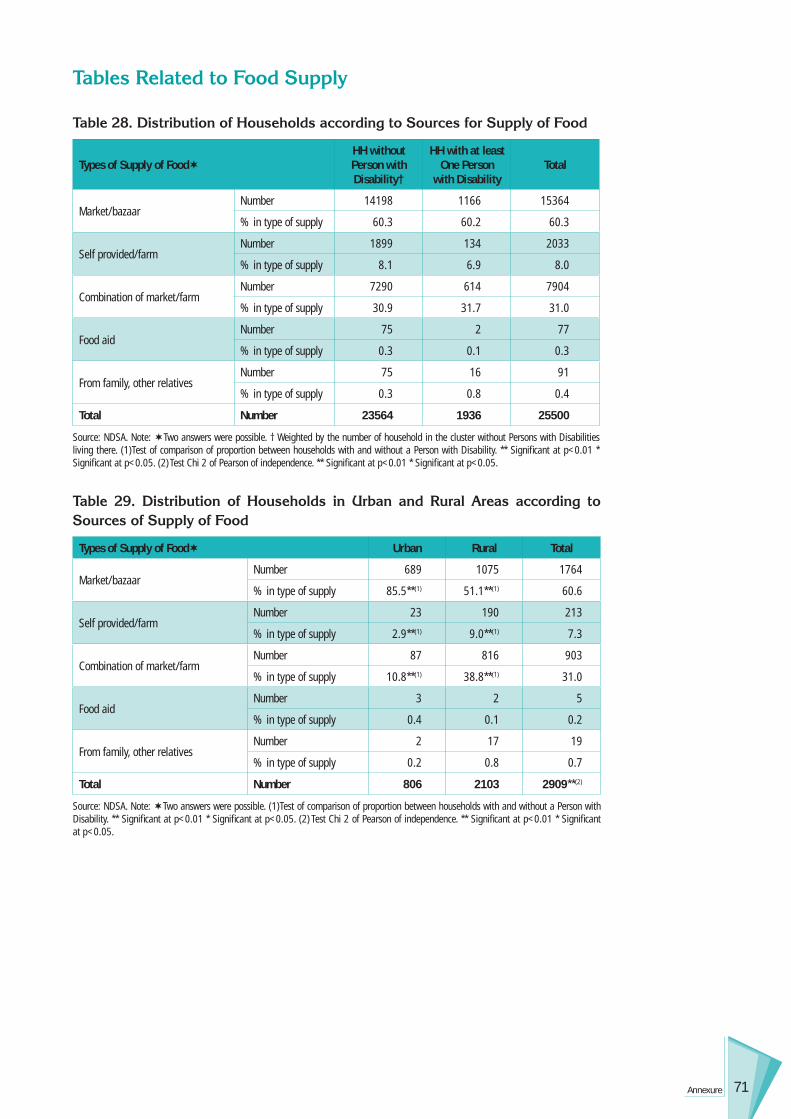
71Annexure
Tables Related to Food Supply
Table 28. Distribution of Households according to Sources for Supply of Food
Types of Supply of Food�HH without Person with Disability†
HH with at least One Person
with DisabilityTotal
Market/bazaarNumber 14198 1166 15364
% in type of supply 60.3 60.2 60.3
Self provided/farmNumber 1899 134 2033
% in type of supply 8.1 6.9 8.0
Combination of market/farmNumber 7290 614 7904
% in type of supply 30.9 31.7 31.0
Food aidNumber 75 2 77
% in type of supply 0.3 0.1 0.3
From family, other relativesNumber 75 16 91
% in type of supply 0.3 0.8 0.4
Total Number 23564 1936 25500
Source: NDSA. Note: �Two answers were possible. † Weighted by the number of household in the cluster without Persons with Disabilities living there. (1)Test of comparison of proportion between households with and without a Person with Disability. ** Signifi cant at p<0.01 * Signifi cant at p<0.05. (2) Test Chi 2 of Pearson of independence. ** Signifi cant at p<0.01 * Signifi cant at p<0.05.
Table 29. Distribution of Households in Urban and Rural Areas according to Sources of Supply of Food
Types of Supply of Food� Urban Rural Total
Market/bazaarNumber 689 1075 1764
% in type of supply 85.5**(1) 51.1**(1) 60.6
Self provided/farmNumber 23 190 213
% in type of supply 2.9**(1) 9.0**(1) 7.3
Combination of market/farmNumber 87 816 903
% in type of supply 10.8**(1) 38.8**(1) 31.0
Food aidNumber 3 2 5
% in type of supply 0.4 0.1 0.2
From family, other relativesNumber 2 17 19
% in type of supply 0.2 0.8 0.7
Total Number 806 2103 2909**(2)
Source: NDSA. Note: �Two answers were possible. (1)Test of comparison of proportion between households with and without a Person with Disability. ** Signifi cant at p<0.01 * Signifi cant at p<0.05. (2) Test Chi 2 of Pearson of independence. ** Signifi cant at p<0.01 * Signifi cant at p<0.05.

72 Understanding Vulnerability of Afghans with Disability
Table 30. Distribution of Households according to Sufficiency of Food
Food Suffi ciency†HH without Person with Disability†
HH with a Persons with
DisabilityTotal
Always enoughNumber 3498 227 3725
% in quantity of food 16.4**(1) 12.6**(1) 16.1
Sometimes not enoughNumber 3522 291 3813
% in quantity of food 16.5 16.2 16.4
Frequently not enoughNumber 4267 350 4617
% in quantity of food 20.0 19.5 19.9
Always not enoughNumber 3425 294 3719
% in quantity of food 16.0 16.3 16.0
Always enough but with poor qualityNumber 6671 636 7307
% in quantity of food 31.2**(1) 35.4**(1) 31.5
Total Number 21383 1799 23182**(2)
Source: NDSA. Note: † Weighted by the number of household in the cluster without Persons with Disabilities living there. (1)Test of comparison of proportion between households with and without a Person with Disability. ** Signifi cant at p<0.01 * Signifi cant at p<0.05. (2) Test Chi 2 of Pearson of independence. ** Signifi cant at p<0.01 * Signifi cant at p<0.05.
Table 31. Distribution of Households in Urban or Rural Settings according to Sufficiency of Food
Food Suffi ciency† Urban Rural Total
Always enoughNumber 1551 2174 3725
% in quantity of food 27.0**(1) 12.4**(1) 16.0
Sometimes not enoughNumber 1028 2785 3813
% in quantity of food 17.9**(1) 15.9**(1) 16.4
Frequently not enoughNumber 704 3914 4618
% in quantity of food 12.2**(1) 22.4**(1) 19.9
Always not enoughNumber 666 3083 3749
% in quantity of food 11.6**(1) 17.7**(1) 16.1
Always enough but with poor qualityNumber 1800 5508 7308
% in quantity of food 31.3 31.5 31.5
Total Number 5749 17464 23213**(2)
Source: NDSA. Note: † Weighted by the number of household in the cluster without Persons with Disabilities living there. (1)Test of comparison of proportion between urban and rural households. ** Signifi cant at p<0.01 * Signifi cant at p<0.05. (2) Test Chi 2 of Pearson of independence. ** Signifi cant at p<0.01 * Signifi cant at p<0.05.
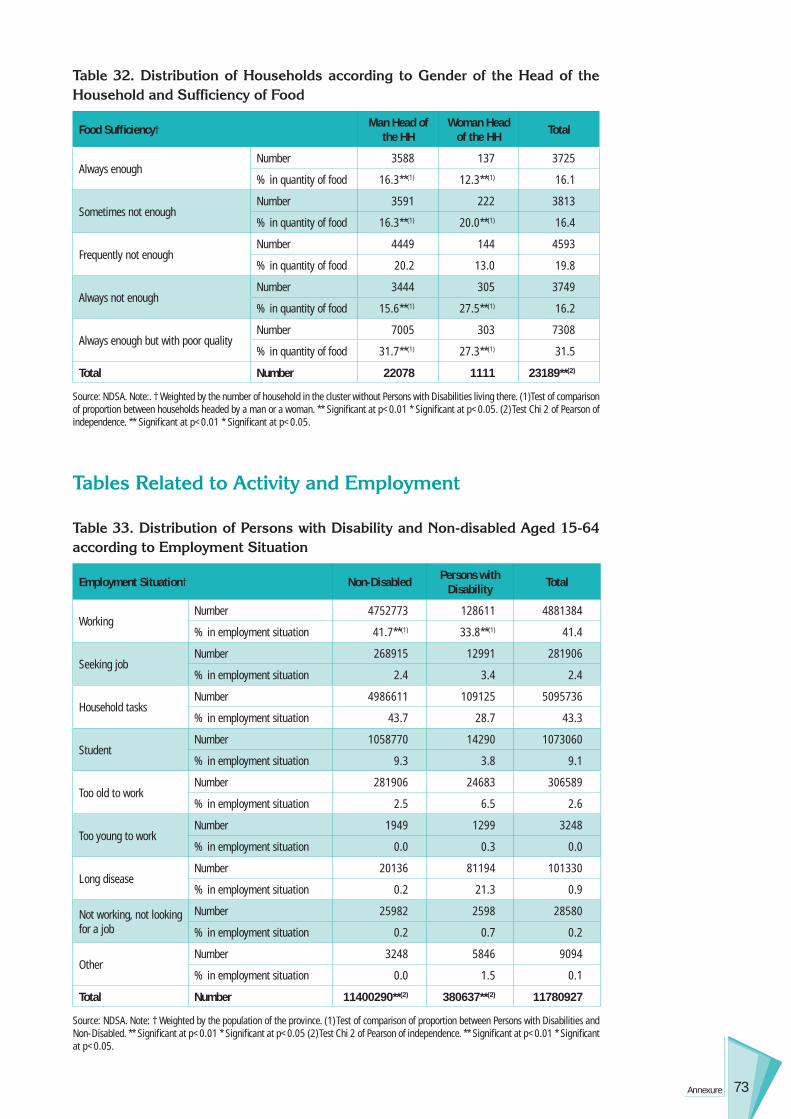
73Annexure
Table 32. Distribution of Households according to Gender of the Head of the Household and Sufficiency of Food
Food Suffi ciency†Man Head of
the HHWoman Head
of the HH Total
Always enoughNumber 3588 137 3725
% in quantity of food 16.3**(1) 12.3**(1) 16.1
Sometimes not enoughNumber 3591 222 3813
% in quantity of food 16.3**(1) 20.0**(1) 16.4
Frequently not enoughNumber 4449 144 4593
% in quantity of food 20.2 13.0 19.8
Always not enoughNumber 3444 305 3749
% in quantity of food 15.6**(1) 27.5**(1) 16.2
Always enough but with poor qualityNumber 7005 303 7308
% in quantity of food 31.7**(1) 27.3**(1) 31.5
Total Number 22078 1111 23189**(2)
Source: NDSA. Note:. † Weighted by the number of household in the cluster without Persons with Disabilities living there. (1)Test of comparison of proportion between households headed by a man or a woman. ** Signifi cant at p<0.01 * Signifi cant at p<0.05. (2) Test Chi 2 of Pearson of independence. ** Signifi cant at p<0.01 * Signifi cant at p<0.05.
Tables Related to Activity and Employment
Table 33. Distribution of Persons with Disability and Non-disabled Aged 15-64 according to Employment Situation
Employment Situation† Non-Disabled Persons with Disability Total
WorkingNumber 4752773 128611 4881384
% in employment situation 41.7**(1) 33.8**(1) 41.4
Seeking jobNumber 268915 12991 281906
% in employment situation 2.4 3.4 2.4
Household tasksNumber 4986611 109125 5095736
% in employment situation 43.7 28.7 43.3
StudentNumber 1058770 14290 1073060
% in employment situation 9.3 3.8 9.1
Too old to workNumber 281906 24683 306589
% in employment situation 2.5 6.5 2.6
Too young to workNumber 1949 1299 3248
% in employment situation 0.0 0.3 0.0
Long diseaseNumber 20136 81194 101330
% in employment situation 0.2 21.3 0.9
Not working, not looking for a job
Number 25982 2598 28580
% in employment situation 0.2 0.7 0.2
OtherNumber 3248 5846 9094
% in employment situation 0.0 1.5 0.1
Total Number 11400290**(2) 380637**(2) 11780927
Source: NDSA. Note: † Weighted by the population of the province. (1) Test of comparison of proportion between Persons with Disabilities and Non-Disabled. ** Signifi cant at p<0.01 * Signifi cant at p<0.05 (2) Test Chi 2 of Pearson of independence. ** Signifi cant at p<0.01 * Signifi cant at p<0.05.
74 Understanding Vulnerability of Afghans with Disability
Table 34. Distribution of Households according to the Ratio of Employed Members
Share of Members in the HH Who Work † HH without Person with Disability
HH with a Person with Disability Total
No oneNumber 868451 288401 1156852
% in ratio category 4.4 5.8 4.6
Less than 25%Number 11736107 3132790 14868897
% in ratio category 59.0**(1) 62.6**(1) 59.7
25 to 50%Number 6196077 1355615 7551692
% in ratio category 31.2**(1) 27.1**(1) 30.3
50% to 75%Number 993165 221497 1214662
% in ratio category 5.0 4.4 4.9
More than 75%Number 92236 6496 98732
% in ratio category 0.5 0.1 0.4
Total Number 19886036**(2) 5004799**(2) 24890835
Source: NDSA. Note: † Weighted by the population of the province. (1) Test of comparison of proportion between Persons with Disabilities and Non-Disabled. ** Signifi cant at p<0.01 * Signifi cant at p<0.05 (2) Test Chi 2 of Pearson of independence. ** Signifi cant at p<0.01 * Signifi cant at p<0.05.
Table 35. Distribution of Persons with Disability and Non-Disabled Aged 15-64 according to the Employment Situation and Gender
Gender Employment Situation† Non-DisabledPersons
with Disability
Total
Males
WorkingNumber 4360443 123415 4483858
% in Employment situation 77.6**(1) 54.6**(1) 76.7
Not workingNumber 1201022 99381 1300403
% in Employment situation 21.4**(1) 44.0**(1) 22.2
Household tasks
Number 59759 3248 63007
% in Employment situation 1.1 1.4 1.1
Total Number 5621224**(2) 226044**(2) 5847268
Females
WorkingNumber 390381 5196 395577
% in Employment situation 6.8**(1) 3.4**(1) 6.7
Not workingNumber 463780 43520 507300
% in Employment situation 8.0**(1) 28.2**(1) 8.5
Household tasks
Number 4926852 105877 5032729
% in Employment situation 85.2**(1) 68.5**(1) 84.8
Total Number 5781663**(2) 154593**(2) 5936256
Source: NDSA. Note: † Weighted by the population of the province. (1) Test of comparison of proportion between Persons with Disabilities and Non-Disabled. ** Signifi cant at p<0.01 * Signifi cant at p<0.05 (2) Test Chi 2 of Pearson of independence. ** Signifi cant at p<0.01 * Signifi cant at p<0.05.

75Annexure
Table 36. Distribution of Persons with Disability and Non-Disabled Between 14 and 65 according to the Employment Situation and Gender (analysis on series of questions)
Gender Employment Situation† Non-disabled Persons with disability Total
Males
WorkingNumber 5055204 125364 5180568
% in Employment situation 82.6**(1) 57.6**(1) 81.7
Not WorkingNumber 1064356 92236 1156592
% in Employment situation 17.4 42.4 18.3
Total Number 6119560**(2) 217600**(2) 6337160
Females
WorkingNumber 598887 14290 613177
% in Employment situation 13.2 9.5 13.1
Not WorkingNumber 3948627 135756 4084383
% in Employment situation 86.8 90.5 86.9
Total Number 4547514*(2) 150046*(2) 4697560
Source: NDSA. Note: † Weighted by the population of the province. (1) Test of comparison of proportion between Persons with Disabilities and Non-Disabled. ** Signifi cant at p<0.01 * Signifi cant at p<0.05 (2) Test Chi 2 of Pearson of independence. ** Signifi cant at p<0.01 * Signifi cant at p<0.05.
Table 37. Distribution of People Above 14 according to the Employment Situation Gender and the Situation in the Household
Gender Employment Situation† Head of the
HHNot Head of
the HH Total
Males
WorkingNumber 2808014 1829788 4637802
% in employment situation 87.6**(1) 59.7**(1) 74.0
Not WorkingNumber 386483 1180886 1567369
% in employment situation 12.1**(1) 38.5**(1) 25.0
Household TasksNumber 10393 54562 64955
% in employment situation 0.3 1.8 1.0
Total Number 3204890**(2) 3065236**(2) 6270126
Females
WorkingNumber 35725 362450 398175
% in employment situation 30.6**(1) 6.0**(1) 6.4
Not WorkingNumber 17538 695021 712559
% in employment situation 15.0 11.4 11.5
Household TasksNumber 63656 5030131 5093787
% in employment situation 54.4**(1) 82.6**(1) 82.1
Total Number 116919**(2) 6087602**(2) 6204521
Source: NDSA. Note: † Weighted by the population of the province. (1) Test of comparison of proportion between Head of HH and not Head of HH. ** Signifi cant at p<0.01 * Signifi cant at p<0.05 (2) Test Chi 2 of Pearson of independence. ** Signifi cant at p<0.01 * Signifi cant at p<0.05.
76 Understanding Vulnerability of Afghans with Disability
Table 38. Distribution of People according to Profession
Code Profession† Number %
Animal husbandry, shepherd, animal keeper 203309 3.8
Architect/mohandes 14290 0.3
Artist/singer/danser/writer/painter/rangmal 8444 0.2
Baker/nalwa 16238 0.3
Banker 4546 0.1
Bookshop 1948 0.0
Butcher/kassab 12991 0.2
Carpenter 31178 0.6
Carpet weaver, rag weaver 285802 5.3
Car salesman 12991 0.2
Cashier/ sharaf/ munshi/ clerk/ accountant 7794 0.1
Chemist 5846 0.1
Cleaner 388432 7.3
Computer specialist/motakhasis computer 4546 0.1
Cook 12341 0.2
Doctor 25982 0.5
Driver/pilot 215651 4.0
Editor(newspaper, books) 3247 0.1
Electrician/barki 3897 0.1
Farmer 2126633 39.7
Shopkeeper/dehkandar 347510 6.5
Fortune tailor, palm reader(Kafbin) 1299 0.0
Fruit and vegetables salesman 31828 0.6
Gelkar/building worker 513146 9.6
Guard/tchukidor 34426 0.6
Hairdresser/barber/salmon 8444 0.2
Hotelshi 10392 0.2
Ingenior 13640 0.3
Iron worker meldar/ahiingar 12341 0.2
Jeweler/zargar 2598 0.0
Journalist 649 0.0
Judge 649 0.0
Khatat/painter of banners 1299 0.0
Lawyer 3247 0.1
Lender of money/sutrur 649 0.0
Mechanic/mestari 98082 1.8
Megaran/work with driver, make people pay bus 3897 0.1
Mullah, religious leader 51314 1.0
Nurse 17537 0.3
Other service provider 8444 0.2
Plumber/naldawa 2598 0.0
Policeman 58459 1.1
Professor at the university 3247 0.1
Public employee/military offi cer 157191 2.9
Public announcer(jar zan) 1299 0.0
Real estate agent /rahnamaia mamalat 3247 0.1
Repairer/khabarnagar 1948 0.0
Shoemaker/muchi 9743 0.2
(Table 38 contd. on next page)

77Annexure
Code Profession† Number %
Businessman 34426 0.6
Soldier/mudjahidin 38973 0.7
Stone mason 3247 0.1
Street vendor (newspaper, shoe cleaner, etc.) 44169 0.8
Tailor/khayat, fl ower sewer/hat maker 108475 2.0
Tchofrosh/wood-cutter 16238 0.3
Teacher 170182 3.2
Translator 4546 0.1
Waiter/garsun 5846 0.1
Macon/steel maker 21435 0.4
Repair man for electronics 7794 0.1
De-miner 2598 0.0
Owner of industry 1299 0.0
Renter of houses and other services and goods 4546 0.1
Coolie/porter 31828 0.6
Little jobs not mentioned elsewhere 54562 1.0
Veterinarian 2598 0.0
Surveyor 4546 0.1
Other 649 0.0
Total 5343215 99.9
Source: NDSA. † Weighted by the population of the province.
(Table 38 contd. from previous page)
Table 39. Distribution of Persons with Disability and Non-Disabled Above 14 according to the Activity Status
Status of Activity† Non-Disabled Persons with Disability Total
Landowner/mortgagerNumber 1760286 38324 1798610
% in status 35.9*(1) 28.9*(1) 35.7
Daily/weekly wage workerNumber 982123 27281 1009404
% in status 20.0 20.6 20.0
Contract workerNumber 761275 22085 783360
% in status 15.5 16.7 15.6
Occasional workerNumber 133808 8444 142252
% in status 2.7**(1) 6.4**(1) 2.8
ApprenticeNumber 63007 650 63657
% in status 1.3 0.5 1.3
Family helperNumber 285153 5196 290349
% in status 5.8 3.9 5.8
Self employedNumber 908723 27931 936654
% in status 18.5 21.1 18.6
EmployerNumber 5196 0 5196
% in status 0.1 0.0 0.1
Other statusNumber 3897 2598 6495
% in status 0.1 2.0 0.1
Total Number 4903468 132509 5035977
Source: NDSA. Note: † Weighted by the population of the province. (1) Test of comparison of proportion between Person with Disability and Non-Disabled. ** Signifi cant at p<0.01 * Signifi cant at p<0.05 (2) Test Chi 2 of Pearson of independence. ** Signifi cant at p<0.01 * Signifi cant at p<0.05.

78 Understanding Vulnerability of Afghans with Disability
Table 40. Distribution of Persons with Disability and Non-Disabled Above 14 according to the Farmer Status
Status of Farmers † Non-Disabled Persons with Disability Total
Landlord/khanNumber 187201 1949 189150
% in status 5.7 2.7 5.6
Landowner/malik/zamindar/mulkdarNumber 551859 12341 564200
% in status 16.8 17.0 16.8
Farmer/sharecropper/mortgagerNumber 1562043 27281 1589324
% in status 47.5 37.5 47.3
Tenant/khistmandNumber 192138 6496 198634
% in status 5.8 8.9 5.9
Labourer/worker/kargarNumber 733344 20786 754130
% in status 22.3 28.6 22.5
Family helperNumber 59759 3897 63656
% in status 1.8 5.4 1.9
Total Number 3286344 72750 3359094
Source: NDSA. Note: † Weighted by the population of the province. (1) Test of comparison of proportion between Person with Disability and Non-Disabled. ** Signifi cant at p<0.01 * Signifi cant at p<0.05 (2) Test Chi 2 of Pearson of independence. ** Signifi cant at p<0.01 * Signifi cant at p<0.05.
Table 41. Distribution of Persons with Disability and Non-Disabled Age 15-64 according to Difficulties Faced in the Workplace
Diffi culties Faced in the Workplace† Non-Disabled Person with Disability
Diffi cult to reach my work placeNumber 594080 31828
% in diffi culty category 11.0 24.7
Work painful/ dangerousNumber 1277019 48067
% in diffi culty category 23.7 37.4
Problem with co-workers/ employerNumber 1949 3248
% in diffi culty category 0.0 2.5
Wage problemNumber 403502 18837
% in diffi culty category 7.5 14.6
CorruptionNumber 36764 2598
% in diffi culty category 0.7 2.0
Bad weatherNumber 228902 4547
% in diffi culty category 4.3 3.5
Other/don’t knowNumber 306069 13640
% in diffi culty category 5.7 10.6
No diffi cultyNumber 3210996 33777
% in diffi culty category 59.6 26.3
Source: NDSA. Note: † Weighted by the population of the province. 2 possible answers.

79Annexure
Table 42. Distribution of Children with Disability and Non-Disabled Children Aged 7 to 15 according to Activity and Gender
Type of Activity Gender† Non-Disabled Children with Disability Total
Household tasksMale
Number 5361403 39623 5401026% in activity type 75.2**(1) 42.4**(1) 74.8
FemaleNumber 5088461 40922 5129383% in activity type 91.5**(1) 61.2**(1) 91.2
FieldworkMale
Number 1757168 13641 1770809% in activity type 24.7**(1) 14.6**(1) 24.5
FemaleNumber 423248 1299 424547% in activity type 7.6**(1) 1.9**(1) 7.5
Other workMale
Number 470406 7145 477551% in activity type 6.6 7.6 6.6
FemaleNumber 119647 0 119647% in activity type 2.2 0.0 2.1
Source: NDSA. Note: † Weighted by the population of the province. (1)Test of comparison of proportion between Non-Disabled and Person with Disability. ** Signifi cant at p<0.01 * Signifi cant at p<0.05. (2) Test Chi 2 of Pearson of independence. ** Signifi cant at p<0.01 * Signifi cant at p<0.05.
Table 43. Distribution of Children with Disability and Non-Disabled Children Aged 7 to 15 according to Time Spent in Household Tasks and Gender
Gender Number of Hours in HH Tasks † Non-Disabled Persons with Disability Total
Males
1 hourNumber 1112293 12341 1124634
% in number of hour 20.4 31.1 20.4
2 hoursNumber 2124425 14940 2139365
% in number of hour 38.9 37.7 38.9
3 hoursNumber 1064876 11042 1075918
% in number of hour 19.5 27.9 19.6
4 hoursNumber 704114 0 704114
% in number of hour 12.9 0.0 12.8
5 hoursNumber 341145 0 341145
% in number of hour 6.2 0.0 6.2
6 hours and moreNumber 113672 1299 114971
% in number of hour 2.1 3.3 2.1
Total Number 5460525**(2) 39622**(2) 5500147
Females
1 hourNumber 549911 9094 559005
% in number of hour 10.3 21.5 10.3
2 hoursNumber 1575034 11692 1586726
% in number of hour 29.4 27.7 29.4
3 hoursNumber 1406020 10393 1416413
% in number of hour 26.2 24.6 26.2
4 hoursNumber 720873 5846 726719
% in number of hour 13.4 13.8 13.4
5 hoursNumber 546663 1949 548612
% in number of hour 10.2 4.6 10.1
6 hours and moreNumber 565370 3248 568618
% in number of hour 10.5 7.7 10.5
Total Number 5363871 42222 5406093
Source: NDSA. Note: † Weighted by the population of the province. (1) Test of comparison of proportion between Persons with Disabilities and Non-Disabled. ** Signifi cant at p<0.01 * Signifi cant at p<0.05 (2) Test Chi 2 of Pearson of independence. ** Signifi cant at p<0.01 * Signifi cant at p<0.05.
80 Understanding Vulnerability of Afghans with Disability
Table 44. Distribution of Children with Disability and Non-Disabled Children Aged 7 to 15 according to Types of Household Tasks and Gender
Gender Types of Tasks† Non-Disabled�
Persons with Disability Total
Boys
CookingNumber 71061 0 71061
% in task type 1.3 0.0 1.3
CleaningNumber 1275591 5197 1280788
% in task type 23.8 13.1 23.7
Fetching water/fi ll tankerNumber 4750044 30530 4780574
% in task type 88.6 77.1 88.5
Taking care of other member of familyNumber 1228953 8444 1237397
% in task type 22.9 21.3 22.9
LaundryNumber 108864 1299 110163
% in task type 2.0 3.3 2.0
Doing the grocery shoppingNumber 3835735 22085 3857820
% in task type 71.5 55.7 71.4
OtherNumber 505871 5197 511068
% in task type 9.4 13.1 9.5
Total Number 5361403 39623 5401026
Girls
CookingNumber 1597509 8445 1605954
% in task type 31.4 20.6 31.3
CleaningNumber 4036186 29880 4066066
% in task type 79.3 73.0 79.3
Fetching water/fi ll tankerNumber 3448992 24033 3473025
% in task type 67.8 58.7 67.7
Taking care of other member of familyNumber 643576 7145 650721
% in task type 12.6 17.5 12.7
LaundryNumber 2026212 11043 2037255
% in task type 39.8 27.0 39.7
Doing the grocery shoppingNumber 582907 5197 588104
% in task type 11.5 12.7 11.5
OtherNumber 87170 650 87820
% in task type 1.7 1.6 1.7
Total Number 5088461 40922 5129383
Source: NDSA. Note: † Weighted by the population of the province. �Some fi gures should be considered with caution due to low number of observations.

81Annexure
Table 45. Distribution of Boys with Disability and Non-Disabled Boys Aged 7 to 15 according to Types of Field Work
Types of Field Work† Non-disabled Persons with Disability Total
Work the soil, harvestNumber 1060069 9743 1069812
% in task type 60.2 71.4 60.3
Look after animalsNumber 1259872 12342 1272214
% in task type 71.6 90.5 71.7
Fetch and carry thingsNumber 1109564 5847 1115411
% in task type 63.1 42.9 62.9
Guarding the productsNumber 732955 1950 734905
% in task type 41.7 14.3 41.4
Other, specifyNumber 176288 1300 177588
% in task type 10.0 9.5 10.0
Total Number 1759766 13641 1773407
Source: NDSA. Note: † Weighted by the population of the province. 3 Responses possible.
Table 46. Distribution of Boys with Disability and Non-Disabled Boys Aged 7 to 15 according to Types of Jobs
Types of Jobs† Non-Disabled Persons with Disability† Total
Odd jobs (rag-picking, bottle collecting...)Number 7145 0 7145
% in job type 1.5 0.0 1.5
Help someone we know in his/her workNumber 70411 650 71061
% in job type 15.0 9.1 14.9
Employed in a fi xed jobNumber 86261 650 86911
% in job type 18.3 9.1 18.2
Employed in occasional jobNumber 80415 2599 83014
% in job type 17.1 36.4 17.4
Independent small job (shoe polish, newspaper vendor...)
Number 76647 0 76647
% in job type 16.3 0.0 16.0
Other, apprenticeNumber 149527 3897 153424
% in job type 31.8 54.5 32.1
Total Number 470406 7146 477552
Source: NDSA. Note: † Weighted by the population of the province. Some fi gures should be considered with caution due to low number of observations.

82 Understanding Vulnerability of Afghans with Disability
Table 48. Distribution of Active Persons Aged 15-64 with Disability and Non-Disabled according to the Monthly Professional Income
Classes of Income Persons with Disability Non-Disabled† Total
0 AFAs Number 12341 316722 329063
% in income 9.3 5.9 6.0
100 to 1000 AFAs Number 20786 541077 561863
% in income 15.6 10.1 10.3
1100 to 2000 AFAs Number 35725 888327 924052
% in income 26.8** 16.6** 16.9
2100 to 3000 AFAs Number 25982 1215572 1241554
% in income 19.5 22.8 22.7
3050 to 4000 AFAs Number 12341 834545 846886
% in income 9.3 15.6 15.5
4050AFAs to 5500 AFAs Number 8444 678522 686966
% in income 6.3* 12.7* 12.5
6000 AFAs and more0 AFAs
Number 14940 809732 824672
% in income 11.2 15.2 15.1
Refuse or don’t knowNumber 2598 57680 60278
% of income 2.0 1.1 1.1
Total Number 133157 5342177 5475334
Source: NDSA. Note: † Weighted by the population of the province. (1) Test of comparison of proportion between Persons with Disabilities and Non-Disabled. ** Signifi cant at p<0.001 * Signifi cant at p<0.05 (2) Test Chi 2 of Pearson of independence. ** Signifi cant at p<0.001 * Signifi cant at p<0.05.
Tables Related to Income
Table 47. Monthly Activity Income of Active People
For Adults 15-64 For All Population
Classes of Income†� Number % by Class Valid % Cumulate % Number % by Class Valid % Cumulate
%
0 AFAs 329063 2.9 6.0 6.0 2252906 8.7 26.5 26.5
100 to 1000 AFAs 561863 5.0 10.3 16.3 946267 3.7 11.1 37.6
1100 to 2000 AFAs 924053 8.2 16.9 33.1 1134378 4.4 13.3 51.0
2100 to 3000 AFAs 1241554 11.0 22.7 55.8 1321189 5.1 15.5 66.5
3050 to 4000 AFAs 846886 7.5 15.5 71.3 867022 3.3 10.2 76.7
4050AFAs to 5500 AFAs 686966 6.1 12.5 83.8 691513 2.7 8.1 84.9
6000 AFAs and more 824671 7.3 15.1 98.9 840261 3.2 9.9 94.7
Refuse or don’t know 60278 0.5 1.1 100.0 447282 1.7 5.3 100.0
Total 5475334 48.5 100.0 8500818 32.8 100.0
Do not work 5825573 51.5 17424105 67.2
Total 11300907 100.0 25924922 100.0
Source: NDSA. Note: �Some fi gures should be considered with caution due to low number of observations.† Weighted by the number of inhabitants in the province.
83Annexure
Table 49. Distribution of Active Males Aged 15-64 with Disability and Non-Disabled according to the Monthly Professional Income
Classes of Income Males with disability
Non-disabled Males † Total
0 AFAs Number 12341 249428 261769
% in income 9.9 5.2 5.3
100 to 1000 AFAs Number 15589 401813 417402
% in income 12.5 8.4 8.5
1100 to 2000 AFAs Number 33127 781801 814928
% in income 26.6**(1) 16.3**(1) 16.5
2100 to 3000 AFAs Number 25982 1090728 1116710
% in income 20.8 22.7 22.6
3050 to 4000 AFAs Number 11692 809082 820774
% in income 9.4*(1) 16.8*(1) 16.6
4050AFAs to 5500 AFAs Number 8444 645655 654099
% in income 6.8*(1) 13.4*(1) 13.3
6000 AFAs and more0 AFAs
Number 14940 773357 788297
% in income 12.0 16.1 16.0
Refuse or don’t knowNumber 2598 57680 60278
% of income 2.1 1.2 1.2
Total Number 124713 4809544 4934257
Source: NDSA. Note: �Some fi gures should be considered with caution due to low number of observations.† Weighted by the population of the province. (1) Test of comparison of proportion between Persons with Disabilities and Non-Disabled. ** Signifi cant at p<0.001 * Signifi cant at p<0.05 (2) Test Chi 2 of Pearson of independence. ** Signifi cant at p<0.001 * Signifi cant at p<0.05.
Tables Related to Durable Goods
Table 50. Distribution of Persons with Disability and Non-Disabled Living in Households Possessing the Following Goods
List of Goods Non-Disabled Persons with Disability† Total
RadioNumber 1222 633 1855% in type of good 70.9*(1) 66.9*(1) 68.9
TelevisionNumber 382 189 571% in type of good 22.2 20.0 21.1
Pressure cookerNumber 1060 592 1652% in type of good 61.5 62.4 62.0
Oven, hotplateNumber 112 59 171% in type of good 6.5 6.2 6.4
RefrigeratorNumber 83 40 123% in type of good 4.8 4.2 4.5
BukhariNumber 869 473 1342% in type of good 50.4 49.9 50.2
BicycleNumber 569 307 876% in type of good 33.0 32.4 32.7
MotorbikeNumber 151 65 216% in type of good 8.8 6.9 7.8
CarNumber 71 36 107% in type of good 4.1 3.8 4.0
(Table 50 Contd. on next page)

84 Understanding Vulnerability of Afghans with Disability
List of Goods Non-Disabled Persons with Disability† Total
TractorNumber 37 16 53% in type of good 2.1 1.7 1.9
GeneratorNumber 192 86 278% in type of good 11.1 9.1 10.1
Kerosene lampNumber 1674 926 2600% in type of good 97.0 97.6 97.3
Sewing machineNumber 839 411 1250% in type of good 48.6**(1) 43.3**(1) 46.0
House or apartmentNumber 1346 727 2073% in type of good 78.0 76.7 77.4
Source: NDSA. Note: †Some fi gures should be considered with caution due to low number of observations. (1) Test of comparison of proportion between Persons with Disabilities and Non-Disabled. ** Signifi cant at p<0.01 * Signifi cant at p<0.05.
(Table 50 Contd. from previous page)
Table 51. Distribution of Households Possessing the Following Goods and Equipments
List of GoodsHH without Person with Disability†
HH with a Persons with Disabilities
Total
RadioNumber 15566 1214 16780
% in type of good 72.6**(1) 68.1**(1) 70.3
TelevisionNumber 4729 366 5095
% in type of good 22.1 20.5 21.3
Pressure cookerNumber 12484 1126 13610
% in type of good 58.3**(1) 63.0**(1) 60.7
Oven, hotplateNumber 1372 110 1482
% in type of good 6.4 6.2 6.3
RefrigeratorNumber 1176 74 1250
% in type of good 5.5 4.1 4.8
BukhariNumber 10533 899 11432
% in type of good 49.1 50.4 49.7
BicycleNumber 6792 596 7388
% in type of good 31.7 33.4 32.6
MotorbikeNumber 2212 126 2338
% in type of good 10.3**(1) 7.1**(1) 8.7
CarNumber 937 68 1005
% in type of good 4.4 3.8 4.1
TractorNumber 567 31 598
% in type of good 2.6*(1) 1.7*(1) 2.2
GeneratorNumber 2659 165 2824
% in type of good 12.4**(1) 9.2**(1) 10.8
Kerosene lampNumber 20693 1745 22438
% in type of good 96.4**(1) 97.6**(1) 97.0
Sewing machineNumber 10978 796 11774
% in type of good 51.2**(1) 44.5**(1) 47.9
House or apartmentNumber 16861 1381 18242
% in type of good 78.5 77.3 77.9
Source: NDSA. Note: † Weighted by the number of household in the cluster without Persons with Disabilities living there. (1) Test of comparison of proportion between Persons with Disabilities and Non-Disabled. ** Signifi cant at p<0.01 * Signifi cant at p<0.05.

85Annexure
Table 52. Distribution of Households according to the Ownership of Goods and Equipments by Urban and Rural Settings
List of Goods and Equipments† Urban Rural Total
RadioNumber 4949 11831 16780
% in type of good 86.1**(1) 67.7**(1) 76.9
TelevisionNumber 3383 1712 5095
% in type of good 58.6**(1) 9.8**(1) 34.2
Pressure cookerNumber 4783 8827 13610
% in type of good 83.5**(1) 50.5**(1) 67.0
Oven, hotplateNumber 514 968 1482
% in type of good 8.9**(1) 5.5**(1) 7.2
RefrigeratorNumber 1190 60 1250
% in type of good 20.6**(1) 0.3**(1) 10.5
BukhariNumber 3503 7929 11432
% in type of good 60.7** 45.4** 53.0
BicycleNumber 3104 4284 7388
% in type of good 53.8**(1) 24.6**(1) 39.2
MotorbikeNumber 907 1431 2338
% in type of good 15.7**(1) 8.2**(1) 12.0
CarNumber 623 382 1005
% in type of good 10.8**(1) 2.2**(1) 6.5
TractorNumber 111 487 598
% in type of good 1.9**(1) 2.8**(1) 2.4
GeneratorNumber 1604 1220 2824
Percent 27.8**(1) 7.0**(1) 17.4
Kerosene lampNumber 5527 16911 22438
% in type of good 95.7 96.7 96.2
Sewing machineNumber 3698 8076 11774
% in type of good 64.3**(1) 46.2**(1) 55.3
House or apartmentNumber 3846 14396 18242
% in type of good 66.6**(1) 82.3**(1) 74.5
Source: NDSA. Note: † Weighted by the number of household in the cluster without Persons with Disabilities living there. (1) Test of comparison of proportion between Persons with Disabilities and Non-Disabled. ** Signifi cant at p<0.01 * Signifi cant at p<0.05.

86 Understanding Vulnerability of Afghans with Disability
Table 53. Distribution of Households according to Gender of the Head of Household and Ownership of Goods and Equipments
Goods and Equipments Man Head of the HH
Woman Head of the HH Total
RadioNumber 16186 569 16755
% in type of good 73.2**(1) 52.5**(1) 62.9
TelevisionNumber 4863 207 5070
% in type of good 22.0 19.1 20.6
Pressure cookerNumber 13045 540 13585
% in type of good 59.0**(1) 50.8**(1) 54.9
Oven, hotplateNumber 1422 60 1482
% in type of good 6.4 5.5 6.0
RefrigeratorNumber 1220 30 1250
% in type of good 5.5**(1) 2.8**(1) 4.1
BukhariNumber 10984 423 11407
% in type of good 49.6**(1) 39.1**(1) 44.3
BicycleNumber 7109 254 7363
% in type of good 32.2**(1) 23.5**(1) 27.8
MotorbikeNumber 2213 100 2313
% in type of good 10.0 9.2 9.6
CarNumber 1005 0 1005
% in type of good 4.5**(1) 0.0**(1) 2.3
TractorNumber 596 2 598
% in type of good 2.7 0.2 1.4
GeneratorNumber 2677 147 2824
% in type of good 12.1 13.6 12.8
Kerosene lampNumber 21379 1034 22413
% in type of good 96.5 95.5 96.0
Sewing machineNumber 11197 577 11774
% in type of good 50.6 53.3 51.9
House or apartmentNumber 17462 780 18242
% in type of good 78.8**(1) 72.0**(1) 75.4
Source: NDSA. Note: † Weighted by the number of household in the cluster without Persons with Disabilities living there. (1) Test of comparison of proportion between Persons with Disabilities and Non-Disabled. ** Signifi cant at p<0.01 * Signifi cant at p<0.05.
Tables Related to Livestock Ownership
Table 54. Distribution of Persons with Disability and Non-Disabled Living in Households Possessing Livestock
Ownership of Livestock† Persons with Disability Non-Disabled Total
Owns livestockNumber 442995 18425584 18868579
% in ownership category 72.1 75.1 75.0
Do not own livestockNumber 171482 6118910 6290392
% in ownership category 27.9 24.9 25.0
Total Number 1695 941 25158971
Source: NDSA. Note: † Weighted by the number of persons in the province. (1)Test of comparison of proportion between Persons with Disabilities and Non-Disablities. ** Signifi cant at p<0.01 * Signifi cant at p<0.05. (2) Test Chi 2 of Pearson of independence. ** Signifi cant at p<0.01 * Signifi cant at p<0.05.
87Annexure
Table 55. Distribution of Households according to Ownership of Livestock
Ownership of LivestockHH without Person with Disability†
HH with a Persons with Disabilities
Total
Owns livestockNumber 15413 1297 16710
% in ownership category 73.6 73.2 73.5
Do not own livestockNumber 5536 475 6011
% in ownership category 26.4 26.8 26.5
Total Number 20949 1772 22721
Source: NDSA. Note:† Weighted by the number of household in the cluster without Persons with Disabilities living there. (1)Test of comparison of proportion between households with and without a Person with Disability. ** Signifi cant at p<0.01 * Signifi cant at p<0.05. (2) Test Chi 2 of Pearson of independence. ** Signifi cant at p<0.01 * Signifi cant at p<0.05.
Table 56. Distribution of People in Urban and Rural Areas Living in Households Possessing Livestock
Ownership of Livestock Urban Rural Total
Owns livestockNumber 355 1572 1927
% in ownership category 46.0**(1) 84.3**(1) 73.1
Do not own livestockNumber 417 292 709
% in ownership category 54.0 15.7 26.9
Total Number 772 1864 2636**(2)
Source: NDSA. Note: (1)Test of comparison of proportion between urban and rural areas. ** Signifi cant at p<0.01 * Signifi cant at p<0.05. (2) Test Chi 2 of Pearson of independence. ** Signifi cant at p<0.01 * Signifi cant at p<0.05.
Table 57. Distribution of People according to Gender of the Head of the Household and Possession of Livestock
Ownership of Livestock Man Head of the HH
Woman Head of the HH Total
Owns livestockNumber 15887 798 16685
% in ownership category 73.5 73.8 73.5
Do not own livestockNumber 5728 283 6011
% in ownership category 26.5 26.2 26.5
Total Number 21615 1081 22696
Source: NDSA. Note:† Weighted by the number of household in the cluster without Persons with Disabilities living there. (1)Test of comparison of proportion between households headed by a man or a woman. ** Signifi cant at p<0.01 * Signifi cant at p<0.05. (2) Test Chi 2 of Pearson of independence. ** Signifi cant at p<0.01 * Signifi cant at p<0.05.
Table 58. Distribution of Households of Persons with Disability and Non-Disabled according to Ownership of Livestock by Type of Animals
Types of Animals Non-Disabled
Persons with
DisabilityTotal
No sheepNumber 1339 754 2093
% in animal category 77.0 78.7 77.6
1 to 5 sheepNumber 279 133 412
% in animal category 16.1 13.9 15.3
6 Sheep and moreNumber 120 71 191
% in animal category 6.9 7.4 7.1
Total Number 1738 958 2696
(Table 58 contd. on next page)
88 Understanding Vulnerability of Afghans with Disability
Types of Animals Non-Disabled
Persons with
DisabilityTotal
No cowNumber 987 573 1560
% in animal category 56.8 59.8 57.9
1 cowsNumber 330 172 502
% in animal category 19.0 18.0 18.6
2 cowsNumber 272 141 413
% in animal category 15.7 14.7 15.3
3 cowsNumber 73 36 109
% in animal category 4.2 3.8 4.0
4 Cows and moreNumber 76 36 112
% in animal category 4.4 3.8 4.2
Total Number 1738 958 2696
No goatsNumber 1345 760 2105
% in animal category 77.4 79.3 78.1
1 to 5 GoatsNumber 313 156 469
% in animal category 18.0 16.3 17.4
6 Goats and moreNumber 80 42 122
% in animal category 4.6 4.4 4.5
Total Number 1738 958 2696
No horsesNumber 1672 931 2603
% in animal category 96.2 97.2 96.6
1 horseNumber 49 23 72
% in animal category 2.8 2.4 2.7
2 Horses and moreNumber 17 4 21
% in animal category 1.0 0.4 0.8
Total Number 1738 958 2696
No donkeyNumber 1158 654 1812
% in animal category 66.6 68.3 67.2
1 donkeyNumber 441 237 678
% in animal category 25.4 24.7 25.1
2 donkeys and moreNumber 139 67 206
% in animal category 8.0 7.0 7.6
Total Number 1738 958 2696
No chickenNumber 785 451 1236
% in animal category 45.2 47.1 45.8
1 to 3 chickensNumber 382 197 579
% in animal category 22.0 20.6 21.5
4 to 6 chickensNumber 300 162 462
% in animal category 17.3 16.9 17.1
7 chickens and moreNumber 271 148 419
% in animal category 15.6 15.4 15.5
Total Number 1738 958 2696
No roosterNumber 1656 924 2580
% in animal category 95.3 96.5 95.7
(Table 58 contd. from previous page)
(Table 60 contd. on next page)

89Annexure
Types of Animals Non-Disabled
Persons with
DisabilityTotal
1 roosterNumber 62 28 90
% in animal category 3.6 2.9 3.3
2 roosters and moreNumber 20 6 26
% in animal category 1.2 0.6 1.0
Total Number 1738 958 2696
No camelNumber 1715 951 2666
% in animal category 98.7 99.3 98.9
1 camels and moreNumber 23 7 30
% in animal category 1.3 0.7 1.1
Total Number 1738 958 2696
Source: NDSA.
Table 59. Distribution of Households according to Ownership of Different Types of Animals
Types of Animals HH without Person with Disability†
HH with a Persons with Disabilities
Total
0 sheepNumber 16370 1409 17779
% in animal category 76.0*(1) 78.0*(1) 76.1
1 to 5 sheepNumber 3735 264 3999
% in animal category 17.3**(1) 14.6**(1) 17.1
6 sheep and moreNumber 1437 133 1570
% in animal category 6.7 7.4 6.7
Total Number 21542 1806 23348
0 cowNumber 11907 1056 12963
% in animal category 55.3**(1) 58.5**(1) 55.5
1 cowsNumber 4206 330 4536
% in animal category 19.5 18.3 19.4
2 cowsNumber 3351 281 3632
% in animal category 15.6 15.6 15.6
3CowsNumber 1018 69 1087
% in animal category 4.7 3.8 4.7
4 cows and moreNumber 1060 70 1130
% in animal category 4.9*(1) 3.9*(1) 4.8
Total Number 21542 1806 23348
0 goatsNumber 16101 1434 17535
% in animal category 74.7**(1) 79.4**(1) 75.1
1 to 5 goatsNumber 4343 293 4636
% in animal category 20.2**(1) 16.2**(1) 19.9
6 goats and moreNumber 1098 79 1177
% in animal category 5.1 4.4 5.0
Total Number 21542 1806 23348
(Table 59 contd. on next page)
(Table 58 contd. from previous page)

90 Understanding Vulnerability of Afghans with Disability
Types of Animals HH without Person with Disability†
HH with a Persons with Disabilities
Total
0 horsesNumber 20581 1752 22333
% in animal category 95.5**(1) 97.0**(1) 95.7
1 horseNumber 628 46 674
% in animal category 2.9 2.5 2.9
2 horses and moreNumber 333 8 341
% in animal category 1.5**(1) 0.4**(1) 1.5
Total Number 21542 1806 23348
0 donkeyNumber 14237 1218 15455
% in animal category 66.1 67.4 66.2
1 donkeyNumber 5457 458 5915
% in animal category 25.3 25.4 25.3
2 donkeys and moreNumber 1848 130 1978
% in animal category 8.6*(1) 7.2*(1) 8.5
Total Number 21542 1806 23348
0 chickenNumber 9884 823 10707
% in animal category 45.9 45.6 45.9
1 to 3 chickensNumber 4549 386 4935
% in animal category 21.1 21.4 21.1
4 to 6 chickensNumber 3809 311 4120
% in animal category 17.7 17.2 17.6
7 chickens and moreNumber 3300 286 3586
% in animal category 15.3 15.8 15.4
Total Number 21542 1806 23348
0 RoosterNumber 20498 1734 22232
% in animal category 95.2 96.0 95.2
1 RoosterNumber 668 61 729
% in animal category 3.1 3.4 3.1
2 Roosters and MoreNumber 376 11 387
% in animal category 1.7**(1) 0.6**(1) 1.7
Total Number 21542 1806 23348
0 CamelNumber 21109 1793 22902
% in animal category 98.0**(1) 99.3**(1) 98.1
1 Camels and MoreNumber 433 13 446
% in animal category 2.0 0.7 1.9
Total Number 21542 1806 23348
Source: NDSA. Note:† Weighted by the number of household in the cluster without persons with disabilities living there. (1)Test of comparison of proportion between households with and without a persons with disability. ** Signifi cant at p<0.01 * Signifi cant at p<0.05. (2) Test Chi 2 of Pearson of independence. ** Signifi cant at p<0.01 * Signifi cant at p<0.05.
(Table 59 contd. from previous page)
91Annexure
Table 60. Distribution of People according to Gender of the Head of the Household and Ownership of Animals by Types of Animals
Types of Animals Man Head of the HH Woman Head of the HH Total
0 sheepNumber 16776 978 17754
% in animal category 75.5**(1) 87.9**(1) 76.1
1 to 5 sheepNumber 3865 134 3999
% in animal category 17.4**(1) 12.1**(1) 17.1
6 sheep and moreNumber 1570 0 1570
% in animal category 7.1**(1) 0.0**(1) 6.7
Total Number 22211 1112 23323
0 cowNumber 12064 874 12938
% in animal category 54.3**(1) 78.6**(1) 55.5
1 cowsNumber 4409 127 4536
% in animal category 19.9**(1) 11.4**(1) 19.4
2 cowsNumber 3550 82 3632
% in animal category 16.0**(1) 7.4**(1) 15.6
3cowsNumber 1085 2 1087
% in animal category 4.9**(1) 0.2**(1) 4.7
4 cows and moreNumber 1103 27 1130
% in animal category 5.0**(1) 2.4**(1) 4.8
Total Number 22211 1112 23323
0 GoatsNumber 16606 904 17510
% in animal category 74.8**(1) 81.3**(1) 75.1
1 to 5 goatsNumber 4503 133 4636
% in animal category 20.3**(1) 12.0**(1) 19.9
6 goats and moreNumber 1102 75 1177
% in animal category 5.0**(1) 6.7**(1) 5.0
Total Number 22211 1112 23323
0 horsesNumber 21196 1112 22308
% in animal category 95.4**(1) 100.0**(1) 95.6
1 horseNumber 674 0 674
% in animal category 3.0**(1) 0.0**(1) 2.9
2 horses and moreNumber 341 0 341
% in animal category 1.5**(1) 0.0**(1) 1.5
Total Number 22211 1112 23323
0 donkeyNumber 14482 948 15430
% in animal category 65.2**(1) 85.3**(1) 66.2
1 donkeyNumber 5751 164 5915
% in animal category 25.9**(1) 14.7**(1) 25.4
2 donkeys and moreNumber 1978 0 1978
% in animal category 8.9**(1) 0.0**(1) 8.5
Total Number 22211 1112 23323
0 chickenNumber 10239 468 10707
% in animal category 46.1**(1) 42.1**(1) 45.9
1 to 3 chickensNumber 4567 343 4910
% in animal category 20.6**(1) 30.8**(1) 21.1
(Table 60 contd. on next page)

92 Understanding Vulnerability of Afghans with Disability
Types of Animals Man Head of the HH Woman Head of the HH Total
4 to 6 chickensNumber 3932 188 4120
% in animal category 17.7 16.9 17.7
7 chickens and moreNumber 3473 113 3586
% in animal category 15.6**(1) 10.2**(1) 15.4
Total Number 22211 1112 23323
0 roosterNumber 21122 1085 22207
% in animal category 95.1**(1) 97.6**(1) 95.2
1 roosterNumber 702 27 729
% in animal category 3.2 2.4 3.1
2 roosters and moreNumber 387 0 387
% in animal category 1.7**(1) 0.0**(1) 1.7
Total Number 22211 1112 23323
0 camelNumber 21765 1112 22877
% in animal category 98.0 100.0 98.1
1 camels and moreNumber 446 0 446
% in animal category 2.0**(1) 0.0**(1) 1.9
Total Number 22211 1112 23323**(2)
Source: NDSA. Note: (1)Test of comparison of proportion between households with and without a persons with disabilities. ** Signifi cant at p<0.01 * Signifi cant at p<0.05. (2) Test Chi 2 of Pearson of independence. ** Signifi cant at p<0.01 * Signifi cant at p<0.05.
Tables Related to Land Ownership
Table 61. Distribution of Households according to Ownership of Land
Ownership of LandHH without
Persons with Disability†
HH with a Persons with Disabilities
Total
Households owning landNumber 11763 1013 12776
% in ownership category 55.1 56.8 55.2
Households not owning land
Number 9585 772 10357
% in ownership category 44.9 43.2 44.8
Total Number 21348 1785 23133
Source: NDSA. Note: † Weighted by the number of household in the cluster without persons with disabilities living there.
Table 62. Distribution of Persons with Disability and Non-reporting Ownership of Land
Ownership of Land Non-Disabled† Persons with Disability Total
Owning landNumber 1592 243 1836
% in ownership category 37.0**(1) 46.8**(1) 38.0
Not owning landNumber 2715 278 2992
% in ownership category 63.0 53.2 62.0
Total Number 4307 521 4828
Source: NDSA. Note: † Weighted by the number of members of households in the cluster without persons with disabilities living there. (1) Test of comparison of proportion between persons with disabilities and non-disabled. ** Signifi cant at p<0.01 * Signifi cant at p<0.05 (2) Test Chi 2 of Pearson of independence. ** Signifi cant at p<0.01 * Signifi cant at p<0.05.
(Table 60 contd. from previous page)

93Annexure
Table 63. Distribution of Households according to Ownership of Land by Urban and Rural Areas
Ownership of Land† Urban Rural Total
Own land Number 1766 11010 12776% in ownership category 30.8**(1) 63.3**(1) 55.2
Do not own land Number 3964 6393 10357% in ownership category 69.2 36.7 44.8
Total Number 5730 17403 23133**(2)
Source: NDSA. Note:† Weighted by the number of household in the cluster without persons with disabilities living there. (1) Test of comparison of proportion between Urban and Rural. ** Signifi cant at p<0.01 * Signifi cant at p<0.05 (2) Test Chi 2 of Pearson of independence. ** Signifi cant at p<0.01 * Signifi cant at p<0.05.
Table 64. Distribution of Households according to Gender of the Head of the Household and Ownership of Land
Ownership of Land† Man Head HH Woman Head HH Total
Own land Number 12438 338 12776% in ownership category 56.5** 30.5** 55.3
Do not own land Number 9560 772 10332% in ownership category 43.5 69.5 44.7
Total Number 21998 1110 23108**(2)
Source: NDSA. Note: † Weighted by the number of household in the cluster without persons with disabilitiess living there. (1) Test of comparison of proportion between Men and women head of household. ** Signifi cant at p<0.01 * Signifi cant at p<0.05 (2) Test Chi 2 of Pearson of independence. ** Signifi cant at p<0.01 * Signifi cant at p<0.05.
Table 65. Distribution of Households according to Gender of the Head of the Household and Personal Ownership of Land
Ownership of Land† Man Head of the HH Woman Head of the HH Total
Own land Number 5059 142 5201
% in ownership category 40.0 42.0 40.1
Do not own land Number 7557 196 7753% in ownership category 59.8 58.0 59.7
Does not knowNumber 26 0 26% in ownership category 0.2 0.0 0.2
Total Number 12642 338 12980
Source: NDSA. Note: † Weighted by the number of household in the cluster without Persons with Disabilities living there. (1) Test of comparison of proportion between men and women head of household. ** Signifi cant at p<0.01 * Signifi cant at p<0.05 (2) Test Chi 2 of Pearson of independence. ** Signifi cant at p<0.01 * Signifi cant at p<0.05.
Table 66. Distribution of Households according to the Size of the Land
Size of the Land Belonging to the Family† HH without Person
with Disability†HH with Persons with Disability Total
No LandNumber 8953426 2007765 10961191% in land size 42.6 41.3 42.3
0.01 to 0.5 jeribsNumber 1253506 309836 1563342% in land size 6.0 6.4 6.0
0.51 to 1 jeribNumber 1786788 391030 2177818% in land size 8.5 8.1 8.4
1.05 to 2 jeribNumber 2117020 608630 2725650% in land size 10.1 12.5 10.5
2.1 to 4 jeribNumber 2778654 559914 3338568% in land size 13.2 11.5 12.9
4 to 140 jeribNumber 4148559 980174 5128733% in land size 19.7 20.2 19.8
Total Number 21037953*(2) 4857349*(2) 25895302
Source: NDSA. Note: † Weighted by the population of the province. (1) Test of comparison of proportion between household with and without Persons with Disabilities. ** Signifi cant at p<0.01 * Signifi cant at p<0.05 (2) Test Chi 2 of Pearson of independence. ** Signifi cant at p<0.01 * Signifi cant at p<0.05.
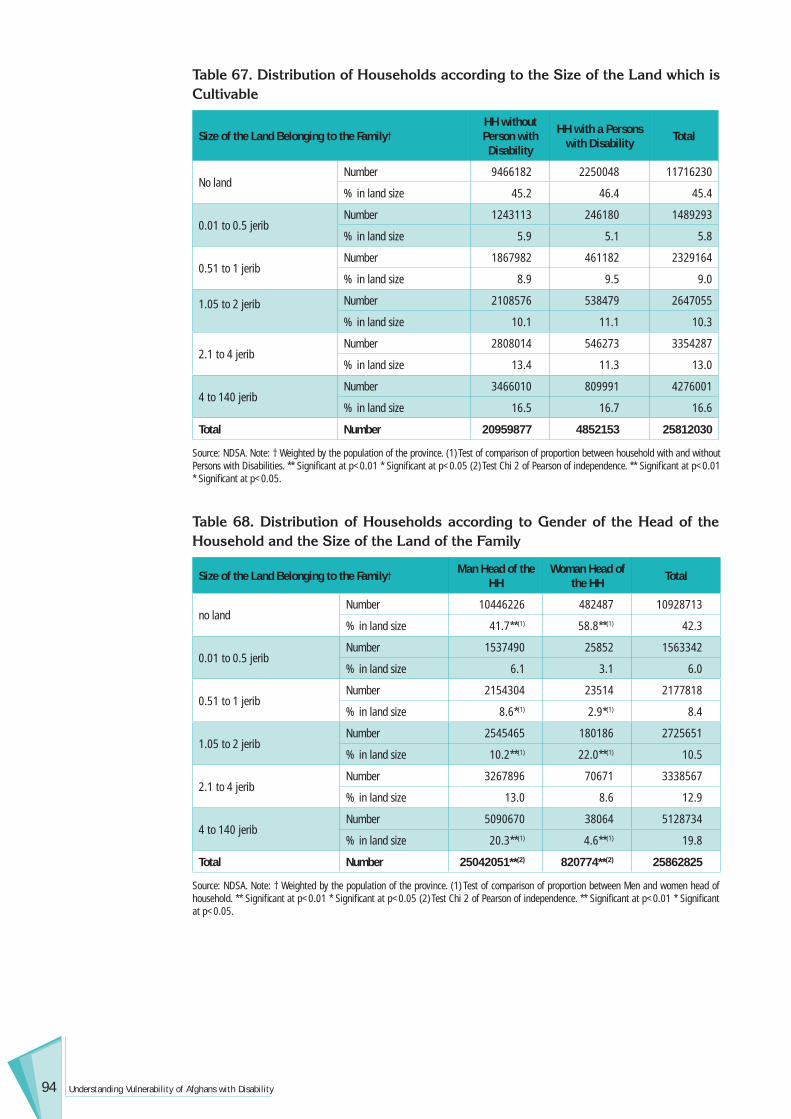
94 Understanding Vulnerability of Afghans with Disability
Table 67. Distribution of Households according to the Size of the Land which is Cultivable
Size of the Land Belonging to the Family† HH without Person with Disability
HH with a Persons with Disability Total
No landNumber 9466182 2250048 11716230
% in land size 45.2 46.4 45.4
0.01 to 0.5 jeribNumber 1243113 246180 1489293
% in land size 5.9 5.1 5.8
0.51 to 1 jeribNumber 1867982 461182 2329164
% in land size 8.9 9.5 9.0
1.05 to 2 jerib Number 2108576 538479 2647055
% in land size 10.1 11.1 10.3
2.1 to 4 jeribNumber 2808014 546273 3354287
% in land size 13.4 11.3 13.0
4 to 140 jeribNumber 3466010 809991 4276001
% in land size 16.5 16.7 16.6
Total Number 20959877 4852153 25812030
Source: NDSA. Note: † Weighted by the population of the province. (1) Test of comparison of proportion between household with and without Persons with Disabilities. ** Signifi cant at p<0.01 * Signifi cant at p<0.05 (2) Test Chi 2 of Pearson of independence. ** Signifi cant at p<0.01 * Signifi cant at p<0.05.
Table 68. Distribution of Households according to Gender of the Head of the Household and the Size of the Land of the Family
Size of the Land Belonging to the Family† Man Head of the
HH Woman Head of
the HH Total
no landNumber 10446226 482487 10928713
% in land size 41.7**(1) 58.8**(1) 42.3
0.01 to 0.5 jeribNumber 1537490 25852 1563342
% in land size 6.1 3.1 6.0
0.51 to 1 jeribNumber 2154304 23514 2177818
% in land size 8.6*(1) 2.9*(1) 8.4
1.05 to 2 jeribNumber 2545465 180186 2725651
% in land size 10.2**(1) 22.0**(1) 10.5
2.1 to 4 jeribNumber 3267896 70671 3338567
% in land size 13.0 8.6 12.9
4 to 140 jeribNumber 5090670 38064 5128734
% in land size 20.3**(1) 4.6**(1) 19.8
Total Number 25042051**(2) 820774**(2) 25862825
Source: NDSA. Note: † Weighted by the population of the province. (1) Test of comparison of proportion between Men and women head of household. ** Signifi cant at p<0.01 * Signifi cant at p<0.05 (2) Test Chi 2 of Pearson of independence. ** Signifi cant at p<0.01 * Signifi cant at p<0.05.

95Annexure
Table 69. Distribution of Households according to Gender of the Head of the Household and to the Size of the Land of the Family which is Cultivable
Size of the Land Belonging to the Family† Man Head of
the HH Woman Head
of the HH Total
No land cultivableNumber 11190223 493530 11683753
% in land size 44.8**(1) 60.1**(1) 45.3
0.01 to 0.5 jeribNumber 1467988 21305 1489293
% in land size 5.9 2.6 5.8
0.51 to 1 jeribNumber 2286034 43130 2329164
% in land size 9.2 5.3 9.0
1.05 to 2 jeribNumber 2485186 161868 2647054
% in land size 10.0**(1) 19.7**(1) 10.3
2.1 to 4 jeribNumber 3278289 75998 3354287
% in land size 13.1 9.3 13.0
4 to 140 jeribNumber 4251059 24943 4276002
% in land size 17.0**(1) 3.0**(1) 16.6
Total Number 24958779**(2) 820774**(2) 25779553
Source: NDSA. Note: † Weighted by the population of the province. (1) Test of comparison of proportion between Men and women head of household. ** Signifi cant at p<0.01 * Signifi cant at p<0.05 (2) Test Chi 2 of Pearson of independence. ** Signifi cant at p<0.01 * Signifi cant at p<0.05.
Tables Related to Debt
Table 70. Distribution of Persons with Disability and Non-Disabled Above 14 Having Taken a Loan in the Last 5 Years according to Activity
Loan† Working Not Working Total
Non-Disabled
LoanNumber 331012 985760 1316772
% in category 45.7**(1) 27.5 30.5
No loanNumber 394018 2603145 2997163
% in category 54.3 72.5 69.5
Total Number 725030 3588905 4313935
Persons with Disability
LoanNumber 17538 50016 67554
% in category 60.0**(1) 31.8 36.2
No loanNumber 11692 105877 117569
% in category 40.0 67.4 63.1
Total Number 29230**(2) 157193 186423
Source: NDSA. Note: † Weighted by the population of the province. (1) Test of comparison of proportion between Persons with Disabilities and Non-Disablities. ** Signifi cant at p<0.01 * Signifi cant at p<0.05 (2) Test Chi 2 of Pearson of independence. ** Signifi cant at p<0.01 * Signifi cant at p<0.05.
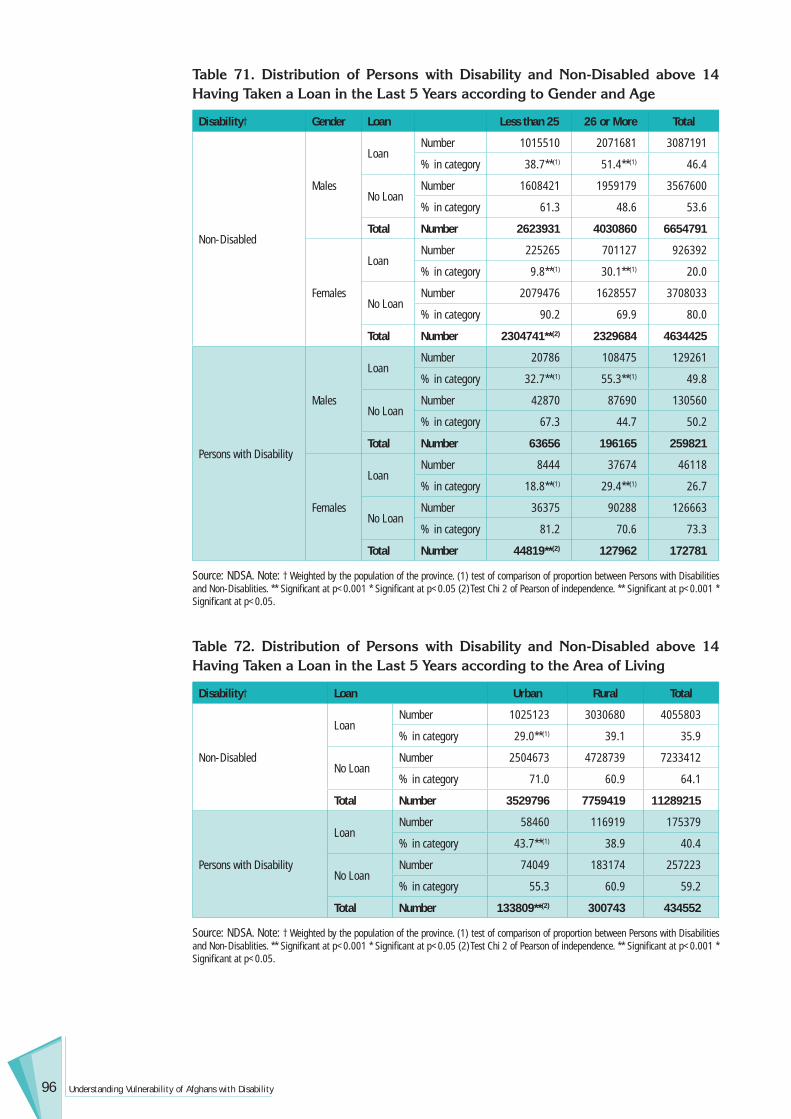
96 Understanding Vulnerability of Afghans with Disability
Table 71. Distribution of Persons with Disability and Non-Disabled above 14 Having Taken a Loan in the Last 5 Years according to Gender and Age
Disability† Gender Loan Less than 25 26 or More Total
Non-Disabled
Males
LoanNumber 1015510 2071681 3087191
% in category 38.7**(1) 51.4**(1) 46.4
No LoanNumber 1608421 1959179 3567600
% in category 61.3 48.6 53.6
Total Number 2623931 4030860 6654791
Females
LoanNumber 225265 701127 926392
% in category 9.8**(1) 30.1**(1) 20.0
No LoanNumber 2079476 1628557 3708033
% in category 90.2 69.9 80.0
Total Number 2304741**(2) 2329684 4634425
Persons with Disability
Males
LoanNumber 20786 108475 129261
% in category 32.7**(1) 55.3**(1) 49.8
No LoanNumber 42870 87690 130560
% in category 67.3 44.7 50.2
Total Number 63656 196165 259821
Females
LoanNumber 8444 37674 46118
% in category 18.8**(1) 29.4**(1) 26.7
No LoanNumber 36375 90288 126663
% in category 81.2 70.6 73.3
Total Number 44819**(2) 127962 172781
Source: NDSA. Note: † Weighted by the population of the province. (1) test of comparison of proportion between Persons with Disabilities and Non-Disablities. ** Signifi cant at p<0.001 * Signifi cant at p<0.05 (2) Test Chi 2 of Pearson of independence. ** Signifi cant at p<0.001 * Signifi cant at p<0.05.
Table 72. Distribution of Persons with Disability and Non-Disabled above 14 Having Taken a Loan in the Last 5 Years according to the Area of Living
Disability† Loan Urban Rural Total
Non-Disabled
LoanNumber 1025123 3030680 4055803
% in category 29.0**(1) 39.1 35.9
No LoanNumber 2504673 4728739 7233412
% in category 71.0 60.9 64.1
Total Number 3529796 7759419 11289215
Persons with Disability
LoanNumber 58460 116919 175379
% in category 43.7**(1) 38.9 40.4
No LoanNumber 74049 183174 257223
% in category 55.3 60.9 59.2
Total Number 133809**(2) 300743 434552
Source: NDSA. Note: † Weighted by the population of the province. (1) test of comparison of proportion between Persons with Disabilities and Non-Disablities. ** Signifi cant at p<0.001 * Signifi cant at p<0.05 (2) Test Chi 2 of Pearson of independence. ** Signifi cant at p<0.001 * Signifi cant at p<0.05.

97Annexure
Table 73. Distribution of Persons with Disability and Non-Disabled Above 14 Having Taken a Loan in the Last 5 Years according to the Major Geographical Areas
Disability† Loan Central Region
Western Region
Eastern Region
Southern Region
North Western Region
North Eastern Region Total
Non-Disabled
LoanNumber 1143991 691903 631105 389471 531983 667350 4055803
% in category 34.4**(1) 42.6 35.9 34.7**(1) 32.0*(1) 37.0**(1) 35.9
No Loan
Number 2178857 930418 1125544 732435 1131650 1134508 7233412
% in category 65.6 57.4 64.1 65.3 68.0 63.0 64.1
Total Number 3322848**(2) 1622321 1756649 1121906 1663633 1801858 11289215
Persons with Disability
LoanNumber 65605 32478 20136 17538 20136 19487 175380
% in category 45.1**(1) 40.7 35.2 35.5**(1) 35.2*(1) 42.9**(1) 40.4
No Loan
Number 79245 46768 37024 31828 37024 25333 257222
% in category 54.5 58.5 64.8 64.5 64.8 55.7 59.2
Total Number 145500**(2) 79896 57160 49366 57160 45470 434552
Source: NDSA. Note: † Weighted by the population of the province. (1) test of comparison of proportion between Persons with Disabilities and Non-Disablities by region. ** Signifi cant at p<0.001. * Signifi cant at p<0.05. (2) Test Chi 2 of Pearson of independence. Not Signifi cant at p<0.001.
Table 74. Distribution of Persons with Disability and Non-Disabled above 14 according to the Amounts of Loans
Amount of Loan† Non-Disabled Persons with Disability Total
30 to 5000 AFAsNumber 1155813 46118 1201931
% in amount category 28.8 26.3 28.7
5100 to 12000 AFAsNumber 1052144 41571 1093715
% in amount category 26.2 23.7 26.1
12100 to 30000 AFAsNumber 958869 45469 1004338
% in amount category 23.9 25.9 24.0
31000 AFAs and aboveNumber 844158 42221 886379
% in amount category 21.0 24.1 21.2
Total Number 4013582**(2) 175379**(2) 4188961
Source: NDSA. Note: † Weighted by the population of the province. (1) Test of comparison of proportion between Persons with Disabilities and Non-Disablities. Not Signifi cant at p<0.001 (2) ** Test Chi 2 of Pearson of independence. Signifi cant at p<0.001.

98 Understanding Vulnerability of Afghans with Disability
Table 75. Distribution of Persons with Disability and Non-Disabled above 14 according to the Amounts of Loans and Age Groups
Disability† Amount of Loan Less than 25 26 or More Total
Non-Disabled
30 to 5000 AFAsNumber 429224 726589 1155813
% in amount category 34.6**(1) 26.2**(1) 28.8
5100 to 12000 AFAsNumber 366867 682030 1048897
% in amount category 29.6 24.6 26.2
12100 to 30000 AFAsNumber 371674 587195 958869
% in amount category 30.0 21.2 23.9
31000 AFAs and aboveNumber 73010 774396 847406
% in amount category 5.9**(1) 28.0**(1) 21.1
Total Number 1240775**(2) 2770210**(2) 4010985
Persons with Disability
30 to 5000 AFAsNumber 11692 34426 46118
% in amount category 40.0**(1) 23.6**(1) 26.3
5100 to 12000 AFAsNumber 6496 35076 41572
% in amount category 22.2 24.0 23.7
12100 to 30000 AFAsNumber 8444 37024 45468
% in amount category 28.9 25.3 25.9
31000 AFAs and aboveNumber 2598 39623 42221
% in amount category 8.9**(1) 27.1**(1) 24.1
Total Percent 29230*(2) 146149*(2) 175379
Source: NDSA. Note: † Weighted by the population of the province. (1) test of comparison of proportion between less and more than 25 years old. ** Signifi cant at p<0.001 * Signifi cant at p<0.05 (2) Test Chi 2 of Pearson of independence. ** Signifi cant at p<0.001 * Signifi cant at p<0.05.
Table 76. Distribution of Persons with Disability and Non-Disabled above 14 according to the Amounts of Loans and Gender
Disability† Amount of Loan Male Female Total
Non-Disabled
30 to 5000 AFAsNumber 728538 427275 1155813
% in amount category 23.6**(1) 46.1**(1) 28.8
5100 to 12000 AFAsNumber 863904 188240 1052144
% in amount category 28.0 20.3 26.2
12100 to 30000 AFAsNumber 765952 192917 958869
% in amount category 24.8 20.8 23.9
31000 AFAs and aboveNumber 726199 117959 844158
% in amount category 23.5**(1) 12.7**(1) 21.0
Total Number 3084593**(2) 926391**(2) 4010984
Persons with Disability
30 to 5000 AFAsNumber 28580 17538 46118
% in amount category 22.1**(1) 38.0**(1) 26.3
5100 to 12000 AFAsNumber 30529 11042 41571
% in amount category 23.6 23.9 23.7
12100 to 30000 AFAsNumber 38973 6496 45469
% in amount category 30.2**(1) 14.1**(1) 25.9
31000 AFAs and aboveNumber 31178 11042 42220
% in amount category 24.1 23.9 24.1
Total Number 129260*(2) 46118*(2) 175378
Source: NDSA. Note: † Weighted by the population of the province. (1) test of comparison of proportion between Males and Females. ** Signifi cant at p<0.01 * Signifi cant at p<0.05 (2) Test Chi 2 of Pearson of independence. ** Signifi cant at p<0.01. * Signifi cant at p<0.05.
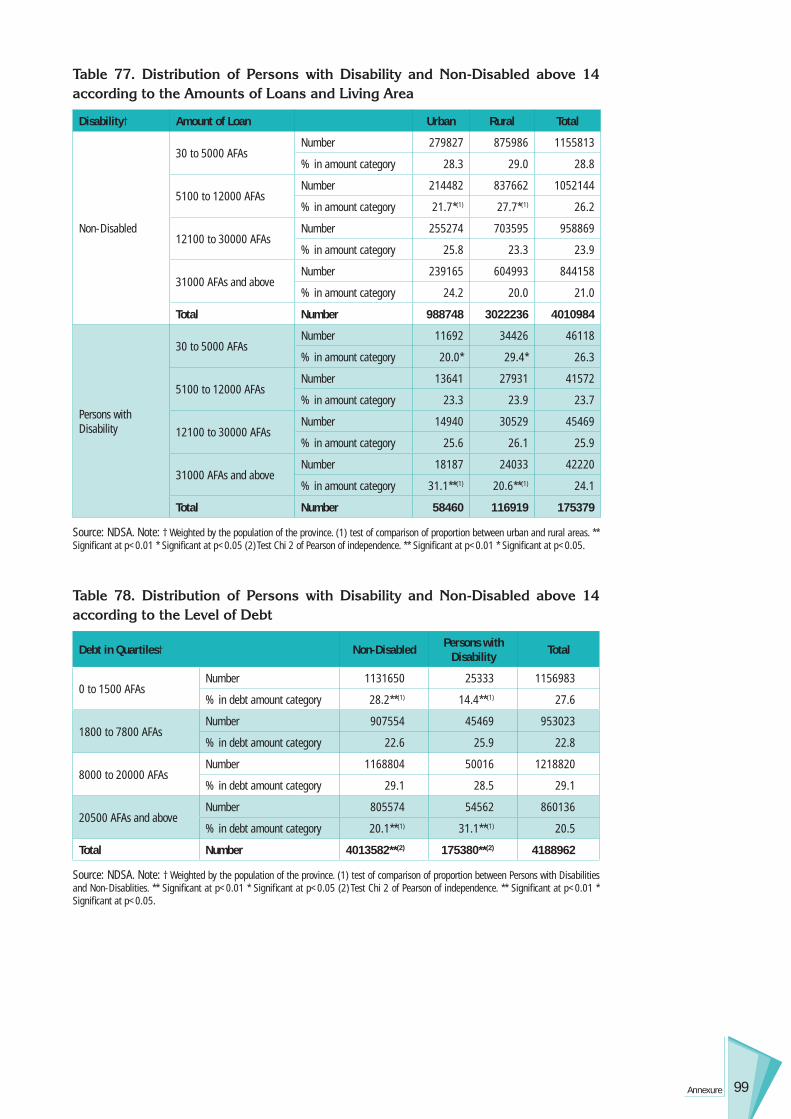
99Annexure
Table 77. Distribution of Persons with Disability and Non-Disabled above 14 according to the Amounts of Loans and Living Area
Disability† Amount of Loan Urban Rural Total
Non-Disabled
30 to 5000 AFAsNumber 279827 875986 1155813
% in amount category 28.3 29.0 28.8
5100 to 12000 AFAsNumber 214482 837662 1052144
% in amount category 21.7*(1) 27.7*(1) 26.2
12100 to 30000 AFAsNumber 255274 703595 958869
% in amount category 25.8 23.3 23.9
31000 AFAs and aboveNumber 239165 604993 844158
% in amount category 24.2 20.0 21.0
Total Number 988748 3022236 4010984
Persons with Disability
30 to 5000 AFAsNumber 11692 34426 46118
% in amount category 20.0* 29.4* 26.3
5100 to 12000 AFAsNumber 13641 27931 41572
% in amount category 23.3 23.9 23.7
12100 to 30000 AFAsNumber 14940 30529 45469
% in amount category 25.6 26.1 25.9
31000 AFAs and aboveNumber 18187 24033 42220
% in amount category 31.1**(1) 20.6**(1) 24.1
Total Number 58460 116919 175379
Source: NDSA. Note: † Weighted by the population of the province. (1) test of comparison of proportion between urban and rural areas. ** Signifi cant at p<0.01 * Signifi cant at p<0.05 (2) Test Chi 2 of Pearson of independence. ** Signifi cant at p<0.01 * Signifi cant at p<0.05.
Table 78. Distribution of Persons with Disability and Non-Disabled above 14 according to the Level of Debt
Debt in Quartiles† Non-Disabled Persons with Disability Total
0 to 1500 AFAsNumber 1131650 25333 1156983
% in debt amount category 28.2**(1) 14.4**(1) 27.6
1800 to 7800 AFAsNumber 907554 45469 953023
% in debt amount category 22.6 25.9 22.8
8000 to 20000 AFAsNumber 1168804 50016 1218820
% in debt amount category 29.1 28.5 29.1
20500 AFAs and aboveNumber 805574 54562 860136
% in debt amount category 20.1**(1) 31.1**(1) 20.5
Total Number 4013582**(2) 175380**(2) 4188962
Source: NDSA. Note: † Weighted by the population of the province. (1) test of comparison of proportion between Persons with Disabilities and Non-Disablities. ** Signifi cant at p<0.01 * Signifi cant at p<0.05 (2) Test Chi 2 of Pearson of independence. ** Signifi cant at p<0.01 * Signifi cant at p<0.05.

100 Understanding Vulnerability of Afghans with Disability
Table 79. Distribution of Persons with Disability and Non-Disabled above 14 according to the Level of Debt by Age Group
Disability or Not Debt in Quartiles† Less than 25 26 or More Total
Non-Disabled
0 to 1500 AFAsNumber 428964 702685 1131649
% in debt amount category 34.6**(1) 25.3**(1) 28.2
1800 to 7800 AFAsNumber 295936 611618 907554
% in debt amount category 23.9 22.1 22.6
8000 to 20000 AFAs
Number 430393 738411 1168804
% in debt amount category 34.7 26.6 29.1
20500 AFAs and above
Number 85481 720093 805574
% in debt amount category 6.9**(1) 26.0**(1) 20.1
Total Number 1240774*(2) 2772807*(2) 4013581
Persons with Disability
0 to 1500 AFAsNumber 4547 20786 25333
% in debt amount category 15.6 14.2 14.4
1800 to 7800 AFAsNumber 9743 35725 45468
% in debt amount category 33.3**(1) 24.4**(1) 25.9
8000 to 20000 AFAs
Number 9094 40922 50016
% in debt amount category 31.1 28.0 28.5
20500 AFAs and above
Number 5846 48716 54562
% in debt amount category 20.0**(1) 33.3**(1) 31.1
Total Number 29230 146149 175379
Source: NDSA. Note: † Weighted by the population of the province. (1) test of comparison of proportion between less and more than 25 years old. ** Signifi cant at p<0.01 * Signifi cant at p<0.05 (2) Test Chi 2 of Pearson of independence. ** Signifi cant at p<0.01 * Signifi cant at p<0.05.
Table 80. Distribution of Persons with Disability and Non-Disabled above 14 according to the Level of Debt by Gender
Disability Debt in Quartiles† Males Females Total
Non-Disabled
0 to 1500 AFAsNumber 692033 439617 1131650
% in debt amount category 22.4**(1) 47.5**(1) 28.2
1800 to 7800 AFAs
Number 791414 116140 907554
% in debt amount category 25.6**(1) 12.5**(1) 22.6
8000 to 20000 AFAs
Number 961727 207077 1168804
% in debt amount category 31.2*(1) 22.4*(1) 29.1
20500 AFAs and above
Number 642017 163557 805574
% in debt amount category 20.8 17.7 20.1
Total Number 3087191*(2) 926391*(2) 4013582
Persons with Disability
0 to 1500 AFAsNumber 15589 9743 25332
% in debt amount category 12.1**(1) 21.1**(1) 14.4
1800 to 7800 AFAs
Number 34426 11042 45468
% in debt amount category 26.6 23.9 25.9
8000 to 20000 AFAs
Number 37024 12991 50015
% in debt amount category 28.6 28.2 28.5
20500 AFAs and above
Number 42221 12341 54562
% in debt amount category 32.7 26.8 31.1
Total Number 129260 46117 175377
Source: NDSA. Note: † Weighted by the population of the province. (1) test of comparison of proportion between males and females. ** Signifi cant at p<0.01 * Signifi cant at p<0.05 (2) Test Chi 2 of Pearson of independence. ** Signifi cant at p<0.01 * Signifi cant at p<0.05.

101Annexure
Table 81. Distribution of Persons with disability and Non-disabled Above 14 according to the Level of Debt by Living Area
Disability or Not Debt in Quartiles† Urban Rural Total
Non-Disabled
0 to 1500 AFAsNumber 370115 761535 1131650
% in debt amount category 37.3**(1) 25.2**(1) 28.2
1800 to 7800 AFAs
Number 84961 822593 907554
% in debt amount category 8.6**(1) 27.2**(1) 22.6
8000 to 20000 AFAs
Number 213962 954842 1168804
% in debt amount category 21.6**(1) 31.6**(1) 29.1
20500 AFAs and above
Number 322308 483267 805575
% in debt amount category 32.5**(1) 16.0**(1) 20.1
Total Number 991346**(2) 3022237**(2) 4013583
Persons with Disability
0 to 1500 AFAsNumber 7795 17538 25333
% in debt amount category 13.3 15.0 14.4
1800 to 7800 AFAs
Number 12991 32478 45469
% in debt amount category 22.2 27.8 25.9
8000 to 20000 AFAs
Number 14940 35076 50016
% in debt amount category 25.6 30.0 28.5
20500 AFAs and above
Number 22734 31828 54562
% in debt amount category 38.9**(1) 27.2**(1) 31.1
Total Number 58460 116920 175380
Source: NDSA. Note: † Weighted by the population of the province. (1) test of comparison of proportion between urban and rural areas. ** Signifi cant at p<0.01 * Signifi cant at p<0.05 (2) Test Chi 2 of Pearson of independence. ** Signifi cant at p<0.01 * Signifi cant at p<0.05.
Table 82. Distribution of Persons with Disability and Non-Disabled above 14 according to the Level of Debt and Situation of Activity
Disability or Not Debt in Quartiles† Not Active Active Total
Non-Disabled
0 to 1500 AFAsNumber 4895284 3508101 8403385
% in the debt level 85.2**(1) 63.3**(1) 74.5
1800 to 7800 AFAsNumber 319190 588364 907554
% in the debt level 5.6*(1) 10.6*(1) 8.0
8000 to 20000 AFAsNumber 350498 818306 1168804
% in the debt level 6.1**(1) 14.8**(1) 10.4
20500 AFAs and aboveNumber 178497 627078 805575
% in the debt level 3.1**(1) 11.3**(1) 7.1
Total Number 5743469**(2) 5541849**(2) 11285318**(2)
Persons with Disability
0 to 1500 AFAsNumber 224095 61707 285802
% in the debt level 74.7**(1) 45.5**(1) 65.6
1800 to 7800 AFAsNumber 22085 23384 45469
% in the debt level 7.4**(1) 17.2**(1) 10.4
8000 to 20000 AFAsNumber 26632 23384 50016
% in the debt level 8.9**(1) 17.2**(1) 11.5
20500 AFAs and aboveNumber 27281 27281 54562
% in the debt level 9.1**(1) 20.1**(1) 12.5
Total Number 300093**(2) 135756**(2) 435849**(2)
Source: NDSA. Note: † Weighted by the population of the province. (1) Test of comparison of proportion between Active and Not Active. ** Signifi cant at p<0.01 * Signifi cant at p<0.05 (2) Test Chi 2 of Pearson of independence. ** Signifi cant at p<0.01 * Signifi cant at p<0.05.
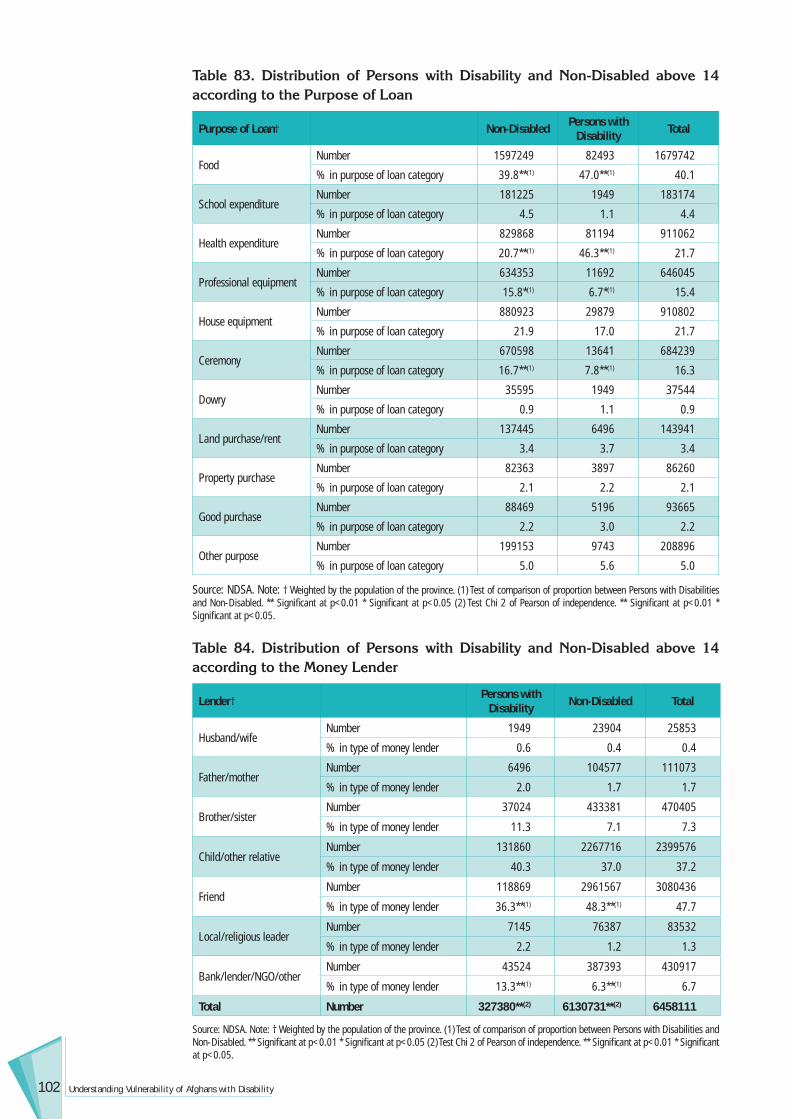
102 Understanding Vulnerability of Afghans with Disability
Table 83. Distribution of Persons with Disability and Non-Disabled above 14 according to the Purpose of Loan
Purpose of Loan† Non-Disabled Persons with Disability Total
FoodNumber 1597249 82493 1679742
% in purpose of loan category 39.8**(1) 47.0**(1) 40.1
School expenditureNumber 181225 1949 183174
% in purpose of loan category 4.5 1.1 4.4
Health expenditureNumber 829868 81194 911062
% in purpose of loan category 20.7**(1) 46.3**(1) 21.7
Professional equipmentNumber 634353 11692 646045
% in purpose of loan category 15.8*(1) 6.7*(1) 15.4
House equipmentNumber 880923 29879 910802
% in purpose of loan category 21.9 17.0 21.7
CeremonyNumber 670598 13641 684239
% in purpose of loan category 16.7**(1) 7.8**(1) 16.3
DowryNumber 35595 1949 37544
% in purpose of loan category 0.9 1.1 0.9
Land purchase/rentNumber 137445 6496 143941
% in purpose of loan category 3.4 3.7 3.4
Property purchaseNumber 82363 3897 86260
% in purpose of loan category 2.1 2.2 2.1
Good purchaseNumber 88469 5196 93665
% in purpose of loan category 2.2 3.0 2.2
Other purposeNumber 199153 9743 208896
% in purpose of loan category 5.0 5.6 5.0
Source: NDSA. Note: † Weighted by the population of the province. (1) Test of comparison of proportion between Persons with Disabilities and Non-Disabled. ** Signifi cant at p<0.01 * Signifi cant at p<0.05 (2) Test Chi 2 of Pearson of independence. ** Signifi cant at p<0.01 * Signifi cant at p<0.05.
Table 84. Distribution of Persons with Disability and Non-Disabled above 14 according to the Money Lender
Lender† Persons with Disability Non-Disabled Total
Husband/wifeNumber 1949 23904 25853
% in type of money lender 0.6 0.4 0.4
Father/motherNumber 6496 104577 111073
% in type of money lender 2.0 1.7 1.7
Brother/sisterNumber 37024 433381 470405
% in type of money lender 11.3 7.1 7.3
Child/other relativeNumber 131860 2267716 2399576
% in type of money lender 40.3 37.0 37.2
FriendNumber 118869 2961567 3080436
% in type of money lender 36.3**(1) 48.3**(1) 47.7
Local/religious leaderNumber 7145 76387 83532
% in type of money lender 2.2 1.2 1.3
Bank/lender/NGO/otherNumber 43524 387393 430917
% in type of money lender 13.3**(1) 6.3**(1) 6.7
Total Number 327380**(2) 6130731**(2) 6458111
Source: NDSA. Note: † Weighted by the population of the province. (1) Test of comparison of proportion between Persons with Disabilities and Non-Disabled. ** Signifi cant at p<0.01 * Signifi cant at p<0.05 (2) Test Chi 2 of Pearson of independence. ** Signifi cant at p<0.01 * Signifi cant at p<0.05.

103Annexure
Tables Related to Social Income
Table 85. Distribution of Persons with Disability and Non-Disabled above 14 Having Received Money according to Gender
Disability or Not Gender† Received Not Received Total
Non-Disabled
MalesNumber 1820565 4780184 6600749
% in gender 27.6**(1) 72.4 100.0
FemalesNumber 2533513 2044530 4578043
% in gender 55.3 44.7 100.0
TotalNumber 4354078 6824714 11178792
% in Non-Disabled 38.9**(2) 61.1**(2) 100.0
Persons with Disability
MalesNumber 111723 148098 259821
% in gender 43.0**(1) 57.0 100.0
FemalesNumber 85091 88339 173430
% in gender 49.1 50.9 100.0
TotalNumber 196814 236437 433251
% in Persons with Disabilities 45.4**(2) 54.6**(2) 100.0
Source: NDSA. Note: † Weighted by the population of the province. (1) Test of comparison of proportion between Persons with Disabilities and Non-Disabled. ** Signifi cant at p<0.01 * Signifi cant at p<0.05 (2) Test Chi 2 of Pearson of independence. ** Signifi cant at p<0.01 * Signifi cant at p<0.05.
Table 86. Distribution of Persons with Disability and Non-Disabled above 14 Having Received Money according to Donors
Donors Non-Disabled†
Persons with Disability Total
Husband/wifeNumber 542 88 630
% in donor category 27.8** 19.7** 26.3
Father/motherNumber 564 80 644
% in donor category 28.9** 17.9** 26.9
Brother/sisterNumber 453 101 554
% in donor category 23.2 22.6 23.1
Other family memberNumber 212 110 322
% in donor category 10.9** 24.6** 13.4
FriendsNumber 106 24 130
% in donor category 5.4 5.4 5.4
State pensionNumber 6 4 10
Percent 0.3 0.9 0.4
Local or religious leaderNumber 4 12 16
% in donor category 0.2** 2.7** 0.7
Employer, NGOs or otherNumber 62 28 90
% in donor category 3.2** 6.3** 3.8
Total Number 1949 447 2396
Source: NDSA. Note: † Weighted by the number of members of households above 14 years old for Non-disabled. Three answers were possible. (1) Test of comparison of proportion between Persons with Disabilities and Non-Disabled. ** Signifi cant at p<0.01 * Signifi cant at p<0.05

104 Understanding Vulnerability of Afghans with Disability
Table 87. Distribution of Persons with Disability and Non-Disabled above 14 Having Received Money according to the 3 Main Donors
Donors†
First Answer Second Answer Third Answer
Non-Disabled
Persons with
DisabilityTotal Non-
Disabled
Persons with
DisabilityTotal Non-
Disabled
Persons with
DisabilityTotal
Husband/wifeNumber 1596339 43520 1639859 334000 10393 344393 230981 3248 234229
% in donor category 36.7 21.9 36.0 22.3 14.0 21.9 66.6 18.5 64.3
Father/motherNumber 1126583 42221 1168804 214872 6496 221368 20786 3248 24034
% in donor category 25.9 21.2 25.7 14.3 8.8 14.1 6.0 18.5 6.6
Brother/sisterNumber 848185 40272 888457 513926 21435 535361 19616 3897 23513
% in donor category 19.5 20.3 19.5 34.3 28.9 34.1 5.7 22.2 6.5
Child or other family member
Number 403632 42221 445853 276449 24033 300482 57290 5196 62486
% in donor category 9.3 21.2 9.8 18.5 32.5 19.1 16.5 29.6 17.1
FriendsNumber 254495 9743 264238 72230 5846 78076 8444 0 8444
% in donor category 5.8 4.9 5.8 4.8 7.9 5.0 2.4 0.0 2.3
State pensionNumber 13641 1949 15590 0 0 0 0 650 650
% in donor category 0.3 1.0 0.3 0 0 0 0.0 3.7 0.2
Local leaderNumber 0 3897 3897 7145 1949 9094 0 1299 1299
% in donor category 0.0 2.3 0.1 0.5 2.6 0.6 0.0 7.4 0.4
NGOs, employeror other
Number 111203 14290 125493 79375 3897 83272 9743 0 9743
% in donor category 2.6 7.2 2.8 5.3 5.3 5.3 2.8 0.0 2.7
Total Number 4354078 198763 4552841 1497997 74049 1572046 346860 17538 364398
Source: NDSA. † Weighted by the population of the province.
Table 88. Distribution of Persons with Disability and Non-Disabled above 14 Having Received Money according to the Donors and Gender
Disability Gender† Husband/
WifeFather
/MotherBrother/
Sister Child Friends State Pension
Local or Religious Leader
NGO or Other Total
Non-Disabled
MalesNumber 76647 909113 648773 355044 260989 13641 43520 638249 2945976
% in gender 2.6 30.9 22.0 12.1 8.9 0.5 1.5 21.7 100.0
FemalesNumber 2084673 453128 732955 382326 74179 7145 35855 980694 4750955
% in gender 43.9 9.5 15.4 8.0 1.6 0.2 0.8 20.6 100.0
TotalNumber 2161320 1362241 1381728 737370 335168 20786 79375 1618943 7696931
% in Non-Disabled 28.1 17.7 18.0 9.6 4.4 0.3 1.0 21.0 100.0
Persons with Disability
MalesNumber 6496 34426 44170 39623 13640 3898 7795 50665 200713
% in gender 3.2 17.2 22.0 19.7 6.8 1.9 3.9 25.2 100.0
FemalesNumber 50665 17537 21435 31827 1949 650 1950 37675 163688
% in gender 31.0 10.7 13.1 19.4 1.2 0.4 1.2 23.0 100.0
TotalNumber 57161 51963 65605 71450 15589 4548 9745 88340 364401
% in Person with Disability 15.7 14.3 18.0 19.6 4.3 1.2 2.7 24.2 100.0
Total Number 2218481 1414204 1447333 808820 350757 25334 89120 1707283 8061332
Source: NDSA. † Weighted by the population of the province.

105Annexure
Table 89. Distribution of Persons with Disability and Non-Disabled above 14 Having Received Money according to Amounts
Money Received by Year in Quartiles† Non-Disabled Persons with Disability Total
Less than 700 AFAsNumber 1110214 50665 1160879
% in amount category 25.7 27.1 25.8
710 to 3200 AFAsNumber 1048377 48716 1097093
% in amount category 24.3 26.0 24.4
3300 to 12000 AFAsNumber 1147629 46118 1193747
% in amount category 26.6 24.7 26.5
12030 AFAs and aboveNumber 1007715 41571 1049286
% in amount category 23.4 22.2 23.3
Total Number 4313935 187070 4501005
Source: NDSA. Note: † Weighted by the population of the province. (1) Test of comparison of proportion between Persons with Disabilities and Non-Disabled. ** Signifi cant at p<0.01 * Signifi cant at p<0.05. (2) Test Chi 2 of Pearson of independence. ** Signifi cant at p<0.01 * Signifi cant at p<0.05.
Table 90. Distribution of Persons with Disability and Non-Disabled above 14 Having Received Money according to Amounts and Gender
Disability Gender† Less than 700 AFAs
710 to 3200 AFAs
3300 to 12000 AFAs
12030 AFAs and Above Total
Non-Disabled
MalesNumber 222926 450919 653709 452868 1780422
% in gender 12.5 25.3 36.7 25.4 100.0
FemalesNumber 887288 597458 493919 554847 2533512
% in gender 35.0 23.6 19.5 21.9 100.0
TotalNumber 1110214 1048377 1147628 1007715 4313934
% in Non-Disabled 25.7 24.3 26.6 23.4 100.0
Persons with Disability
MalesNumber 25333 25982 26632 26632 104579
% in gender 24.2 24.8 25.5 25.5 100.0
FemalesNumber 25333 22734 19487 14940 82494
% in gender 30.7 27.6 23.6 18.1 100.0
Total
Number 50666 48716 46119 41572 187073
% in Persons with Disabilities
27.1 26.0 24.7 22.2 100.0
Source: NDSA. Note: † Weighted by the population of the province. (1) Test of comparison of proportion between Persons with Disabilities and Non-Disabled. ** Signifi cant at p<0.01 * Signifi cant at p<0.05. (2) Test Chi 2 of Pearson of independence. ** Signifi cant at p<0.01 * Signifi cant at p<0.05.

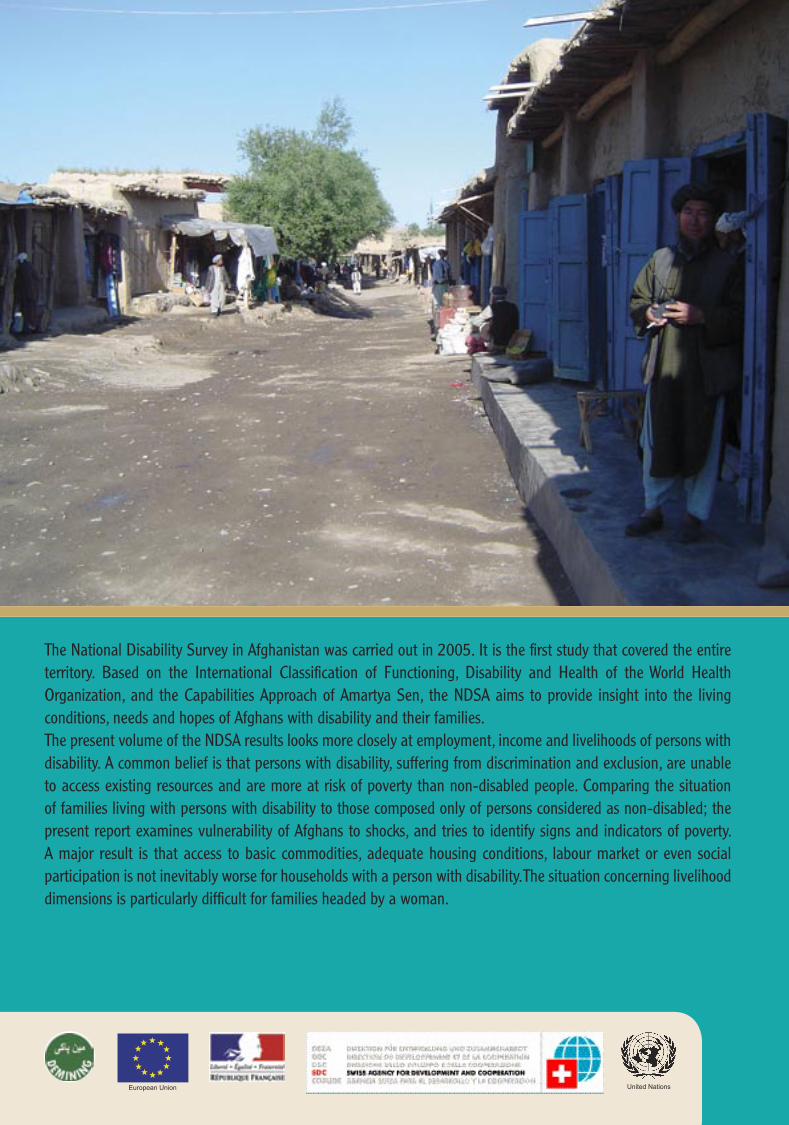
The National Disability Survey in Afghanistan was carried out in 2005. It is the fi rst study that covered the entire territory. Based on the International Classifi cation of Functioning, Disability and Health of the World Health Organization, and the Capabilities Approach of Amartya Sen, the NDSA aims to provide insight into the living conditions, needs and hopes of Afghans with disability and their families.The present volume of the NDSA results looks more closely at employment, income and livelihoods of persons with disability. A common belief is that persons with disability, suffering from discrimination and exclusion, are unable to access existing resources and are more at risk of poverty than non-disabled people. Comparing the situation of families living with persons with disability to those composed only of persons considered as non-disabled; the present report examines vulnerability of Afghans to shocks, and tries to identify signs and indicators of poverty. A major result is that access to basic commodities, adequate housing conditions, labour market or even social participation is not inevitably worse for households with a person with disability. The situation concerning livelihood dimensions is particularly diffi cult for families headed by a woman.
United NationsEuropean Union
NATIONAL DISABILITY SURVEY IN AFGHANISTAN, 2005 UNDERSTANDING VULNERABILITY OF AFGHANS W
ITH DISABILITY
UNDERSTANDING VULNERABILITY OF AFGHANS WITH DISABILITY
LIVELIHOODS, EMPLOYMENT, INCOME
Islamic Republic of Afghanistan
NATIONAL DISABILITY SURVEY IN AFGHANISTAN 2005