isign media solutions inc. -...
TRANSCRIPT

ATTRACT . TRANSACT . MEASURE .
iSIGN Media Solutions Inc.
Management’s Discussion & Analysis For the Years Ended April 30, 2014 and 2013
ISIGN MEDIA SOLUTIONS INC.
Management’s Discussion & Analysis
For the Year Ended April 30, 2014
1
This Management Discussion and Analysis (“MD&A”) provides relevant information on the operations and financial condition of iSIGN Media Solutions Inc. (the “Company” or “iSIGN”) for the year ended April 30, 2014. This MD&A should be read in conjunction with the audited consolidated financial statements for the year ended April 30, 2014. This discussion contains forward looking information that is qualified by reference to, and should be read in conjunction with the Caution Regarding Forward Looking Statements below. This MD&A provides information that the management of iSIGN believes is important to assess and understand the results of operations and financial condition of the Company. Our objective is to present readers with a view of iSIGN from management’s perspective by interpreting the material trends and activities that affect the operating results, liquidity and financial position of iSIGN. All monetary amounts unless otherwise specified are expressed in Canadian dollars. Additional information relating to iSIGN is available on SEDAR, at www.sedar.com. The common shares of the Company are listed for trading on the TSX Venture Exchange under the trading symbol ISD‐V. In addition, iSIGN is also listed on the OTCQX Exchange, under the trading symbol ISDSF. Information on the Company is also found on the OTCQX site at www.otcmarkets.com. For more information on the Company, please visit our website at www.isignmedia.com. This MD&A is current as of August 27, 2014. iSIGN’s audited consolidated financial statements have been prepared in accordance with International Financial Reporting Standards (“IFRS”). Caution Regarding Forward‐Looking Statements Readers are cautioned that actual results may differ materially from the results projected in any “forward‐looking” statements included in the foregoing report, which involve a number of risks or uncertainties. This MD&A contains “forward‐looking statements” and “forward‐looking information” within the meaning of the applicable Canadian securities legislation. Forward‐looking statements are not historical facts and include statements regarding the Company’s planned development activities, anticipated future profitability, losses, revenues, expected future expenditures, the Company’s intention to raise new financing, sufficiency of working capital for continued operations and other statements regarding anticipated future events and Company’s anticipated future performance. Generally, these forward‐looking statements can be identified by the use of forward‐looking terminology such as “plans”, “expects” or “does not expect”, “is expected”, “budget”, “scheduled”, “estimates”, “forecasts”, “intends”, “continue”, “anticipates” or “does not anticipate”, or “believes” or variation of such words and phrases or state that certain actions, events or results “may”, “could”, “would”, “might” or “will be taken”, “occur” or “be achieved”. All forward‐looking statements are based on our beliefs and assumptions based on information available at the time the assumption was made. While iSIGN considers its assumptions to be reasonable and appropriate based on the current information available, there is a risk that they may not be accurate. Forward‐looking statements are subject to known and unknown risks, uncertainties and other factors that may cause the actual results, level of activity, performance or achievement of iSIGN to be materially different from those expressed or implied by such forward‐looking statements, including but not limited to risks related to the integration of acquisitions, as well as those factors discussed in the section entitled “Risk Factors” in this MD&A. Before making any investment decisions and for a detailed discussion of the risks, uncertainties and environment associated with our business, fully review the section entitled “Risk Factors” in this MD&A.

ISIGN MEDIA SOLUTIONS INC.
Management’s Discussion & Analysis
For the Year Ended April 30, 2014
2
Caution Regarding Forward‐Looking Statements – continued Although management has attempted to identify important factors that could cause actual results to differ materially from those contained in forward‐looking statements, there may be other factors that cause results not to be as anticipated, estimated or intended. There can be no assurance that such statements will prove to be accurate, as actual results and future events could differ materially from those anticipated in such statements. Accordingly, readers should not place undue reliance on forward‐looking statements. iSIGN does not undertake to update any forward‐looking statements that are incorporated by reference herein, except as required by law. Outlook The past fiscal year has seen the Company move forward in a number of different ways: (i) New Directors, with specialized skill sets were brought on board to bring to the Company strategic resources and industry networking abilities. (ii) The Company is transitioning from a strict Software as a Service ("SaaS") company to an SaaS company with a data product that can be monetized. (ii) New resellers have been signed and are actively promoting our Smart Antennas and Players as well as our technology. (iii) An agreement has been signed with POS Canada to develop a mutual solution to integrate mobile messaging with point‐of‐sale data. (iv) Our first purchase order for data was received ($500,000) and the initial delivery of data was received and paid for. (v) Development of our Smart Player unit, that allows for the management of two digital signs and simultaneous delivery of messaging to mobile devices. (vi) Placing of orders for the manufacture of Smart Antennas and Players and receipt of units and the production of Smart Player prototype units. (vii) Regular and on‐going promotion of proximity marketing and iSIGN by our PR companies that have expanded knowledge of the industry and our Company throughout the United States and Canada, as well as internationally. In addition, the granting by the United States Patent and Trademark Office on May 16, 2014 of patent status for the Company's "method and system for out‐of‐home proximity marketing and for delivering awareness information" has allowed iSIGN to move forward with certain companies and organizations who were interested in the Company's technology, but were concerned over the lack of patent protection. The production of our Smart Player prototypes and receipt of our US Patent, enabled us to finalize the signing of a reseller agreement with Keyser Industries Inc. (“Keyser”) in July 2014 that allows Keyser to market and sell our hardware and software technology throughout the United States. In addition to Alex Romanov, our Board now consists of: Prakash Shukla, currently a partner in Hand On Ventures LLC, with over 25 years of experience in general management with a background in building and managing multi‐faceted businesses; Asad Sultan, Managing Partner, Tantrik Group, a veteran investment banker; Dave Rodgerson, Retail Industry Development Leader at Microsoft and a past senior executive at IBM where he focused on the retail industry; and Bruce Reilly (also iSIGN's CFO), a Chartered Accountant (1985) who has considerable experience in the financial management of TSX‐Venture listed companies and has successfully developed and continues to manage a chartered professional accounting firm. For a more in‐depth profile of our Directors, we encourage you to visit our website www.isignmedia.com. Over the past years, the Company has successfully demonstrated the ability of its technology to gather metrics in sufficient volumes with substantial redemption rates under trial conditions, to promote the installation and activation of its Smart Antennas. Trials with potential clients are now focused on shoppers' interactions with clients' content and acceptance of the concept of mobile messaging in the client's specific environment, not on whether the concept of mobile messaging works. The Company anticipates that this will result in revenues from the signing of contracts for installations of our products and the related on‐going recurring monthly fees; this will enable the steady accumulation of data which will give rise to the resulting revenue stream from data sales.
ISIGN MEDIA SOLUTIONS INC.
Management’s Discussion & Analysis
For the Year Ended April 30, 2014
3
Outlook ‐ continued Through the on‐going efforts of our two public relations companies, we continue to receive a substantial amount of press, including articles and interviews. This press, as well as our corporate networking and trade show attendance continues to bring us an increasing amount of attention and growing inquiries from business on our technology and our hardware products. Increasingly we are finding that this attention is focused more on our data gathering capabilities and that potential resellers and customers are concentrating on our ability to gather "Clean Data" (data that is entirely anonymous with regards to shoppers' privacy, capturing absolutely no personal information), while gathering potentially valuable information that is both preference based and predictive on a variety of interactions with shoppers' mobile devices. The introduction of the iBeacon during the past year has helped to 'legitimize' the profile of proximity marketing and has brought many inquiries to us from companies anxious to understand the differences between our two vastly different products and our advantages and strengths as compared to iBeacon. During the last half of our fiscal year, we added several large, well‐known companies as resellers of our hardware and technology: (i) Speech and Software Technologies (“SST”), a leading product‐engineering global IT service provider, located in India; (ii) Magnetic Media Holdings, Inc. “Magnetic 3D”), an industry leader in the field of glasses‐free 3D digital signage media and creative services, located in New York City; (iii) Dynamic Digital Strategic Solutions, LLC (“DDS”), an industry leader in the field of automated equipment, ATM and the digital signage industry and (iv) JEA Technologies (“JEA”), located in Australia, the largest supplier of OE hardware to Australian and New Zealand manufacturers in a variety of industries that are suited to iSIGN's hardware and technology solutions. iSIGN and POS Canada Inc. (“POS”), a full service provider of advanced technology support services, system customization, installations and ongoing systems support and customer education, joined forces to develop a mutual solution to integrate mobile messaging with data from point‐of‐sale installations. This world first technology will allow companies to close the loop between mobile messaging and related purchases, all in real‐time. In addition, it will enhance the data that our technology gathers by tying it to point‐of‐sale data. Experts from Baylor University/Hankamer School of Business have stated the Company's data has potential commercial value ranging from $0.20 for simple mobile insights to upwards of $4 for mobile insights integrated with point‐of‐sale information. The Company has shared samples of data/insights with its significant business partner that packages and sells data to global marketing customers and generally the commercial value ranges have been confirmed as realistic. Early in the fiscal year, iSIGN migrated data storage to the cloud, so that as the Company's amassed data grows in the future, it can facilitate access of significantly more data to its data‐partners and customers. During the quarter ended January 31, 2014, iSIGN received from SST, a $500,000 purchase order for its mobile data, gathered from all sources. The first transfer of data, valued at $50,000, has been sent to Newcomp Analytics for research purposes. The continued monetization of this order requires the delivery of point‐of‐sale data, that the Company expects to obtain by the end of the third quarter of fiscal 2015. The cost to the Company from its data partner for analysis and evaluation purposes is estimated at approximately 10% of the purchase order value. During the quarter ended January 31, 2013, the Company received a purchase order from its exclusive distributor for the Americas, Graphic Media, Inc. (“Graphic”) for 6,000 Smart Antennas, subject to build and delivery arrangements. During this same quarter, an initial delivery of 500 units was delivered. From this original shipment of 500 units, Graphic installed into the National Oil/Marathon Convenience Stores chain as well as trial installations. In fiscal 2014, Graphic made a written request for the remaining 5,500 units from their November 2012 purchase order. This request is for a mix of Smart Antennas and Smart Players and is subject to the production of units. Late in fiscal 2014, the Company started to take delivery of the 1,500 Smart Antennas that it had ordered during the year. The full delivery of these units was received by the end of August 2014.
ISIGN MEDIA SOLUTIONS INC.
Management’s Discussion & Analysis
For the Year Ended April 30, 2014
4
Outlook – continued Subsequent to the Company's fiscal year‐end, JEA, our Australian reseller expressed a desire to upgrade their status to that of Distributor. A Distributor agreement was finalized with an effective date of June 15, 2014. On July 28, 2014, the Company announced that Keyser signed an agreement to both resell and market iSIGN's hardware and technology. This agreement is in addition to the exclusive installation and deployment rights agreement that iSIGN and Keyser signed in December 2014 that granted Keyser the exclusive rights to installation and deployment in the Quick Service Restaurant (“QSR”) channel. On May 28, 2014, iSIGN announced an Agreement in Principal to acquire POS. As of the date of this MD&A, both parties are continuing to work through the various documents required to complete the terms of the purchase agreement and finalize the acquisition. Some of our specific opportunities for revenues are as follows:
JEA Technologies Pty Ltd. – became an iSIGN reseller in Australia and New Zealand in late March 2014 and our exclusive distributor in Australia in June 2014.
Dynamic Digital Strategic Solutions, LLC – became an iSIGN reseller in March 2014 and will be enhancing their own line of products with iSIGN's technology and hardware.
Magnetic Media Holdings, Inc. – became an iSIGN reseller in March 2014 and will be selling our proximity‐marketing technology and hardware in conjunction with their own line of products.
POS Canada Inc – will be working with iSIGN to integrate mobile messaging with point‐of‐sale data, to provide business intelligence by providing analytic tools to help retailers determine various trends. The resulting integration of mobile and point‐of‐sale data, resulting from the development of the exclusive Point of Sales Data Acquisition (“PDAQ”) software interface, will result in additional patent applications and to result in higher data sales values of upwards of $4 per insight as stated by experts from the Baylor University/Hankamer School of Business.
Speech and Software Technologies (1) PVT. Ltd. – signed an exclusive distributor and reseller agreement for 7 years to distribute and sell all iSIGN products and data in India and other southeast Asian countries in November 2013. SST issued a $500,000 purchase order for our mobile data, gathered from all sources. The first data transfer, valued at $50,000 has been forwarded to Newcomp Analytics for research purposes. Should the initial trial of data prove to be successful and meets with the customers' expectation, iSIGN will continue to release additional data until the contract is entirely completed. The continued monetization of this order requires the delivery of point‐of‐sale data that the Company expects to obtain by the end of the third quarter of fiscal 2015. The integration of mobile and point‐of‐sale data is expected to result in higher sales prices as stated by Baylor University/Hankamer School of Business.
Graphic Media, Inc. – is iSIGN's exclusive master distributor for the Americas in addition to having acquired the exclusive rights to various territories in the United States for sales purposes. They have secured sales partners in four key markets ‐ Southern California, Texas, Minnesota and Georgia. In addition, Graphic has created the National Mobile Network (“NMN”), an advertiser‐supported network that partners with independent convenience stores to enable the convenience stores to engage customers via their mobile devices. Graphic's goal, as previously announced, is to have a 10,000 Smart Antenna/Player network, with 3,000 locations installed by calendar year‐end 2014, targeting 25 million mobile devices per day.
ISIGN MEDIA SOLUTIONS INC.
Management’s Discussion & Analysis
For the Year Ended April 30, 2014
5
Outlook – continued
Graphic Media, Inc. – continued – Graphic was instrumental in arranging an agreement with National Oil and Gas, Inc. for the installation and deployment of the Company's Smart Antennas in various locations in Indiana and Ohio. During the quarter ended January 31, 2013, the Company received a purchase order from Graphic for 6,000 Smart Antennas, subject to final procurement and delivery arrangements. The initial delivery of 500 units towards this order occurred during the same period. Graphic continues to deploy units from its initial order of 500 and in fiscal 2014, made a written request for the 5,500 units remaining from their November 2012 purchase order. This request is for a mix of Smart Antennas and Smart Players and is subject to the production of units. On August 20, 2014, Graphic announced a restructuring and planned expansion of the NMN, which announced the management structure of a separate entity, Engage Mobile Media Solutions (“Engage”) to sell third party advertising on the Smart Antenna/Smart Player units located in the NMN. Engage’s staff consists of proven media and advertising executives as well as a data intelligence team. Graphic announced that their expectations were that the NMN would expand to 10,000 locations by the end of calendar 2015 and 25,000 locations by the end of 2016 and that they were currently raising funds in the United States to finance this expansion. Data generated by all of Graphic’s installations will be stored and sold by iSIGN.
Keyser Industries Inc. – Reseller in the United States and provider of services including digital menu‐signage to the QSR industry. ‐ was introduced to iSIGN by Graphic. In December 2012, iSIGN and Keyser signed an agreement appointing Keyser as the exclusive provider of installation and deployment services for Smart Antennas and related software in similar territories to the Graphic distribution agreement for the QSR field. In July 2014, Keyser became a reseller of our hardware and technology and signed a partnership agreement with both the Company and Graphic. It is anticipated that Keyser will be our core customer for the Company's Smart Player for their QSR clients.
Baylor University – On November 21, 2012, the Company entered into a memorandum of understanding with Baylor University for the establishment of an agreement for research and business development collaborations on market metrics that are developed from the consumer response data gathered by the Company's various installations. Baylor's analysis of iSIGN's data and the resulting published metrics results gives the Company an independent party's soft 'certification' of the Company's metrics from an internationally recognized university that other competitors have not obtained.
Chinney Concepts Ltd. LOI – Under the terms of the LOI, Chinney would become the Company's licensed partner, reseller and a technology provider of iSIGN's products in an area to include mainland China, Hong Kong, Macau and Taiwan, and software to Chinney's existing and prospective customers, including exclusively for four of Asia's top convenience store chains: 7/11, Family Mart, Lawson and Circle K, with approximately 39,000 locations. Chinney has advised that they are waiting on the delivery of a Smart Player for testing before they come to a final decision.
Generally the opportunities discussed under the 'Outlook' section are on a best efforts basis and there is no guarantee that any of these potential deals will be successful and result in significant future revenues.

ISIGN MEDIA SOLUTIONS INC.
Management’s Discussion & Analysis
For the Year Ended April 30, 2014
6
Financial Highlights Summary Results In the year ended April 30, 2014, revenues decreased by $490,153 from fiscal 2013 and the net loss reported by the Company decreased by $2,999,020. The loss per share at April 30, 2014 was $0.032 compared to $0.081 at April 30, 2013. The following table details the financial highlights for fiscal years ended April 30, 2014 and 2013.
Accounting Policy iSIGN reports outlays on research activities as an expense in the period in which it is incurred. Once an internal project transitions from the research phase to the development phase, it is then recorded as an internally generated intangible asset if, and only if, all of the following have been demonstrated: (i) the technical feasibility of completing the intangible asset so that it will be available for use or sale; (ii) the intention to complete the intangible and use or sell it; (iii) the ability to use or sell the intangible asset; (iv) the availability of adequate
2014 2013 Increase/(Decrease)
Revenues
Sales $ 2,235 $ 415,750 $ (413,515)
Services 613,111 689,749 (76,638)
$ 615,346 $ 1,105,499 $ (490,153)
Gross Margin (Loss) (112,872) 30,032 (142,904)
Gross Margin (Loss) Percentage ( 18.3)% 2.7%
Expenses
Selling and marketing $ 618,763 $ 932,005 $ (313,242)
General and administration 1,573,404 1,868,450 (295,046)
Bad debt recovery (9,625) 128,155 (137,780)
Impairment – other receivable ‐ 4,605 (4,605)
Depreciation – property and equipment 49,575 444,870 (395,295)
Amortization – intangibles 470,444 586,816 (116,372)
Impairment – interactive media devices 51,203 ‐ 51,203
Research ‐ 111,772 (111,772)
Impairment – goodwill ‐ 567,549 (567,549)
Impairment – digital signage 380,902 897,000 (516,098)
Loss on disposal of fixed assets 5,089 ‐ 5,089
Interest 31,623 23,883 7,740
$ 3,171,378 $ 5,565,105 $ (2,393,727)
Loss before undernoted items (3,284,250) (5,535,073) 2,250,823
Gain on debt settlement 426,592 ‐ 426,592
Provision for deferred tax recovery 433,005 111,400 321,605
Net loss and comprehensive loss $ (2,424,653) $ (5,423,673) $ 2,999,020
ISIGN MEDIA SOLUTIONS INC.
Management’s Discussion & Analysis
For the Year Ended April 30, 2014
7
Financial Highlights – continued Accounting Policy ‐ continued technical, financial and other resources to complete the development and to use or sell the intangible asset; and (vi) the ability to measure reliably the expenditure attributable to the intangible asset during its development. The amount initially recognized for internally‐generated intangible assets is the sum of the expenditure incurred from the date when the intangible asset first meets the recognition criteria listed above. Further, the intangible asset is evaluated to determine if it has a finite or indefinite life. If the asset has a finite life the estimated useful life is determined when the asset is available for use. Intangible assets that have an indefinite life are not subject to amortization. Where no internally–generated intangible asset can be recognized, development expenditures are recognized in profit or loss in the period in which it is incurred. Subsequent to initial recognition, internally‐generated intangible assets are reported at cost less accumulated amortization and accumulated impairment losses, on the same basis as intangible assets that are acquired separately. The Company has determined that criteria required to capitalize these costs have been demonstrated at the start of fiscal 2014. In fiscal 2014, $419,550 was capitalized as technology development costs (2013 ‐ Nil) and $716,907 was capitalized as data development costs (2013 ‐ Nil). The Company anticipates continuing with this accounting policy and capitalizing these costs until the development phase is complete as demonstrated by iSIGN’s products being available for use and additional sales orders being received. As a result, the comparability of expenses from year to year and quarter to quarter is affected. Comments in the following sections, as they relate to costs, are ignoring the effect of the set‐up of our data development intangible asset. Discussion ‐ Financial Results Revenues
Sales – revenues are derived from the sale of digital signage equipment and Smart Antennas. The Company's major customer for Smart Antenna sales in fiscal 2013 had inventory on hand from its purchase of 500 units in the quarter ended January 31, 2013 and had no need for additional product in fiscal 2014. Digital signage equipment sales are to a municipal customer in Calgary Alberta, whose contract expires in May of 2014.
Services – revenues are derived from advertising, monthly recurring fees and data. Advertising revenues, made predominantly through two commissioned resellers, are for the digital signage networks within Mac's Convenience Stores/Couche‐Tard (“Mac’s”) and city of Calgary Municipal locations. Advertising revenues for fiscal 2014 were $523,224 (2013 ‐ $665,319). Monthly recurring fees for the Company's mobile installations were $40,810 for fiscal 2014 (2013 ‐ $24,430). Data revenue for fiscal 2014 was $49,077 (2013 ‐ nil). Advertising revenue in fiscal 2014 was adversely affected by the financial difficulties and eventual bankruptcy of the Company's major reseller and the financial difficulties that the Company's other reseller has been experiencing since midway through fiscal 2014.
Gross Margin (Loss) and Percentage
Gross margin is impacted by the product mix and revenue volumes recorded during the periods, as well as by the Company's fixed and variable costs. Future gross margins and percentages will depend on the mix of hardware, monthly licensing and digital signage advertising revenues. Fixed costs include outsourced services.
ISIGN MEDIA SOLUTIONS INC.
Management’s Discussion & Analysis
For the Year Ended April 30, 2014
8
Financial Highlights – continued Discussion ‐ Financial Results – continued Gross Margin (Loss) and Percentage ‐ continued
Variable costs include the cost of resold hardware and repairs and maintenance costs. Gross margin for fiscal 2014 decreased from fiscal 2013 primarily as a result of significantly reduced hardware sales. Costs in fiscal 2014 increased over the prior year mainly due to: (i) a scheduled increase in contractual digital‐screen content management costs; (ii) increased costs associated with repairs and maintenance of the Company's aging digital network; (iii) increased costs for server hosting; and (iv) reclassified expenses ‐ effective July 1, 2013 services that were previously handled by a mix of salaried and contractual staff were outsourced to a third party supplier who handled the servicing and maintenance of the digital signage network services, including some management administration expenses, previously reported under our general and administrative costs.
Bad Debt Recovery
The bad debt recovery relates to one of our commissioned advertising reseller for the digital signage network and is an adjustment based on having received payments that reduced the allowance required for this specific reseller.
Goodwill Impairment
During fiscal 2013, Goodwill impairment was recognized in accordance with IFRS requirements as a result of the lower than anticipated advertising revenues generated by the digital signage network located in the Mac's convenience store chain.
Interactive Media Devices and Digital Signage Impairment
Accounting policies require companies to review their asset values to future cash flows. Based on management’s review of the cash flows from the Mac’s network, management elected to record an impairment on the remaining book value of the digital signage and interactive media device assets, with these assets being the book value of the contract with Mac’s and the Bluetooth only broadcasting units installed in the Mac’s chain.
Other discussion on financial line‐items is presented in the "Results" section of the Management, Discussion and Analysis. Business, Products and Strategy iSIGN is transitioning from a strict SaaS company to an SaaS company with an exceptionally strong focus on data that collects shopper preferences so that brands can deliver targeted messaging and personalized offers to consumers' mobile devices, in‐location and in real‐time. The Company's interactive proximity‐marketing technology is capable of gathering data on price points, typical purchases, in‐store dwell time and other shopper metrics to deliver business intelligence and insights into emerging consumer behaviors that can help brands make better business decisions and measure their marketing efforts. Utilizing Bluetooth and Wi‐Fi to deliver relevant and timely messaging to any screen or mobile device, iSIGN serves rich media, permission‐based messages free of charge to consumers that can drive immediate brand engagement, increased customer loyalty and deliver higher ROI on marketing dollars spent. Additionally, we gather "Clean Data" (data that is entirely anonymous with regards to shoppers' privacy, capturing absolutely no personal information), while gathering potentially valuable information that is both preference based and predictive on a variety of interactions with shoppers' mobile devices. The Company completed its Smart Antenna platform development in late February of 2012, with the first delivery of units being in May 2012. The Smart Antenna is a single all weather antenna unit capable of withstanding
ISIGN MEDIA SOLUTIONS INC.
Management’s Discussion & Analysis
For the Year Ended April 30, 2014
9
Business, Products and Strategy – continued extreme weather temperatures, that can broadcast to mobile devices simultaneously by Wi‐Fi and Bluetooth. This product addresses prospective clients' requests for a product that would reach iPhones, iPads and other Wi‐Fi capable devices. The Smart Antenna appears as a free and open access point to mobile device users. As users simply connect to the Smart Antenna and view content within the web browser that is available on their phone, there is no requirement to download anything to the mobile device in order to view mobile web content, which can include coupons, product info, videos, and games. Content can be interactive and support user polling and loyalty membership management. During fiscal 2014, the Company began development of its second standalone proximity marketing product, the Smart Player. The Smart Player combines media and customer engagement tools into a single solution. A first for the digital signage industry, iSIGN’s Smart Player combines digital signage and mobile messaging with real‐time measurement of shopper responses, delivered in a unique, cost‐effective package that distributes marketing messages to all screens and devices – whether mobile or stationary ‐ in proximity to a location. In addition, the Smart Player adds wireless connectivity that traditional digital players do not offer. Each Smart Player can manage two digital signs as well as content, combining network management software and wireless connectivity for easy and fast installations. The Smart Player also incorporates the iSIGN Smart Antenna that can message all mobile devices that come within its set proximity and retrieve customer responses for real‐time or future analysis. Opportunities in proximity marketing have emerged as the logical intersection of three trends: The first trend is the swift advent of mobile culture. Today's consumers increasingly leverage mobile phones as a de facto portal to the world; the primary interface available anywhere at any time. Through their mobile devices they conduct research, connect and share with others, and in many cases make purchasing decisions. The second trend is digital signage, which provides a dynamic opportunity for retailers to promote their brands, their products, and their services via the full power of a multimedia solution. Third, the expanding commercialization of "Big Data". Marketing and Pricing The Company has entered into an exclusive distributorship agreement with Graphic, an experienced digital sign provider based out of Bluffton, Indiana as its exclusive distribution partner in North America for the Smart Antenna and the upcoming Smart Player. Graphic, in consultation with iSIGN is currently retaining sales agents and non‐exclusive resellers to cover specific regions and channels in the U.S. Graphic will compensate the agents and resellers with a combination of commission incentive, as well as residual participatory compensation based on monthly network licensing and access fees. Pricing has been established on a distributor, reseller and end client basis. Graphic has recently created a sales arm, Engage, to obtain third party advertising for the existing and future installations of units in the NMN channels, including convenience stores/gas stations, drug stores, grocery stores and other retailers. The QSR channel is not considered to be a part of the NMN as it is expected that QSRs will not want third party advertising on their networks. The Company's price lists provide two options for customers. The first is that customers can pay a one‐time up‐front fee for the device with monthly payments for the software license and network access fee. The second option is that the hardware, software license and network access fee can be incorporated under a single monthly

ISIGN MEDIA SOLUTIONS INC.
Management’s Discussion & Analysis
For the Year Ended April 30, 2014
10
Business, Products and Strategy – continued Marketing and Pricing – continued payment. As this second option reduces the customer’s upfront costs, we anticipate a growing demand for this pricing option. Based upon a review of our gathered mobile data, Dr. J. Tanner of Baylor University/Hankamer School of Business, estimates that the minimum commercial value of our data insights is $0.20 per insight. Potentially, the ability to link insights to additional information (point‐of‐sale data) could increase the commercial value of context based insights to a range of $1.40 to $2.00 per linked‐insight. If integrated into customers’ loyalty programs, where customers’ permission‐based identifications are included, these insights could have a commercial value range of $3 to $4 per integrated insight. The Company anticipates one‐off sales of data insights in packages and potentially a subscription based pricing for streaming data/insights monthly service. Technology Development Strategy ‐ Research and New Product Development iSIGN continually develops its technology with internal resources, and where necessary with its business partners. The Company has a full‐time contract with the original architect of the iSIGN Bluetooth proximity marketing technology. As head developer for the Company he was core to the improvements and expansion for Wi‐Fi connectivity too. iSIGN has existing patent applications for Canada and various Asian countries. It is expected that the recent granting of patent status in the United States will result in similar patent granting for our present applications. The Company will be expanding its patent applications to other countries and will continue to pursue patent applications for its new hardware and technology advancements. In addition, the Company has a full‐time Chief Technology Officer. Outsourcing and Strategic Business Relationships The Company continues to formally partner with other companies to expand its business. In addition to key players such as IBM, who announced that our technology is their preferred source of proximity marketing content, the Company has partnered with: Graphic ‐ an exclusive distribution agreement for the Company's Smart Antenna in North, Central and South America and Keyser ‐ a reseller agreement to market and see our products and technology in the United States; a partnership agreement with iSIGN and Graphic and an exclusive agreement for the installation and deployment of the Company's Smart Antennas for the QSR channel. The Company will continue to pursue business relations to expand and grow its business in the United States and other markets. The Company has signed agreements with several companies to act as resellers for our technology and hardware. During the latter half of fiscal 2014, the Company has signed agreements with SST, Magnetic 3D, DDS and JEA. Performance Drivers External factors that exist outside management's ability to control and are significantly key to the success in our business are: Over the past few years, various studies and reports have been written about the 'Mobile Marketplace'. Generally these articles have been predicting a bright future for what they have called mobile marketing. iSIGN has been promoting itself as proximity marketing, as our hardware is installed in close proximity to the point of origin for our broadcasting. We feel that this makes our mobile broadcasting to be more relevant to shoppers and will result in shopper acceptance of our messaging. The entrance of Apple's iBeacon helped to give this market credibility and has helped to promote the idea of proximity advertising. A sampling of the above‐mentioned reports follow:

ISIGN MEDIA SOLUTIONS INC.
Management’s Discussion & Analysis
For the Year Ended April 30, 2014
11
Performance Drivers – continued External factors that exist outside management's ability to control and are significantly key to the success in our business are: ‐ continued Growth of mobile digital devices connected to the internet ‐ Economist magazine forecast for 2020 is 10 Billion mobile connected devices. Forrester Research (FORR NASDAQ) forecasts significant growth for mobile retail revenues and mobile Internet advertising spending in 2013. In the U.S. alone they are forecasting these two markets to reach $12 billion (up 62% year on year), and $4.6 billion respectively. eMarketer (Founded 1996; Fortune 500 Clients) estimates that marketers will spend $7.7 billion in the U.S. on mobile online advertising, growing to an estimated $28 billion in 2017. And according to Gartner Inc. (formerly Gartner Group; IT NYSE) global mobile advertising is expected to grow 400% between 2011 and 2016, reaching $11.4 billion in 2013 and $24.5 billion in 2016. Market leaders like Mondelez International (formerly Kraft Foods) are treating mobile as a strategic priority and have announced that 10% of their current year marketing spend will be in mobile. A recent report by Deloitte “The Dawn of Mobile Influence”, studied the growing impact of mobile devices in the retail sector. It discussed the fact that mobile influenced a significant 5.1% of in‐store sales in the U.S.; that percentage, Deloitte states, translated into $159 billion in forecasted sales in 2012. They project that the mobile influence factor will reach 17‐21% over the next four years, which will translate to $628‐$752 billion in mobile influenced sales and that mobile has surpassed eCommerce as the greatest influencer. Their study described the ‘influence factor’ as whether the shopper had used their Smartphone to shop, either before they go to the store or in the store. And their survey indicated that Smartphone shoppers are 14 % more likely that non‐Smartphone shoppers to convert in store. And 61% said that they would likely use their Smartphone while in the store. A Wikibon.org (professional community solving technology and business problems through an open source sharing of free advisory knowledge) based study estimated that the big data industry will reach $50 billion by 2017. Retailers are aggregating data from a variety of sources such as online browsing and shopping patterns, social media sources, industry forecasts and existing customer records. Facebook is heavily invested in the big data marketplace as they extrapolate data from users “likes” and report findings to marketers. In 2012 they purchased data on 70 million households from Datalogix, a company that sifts and extracts loyalty program data from 1000‐plus retailers. ABI Research (technology market intelligence company with a 23 year proven track record) report shows that spending on global digital signage market, including software and hardware, is expected to grow from U.S. $1.3 billion in 2010 to U.S. $4.5 billion by 2016, while Magna Global (strategic global media unit of Interpublic Group) expects spending on digital billboards and posters to double in the next 5 year to U.S. $5.2 billion. Internal factors which define the Company's performance indicators leading to revenue growth capability: iSIGN gathers data from its various installations in the United States and Canada. The Company stores raw data in its Cloud storage, which is virtually infinite. Data gathering will increase as our network of Smart Antenna installations expands. Data includes: (i) messaging to and from mobile devices including number of unique mobile devices, dwell‐time, frequency of return visits and messages accepted, rejected and ignored, call‐to‐action/coupons downloaded and acted upon; and, (ii) point‐of‐sale data. All basic insights are completely anonymous and do not violate any privacy issues.
ISIGN MEDIA SOLUTIONS INC.
Management’s Discussion & Analysis
For the Year Ended April 30, 2014
12
Resources and Capabilities The Company must pay competitive salaries and benefits in order to attract and maintain its key management and employees. In addition, key employees will participate in bonuses when the Company reaches profitability. No bonuses have been paid by the Company to date. The Company has a stock option plan that is approved by its Shareholders, which is used to provide incentives to employees and management. Summarized below are details of the Company's key management who are responsible for the development and implementation of the Company's strategy in marketing and technology. Management President and Chief Executive Officer Alex Romanov is an accomplished business executive with a history of identifying opportunities and turning them into high growth and profitable enterprises. Alex has diverse experience in a variety of industries such as consumer electronics, communication, digital imaging, video gaming, and e‐commerce. Alex was the CEO and President of Alpine Electronics in Canada for 17 years, building the company to over $50 million in revenue with over 50% of the Canadian market share by 1995. After Alpine, Alex became founder and CEO and major shareholder of Royal Oak Marketing and was responsible for over 100 employees and $120 million in revenue. Royal Oak Marketing was sold for $29 million to an American concern. Alex then co‐founded Spherex Inc., which developed and marketed an Xbox gaming audio system. Spherex was then sold to another U.S. concern in 2005. Alex has been iSIGN’s Chief Executive Officer since November 2007 and has successfully restructured the company, positioning it for rapid growth worldwide. Vice President, Business Development and Branding Sandy Clarke assumed her current role with iSIGN in July 2013. Prior to joining iSIGN, she was the founder and President of The North 51st Group, a full service brand and retail marketing support company that developed strategy and executed moment of sale impact for global technology brands and many of North America’s largest retailers. Prior to North 51st Group, she was the National Sales Manager for AST Computers and Vice President, Sales and Marketing for Alpine Electronics of Canada. Ms. Clarke has completed courses at York University and the University of Ontario in International Marketing, Financial Management and Board Effectiveness, in addition to various sales courses. Technology Chief Technology Officer Mark Janke is a graduate of the Alberta Institute of Technology and the University of Alberta with a Bachelor of Science in Electrical Engineering. He has a wealth of experience in developing solutions within a variety of verticals including biomedical, automation and mobile advertising. Prior to 2000, Mark managed a team at Universal Dynamics that was responsible for development of sophisticated model based control software for lime kilns, breweries and other cost sensitive systems. After 2000, Mark managed the Field Applications group at Intrinsyc Software. Mark’s team at Intrinsyc was responsible for system architecture, development, testing and customer support for mobile applications including biomedical devices, gaming systems and a variety of other platforms. Mark left Intrinsyc in 2005 and continued supporting mobile device development projects as a private consultant and as the founder of Deviceworx Engineering Inc. Mark joined iSIGN in 2009 and leads a team in improving iSIGN's ground breaking Interactive Marketing Solution (""IMS""). Head Developer Chris Losari is a graduate of the University of British Columbia with a Bachelor of Applied Science in Electrical Engineering. After graduating Chris worked for Research In Motion in Waterloo, Ontario. From there, he joined Polycom Canada, based in Vancouver, British Columbia. Chris has been with iSIGN since its inception and d

ISIGN MEDIA SOLUTIONS INC.
Management’s Discussion & Analysis
For the Year Ended April 30, 2014
13
Resources and Capabilities – continued Technology – continued Head Developer – continued developed the first version of iSIGN's IMS software system. Chris has over 7 years of experience in development of marketing solutions that leverage the Bluetooth Object Push Profile and Object Exchange protocol. Liquidity and Capital Resources Private Placements The Company requires additional capital to continue its operations, and to continue to successfully pursue specific opportunities, until such time as it can sustain itself by revenues. Cash Resources The Company's cash resources increased by $15,997 in the three months ended April 30, 2014 compared with a decrease of $156,216, in the same period of the prior year. For the year ended April 30, 2014, cash resources increased by $85,198, compared to a decrease of $1,573,870 during the same period of last year. The cash proceeds from the private placement, closed in November of 2013 combined with the loan received during February through April 2014; offset decreases in cash resources resulting from the operating losses and investment expenditures in fiscal 2014 as contrasted to fiscal 2013.
Three months ended Twelve months ended
2014 2013 2014 2013
Net cash generated by (used in) operating activities $ 689,785 $ (440,464) $ (1,195,984) $ (1,829,478)
Net cash used in investing activities (923,788) (4,007) (1,505,468) (51,397)
Net cash provided by financing activities 250,000 288,255 2,786,650 307,005
Cash increase (decrease) $ 15,997 $ (156,216) $ 85,198 $ (1,573,870)
Net Cash used in Operating Activities ‐ the variances for the three month and twelve month periods reflect the various non‐cash items recorded during the periods of each year and the transfer of costs into Intangible Assets as Data Development in fiscal 2014. In addition, both periods are impacted by the removal of the accrual for cash royalties owed to Mac's as a result of their election to exchange cash royalties for common shares in the Company that was granted in them in the Virtual Private Advertising Network Services Agreement ("VPAN") signed in January 2012. Net Cash used in Investing Activities ‐ The increase in both the three month and twelve month periods predominantly reflects the Company's development of the Smart Player and the transfer of costs into Data Development (both recorded under Intangible Assets). The twelve month period also reflects the consulting contract, for the development of the Smart Player and Smart Antenna upgrades entered into the first quarter of fiscal 2014. Net Cash provided by Financing Activities ‐ is a reflection of the timing of the exercise of stock options and warrants, as well as the proceeds of private placements and loans.
ISIGN MEDIA SOLUTIONS INC.
Management’s Discussion & Analysis
For the Year Ended April 30, 2014
14
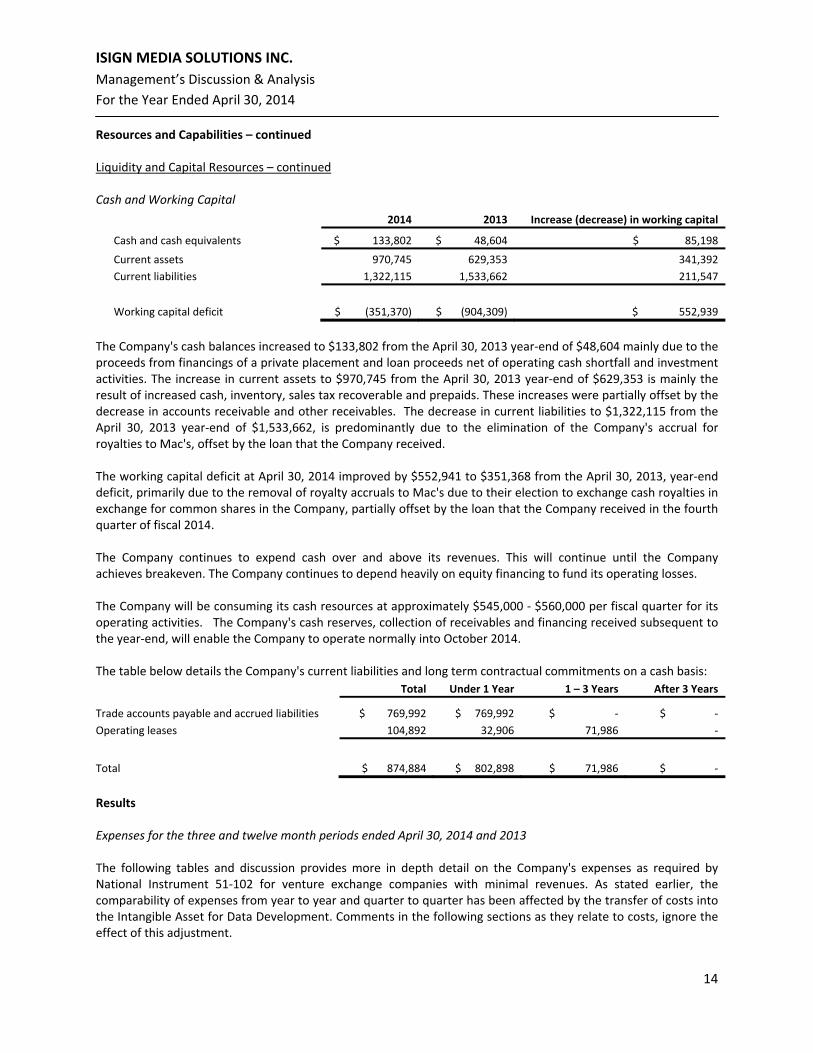
Resources and Capabilities – continued Liquidity and Capital Resources – continued Cash and Working Capital
2014 2013 Increase (decrease) in working capital
Cash and cash equivalents $ 133,802 $ 48,604 $ 85,198
Current assets 970,745 629,353 341,392
Current liabilities 1,322,115 1,533,662 211,547
Working capital deficit $ (351,370) $ (904,309) $ 552,939
The Company's cash balances increased to $133,802 from the April 30, 2013 year‐end of $48,604 mainly due to the proceeds from financings of a private placement and loan proceeds net of operating cash shortfall and investment activities. The increase in current assets to $970,745 from the April 30, 2013 year‐end of $629,353 is mainly the result of increased cash, inventory, sales tax recoverable and prepaids. These increases were partially offset by the decrease in accounts receivable and other receivables. The decrease in current liabilities to $1,322,115 from the April 30, 2013 year‐end of $1,533,662, is predominantly due to the elimination of the Company's accrual for royalties to Mac's, offset by the loan that the Company received. The working capital deficit at April 30, 2014 improved by $552,941 to $351,368 from the April 30, 2013, year‐end deficit, primarily due to the removal of royalty accruals to Mac's due to their election to exchange cash royalties in exchange for common shares in the Company, partially offset by the loan that the Company received in the fourth quarter of fiscal 2014. The Company continues to expend cash over and above its revenues. This will continue until the Company achieves breakeven. The Company continues to depend heavily on equity financing to fund its operating losses. The Company will be consuming its cash resources at approximately $545,000 ‐ $560,000 per fiscal quarter for its operating activities. The Company's cash reserves, collection of receivables and financing received subsequent to the year‐end, will enable the Company to operate normally into October 2014. The table below details the Company's current liabilities and long term contractual commitments on a cash basis:
Total Under 1 Year 1 – 3 Years After 3 Years
Trade accounts payable and accrued liabilities $ 769,992 $ 769,992 $ ‐ $ ‐
Operating leases 104,892 32,906 71,986 ‐
Total $ 874,884 $ 802,898 $ 71,986 $ ‐
Results Expenses for the three and twelve month periods ended April 30, 2014 and 2013 The following tables and discussion provides more in depth detail on the Company's expenses as required by National Instrument 51‐102 for venture exchange companies with minimal revenues. As stated earlier, the comparability of expenses from year to year and quarter to quarter has been affected by the transfer of costs into the Intangible Asset for Data Development. Comments in the following sections as they relate to costs, ignore the effect of this adjustment.
ISIGN MEDIA SOLUTIONS INC.
Management’s Discussion & Analysis
For the Year Ended April 30, 2014
15
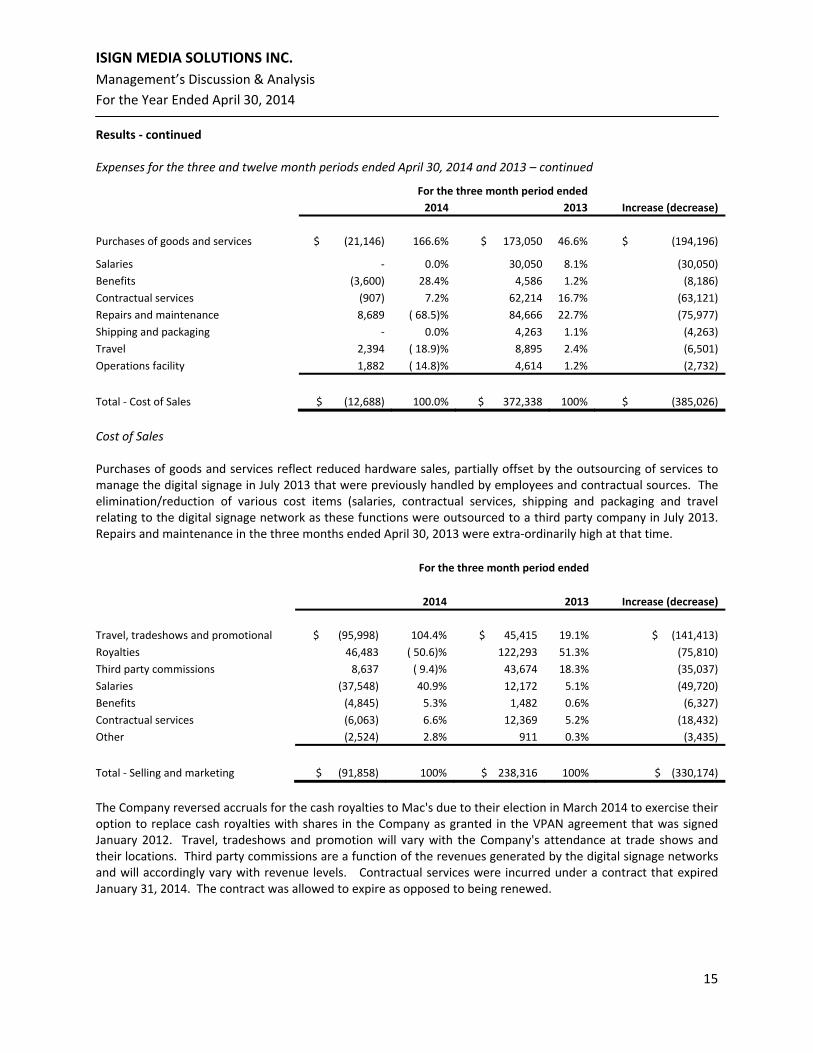
Results ‐ continued Expenses for the three and twelve month periods ended April 30, 2014 and 2013 – continued
Cost of Sales Purchases of goods and services reflect reduced hardware sales, partially offset by the outsourcing of services to manage the digital signage in July 2013 that were previously handled by employees and contractual sources. The elimination/reduction of various cost items (salaries, contractual services, shipping and packaging and travel relating to the digital signage network as these functions were outsourced to a third party company in July 2013. Repairs and maintenance in the three months ended April 30, 2013 were extra‐ordinarily high at that time. For the three month period ended
2014 2013 Increase (decrease)
Travel, tradeshows and promotional $ (95,998) 104.4% $ 45,415 19.1% $ (141,413)
Royalties 46,483 ( 50.6)% 122,293 51.3% (75,810)
Third party commissions 8,637 ( 9.4)% 43,674 18.3% (35,037)
Salaries (37,548) 40.9% 12,172 5.1% (49,720)
Benefits (4,845) 5.3% 1,482 0.6% (6,327)
Contractual services (6,063) 6.6% 12,369 5.2% (18,432)
Other (2,524) 2.8% 911 0.3% (3,435)
Total ‐ Selling and marketing $ (91,858) 100% $ 238,316 100% $ (330,174)
The Company reversed accruals for the cash royalties to Mac's due to their election in March 2014 to exercise their option to replace cash royalties with shares in the Company as granted in the VPAN agreement that was signed January 2012. Travel, tradeshows and promotion will vary with the Company's attendance at trade shows and their locations. Third party commissions are a function of the revenues generated by the digital signage networks and will accordingly vary with revenue levels. Contractual services were incurred under a contract that expired January 31, 2014. The contract was allowed to expire as opposed to being renewed.
For the three month period ended
2014 2013 Increase (decrease)
Purchases of goods and services $ (21,146) 166.6% $ 173,050 46.6% $ (194,196)
Salaries ‐ 0.0% 30,050 8.1% (30,050)
Benefits (3,600) 28.4% 4,586 1.2% (8,186)
Contractual services (907) 7.2% 62,214 16.7% (63,121)
Repairs and maintenance 8,689 ( 68.5)% 84,666 22.7% (75,977)
Shipping and packaging ‐ 0.0% 4,263 1.1% (4,263)
Travel 2,394 ( 18.9)% 8,895 2.4% (6,501)
Operations facility 1,882 ( 14.8)% 4,614 1.2% (2,732)
Total ‐ Cost of Sales $ (12,688) 100.0% $ 372,338 100% $ (385,026)

ISIGN MEDIA SOLUTIONS INC.
Management’s Discussion & Analysis
For the Year Ended April 30, 2014
16
Results – continued Expenses for the Three and Twelve Month Periods Ended April 30, 2014 and 2013 – continued
Stock‐based compensation, which is a non‐cash expense, varies according to the timing and quantity of stock options being granted. Director fees were increased in December 2013 with the election of the new Board. Other income/expense is currency exchange and is a function of fluctuating exchange rates.
Purchase of goods and services reflects the Company's July 2013 decision to outsource the running of the digital signage networks to a third party company that was previously handled by employees and contractual sources. This decision also explains the decrease in salaries, contractual services, shipping and packaging and travel. The decrease in repairs and maintenance is primarily due to the extra‐ordinarily high costs incurred in the three months ended April 30, 2013.
For the three month period ended
2014 2013 Increase (decrease)
Salaries $ (3,844) ( 383.2)% $ 25,542 6.3% $ (29,386)
Benefits (3,661) ( 365.0)% 2,025 0.5% (5,686)
Contractual services (145,572) ( 14513.6)% 143,926 36.0% (289,498)
Stock‐based compensation 139,508 13909.1% 64,394 16.1% 75,114
Travel and auto (8,967) ( 894.1)% 7,131 1.8% (16,098)
Office costs 9,434 940.6% 14,471 3.6% (5,037)
Occupancy and operating costs (23,615) ( 2354.4)% 34,829 8.7% (58,444)
Professional 26,934 2685.3% 41,107 10.3% (14,173)
Consulting (35,285) ( 3518.0)% 44,534 11.1% (79,819)
Directors' fees 50,380 5022.9% 5,000 1.3% 45,380
Other (income)/expense (4,309) ( 429.6)% 17,428 4.4% (21,737)
Total ‐ General and administration $ 1,003 100.0% $ 400,387 100% $ (399,384)
For the twelve month period ended
2014 2013 Increase (decrease)
Purchases of goods and services $ 578,389 79.4% $ 485,249 45.1% $ 93,140
Salaries 19,216 2.6% 120,419 11.2% (101,203)
Benefits 1,108 0.2% 17,304 1.6% (16,196)
Contractual services 41,647 5.7% 206,732 19.2% (165,085)
Repairs and maintenance 63,499 8.7% 125,282 11.7% (61,783)
Shipping and packaging 4,240 0.6% 26,029 2.4% (21,789)
Travel 14,902 2.1% 66,610 6.2% (51,708)
Operations facility 5,217 0.7% 27,842 2.6% (22,625)
Total ‐ Cost of Sales $ 728,218 100% $ 1,075,467 100% $ (347,249)

ISIGN MEDIA SOLUTIONS INC.
Management’s Discussion & Analysis
For the Year Ended April 30, 2014
17
Results – continued Expenses for the three and twelve month periods ended April 30, 2014 and 2013 – continued
For the twelve month period ended
2014 2013 Increase (decrease)
Travel, tradeshows and promotional $ 21,820 3.5% $ 136,524 14.6% $ (114,704)
Royalties 424,998 68.7% 502,909 54.0% (77,911)
Third party commissions 140,295 22.7% 189,046 20.3% (48,751)
Salaries ‐ 0.0% 44,794 4.8% (44,794)
Benefits ‐ 0.0% 5,245 0.6% (5,245)
Contractual services 30,744 5.0% 39,369 4.2% (8,625)
Other 906 0.1% 14,118 1.5% (13,212)
Total ‐ Selling and marketing $ 618,763 100% $ 932,005 100% $ (313,242)
The Company reversed accruals for the cash royalties to Mac's due to their election in March 2014 to exercise their option to replace cash royalties with shares in the Company as granted in the VPAN agreement signed in January 2012. Travel, tradeshows and promotional spending will vary based upon the Company's attendance at trade shows and their locations. Third party commissions are a function of revenues generated on the Company's digital signage networks, which was reduced from last year.
Stock‐based compensation, which is a non‐cash expense, varies according to the timing and quantity of stock options being granted. Director fees were increased in December 2013 with the election of the new Board. Other income/expense is currency exchange and is a function of fluctuating exchange rates. Consulting fees increased primarily due to investor relations programs that were put into place in July 2013. Professional fees, primarily legal fees have decreased.
For the twelve month period ended
2014 2013 Increase (decrease)
Salaries $ 75,705 4.7% $ 116,391 6.1% $ (40,686)
Benefits 7,514 0.5% 11,893 0.6% (4,379)
Contractual services 264,699 16.8% 548,376 29.4% (283,677)
Stock‐based compensation 590,850 37.6% 368,094 19.7% 222,756
Travel and auto 24,340 1.6% 63,001 3.4% (38,661)
Office costs 70,148 4.5% 89,398 4.8% (19,250)
Occupancy and operating costs 44,278 2.8% 125,166 6.7% (80,888)
Professional 241,994 15.4% 377,521 20.2% (135,527)
Consulting 192,033 12.2% 164,543 8.8% 27,490
Directors' fees 90,380 5.7% 17,000 0.9% 73,380
Other (income) (28,537) ( 1.8)% (12,933) ( 0.7)% (15,604)
Total ‐ General and administration $ 1,573,404 99.9% $ 1,868,450 100% $ (295,046)
ISIGN MEDIA SOLUTIONS INC.
Management’s Discussion & Analysis
For the Year Ended April 30, 2014
18
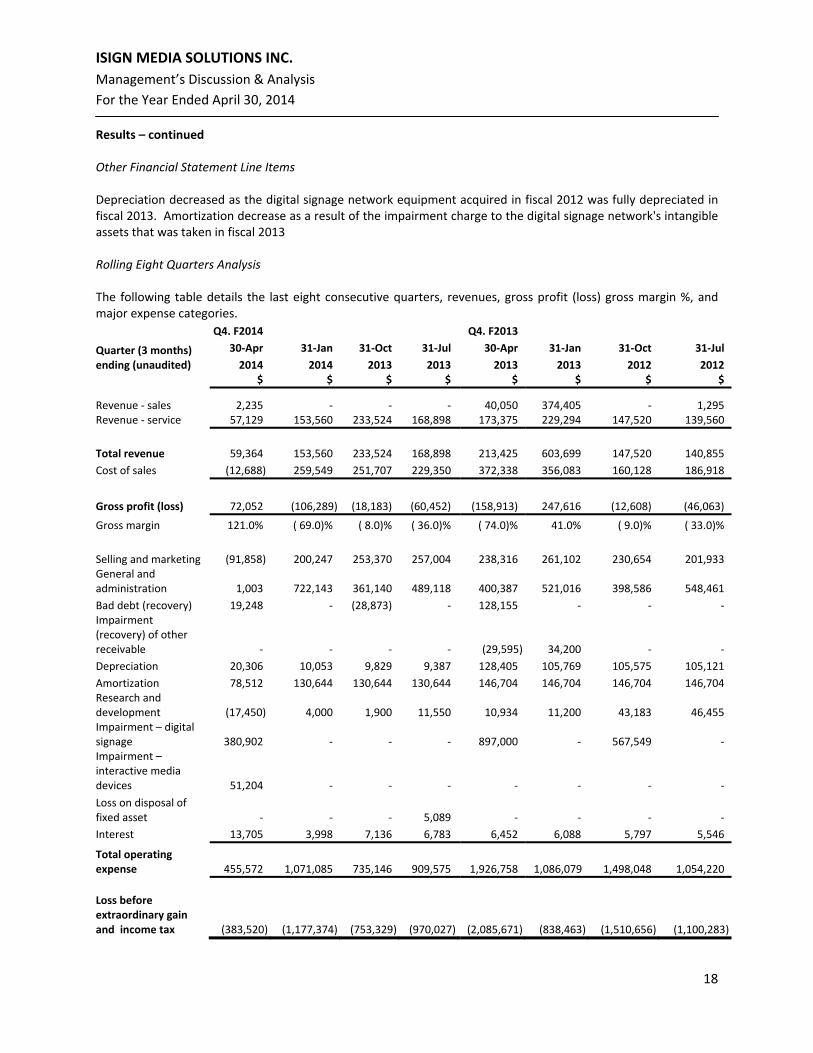
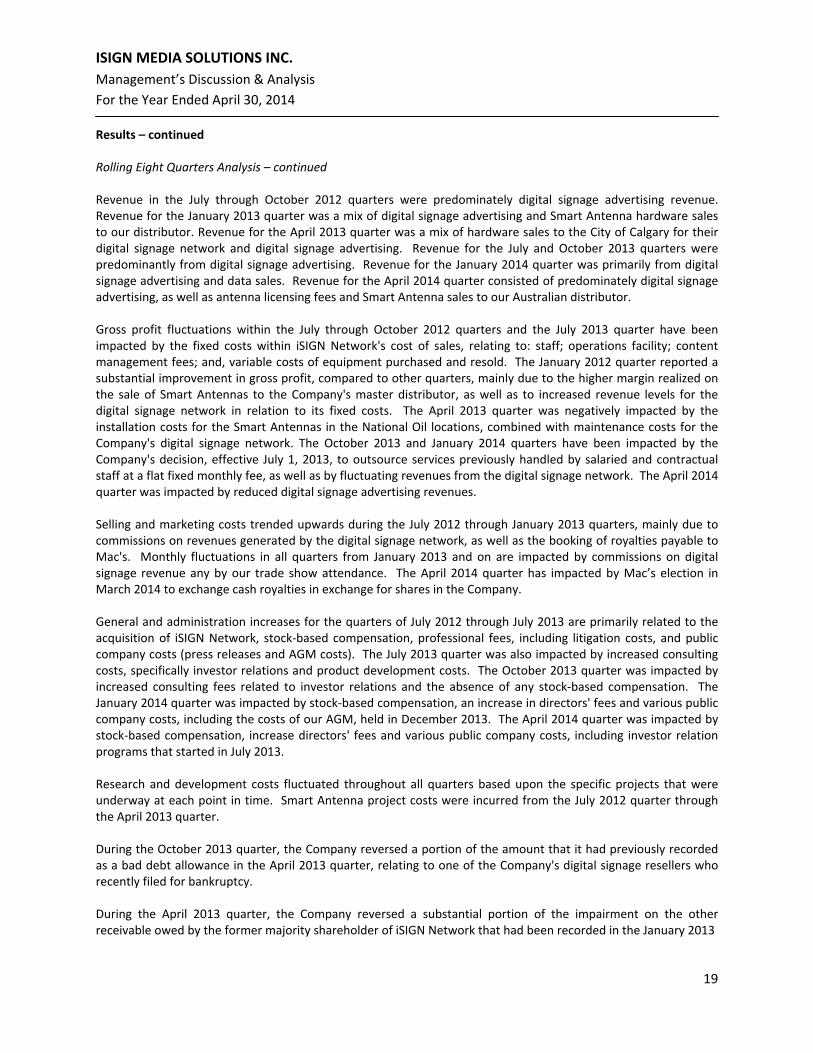
Results – continued Other Financial Statement Line Items Depreciation decreased as the digital signage network equipment acquired in fiscal 2012 was fully depreciated in fiscal 2013. Amortization decrease as a result of the impairment charge to the digital signage network's intangible assets that was taken in fiscal 2013 Rolling Eight Quarters Analysis The following table details the last eight consecutive quarters, revenues, gross profit (loss) gross margin %, and major expense categories.
Q4. F2014 Q4. F2013
Quarter (3 months) ending (unaudited)
30‐Apr 31‐Jan 31‐Oct 31‐Jul 30‐Apr 31‐Jan 31‐Oct 31‐Jul
2014 2014 2013 2013 2013 2013 2012 2012 $ $ $ $ $ $ $ $
Revenue ‐ sales 2,235 ‐ ‐ ‐ 40,050 374,405 ‐ 1,295 Revenue ‐ service 57,129 153,560 233,524 168,898 173,375 229,294 147,520 139,560
Total revenue 59,364 153,560 233,524 168,898 213,425 603,699 147,520 140,855
Cost of sales (12,688) 259,549 251,707 229,350 372,338 356,083 160,128 186,918
Gross profit (loss) 72,052 (106,289) (18,183) (60,452) (158,913) 247,616 (12,608) (46,063)
Gross margin 121.0% ( 69.0)% ( 8.0)% ( 36.0)% ( 74.0)% 41.0% ( 9.0)% ( 33.0)%
Selling and marketing (91,858) 200,247 253,370 257,004 238,316 261,102 230,654 201,933 General and administration 1,003 722,143 361,140 489,118 400,387 521,016 398,586 548,461
Bad debt (recovery) 19,248 ‐ (28,873) ‐ 128,155 ‐ ‐ ‐ Impairment (recovery) of other receivable ‐ ‐
‐
‐ (29,595)
34,200
‐ ‐
Depreciation 20,306 10,053 9,829 9,387 128,405 105,769 105,575 105,121
Amortization 78,512 130,644 130,644 130,644 146,704 146,704 146,704 146,704 Research and development (17,450) 4,000 1,900 11,550 10,934 11,200 43,183 46,455 Impairment – digital signage 380,902 ‐ ‐ ‐ 897,000 ‐ 567,549 ‐ Impairment – interactive media devices
51,204
‐
‐
‐
‐
‐
‐ ‐
Loss on disposal of fixed asset
‐
‐
‐
5,089
‐
‐
‐ ‐
Interest 13,705 3,998 7,136 6,783 6,452 6,088 5,797 5,546
Total operating expense 455,572 1,071,085 735,146 909,575 1,926,758 1,086,079 1,498,048 1,054,220
Loss before extraordinary gain and income tax
(383,520) (1,177,374) (753,329) (970,027) (2,085,671)
(838,463) (1,510,656) (1,100,283)
ISIGN MEDIA SOLUTIONS INC.
Management’s Discussion & Analysis
For the Year Ended April 30, 2014
19
Results – continued Rolling Eight Quarters Analysis – continued Revenue in the July through October 2012 quarters were predominately digital signage advertising revenue. Revenue for the January 2013 quarter was a mix of digital signage advertising and Smart Antenna hardware sales to our distributor. Revenue for the April 2013 quarter was a mix of hardware sales to the City of Calgary for their digital signage network and digital signage advertising. Revenue for the July and October 2013 quarters were predominantly from digital signage advertising. Revenue for the January 2014 quarter was primarily from digital signage advertising and data sales. Revenue for the April 2014 quarter consisted of predominately digital signage advertising, as well as antenna licensing fees and Smart Antenna sales to our Australian distributor. Gross profit fluctuations within the July through October 2012 quarters and the July 2013 quarter have been impacted by the fixed costs within iSIGN Network's cost of sales, relating to: staff; operations facility; content management fees; and, variable costs of equipment purchased and resold. The January 2012 quarter reported a substantial improvement in gross profit, compared to other quarters, mainly due to the higher margin realized on the sale of Smart Antennas to the Company's master distributor, as well as to increased revenue levels for the digital signage network in relation to its fixed costs. The April 2013 quarter was negatively impacted by the installation costs for the Smart Antennas in the National Oil locations, combined with maintenance costs for the Company's digital signage network. The October 2013 and January 2014 quarters have been impacted by the Company's decision, effective July 1, 2013, to outsource services previously handled by salaried and contractual staff at a flat fixed monthly fee, as well as by fluctuating revenues from the digital signage network. The April 2014 quarter was impacted by reduced digital signage advertising revenues. Selling and marketing costs trended upwards during the July 2012 through January 2013 quarters, mainly due to commissions on revenues generated by the digital signage network, as well as the booking of royalties payable to Mac's. Monthly fluctuations in all quarters from January 2013 and on are impacted by commissions on digital signage revenue any by our trade show attendance. The April 2014 quarter has impacted by Mac’s election in March 2014 to exchange cash royalties in exchange for shares in the Company. General and administration increases for the quarters of July 2012 through July 2013 are primarily related to the acquisition of iSIGN Network, stock‐based compensation, professional fees, including litigation costs, and public company costs (press releases and AGM costs). The July 2013 quarter was also impacted by increased consulting costs, specifically investor relations and product development costs. The October 2013 quarter was impacted by increased consulting fees related to investor relations and the absence of any stock‐based compensation. The January 2014 quarter was impacted by stock‐based compensation, an increase in directors' fees and various public company costs, including the costs of our AGM, held in December 2013. The April 2014 quarter was impacted by stock‐based compensation, increase directors' fees and various public company costs, including investor relation programs that started in July 2013. Research and development costs fluctuated throughout all quarters based upon the specific projects that were underway at each point in time. Smart Antenna project costs were incurred from the July 2012 quarter through the April 2013 quarter. During the October 2013 quarter, the Company reversed a portion of the amount that it had previously recorded as a bad debt allowance in the April 2013 quarter, relating to one of the Company's digital signage resellers who recently filed for bankruptcy. During the April 2013 quarter, the Company reversed a substantial portion of the impairment on the other receivable owed by the former majority shareholder of iSIGN Network that had been recorded in the January 2013
ISIGN MEDIA SOLUTIONS INC.
Management’s Discussion & Analysis
For the Year Ended April 30, 2014
20
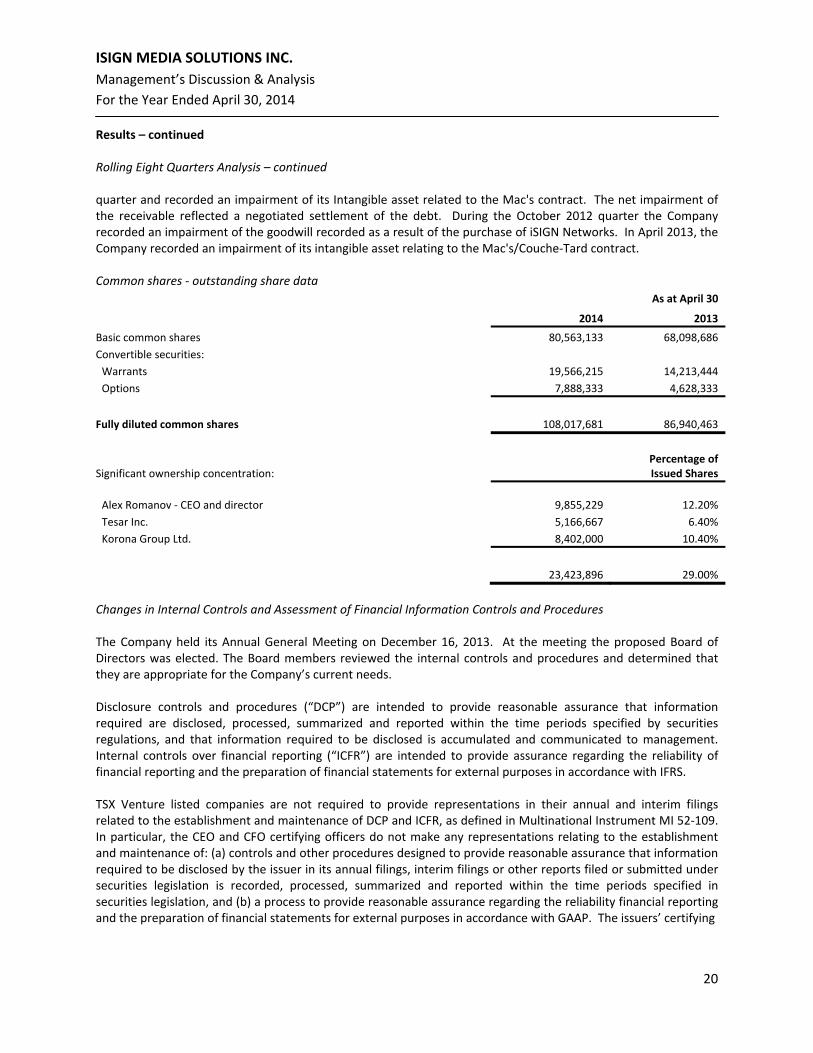
Results – continued Rolling Eight Quarters Analysis – continued quarter and recorded an impairment of its Intangible asset related to the Mac's contract. The net impairment of the receivable reflected a negotiated settlement of the debt. During the October 2012 quarter the Company recorded an impairment of the goodwill recorded as a result of the purchase of iSIGN Networks. In April 2013, the Company recorded an impairment of its intangible asset relating to the Mac's/Couche‐Tard contract. Common shares ‐ outstanding share data
As at April 30
2014 2013
Basic common shares 80,563,133 68,098,686
Convertible securities:
Warrants 19,566,215 14,213,444
Options 7,888,333 4,628,333
Fully diluted common shares 108,017,681 86,940,463
Significant ownership concentration: Percentage of Issued Shares
Alex Romanov ‐ CEO and director 9,855,229 12.20%
Tesar Inc. 5,166,667 6.40%
Korona Group Ltd. 8,402,000 10.40%
23,423,896 29.00%
Changes in Internal Controls and Assessment of Financial Information Controls and Procedures The Company held its Annual General Meeting on December 16, 2013. At the meeting the proposed Board of Directors was elected. The Board members reviewed the internal controls and procedures and determined that they are appropriate for the Company’s current needs. Disclosure controls and procedures (“DCP”) are intended to provide reasonable assurance that information required are disclosed, processed, summarized and reported within the time periods specified by securities regulations, and that information required to be disclosed is accumulated and communicated to management. Internal controls over financial reporting (“ICFR”) are intended to provide assurance regarding the reliability of financial reporting and the preparation of financial statements for external purposes in accordance with IFRS. TSX Venture listed companies are not required to provide representations in their annual and interim filings related to the establishment and maintenance of DCP and ICFR, as defined in Multinational Instrument MI 52‐109. In particular, the CEO and CFO certifying officers do not make any representations relating to the establishment and maintenance of: (a) controls and other procedures designed to provide reasonable assurance that information required to be disclosed by the issuer in its annual filings, interim filings or other reports filed or submitted under securities legislation is recorded, processed, summarized and reported within the time periods specified in securities legislation, and (b) a process to provide reasonable assurance regarding the reliability financial reporting and the preparation of financial statements for external purposes in accordance with GAAP. The issuers’ certifying
ISIGN MEDIA SOLUTIONS INC.
Management’s Discussion & Analysis
For the Year Ended April 30, 2014
21
Results – continued Changes in Internal Controls and Assessment of Financial Information Controls and Procedures – continued officers are responsible for ensuring that processes are in place to provide them with sufficient knowledge to support the representations they are making in their certificate regarding absence of misrepresentations and fair disclosure of financial information. Investors should be aware that inherent limitations on the ability of certifying officers of a venture issuer to design and implement on a cost effective basis DCP and ICFR as defined in MI 52‐109 may result in additional risks to the quality, reliability, transparency and timeliness of interim and annual filings and other reports provided under securities legislation. Off‐Balance Sheet Arrangements The Company has not entered into any off‐balance sheet arrangements. Management’s Estimates The preparation of financial statements in conformity with IFRS requires management to make estimates and assumptions that affect the reported amounts of assets and liabilities and disclosure of contingent assets and liabilities at the date of the financial statements and the reported amounts of revenues and expenses during the reporting period. Significant management estimates include allowance for doubtful accounts, useful lives of capital and intangible assets, impairment of assets and share‐based payments. Actual results could differ materially from those estimates. There have been no changes to critical accounting estimates in the current reporting period. Transactions with Related Parties All related party transactions are recorded at the exchange amount, which is the amount of consideration established and agreed to by both parties. In the normal course of operations, the Company:
Pays the monthly fees of our Chief Executive Officer to a company owned by him.
Pays the monthly fees of our Chief Financial Officer to a company owned by him.
Engaged a law firm to provide legal services to the Company, one of the partners of which is the secretary of the Company.
Paid the monthly fees of our Project and Business Development Manager to a company owned by a person related to the Chief Executive Officer.
Paid the monthly fees of our former Chief Financial Officer to a company owned by him.
Entered into and paid a contract with a private corporation controlled by an individual considered to be a Company insider based on ownership in excess of 10% of the Company’s common shares.
Management Contracts Alex Romanov
Agreement signed with an effective date of Jan 6, 2012
Term is for 3 years, expiring Jan 6, 2015
Automatic renewals of 1 year terms, unless notice in writing is given 6 months prior to the expiration of the term
Consulting salary of $15,000 per month plus a monthly car allowance of $1,350
Severance is required equal to 12 months of Alex’ consulting fee ‐ $180,000
U.S. dollar $6,000 per month salary paid with respect to operations based out of Company offices in Florida USA

ISIGN MEDIA SOLUTIONS INC.
Management’s Discussion & Analysis
For the Year Ended April 30, 2014
22
Risks and Uncertainties Any investment in the securities of the Company is speculative due to the nature of its business and its general stage of development. These risk factors could materially affect the Company’s future operating results and could cause actual events to differ materially from those described in forward‐looking statements relating to the Company. In addition to the usual risks associated with investment in a business, investors should carefully consider the following risk factors:
No History of Profits iSIGN has not earned profits to date and there is no assurance that iSIGN will earn profits in the future, or that profitability, if achieved, will be sustained. The success of iSIGN ultimately depends upon its abilities to generate significant revenues to finance operations as opposed to external funding. There is no assurance that future revenues will be sufficient to generate the funds required to continue operations without external funding. If the Company does not have sufficient capital to fund its operations, it may be required to forego certain business opportunities.
Future Capital Requirements iSIGN will require additional financing in order to grow and expand its operations. Additional financing could include the incurrence of debt and the issuance of additional equity securities, which could result in substantial dilution to existing shareholders. It is possible that required future financing will not be available, or if available, will not be available on favourable terms. If adequate funds are not available, or are not available on acceptable terms, iSIGN may not be able to take advantage of opportunities or otherwise respond to competitive pressures and remain in business. There can be no assurances that iSIGN will be able to raise additional capital if its capital resources are exhausted.
Management of Growth Any expansion of iSIGN’s business may place a significant strain on its financial, operational and managerial resources. There can be no assurance that the Company will be able to implement and subsequently improve its operations and financial systems successfully and in a timely manner in order to manage any growth it experiences. There can be no assurances that iSIGN will be able to manage growth successfully. Any inability of iSIGN to manage growth successfully could have a material adverse effect on the Company’s business, financial condition and operational results.
Our sales efforts require significant time and effort and could hinder our ability to expand our customer base and increase revenue
Attracting new customers requires substantial time and expense and we cannot assure that we will be successful in establishing new relationships, or maintaining or advancing our current relationships. For example, it may be difficult to identify, engage and market to customers who do not currently perform mobile marketing or advertising or are unfamiliar with our current services or platform. Further, many of our potential customers typically require input from one or more internal levels of approval. As a result, during our sales effort, we must identify multiple people involved in the purchasing decision and devote a sufficient amount of time to presenting our products and services to those individuals. The newness and complexity of our services, including our software as a service model, often requires us to spend substantial time and effort assisting potential customers in evaluating our products and services, including providing demonstrations and benchmarking against other available technologies, as well as trial periods. This process can be costly and time consuming. We expect that our sales process will become less burdensome as our products and services become more widely known and used. However, if this change does not occur, we will not be able to expand our sales effort as quickly as anticipated and our sales will be adversely affected.
ISIGN MEDIA SOLUTIONS INC.
Management’s Discussion & Analysis
For the Year Ended April 30, 2014
23
Risks and Uncertainties – continued
Technology iSIGN currently holds patent pending applications in Canada, United States, China, Singapore and Malaysia. Despite precautions that iSIGN may take to protect its rights, third parties may copy or obtain and use our intellectual property and other proprietary information without our authorization or they may develop similar or superior technologies. iSIGN enters into confidentiality agreements with its employees, clients, prospective clients and others. However, these agreements may not provide meaningful protection of our technologies in the event of unauthorized use or disclosure. Policing unauthorized use of intellectual property is difficult and the cost of enforcing our rights by way of litigation may be prohibitive. iSIGN’s success will partially depend upon its ability to obtain, enforce and maintain patent protection for its intellectual property worldwide.
Location‐based Interactive Proximity Advertising Medium Although there is a large and growing amount of interest in this field from both the advertising community and digital sign companies, it is still new and relatively untested. There can be no assurances that advertisers will accept proximity messaging as an acceptable advertising medium or that they will either increase their advertising spending to include this medium or divert some of their existing advertising budget to this medium.
Creating New Product Features iSIGN’s ability to grow its revenue and client base will be impacted to a degree, by its ability to create and/or to react to the desire for additional features and functions for its technology.
Competition iSIGN’s competition for advertising dollars, are the more traditional forms of advertising ‐ television, the print mediums (magazines and newspapers), radio and out‐of‐home advertising – that advertisers immediately consider when they think of communicating with potential consumers.
Dependence on Key/Qualified Personnel The Company’s success is dependent on the abilities, experience and efforts of its senior staff. The experience of these individuals, as well as new employees that we attract to our organization, will be an important factor contributing to iSIGN’s continued success and growth. While iSIGN has entered into employment agreements with its senior management and staff, should these persons be unable or unwilling to continue their employment with the Company, the loss of one or more of these individuals could have an adverse effect upon iSIGN’s operations and business prospects. In particular, the loss of our CEO would severely impact business prospects. There can be no assurance that iSIGN will not experience employee turnover in the future, or that iSIGN’s staffing costs will not increase. There is no assurance that the Company will be able to continue to hire and retain a sufficient number of qualified personnel. The Company does not presently carry “key man” insurance policies on any of its officers, directors or employees.
Vulnerability to Economic Conditions iSIGN is dependent upon the economic environments in which it operates. Demand for iSIGN’s product could be adversely affected by economic conditions in the countries in which iSIGN’s clients operate. iSIGN’s business may be sensitive to external factors such as events which may adversely affect the economy and consumer spending. There can be no assurance that such factors may not have an adverse effect upon iSIGN’s business.

ISIGN MEDIA SOLUTIONS INC.
Management’s Discussion & Analysis
For the Year Ended April 30, 2014
24
Approval The Audit Committee and the Directors of iSIGN Media Solutions Inc. have approved the disclosures in this MD&A and the accompanying audited consolidated annual financial statements for the year ended April 30, 2014.