isccp/giss isccp/umd umd/modis july 2001 zonal mean all-sky surface sw down w/m 2 ) figure 1
TRANSCRIPT

ISCCP/GISS
ISCCP/UMD
UMD/MODIS
July 2001 Zonal Mean all-sky surface SW down W/m2)
Figure 1.

How usefull are global satellite estimates of SW for polar regions? At Issue: Unequal and sparse Coverage
Number of ISCCP D1 AVHRR and Geostationary observationsOctober 1986
Figure 2.

01/01/2001
Figure 3.

Differences due to the way solar zenith angle for 3-
hourly intervalsIs computed
GISS: every 20 min
UMD: analytically
Figure 4.

Clear; SZA(60°-70°); Azimuthal Angle(150°-170°)
00.5
11.5
22.5
33.5
44.5
5
0 10 20 30 40 50 60 70 80 90View Zenith Angle
An
isotr
opic
Fact
or
ERBE OceanERBE VegetationERBE DesertERBE SnowCERES OceanCERES VegetationCERES DesertCERES Snow
Overcast; Tau(2.5-5.0); SZA(60°-70°); Azimuthal Angle(150°-170°)
0
0.5
1
1.5
2
2.5
3
3.5
0 10 20 30 40 50 60 70 80 90View Zenith Angle
Anis
otr
opic
Fact
or
ERBE
CERES Ocean
CERES Vegetation
CERES Desert
CERES Snow
Figure 5. ERBE and CERES ADMs for different surface types for SZA of 60°-70° and Azimuth Angle of 150°-170° over clear sky (left panel) and over cloudy
sky (right panel).

Figure 6.
ADMs for different surface types (clear sky) for Solar Zenith Angles of 40º-50º and viewing angles for 20º-30º
0
0.2
0.4
0.6
0.8
1
1.2
0 10 30 50 70 90 110 130 150 170Azimuth Angle
Ani
sotr
opic
Fac
tor
snowicewater
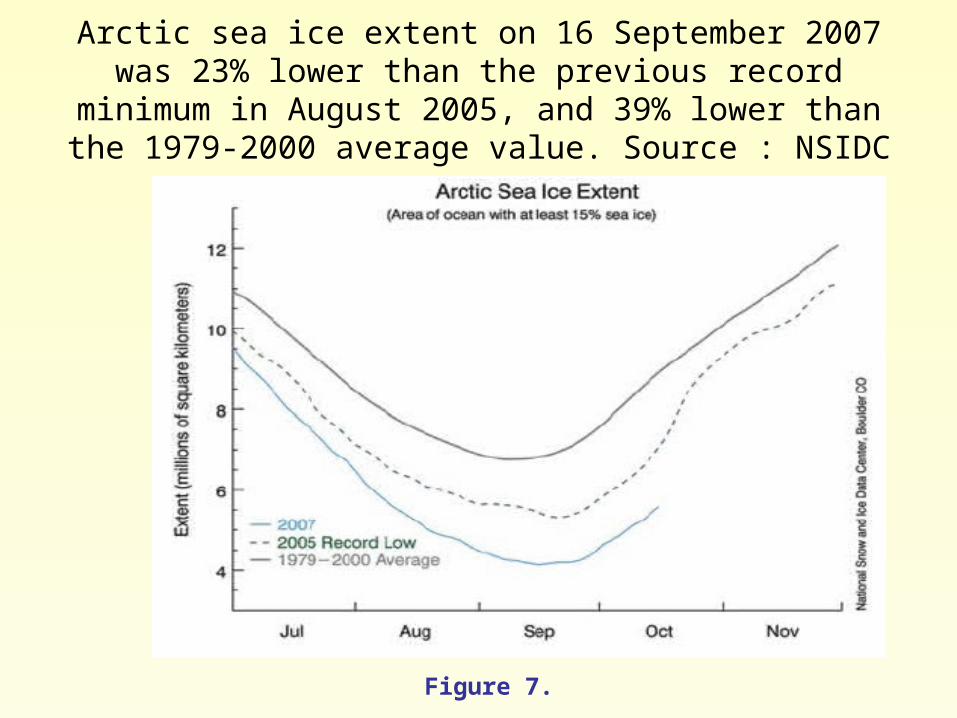
Arctic sea ice extent on 16 September 2007 was 23% lower than the previous record minimum in August 2005, and 39% lower than the 1979-2000 average value. Source :
NSIDC
Figure 7.

Witze, A., Losing Greenland. Nature, 2008.
Figure 8

Change in Antarctic Ice Mass
1000
800
600
400
200
0
-200
-400
-6002003 2004 2005
Ice
Mas
s (k
m3 )
Year Rich Deem
Figure 9

Comparison of monthly mean surface downward SW fluxes
from UMD/MODIS, CERES, ISCCP/GISS and ISCCP/UMD/SRB
against 3 BSRN ground observation sites in Antarctic from September 2002 to August 2003. The mean observation is 210 W/m2 (Wang, 2007).
Sources (Resolution) Cor. Coef. RMSE (%) BIAS (%)
UMD/MODIS (1°) 0.99 25.7(12) -1.4(1)
CERES(1°) 0.95 59.8(29) -42.3(20)
ISCCP/GISS(2.5°) 0.94 56.7(27) -36.0(17)
ISCCP/UMD/SRB(2.5°) 0.97 37.2(18) -19.0(9)
Table 1.
Table 1.

MODIS Estimates with revised algorithm
Processed at 1-deg resolution for 3 years (2001- 03).
Feasibility demonstrated to implement MODIS at 5-km resolution (see Figure 13)
Monthly mean SW surface down flux (W/m**2), 2001 MODIS V004: Modified SRB
Figure 10
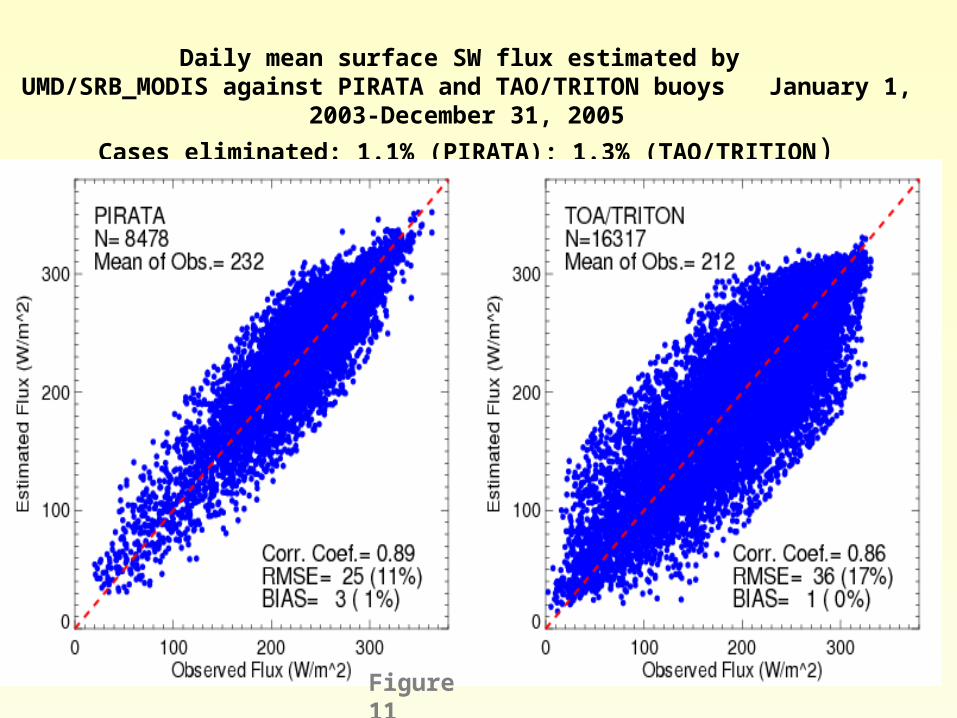
Daily mean surface SW flux estimated by
UMD/SRB_MODIS against PIRATA and TAO/TRITON buoys January 1, 2003-December 31, 2005
Cases eliminated: 1.1% (PIRATA); 1.3% (TAO/TRITION)
Figure 11

BSRN Sites (39)

Daily and monthly mean SW flux estimated by UMD/SRB_MODIS against BSRN measurements over land January, 2003-December, 2005)
Cases eliminated: 1.6% (Daily)
Figure 12

PAR over US, Day 185, 2001, 18:20 Z, W/m2
Figure 13

Surface SW fluxes at 5 km resolution at 1:30 PM, August 1, 2003
Figure 14