isc6 - case study of liquefaction mitigation by compaction
TRANSCRIPT

Case Study of Liquefaction Mitigation by Compaction Grouting
Fred Yi Mid Pacific Engineering Inc, Colton, USA, [email protected]
Robert J. Johnson Robert Johnson-Geotechnical Consultant/Riverside, USA, [email protected]
ABSTRACT: Ground improvement is one method used for liquefaction mitigation. Various ground improvement tech-niques, such as vibro-compaction, vibro-replacement stone columns and grouting are used in construction to mitigate liquefaction. Varying methods of mitigation have different advantages and limitations. In this paper, the effectiveness of liquefaction mitigation using compaction grouting is evaluated by the comparison of pre- and post-grouting cone pen-etration testing (CPT) results. Detailed discussions of the factors affecting the evaluation of post-grouting performance of the compaction grout method are made. In the comparison of pre- and post-grout CPT data, a pseudo-sandification phenomenon was noticed. A correction method for this pseudo-sandification phenomenon is proposed. Future research needs and improvements used for liquefaction mitigation using compaction grouting are also discussed.
Keywords: liquefaction mitigation; ground improvement; compaction grouting; cone penetration test, pseudo-sandifica-tion
1. Introduction
The destruction caused by liquefaction has been widely observed and documented after various earth-quakes. Because of the tremendous damage to above-ground structures and underground lifelines caused by liquefaction-induced settlement and/or lateral spreading, a successful mitigation of liquefaction potential of a liq-uefiable project site is fundamental to minimizing prop-erty damage and life and safety issues.
In this paper, the performance of compaction grouting (CG), in terms of mitigating liquefaction-induced settle-ment, is evaluated based on the comparison of pre- and post-grouting cone penetration testing (CPT) results. Methods of site evaluation and the factors affecting the evaluation of CG performance are discussed. In the com-parison of pre- and post-grout CPT data, the authors noted that the Soil Behavior Type (SBT) Index (𝐼𝐼𝑐𝑐) de-creased post grouting, which resulted in the SBT Index changing from silty type condition to sandy type condi-tion. The authors call this change a pseudo-sandification phenomenon. A correction for the pseudo-sandification phenomenon is proposed. Future research needs and im-provements for liquefaction mitigation using compaction grouting are also discussed.
2. Site geology and subsurface soil conditions
2.1. Site geology
The project site is located in the San Bernardino Val-ley, a structural basin of the northern Peninsular Ranges geomorphic province. The valley is bordered to the north and east by the northwest-to-southeast trending San An-dreas fault zone and the San Bernardino Mountains. The San Jacinto fault zone, located southwest of the site, forms the boundary between two low-relief regions; the
Perris Block and the San Jacinto Mountains Block (Mor-ton and Miller [1]). The site is approximately 420 meters northeast of the Loma Linda fault, a branch of the San Jacinto fault zone.
The San Bernardino Valley itself is formed by a struc-turally down-dropped block of crystalline bedrock over-lain by a thick accumulation of alluvium composed of floodplain and alluvial-fan deposits derived from high-lands located to the south, east, north and northwest.
2.2. Subsurface soil conditions
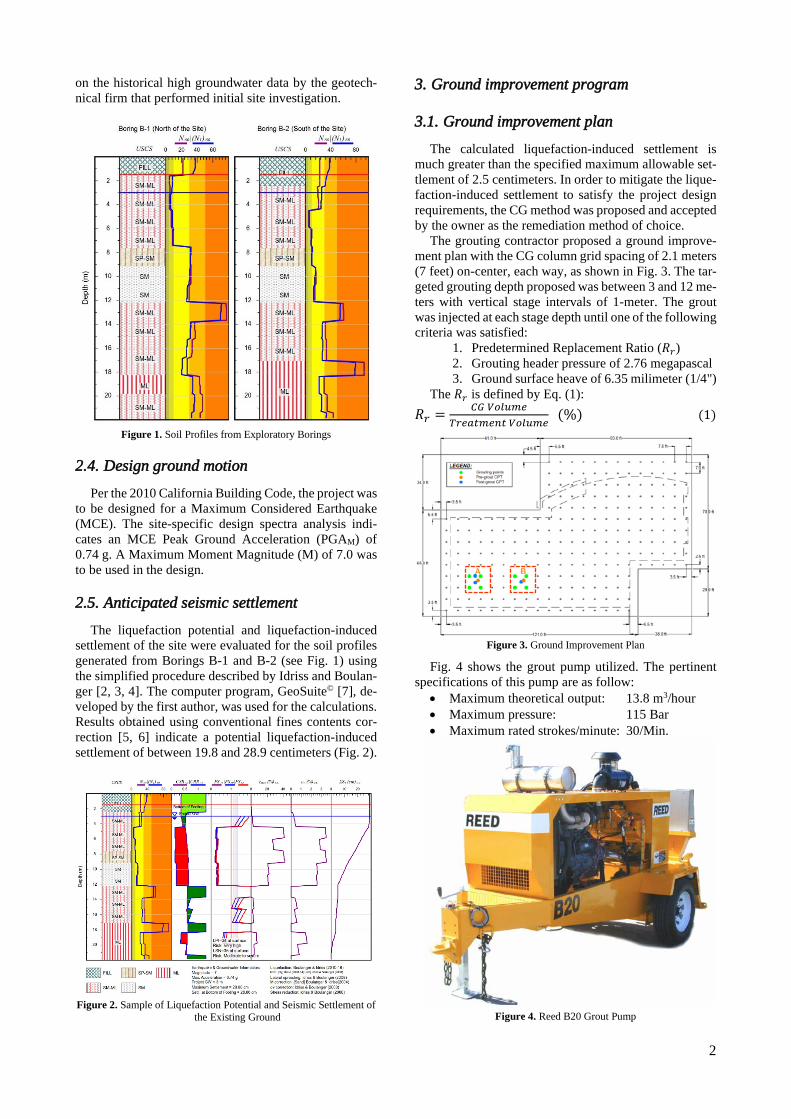
The native geologic materials beneath the studied site consist of young alluvial-fan deposits of Holocene age. The site exploration data indicates that the project site is capped with approximately 1.5 to 2.4 meters of fill mate-rial classified as silty sand. The native soils consist of very loose to loose silty sand and sand with interbedded silt layers varying in thickness between 6.1 and 9.8 me-ters, underlain by medium dense to dense sand with silt, silty sand, and sandy silt layers to a depth of approxi-mately 22 meters below the existing ground surface. Fig. 1 shows the soil profiles obtained from two explora-tory borings. Also noteworthy is that the silty sand layers contain relatively high fines content (𝐹𝐹𝐹𝐹), shown as SM-ML in Fig. 1. The fines content range between 42% and 46% at depths above 7.6 meters and between 35% and 49% at depths below 12.2 meters.
2.3. Design groundwater depth
Groundwater was not encountered in the field explo-ration to the depth explored of approximately 22 meters below the existing ground surface. However, the site is mapped as within a liquefiable zone in the City's General Plan. There is also a water pond immediately east of the site. As such, the project design groundwater depth was set as 3 meters below the existing ground surface based
2
on the historical high groundwater data by the geotech-nical firm that performed initial site investigation.
Figure 1. Soil Profiles from Exploratory Borings
2.4. Design ground motion
Per the 2010 California Building Code, the project was to be designed for a Maximum Considered Earthquake (MCE). The site-specific design spectra analysis indi-cates an MCE Peak Ground Acceleration (PGAM) of 0.74 g. A Maximum Moment Magnitude (M) of 7.0 was to be used in the design.
2.5. Anticipated seismic settlement
The liquefaction potential and liquefaction-induced settlement of the site were evaluated for the soil profiles generated from Borings B-1 and B-2 (see Fig. 1) using the simplified procedure described by Idriss and Boulan-ger [2, 3, 4]. The computer program, GeoSuite© [7], de-veloped by the first author, was used for the calculations. Results obtained using conventional fines contents cor-rection [5, 6] indicate a potential liquefaction-induced settlement of between 19.8 and 28.9 centimeters (Fig. 2).
Figure 2. Sample of Liquefaction Potential and Seismic Settlement of
the Existing Ground
3. Ground improvement program
3.1. Ground improvement plan
The calculated liquefaction-induced settlement is much greater than the specified maximum allowable set-tlement of 2.5 centimeters. In order to mitigate the lique-faction-induced settlement to satisfy the project design requirements, the CG method was proposed and accepted by the owner as the remediation method of choice.
The grouting contractor proposed a ground improve-ment plan with the CG column grid spacing of 2.1 meters (7 feet) on-center, each way, as shown in Fig. 3. The tar-geted grouting depth proposed was between 3 and 12 me-ters with vertical stage intervals of 1-meter. The grout was injected at each stage depth until one of the following criteria was satisfied:
1. Predetermined Replacement Ratio (𝑅𝑅𝑟𝑟) 2. Grouting header pressure of 2.76 megapascal 3. Ground surface heave of 6.35 milimeter (1/4")
The 𝑅𝑅𝑟𝑟 is defined by Eq. (1): 𝑅𝑅𝑟𝑟 = 𝐶𝐶𝐶𝐶 𝑉𝑉𝑉𝑉𝑉𝑉𝑉𝑉𝑉𝑉𝑉𝑉
𝑇𝑇𝑟𝑟𝑉𝑉𝑇𝑇𝑇𝑇𝑉𝑉𝑉𝑉𝑇𝑇𝑇𝑇 𝑉𝑉𝑉𝑉𝑉𝑉𝑉𝑉𝑉𝑉𝑉𝑉 (%) (1)
Figure 3. Ground Improvement Plan
Fig. 4 shows the grout pump utilized. The pertinent specifications of this pump are as follow:
• Maximum theoretical output: 13.8 m3/hour • Maximum pressure: 115 Bar • Maximum rated strokes/minute: 30/Min.
Figure 4. Reed B20 Grout Pump

3
3.2. Performance verification program
In order to verify the performance of the CG method, a test program was developed prior to commencing the process over the entire site. The test program consisted of selecting two areas, test Grid A and test Grid B (see Fig. 3) and grouting the four corners of each test area. The performance of 𝐹𝐹𝐶𝐶 was assessed by CPT soundings. One CPT sounding was performed in each test grid. Grout injections were then performed at the four corner points of Grid A using a 𝑅𝑅𝑟𝑟 of 20% and at the four corner points of Grid B using a 𝑅𝑅𝑟𝑟 𝑜𝑜𝑜𝑜10%. Upon completion of grouting, post-grouting CPT soundings were performed. Fig. 5 shows a close up of the layout of test Grids A and B and the pre- and post-grout CPT points.
Figure 5. Test Grids and Pre- and Post-Grout CPT Points
The comparison of the tip resistance of pre- and post-grout CPT is shown in Fig. 6. It is clear that for Rr of 10%, there is generally no significant increase of tip resistance below the depth of approximately 4 meters although significant increase was observed between depths of 3 and 4 meters. For Rr of 20%, the average increase of tip resistance below depth of 3 meters is 240% to 260% for post-grout CPT-1A and CPT-1B (both excluding the extreme high values), respectively.
(a) Rr=20% (b) Rr=10%
Figure 6. Comparison of Tip Resistance, Pre- and Post-Grout
4. Evaluation of post-grouting performance
The performance of the grouting method was quantified in terms of liquefaction-induced settlement calculated using simplified procedures [8, 9, 10]. Using the simplified procedures, the liquefaction-induced settlement in a free-field is usually calculated using the following steps:
a) Calculate cyclic shear stress ratio. b) Calculate cyclic shear resistance ratio.
c) Calculate liquefaction potential in terms of factor of safety against liquefaction.
d) Calculate liquefaction-induced maximum shear strain.
e) Calculate liquefaction-induced volumetric strain.
f) Integrate the volumetric strain to calculate liq-uefaction-induced settlement.
The existence of CG columns changes the responses of the soils between the grout columns during earthquake shaking. Also, the post-grout CPT data is changed because of the densification effects. In order to appropriately evaluate the post-grouting behavior, these effects have to be considered. The change in the response and the data results in the need for a correction factor that will be applied. The following sections will summarize the above-mentioned procedures and corresponding corrections.
4.1. Liquefaction potential
Liquefaction potential is quantified as the factor of safety against liquefaction, with liquefaction being de-fined as the ratio of cyclic resistance ratio (CRRM) that will cause liquefaction of the soil to the cyclic stress ratio (CSR) developed in the soil by the earthquake. 𝐹𝐹𝑆𝑆𝑉𝑉𝑙𝑙𝑙𝑙 = 𝐹𝐹𝑅𝑅𝑅𝑅𝑀𝑀,𝜎𝜎′𝑣𝑣/𝐹𝐹𝑆𝑆𝑅𝑅 (2)
4.1.1. Cyclic stress ratio (CSR)
In the simplified procedure, the CSR developed in the soil is calculated from a formula that incorporates ground surface acceleration, total and effective stresses in the soil at different depths (which in turn are related to the location of the groundwater table), non-rigidity of the soil column, and a number of simplifying assumptions. Seed and Idriss et al. [8] formulated the following equation for calculation of CSR: 𝐹𝐹𝑆𝑆𝑅𝑅 = 𝜏𝜏𝑇𝑇𝑎𝑎/𝜎𝜎′𝑎𝑎0 = 0.65(𝑎𝑎𝑉𝑉𝑇𝑇𝑚𝑚/𝑔𝑔)(𝜎𝜎𝑎𝑎0/𝜎𝜎′𝑎𝑎0)𝑟𝑟𝑑𝑑 (3) where τav is the average equivalent uniform cyclic shear stress caused by the earthquake and is assumed to be 0.65 of the maximum induced stress; amax is the peak horizon-tal acceleration at ground surface generated by the earth-quake; g is the acceleration of gravity; σv0 and σ'v0 are the total and effective overburden stresses, respectively, and rd is a stress reduction coefficient [11, 12].
4.1.2. Cyclic resistance ratio (CRR)
Various correlations between CRR and CPT tip re-sistance were proposed [2, 3, 4, 13, 14]. A modified ver-sion [14] of Robertson and Wride's [13] equation is as shown below:
𝐹𝐹𝑅𝑅𝑅𝑅7.5 = 93 ∙ �𝑄𝑄𝑇𝑇𝑇𝑇,𝑐𝑐𝑐𝑐
1000�3
+ 0.08, 𝑖𝑖𝑜𝑜 50 ≤ 𝑄𝑄𝑇𝑇𝑇𝑇,𝑐𝑐𝑐𝑐 < 160
𝐹𝐹𝑅𝑅𝑅𝑅7.5 = 0.833 ∙ �𝑄𝑄𝑇𝑇𝑇𝑇,𝑐𝑐𝑐𝑐
1000� + 0.05, 𝑖𝑖𝑜𝑜 𝑄𝑄𝑇𝑇𝑇𝑇,𝑐𝑐𝑐𝑐 < 50
(4) where 𝑄𝑄𝑇𝑇𝑇𝑇,𝑐𝑐𝑐𝑐 = 𝐾𝐾𝑐𝑐𝑄𝑄𝑇𝑇𝑇𝑇 and 𝑄𝑄𝑇𝑇𝑇𝑇 = [(𝑞𝑞𝑇𝑇 − 𝜎𝜎𝑎𝑎)/𝑝𝑝𝑇𝑇](𝑝𝑝𝑇𝑇 𝜎𝜎′𝑎𝑎0⁄ )𝑇𝑇 (5) Robertson [15] updated the stress normalization by Zhang et al. [16] to allow for a variation of the stress

4
exponent with both normalized Soil Behavior Type (SBTn) Index (𝐼𝐼𝑐𝑐) and effective overburden stress using: 𝑛𝑛 = 0.381(𝐼𝐼𝑐𝑐) + 0.05(𝜎𝜎′𝑎𝑎0 𝑝𝑝𝑇𝑇⁄ ) − 0.15 (6) 𝐾𝐾𝑐𝑐 is a function of 𝐼𝐼𝑐𝑐 and 𝐼𝐼𝑐𝑐 = [(3.47 − 𝑙𝑙𝑜𝑜𝑔𝑔𝑄𝑄𝑇𝑇1)2 + (𝑙𝑙𝑜𝑜𝑔𝑔𝐹𝐹𝑟𝑟 + 1.22)2]0.5 (7) where 𝑄𝑄𝑇𝑇1 = (𝑞𝑞𝑇𝑇 − 𝜎𝜎𝑎𝑎0)/𝜎𝜎′𝑎𝑎0 and 𝐹𝐹𝑟𝑟 = [𝑜𝑜𝑐𝑐/(𝑞𝑞𝑇𝑇 − 𝜎𝜎𝑎𝑎0)] ∙100%.
The most recent deterministic CPT-based clean sand equivalent correlation proposed by Boulanger and Idriss [3, 4] is as follows:
𝐹𝐹𝑅𝑅𝑅𝑅𝑀𝑀=7.5,𝜎𝜎′𝑣𝑣=1 𝑇𝑇𝑇𝑇𝑉𝑉 = 𝐸𝐸𝐸𝐸𝑝𝑝 �𝑙𝑙𝑐𝑐1𝑁𝑁𝑐𝑐𝑁𝑁113
+ �𝑙𝑙𝑐𝑐1𝑁𝑁𝑐𝑐𝑁𝑁1000
�2−
�𝑙𝑙𝑐𝑐1𝑁𝑁𝑐𝑐𝑁𝑁140
�3
+ �𝑙𝑙𝑐𝑐1𝑁𝑁𝑐𝑐𝑁𝑁137
�4− 2.8� (8)
where 𝐹𝐹𝑅𝑅𝑅𝑅𝑀𝑀=7.5,𝜎𝜎′𝑣𝑣=1 𝑇𝑇𝑇𝑇𝑉𝑉 is the CRR at M=7.5 and σ'v = 1 atm.
Research indicates that other corrections, such as earthquake magnitude, overburden pressure, and static shear stress, should also be made to the CRR: 𝐹𝐹𝑅𝑅𝑅𝑅𝑀𝑀,𝜎𝜎′𝑣𝑣 = 𝐹𝐹𝑅𝑅𝑅𝑅𝑀𝑀=7.5,𝜎𝜎′𝑣𝑣=1 𝑇𝑇𝑇𝑇𝑉𝑉 ∙ 𝑀𝑀𝐹𝐹𝑆𝑆 ∙ 𝐾𝐾𝜎𝜎 (9) where MSF is earthquake magnitude scaling factor and Kσ is the overburden correction factor.
4.1.3. Maximum shear strain, 𝜸𝜸𝒎𝒎𝒎𝒎𝒎𝒎
In the process of estimating liquefaction-induced settlement, Ishihara and Yoshimine [17] discovered that for a given value of initial relative density (DR) of soil, the smaller the factor of safety, the larger the maximum shear strain, γmax, while at a given value of FSliq less than unity, the larger the DR, the smaller the γmax. A set of relationships between FSliq and γmax was established for given values of DR. Yoshimine et al [18] approximated these relationships with a hyperbolic function as expressed in Eqs. (10) and (11). 𝛾𝛾𝑉𝑉𝑇𝑇𝑚𝑚 = 0, 𝑖𝑖𝑜𝑜 𝐹𝐹𝑆𝑆𝑉𝑉𝑙𝑙𝑙𝑙 ≥ 2 (10a)
𝛾𝛾𝑉𝑉𝑇𝑇𝑚𝑚 = 0.035�2 − 𝐹𝐹𝑆𝑆𝑉𝑉𝑙𝑙𝑙𝑙� �1−𝐹𝐹𝛼𝛼
𝐹𝐹𝐹𝐹𝑙𝑙𝑙𝑙𝑙𝑙−𝐹𝐹𝛼𝛼� , 𝑖𝑖𝑜𝑜 2 > 𝐹𝐹𝑆𝑆𝑉𝑉𝑙𝑙𝑙𝑙 ≥ 𝐹𝐹𝛼𝛼
(10b) 𝛾𝛾𝑉𝑉𝑇𝑇𝑚𝑚 = ∞, 𝑖𝑖𝑜𝑜 𝐹𝐹𝑆𝑆𝑉𝑉𝑙𝑙𝑙𝑙 < 𝐹𝐹𝛼𝛼 (10c) 𝐹𝐹𝛼𝛼 = 0.032 + 4.7𝐷𝐷𝑅𝑅 − 6.0(𝐷𝐷𝑅𝑅)2 (11)
For CPT data, Idriss and Boulanger [2] derived an expression as: 𝐹𝐹𝛼𝛼 = −11.74 + 8.34(𝑞𝑞𝑐𝑐1𝑁𝑁𝑐𝑐𝑐𝑐)0.264 − 1.371(𝑞𝑞𝑐𝑐1𝑁𝑁𝑐𝑐𝑐𝑐)0.528
(12) with 𝑞𝑞𝑐𝑐1𝑁𝑁𝑐𝑐𝑐𝑐 limited to values ≥ 69 for use in this expression.
4.1.4. Post-liquefaction volumetric strain, 𝜺𝜺𝒗𝒗
Ishihara and Yoshimine [17] observed that the εv of clean sand that occurs during post-liquefaction reconsolidation was directly related to the γmax developed during undrained cyclic loading and to the initial DR.: 𝜀𝜀𝑎𝑎 = 1.5 ∙ 𝑒𝑒𝐸𝐸𝑝𝑝(−2.5𝐷𝐷𝑅𝑅) ∙ 𝑚𝑚𝑖𝑖𝑛𝑛(0.08, 𝛾𝛾𝑉𝑉𝑇𝑇𝑚𝑚) (13)
According to Idriss and Boulanger [2], this equation can be expressed in terms of CPT penetration resistances as follows: 𝜀𝜀𝑎𝑎 = 1.5 ∙ 𝑒𝑒𝐸𝐸𝑝𝑝(2.551 − 1.147(𝑞𝑞𝑐𝑐1𝑁𝑁𝑐𝑐𝑐𝑐)0.264) ∙𝑚𝑚𝑖𝑖𝑛𝑛(0.08, 𝛾𝛾𝑉𝑉𝑇𝑇𝑚𝑚) (14)
4.1.5. Liquefaction-induced settlement
Idriss and Boulanger [2] indicates that the ground surface settlement for one-dimensional reconsolidation can be computed by equating the vertical strains to the volumetric strains (as is appropriate for one-dimensional reconsolidation) and then integrating the vertical strains over the depth interval of concern: 𝑆𝑆𝑎𝑎,1𝐷𝐷 = ∫ 𝜀𝜀𝑎𝑎 ∙ 𝑑𝑑𝑑𝑑
𝑍𝑍𝑚𝑚𝑚𝑚𝑚𝑚0 (15)
4.2. Shear stress reduction caused by CG columns
In current design practice, it is common that the seis-mic shear stress of the soils among discrete columns, such as stone and soil-cement columns, will be reduced due to the existence of these columns, that is: (𝜏𝜏𝑇𝑇𝑎𝑎)𝑐𝑐𝑐𝑐 = 𝜏𝜏𝑇𝑇𝑎𝑎 ∙ 𝐾𝐾𝐶𝐶 (16) where 𝜏𝜏𝑇𝑇𝑎𝑎 and (𝜏𝜏𝑇𝑇𝑎𝑎)𝑐𝑐𝑐𝑐 are seismic shear stress in soils before and after improvement respectively, and 𝐾𝐾𝐶𝐶 is de-fined as the shear-stress reduction factor. 𝐾𝐾𝐶𝐶 = (𝜏𝜏𝑚𝑚𝑣𝑣)𝑁𝑁𝑐𝑐
𝜏𝜏𝑚𝑚𝑣𝑣= 𝐶𝐶𝐹𝐹𝑅𝑅𝐼𝐼
𝐶𝐶𝐹𝐹𝑅𝑅 (17)
where 𝐹𝐹𝑆𝑆𝑅𝑅𝐼𝐼 is cyclic stress ratio with ground improvement.
The shear-stress reduction factor concept was origi-nally introduced by Baez [19] and Baez and Martin [20] for evaluating the reduction of soil liquefaction by vibro-stone columns. Baez and Martin [20] derived the follow-ing equation by assuming the shear strain compatibility, i.e., the shear strains for both loose (soil) and stiff (col-umn) materials are compactible. 𝐾𝐾𝐶𝐶 = 1
[𝐶𝐶𝑟𝑟∙𝐴𝐴𝑟𝑟+(1−𝐴𝐴𝑟𝑟)] (18)
where 𝐴𝐴𝑟𝑟 is the area replacement ratio (𝐴𝐴𝑟𝑟 = 𝐴𝐴𝑐𝑐𝑐𝑐/𝐴𝐴); 𝐶𝐶𝑟𝑟 is the shear-modulus ratio (𝐶𝐶𝑟𝑟 = 𝐶𝐶𝑐𝑐𝑐𝑐/𝐶𝐶𝑐𝑐); 𝐴𝐴𝑐𝑐𝑐𝑐 is the area of the stone column; 𝐴𝐴 is total plan area (sum of area of soil and stone column); 𝐶𝐶𝑐𝑐𝑐𝑐 is the shear modulus of the stone column; and 𝐶𝐶𝑐𝑐 is the shear modulus of soil. Baez and Martin [20] reported 𝐶𝐶𝑟𝑟 values between 2 and 7 for stone columns, whereas larger values can be expected for soil-cement columns.
Generally, 𝑅𝑅𝑟𝑟 = 𝐴𝐴𝑟𝑟. Rayamajhi et al. [21, 22, 23, 24] reported that Eq. (18)
significantly overestimates the reduction in seismic shear stresses and proposed a modification as shown in Eq. (19). 𝐾𝐾𝐶𝐶 = 1
[𝐶𝐶𝑟𝑟∙𝐴𝐴𝑟𝑟∙𝛾𝛾𝑟𝑟+(1−𝐴𝐴𝑟𝑟)] (19)
where 𝛾𝛾𝑟𝑟 is the ratio of shear strains in the discrete col-umns relative to the surrounding soil in terms of shear-strain ratio. Based on three-dimensional finite element numerical analysis results, Rayamajhi et al. [21] found that the 𝛾𝛾𝑟𝑟 predominantly depends upon the 𝐶𝐶𝑟𝑟 and is only slightly affected by other parameters such as 𝐴𝐴𝑟𝑟 or the column-length-to-diameter ratio (𝐿𝐿/𝐷𝐷) (for values of 4.5–30). 𝛾𝛾𝑟𝑟 = 1.04(𝐶𝐶𝑟𝑟)−0.65 − 0.04 ≤ 1.0 (20)

5
4.3. Correction for soil behavior type index for post-grouting
In CPT data interpretation, 𝐼𝐼𝑐𝑐 is a very important index that is used widely to identify soil type, to correlate fines contents as well as other soil parameters. For example, when 𝐼𝐼𝑐𝑐 ≥ 2.6, the soil type is identified as clay-like soil and when 𝐼𝐼𝑐𝑐 < 2.6, the soil type is identified as sand-like soil [14].
When utilizing CPT to verify the effectiveness of ground improvement, a phenomenon arises, wherein the 𝐼𝐼𝑐𝑐 calculated based on post-grout CPT data decreases compared to that calculated based on pre-grout CPT data. Fig. 7 shows the comparison of 𝐼𝐼𝑐𝑐 of pre-grout CPT-01 and 𝐼𝐼𝑐𝑐 of post-grout CPT-01A. The average decrease of 𝐼𝐼𝑐𝑐 between pre- and post-grout is 0.15, while the decrease between depths of 3.2 and 5.4 meters is 0.32. When 𝐼𝐼𝑐𝑐 is used to identify soil type, this decrease results in an apparent soil type change, in this example, from silty soil to sandy soil. However, common sense dictates that the column-type ground improvement did not actually change the soil type. Therefore, this apparent soil type change is misleading. The author called this phenomenon the "pseudo-sandification phenomenon."
Figure 7. Changes of Soil Behavior Type Index, Ic, Due to Grouting
Because 𝐼𝐼𝑐𝑐 is used to calculate fines contents and further to calculate the eqivalent clean sand normalized CPT penetration resistance, 𝑞𝑞𝑐𝑐1𝑁𝑁𝑐𝑐𝑐𝑐 [2] or 𝑄𝑄𝑇𝑇𝑇𝑇,𝑐𝑐𝑐𝑐 [14], this pseudo-sandification phenomenon might well under-es-timate 𝑞𝑞𝑐𝑐1𝑁𝑁𝑐𝑐𝑐𝑐 or 𝑄𝑄𝑇𝑇𝑇𝑇,𝑐𝑐𝑐𝑐 and further over-estimate the liquefaction potential and liquefaction-induced settlement, resulting in an under-estimation of the ground improvement performance itself. In order to avoid this kind of under-estimation, the post-grout 𝐼𝐼𝑐𝑐 should not be directly utilized. A correction to post-grout 𝐼𝐼𝑐𝑐 is necessary. If the pre-grout CPT data can represent the soil profile at the post-grout CPT location (for example, the distance between the two CPTs is small), the preferable correction is to directly replace the post-grout SBT Index with pre-grout SBT index, that is, using (𝐼𝐼𝑐𝑐)𝑝𝑝𝑉𝑉𝑐𝑐𝑇𝑇 =(𝐼𝐼𝑐𝑐)𝑝𝑝𝑟𝑟𝑉𝑉. If it is not the case, at a minimum, a constant increment should be added to the calculated post-grout 𝐼𝐼𝑐𝑐, so that (𝐼𝐼𝑐𝑐)𝑝𝑝𝑉𝑉𝑐𝑐𝑇𝑇,𝑉𝑉𝑐𝑐𝑉𝑉𝑑𝑑 = (𝐼𝐼𝑐𝑐)𝑝𝑝𝑉𝑉𝑐𝑐𝑇𝑇,𝑐𝑐𝑇𝑇𝑉𝑉𝑐𝑐𝑉𝑉𝑉𝑉𝑇𝑇𝑇𝑇𝑉𝑉𝑑𝑑 + ∆𝐼𝐼𝑐𝑐.
4.4. Correction for fines contents
As noted in Section 2.2, the soil profile at this project site consists predominantly of silty sand layers with relatively high fines content (𝐹𝐹𝐹𝐹). The fines contents are between 42% and 46% at depths above 7.6 meters and between 35% and 49% at depths below 12.2 meters. Lew and Tran [25] reported a case history of a site in the western San Fernando Valley where the alluvial deposits were predominantly sandy silt or silty sand with 𝐹𝐹𝐹𝐹 by weight between about 47% and 70%. Evidence of liquefaction-induced settlement was observed a few days after the January 17, 1994, Northridge earthquake by Lew. Lew [25] found that "the observed settlement of the ground surface is substantially smaller than the settlement predicted by currently used methods for estimating settlement for clean sands."
Little literature is available related to liquefaction-induced settlement for soils with 𝐹𝐹𝐹𝐹 higher than 35%. In the investigation of the seismic compression characteristics of unsaturated nonplastic and low-plasticity silty sands with varying 𝐹𝐹𝐹𝐹, the UCLA research group Yee et al. [26] and Steward [27]) found that increasing 𝐹𝐹𝐹𝐹 generally decreases the volume change for fines fractions consisting of silts and clayey silts of moderate-to-low plasticity (𝑃𝑃𝐼𝐼 ≤ 10). They found that (𝜀𝜀𝑎𝑎)𝐹𝐹𝐶𝐶 = 𝐾𝐾𝐹𝐹𝐶𝐶 ∙ (𝜀𝜀𝑎𝑎)𝐹𝐹𝐶𝐶=0 (21) and 𝐾𝐾𝐹𝐹𝐶𝐶 = 1 (𝐹𝐹𝐹𝐹 = 0 − 10%) 𝐾𝐾𝐹𝐹𝐶𝐶 = 𝑒𝑒[−0.042(𝐹𝐹𝐶𝐶−10)] (𝐹𝐹𝐹𝐹 = 10% − 𝐹𝐹𝐹𝐹𝐿𝐿) (22) 𝐾𝐾𝐹𝐹𝐶𝐶 = 0.35 (𝐹𝐹𝐹𝐹 ≥ 𝐹𝐹𝐹𝐹𝐿𝐿) where (𝜀𝜀𝑎𝑎)𝐹𝐹𝐶𝐶 is the volumetric strain with any 𝐹𝐹𝐹𝐹 value and (𝜀𝜀𝑎𝑎)𝐹𝐹𝐶𝐶=0 is the volumetric strain at 𝐹𝐹𝐹𝐹 = 0, i.e., the volumetric strain of clean sand. The limiting fines content 𝐹𝐹𝐹𝐹𝐿𝐿 is ∼35% for most of the materials considered in their study.
Yee et al. [26] also investigated the effect of saturation (𝑆𝑆) on seismic compression volumetric strain and found that (𝜀𝜀𝑎𝑎)𝐹𝐹≥60% = (𝜀𝜀𝑎𝑎)𝐹𝐹=0% (23)
Although further verification studies are needed, it is the opinion of the authors that Eq. (22) and Eq. (23) should also be applicable to any liquefaction-induced volume change calculations, i.e., �(𝜀𝜀𝑎𝑎)𝑉𝑉𝑙𝑙𝑙𝑙�𝐹𝐹𝐶𝐶 = 𝐾𝐾𝐹𝐹𝐶𝐶 ∙ �(𝜀𝜀𝑎𝑎)𝑉𝑉𝑙𝑙𝑙𝑙�𝐹𝐹𝐶𝐶=0 (24)
5. Post-grout seismic settlement
5.1. Comparison of predicted settlement
Fig. 8 shows a comparison of the calculated liquefaction-induced settlement (𝑆𝑆𝑉𝑉𝑙𝑙𝑙𝑙) using the data from Grid A (SPT-1, pre-grout CPT-1, and post-grout CPT-1A). For comparison, the pre-grout SPT results are also included. It can be seen that the predicted pre-grout 𝑆𝑆𝑉𝑉𝑙𝑙𝑙𝑙 agrees very well with both SPT and CPT data, using both the traditional 𝐹𝐹𝐹𝐹 correction and with the Eq. (22) 𝐹𝐹𝐹𝐹 correction.
For post-grout CPT data, the calculated 𝑆𝑆𝑉𝑉𝑙𝑙𝑙𝑙 is only reduced by 37% using traditional 𝐹𝐹𝐹𝐹 corrections even
6
though the tip resistance below a depth of 3 meters increased by an average of 240% and the friction increased by an average of 350% post grouting (both comparisons exclude extreme high values obtained). Considering the shear stress reduction effects caused by CG columns, the reduction is only slightly increased, from 37% to 40%. This slight increase of reduction demonstrates that the shear stress reduction caused by the GC column effect is not significant. When corrected for 𝐼𝐼𝑐𝑐, the 𝑆𝑆𝑉𝑉𝑙𝑙𝑙𝑙 is reduced by 60% for a constant 𝐼𝐼𝑐𝑐 increament correction, i.e., ((𝐼𝐼𝑐𝑐)𝑝𝑝𝑉𝑉𝑐𝑐𝑇𝑇,𝑉𝑉𝑐𝑐𝑉𝑉𝑑𝑑 = (𝐼𝐼𝑐𝑐)𝑝𝑝𝑉𝑉𝑐𝑐𝑇𝑇,𝑐𝑐𝑇𝑇𝑉𝑉𝑐𝑐𝑉𝑉𝑉𝑉𝑇𝑇𝑇𝑇𝑉𝑉𝑑𝑑 +∆𝐼𝐼𝑐𝑐.), and by 65% when using pre-grout SBT Index correction, i.e., (𝐼𝐼𝑐𝑐)𝑝𝑝𝑉𝑉𝑐𝑐𝑇𝑇 = (𝐼𝐼𝑐𝑐)𝑝𝑝𝑟𝑟𝑉𝑉.
These results demonstrate that in the evaluation of post-grout behavior using CPT data, the post-grout 𝐼𝐼𝑐𝑐 correction is very important. The preferable method of correction is to directly use the pre-grout (𝐼𝐼𝑐𝑐)𝑝𝑝𝑟𝑟𝑉𝑉. The results also demonstrate that if suitable pre-grout CPT data is not available, for example, from a nearby location, the 𝐼𝐼𝑐𝑐 correction using a constant increment ∆𝐼𝐼𝑐𝑐 should also give a reasonable estimation of settlement.
When incorporating the 𝐹𝐹𝐹𝐹 correction using Eq. (22), the 𝑆𝑆𝑉𝑉𝑙𝑙𝑙𝑙 is reduced by 76% from 26.9 centimeters to 6.4 centimeters by the Boulanger and Idriss's method [3, 4]. This value seems reasonable considering the increases in post-grout CPT tip resistance and friction.
For comparison, the 𝑆𝑆𝑉𝑉𝑙𝑙𝑙𝑙 calculated using Robertson's
method [14] is also shown in Fig. 8. Generally, Robertson's method yields a smaller 𝑆𝑆𝑉𝑉𝑙𝑙𝑙𝑙 value when compared to the Boulanger and Idriss's method.
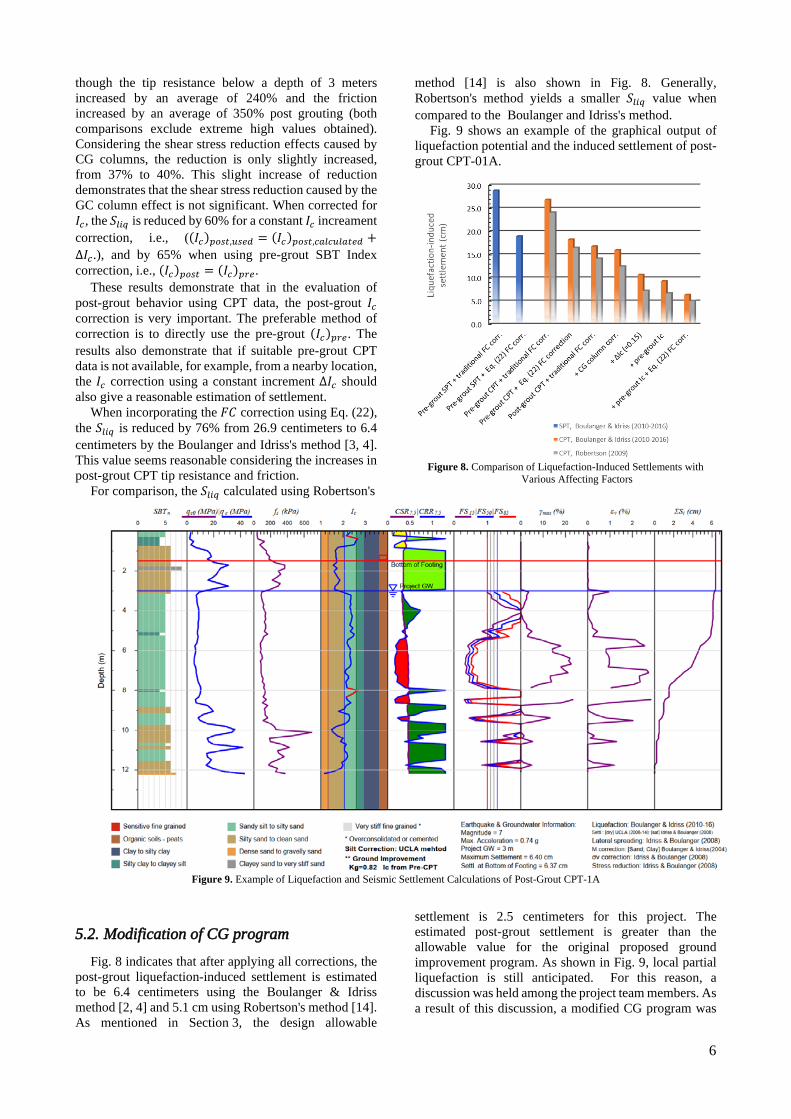
Fig. 9 shows an example of the graphical output of liquefaction potential and the induced settlement of post-grout CPT-01A.
Figure 8. Comparison of Liquefaction-Induced Settlements with
Various Affecting Factors
Figure 9. Example of Liquefaction and Seismic Settlement Calculations of Post-Grout CPT-1A
5.2. Modification of CG program
Fig. 8 indicates that after applying all corrections, the post-grout liquefaction-induced settlement is estimated to be 6.4 centimeters using the Boulanger & Idriss method [2, 4] and 5.1 cm using Robertson's method [14]. As mentioned in Section 3, the design allowable
settlement is 2.5 centimeters for this project. The estimated post-grout settlement is greater than the allowable value for the original proposed ground improvement program. As shown in Fig. 9, local partial liquefaction is still anticipated. For this reason, a discussion was held among the project team members. As a result of this discussion, a modified CG program was

7
proposed. The modified CG program included adding another CG point in the center of the original CG grid. Additional post-grout CPTs were performed after grouting of the additional points. The modified CG program is illustrated in Fig. 10. Two test grids (Grid A and Grid C) were utilized. Grid A is an addition to the original Grid A. Grid C is a new test area. Five post-grout CPTs were performed at Grid A and six post-grout CPTs were performed at Grid C.
Figure 10. Modification of 𝐹𝐹𝐶𝐶 Program
Fig. 11 shows the profiles of CPT tip resistance (𝑞𝑞𝑐𝑐) and friction (𝑜𝑜𝑐𝑐) of Grid A. For comparison, pre-CPT profiles and post-CPT profiles from the original 2.1𝑚𝑚 × 2.1𝑚𝑚 grid CG are also shown in Fig. 11. It can be seen that with the added 𝐹𝐹𝐶𝐶 point in the 2.1𝑚𝑚 × 2.1𝑚𝑚 grid (becoming a 1.5𝑚𝑚 × 1.5𝑚𝑚 grid), the increase to 𝑞𝑞𝑐𝑐 and 𝑜𝑜𝑐𝑐 is significant. Fig. 11 illustrates only the post-CPT-01 and post-CPT-05 profiles for the 1.5𝑚𝑚 × 1.5𝑚𝑚 modified grid. Post-CPT-02, -03 and -04 were performed in order to observe the variation in CPT resistance with the distance to the center of the CG point. However, these CPTs were not illustrated in Fig. 11 because shallow refusals were encountered.
Figure 11. Pre- and Post-CPT Profiles of qc and fs
Similar results were obtained from Grid C. With the additional CG point, the calculated 𝑆𝑆𝑉𝑉𝑙𝑙𝑙𝑙
values are all reduced to less than 1 centimeter, which satisfies the project’s allowable settlement criteria.
6. Conclusions and discussions
Compaction grouting was proposed for a project site as the ground improvement method to mitigate the lique-faction hazard. A test program was performed in order to verify the effectiveness of the CG method before com-mencing grouting of the entire site. The test program con-sisted of performing test grouting in two test grids and performing CPT soundings before and after test grouting. Evaluating procedures and the factors affecting the eval-uation of CG performance were discussed. Based on the examination of the test program results, the following conclusions can be reached.
1. Compaction grout (CG) can be used to densify soils with high fines content and mitigate liquefaction potential. However, in order to improve the effectiveness of CG, a well designed and executed test program is important.
2. When utilizing CPT to verify the effectiveness of column-type ground improvement, the post-grout CPT data must account for the apparent modifica-tion of the soils thus treated in order to yield ac-curate results. The modification phenomenon ob-served and demonstrated in this paper is termed "pseudo-sandification phenomenon" by the au-thors. In order to yield accurate post-grout results, this phenomenon has to be accounted for. The preferable method of correction of this phenomenon is to directly replace the post-grout SBT Index with pre-grout SBT index, that is, using (𝐼𝐼𝑐𝑐)𝑝𝑝𝑉𝑉𝑐𝑐𝑇𝑇 = (𝐼𝐼𝑐𝑐)𝑝𝑝𝑟𝑟𝑉𝑉. The actual post-grout liquefaction-induced settlement is very sensitive to this correction.
3. If suitable pre-grout CPT data is not available, for example, from an appropriate area nearby, a correction using a constant increment ∆𝐼𝐼𝑐𝑐, i.e., (𝐼𝐼𝑐𝑐)𝑝𝑝𝑉𝑉𝑐𝑐𝑇𝑇,𝑉𝑉𝑐𝑐𝑉𝑉𝑑𝑑 = (𝐼𝐼𝑐𝑐)𝑝𝑝𝑉𝑉𝑐𝑐𝑇𝑇,𝑐𝑐𝑇𝑇𝑉𝑉𝑐𝑐𝑉𝑉𝑉𝑉𝑇𝑇𝑇𝑇𝑉𝑉𝑑𝑑 + ∆𝐼𝐼𝑐𝑐 , can also be substituted to provide a reasonable estimation of the pre-grout conditions.
4. For soils with 𝐹𝐹𝐹𝐹 higher than 35%, the correction of the liquefaction-induced volumetric strain for fines contents is important. Although further verification studies are needed, it is the authors' opinion that the 𝐹𝐹𝐹𝐹 correction to volumetric strain proposed by Yee et al. [26] would be applicable.
5. Although it should be considered, the shear stress reduction correction for column-type improvement is not as important as the 𝐼𝐼𝑐𝑐 and 𝐹𝐹𝐹𝐹 corrections.
6. For the same replacement ratio, more dense grout grids provide better improvement. An optimum grid size is important and should be determined by a test program.
Based on the results of this study, the authors believe that further research and improvements for the following topics are needed.
1. In order to reasonably evaluate the effectiveness of ground improvement, the involvement of an experienced geotechnical engineer from the be-ginning of the planning stage is very important.
2. In the current study, because of the limitation of the simplified liquefaction evaluation procedures,
8
only the post-grout behavior of the soils the CG columns was examined. The contribution of CG column itself was excluded. A total evaluation of the post-grout behavior of the densified soils and the CG columns is necessary. In order to develop a method that can appropriately evaluate the total post-grout behavior and can be applied in the practice, centrifuge model tests or three-dimen-sional finite element method studies are neces-sary.
3. Further verification studies for the application of the 𝐹𝐹𝐹𝐹 correction proposed by Yee et al. [26] are needed.
References [1] Morton, D. M., and Miller, F. K. (2006). "Geologic Map of the
San Bernardino and Santa Ana 30 minute by 60 minute Quadran-gles, California." U.S. Geological Survey Open-File Report 2006-1217, Scale: 1:100,000.
[2] Idriss, I. M., and Boulanger, R. W. (2008). "Soil Liquefaction Dur-ing Earthquake." Earthquake Engineering Research Institute, EERI Publication MNO‑12.
[3] Boulanger, R. W., and Idriss, I. M. (2014). "CPT and SPT based liquefaction triggering procedures." Rep. No. UCD/CGM-14/01, Univ. of California, Davis, CA.
[4] Boulanger, R. W., and Idriss, I. M. (2015). "CPT-based liquefac-tion triggering procedure." Journal of Geotechnical and Geoenvi-ronmental Engineering, ASCE, 04015065, 10.1061/(ASCE)GT. 1943-5606.0001388.
[5] Youd, T. L., and Idriss, I. M. (2001). "Liquefaction Resistance of Soil: Summary Report from the 1996 NCEER and 1998 NCEER/NSF Workshops on Evaluation of Liquefaction Re-sistance of Soils." Journal of Geotechnical and Geoenvironmental Engineering, Vol. 127, No. 4, April 2001, pp. 297‑313.
[6] Idriss, I. M., and Boulanger, R. W. (2004). "Semi‑empirical pro-cedures for evaluating liquefaction potential during earthquakes." Proc., 11th Int. Conference on Soil Dynamics and Earthquake En-gineering, and 3rd Int. Conference on Earthquake Geotechnical Engineering, D. Doolin et al., eds., Stallion Press, Vol. 1, 32‑56.
[7] Yi, F. (2019). "GeoSuite©, version 2.4 ‑ A Comprehensive Pack-age for Geotechnical and Civil Engineers." http://geoad-vanced.com/
[8] Seed, H. B., and Idriss, I. M. (1971). "Simplified procedure for evaluating soil liquefaction potential." J. Soil Mechanics and Foundations Div., ASCE97(SM9), 1249‑273.
[9] Seed, H. B., and Idriss, I. M. (1982). "Ground motions and soil liquefaction during earthquakes." Earthquake Engineering Re-search Institute, Monograph Series, Monograph No. 5.
[10] Seed, H. B., and Tokimatsu, K., Harder, L. F., and Chung, R. M. (1985). "The influence of SPT procedures in soil liquefaction re-sistance evaluations." J. Geotech. Engrg., ASCE, 111(12), 1425-1445.
[11] Liao, S. C., and Whitman, R. V. (1986). "Overburden correction factors for SPT in sand." J. Geotech. Engrg., ASCE, 1986, 112(3), 373‑377.
[12] Idriss, I. M. (1999). "An update to the Seed‑Idriss simplified pro-cedure for evaluating liquefaction potential." in Proceedings, TRB Workshop on New Approaches to Liquefaction, Publication No. FHWA‑RD‑99‑165, Federal Highway Administration, January.
[13] Robertson, P. K. and Wride, C. E. (1998) "Evaluating cyclic liq-uefaction potential using the cone penetration test." Canadian Ge-otechnical Journal, 35: 442‑459.
[14] Robertson, P. K. (2009). "Performance based earthquake design using the CPT", Proceedings of The International Conference on Performance-Based Design in Earthquake Geotechnical Engineer-ing (IS-Tokyo 2009), 15 -18 June 2009.
[15] Robertson, P. K. (2009). "Interpretation of Cone Penetration Tests ‑ a unified approach", Canadian Geotechnical Journal, 2009, 46(11): 1337‑1355.
[16] Zhang, G., Robertson, P. K., and Brachman, R. W. I. (2002). "Es-timating liquefaction‑induced ground settlements from CPT for
level ground" Canadian Geotechnical Journal, Ottawa, 39: 1168‑1180.
[17] Ishihara, K., and Yoshimine, M. (1992). "Evaluation of settle-ments in sand deposits following liquefaction during earth-quakes." Soils and Foundations 32(1), 173‑188.
[18] Yoshimine, M., Nishizaki, H., Amano, K., and Hosono, Y. (2006). "Flow deformation of liquefied sand under constant shear load and its application to analysis of flow slide in infinite slope." Soil Dynamics and Earthquake Eng. 26, 253‑264.
[19] Baez, J. I., and Martin, G. R. (1993). "Advances in the design of vibro systems for the improvement of liquefaction resistance." Proc., 7th Annual Symp. of Ground Improvement, Canadian Ge-otechnical Society, Vancouver, BC, Canada.
[20] Baez, J. I. (1995). "A design model for the reduction of soil lique-faction by using vibro-stone columns." Ph.D. thesis, Univ. of Southern California, Los Angeles.
[21] Rayamajhi, D., et al. (2014). "Numerical study of shear stress dis-tribution for discrete columns in liquefiable soils." J. Geotech. Ge-oenviron. Eng., 2014, 140(3): 04013034.
[22] Rayamajhi, D., et al., (2015). "Dynamic centrifuge tests to evalu-ate reinforcing mechanisms of soil-cement columns in liquefiable sand." J. Geotech. Geoenviron. Eng., 2015, 141(6): 04015015.
[23] Rayamajhi, D., Ashford, S. A., Boulanger, R. W., and Elgamal, A. (2016). "Dense granular columns in liquefiable soils: Shear rein-forcement and cyclic stress ratio reductions." J. Geotech. Geoen-viron. Engrg., 2016, 142(7): 04016023.
[24] Rayamajhi, D., Boulanger, R. W., Ashford, S. A., and Elgamal, A. (2016). "Dense granular columns in liquefiable ground: Effects on deformations." J. Geotech. Geoenviron. Engrg., 2016, 142(7): 04016024.
[25] Lew, M., and Tran, L. (2012). "Case History of Observed Lique-faction-Induced Settlement Versus Predicted Settlement." Pro-ceedings of The Fifteenth World Conference on Earthquake Engi-neering, Lisbon, Portugal, 2012.
[26] Yee, E., Duku, P. M., and Stewart, J. P. (2014). "Cyclic volumetric strain behavior of sands with fines of low plasticity." J. Geotech. Geoenviron. Engrg., ASCE, 140(4), 04013042 (10 pages).
[27] Stewart, J. P. (2014). Notes on Seismic Compression of Com-pacted Soils, C&EE 225 - Geotechnical Earthquake Engineering, University of California, Los Angeles.