isbr management journal · volume 2, issue1, may 2017 isbr management journal 33 prices and bse...
TRANSCRIPT

Volume 2, Issue1, MAY 2017 ISBR Management Journal
31
A STUDY ON VOLATILITY OF NON AGRICULTURAL COMMODITY
PRICES WITH RESPECT TO BSE SENSEX
* Divya.U
** Dr. Noor Firdoos Jahan
Abstract
A Stock market and commodity market are the two main pillars of financial system of any country.
Developing countries like India and china require huge investment in commodities such as steel and
oil to build their infrastructure, cotton and metals to boost their manufacturing sector, and food
related commodities to feed their growing population. These trends have created heavy demand for
commodities and in turn high prices of commodities. High demand and prices have attracted many
investors towards commodity market who were formerly used to invest only in stock and bond
markets. Always it has been an area of interest for researcher to investigate between stock market
prices and commodity market prices to identify the relationship between them.With this background
we have undertaken a study to analyze the volatility of non agricultural commodity prices with
respect to BSE sensex to understand the co movement between commodity prices and BSE sensex.
The standard deviation, correlation and betas were calculated to understand the risk and co movement
between commodity prices and BSE sensex. The study found that correlation between commodities
and BSE sensex are negative for the period. This finding again proves the existing literature which
says the commodity market and stock markets are negatively correlated and they move in opposite
direction.
Key words :BSE Sensex, Commodity market, Beta, standard deviation, risk, co movement,
correlation.
*Assistant professor, CIMS B school, Bangalore.** Professor, RV Institute of Management, Bangalore
Volume 2, Issue1, MAY 2017 ISBR Management Journal
32
JEL classification: I32, P10, R21, R12
Introduction
Stock market and commodity market are the two main pillars of financial system of any country.
Stock market facilitates the buying and selling of shares and commodity market facilitates the trading
in commodities. Commodity market plays a vital role in the development of the economy.
Developing countries like India and china require huge investment in commodities such as steel and
oil to build their infrastructure, cotton and metals to boost their manufacturing sector, and food
related commodities to feed their growing population. These trends have created heavy demand for
commodities and in turn high prices of commodities. High demand and prices have attracted many
investors towards commodity market who were formerly used to invest only in stock and bond
markets. The commodity prices also affect the share prices of the company. Whenever the
commodity becomes inexpensive the companies can purchase their raw materials and other
commodities at lesser prices which in turn reduces their cost of production which lead to low prices
of their final products ,more demand for their products and which increases their earnings and the
stock prices of the company. On the other hand if the commodity prices increases the companies cost
of production increases due to high prices of raw materials which in turn lead to high prices of their
final products, low demand, low profits and decrease in the share prices of the companies. Thus we
can say there is a strong relationship between operations of commodity market and stock market.
With this background we have undertaken a study to analyze the volatility of non agricultural
commodity prices with respect to BSE sensex to understand the co movement between commodity

Volume 2, Issue1, MAY 2017 ISBR Management Journal
33
prices and BSE sensex. The standard deviation, correlation and betas were calculated to understand
the risk and co movement between commodity prices and BSE sensex.
2. Objectives of the study
1. To understand the relationship between commodity market and stock market.
2. To study the volatility of non agricultural commodity prices with respect to BSE Secsex.
3. To study the co movement between selected non agricultural commodities and BSE Sensex.
4. To compute the risk of selected Non agricultural commodities and BSE Sensex.
3. Research methodology
The descriptive method of research was adopted for the study. The study was mainly based on
secondary sources of information which was collected from BSE and MCX commodity market
websites. The six actively traded non agricultural commodities like
Gold.Silver,Copper,Aluminium,Crude oil,Natuaral oil were selected for the study with respect to
BSE sensex. The BSE Sensex and non agricultural commodities monthly prices from January 2011 to
January 2017 were used for analysis of data. From these monthly prices the monthly returns were
computed. Then these returns were used to compute Standard deviation, Beta and correlation among
sensex and non agricultural commodities using MS Excel.
4. Review of Literature
Giradri(2015) studied about correlation of agricultural prices with stock market dynamics and found
that the correlation between agricultural prices and stock market returns tends to increase during

Volume 2, Issue1, MAY 2017 ISBR Management Journal
34
periods of financial turmoil. The impact of financial turmoil on correlation gets stronger as the share
of financial investors in agricultural derivatives market raises.
Zheng(2014) investigated linkage between aggregate stock market investor sentiment and commodity
future returns and found that there is negative relationship between investor sentiment and
commodity future returns. The author concluded that commodity futures are excellent investment
vehicle during stock market pessimism.
Chakrabarthy & sarkar(2010) studied about efficiency of the Indian commodity and stock market
with focus on some agricultural product. They concluded that commodity spot market indices and
future spot market indices are co integrated with each other. S&P CNX Nifty 50 is co integrated to
the other commodity spot price indices. So if the information regarding any one of the index is
available, hedging can be done on other commodity indeces.
Lee,Leuthold & Cordies(1985) studied about the stock market and the commodity future markets
diversification and arbitrage potential and suggested that commodity futures contracts may be used
in conjunction with an equity portfolio to help reduce risk and enhance portfolio returns. Opportunity
for portfolio arbitrage between the two indexes are not likely however.
Hemavathy & Guruswamy(2016 ) have studied about causality and co integration between gold
prices and NSE S&P CNX Nifty and concluded that there exists a long run causal relationship
between daily gold price and return on NSE. When the gold prices changes then there exist change in
the Indian stock market but when there is change in stock market it does not affected the gold prices.

Volume 2, Issue1, MAY 2017 ISBR Management Journal
35
There existed one dimensional relationship between the gold prices and daily NSE S&P CNX Nifty
index.
5. Analysis of Data
Table 1: Standard deviation of Sensex and six Commodities from 2011 to 2016
Source:Author
Interpretation:
Commodities S.D
Sensex 4%
Gold 5%
Silver 8%
Copper 6%
Aluminum 5%
Crude oil 17%
Natural oil 10%

Volume 2, Issue1, MAY 2017 ISBR Management Journal
36
The SD represents the deviation of actual return from its average expected return and it considers
both positive and negative deviation of return from average return. The above analysis shows that
highest percentage of SD is 17% which belongs to crude oil and it is highly volatile in returns and the
lowest SD is 4% for SENSE which shows less volatility in return. The other commodities like
GOLD, and ALUMINUM also has lowest SD of 5% which shows the low level of fluctuations in
their returns. For consistency in return it better to invest in Sensex which has lowest risk compared to
other commodities.
Table 2: Correlation of Commodities with respect to Sensex from 2011 to 2016
Source: Author
Commodity Correlation
Sensex 1
Correlation between sensex and gold -0.1611
Correlation between sensex and silver -0.1026
Correlation between sensex and copper -0.2533
Correlation between sensex and aluminum -0.1019
Correlation between sensex and crude oil -0.1203
Correlation between sensex and natural gas -0.0778

Volume 2, Issue1, MAY 2017 ISBR Management Journal
37
Interpretation:
The analysis shows that every commodity is in negative correlation with respect to sensex and they
move opposite to sensex movements. If sensex increases commodity decreases and vice versa. This
proves again the fact that stock market and commodity markets are inversely related and equity
market is not doing well, commodity market would do well and vice versa. Copper is in more
negatively correlated with respect to the sensex. Overall analysis shows opposite moment of
commodities and equity stocks.
Table 3: Beta of the Commodities with respect to Sensex from 2011 to 2016.
Commodities BETA
Sensex 1
Gold -0.14146
Silver -0.05345
Copper -0.19446
Aluminum -0.095
Crude oil -0.03189
Natural oil -0.03417
Source: Author

Volume 2, Issue1, MAY 2017 ISBR Management Journal
38
Interpretation:
Beta here means sensitivity of commodities movement to stock index movement i.e sensex. Beta
value of Gold is -0.14146 means 10% increase in Sensex lead to 1.4% decrease in gold, Beta value of
Silver is -0.05345 means increase in 10% of Sensex lead to 0.5% decrease in Silver. Beta value of
copper is -0.19446 means increase in 10% of Sensex lead to 1.9%decrease in copper. Beta value of
Aluminum is -0.09500 which means increase in 10% of Sensex lead To 0.9%decrease in Aluminum.
Beta of crude oil is -0.03189 which means 10% increase in Sensex lead to 0.3% decrease in crude oil.
Beta value of natural gas is -0.03417 which means 10% increase in Sensex lead to 0.3% decrease in
crude oil and vice varsa. Negative beta indicates the sensex i.e stock market and commodity market
investments are good portfolio combinations which reduces risk for investors as they are negatively
correlated.
Table: 4 Correlations between Gold with Sensex
YEAR 2011 2012 2013 2014 2015 2016
CORRELATION -0.2713 -0.3994 -0.1808 0.13498 0.38251 -0.3342
Source: Author

Volume 2, Issue1, MAY 2017 ISBR Management Journal
39
Interpretation:
The correlation between gold and sensex is negative in 4 years out of six years and it is positive in
two years that is only in 2014 and 2015. It again proves the already existing literature result that gold
and stock market moves in opposite direction and are negatively correlated over a long period of time
and this relation vary only for short period.
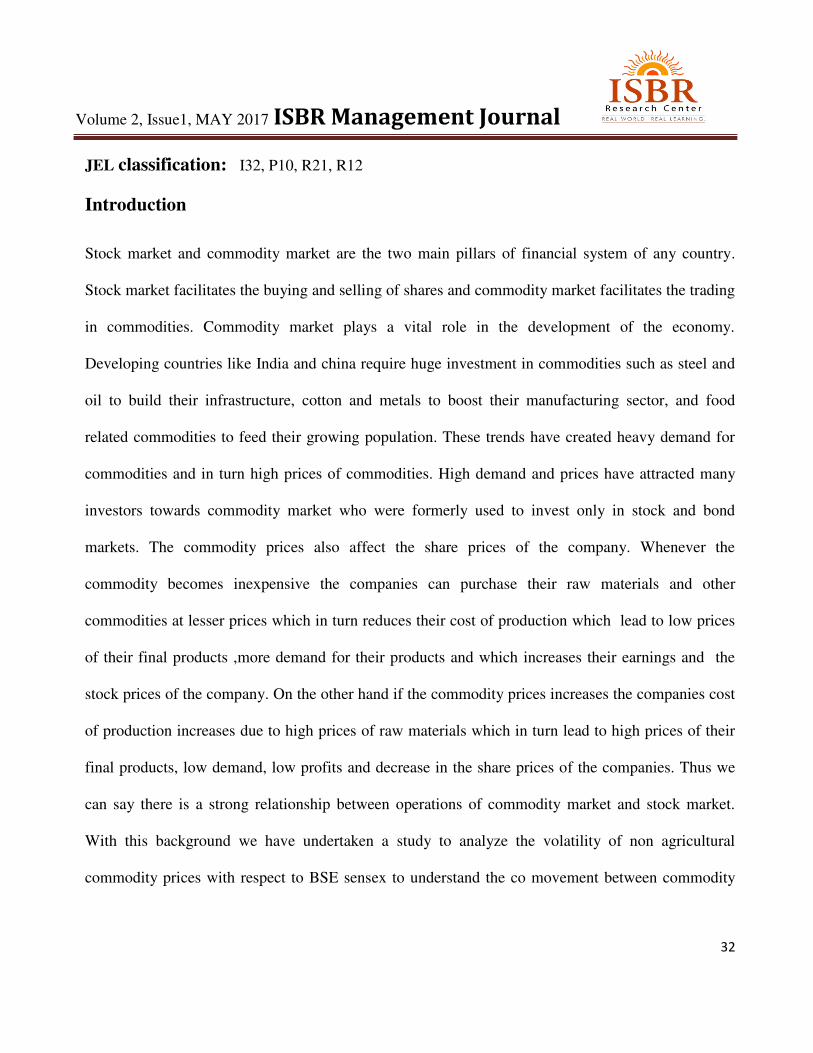
Table 5: Correlation between Silver with Sensex
YEAR 2011 2012 2013 2014 2015 2016
CORRELATION -0.2688 -0.1183 0.00436 0.0939 0.25656 0.1265
Source: Author
Volume 2, Issue1, MAY 2017 ISBR Management Journal
40
Interpretation:
The above table shows that in the year 2011 and 2012 the correlation between silver and sensex was
negative which means both of them moved in opposite direction, but from 2013 onwards there was a
slight positive correlation between silver and sensex and both of them moved in the same direction.
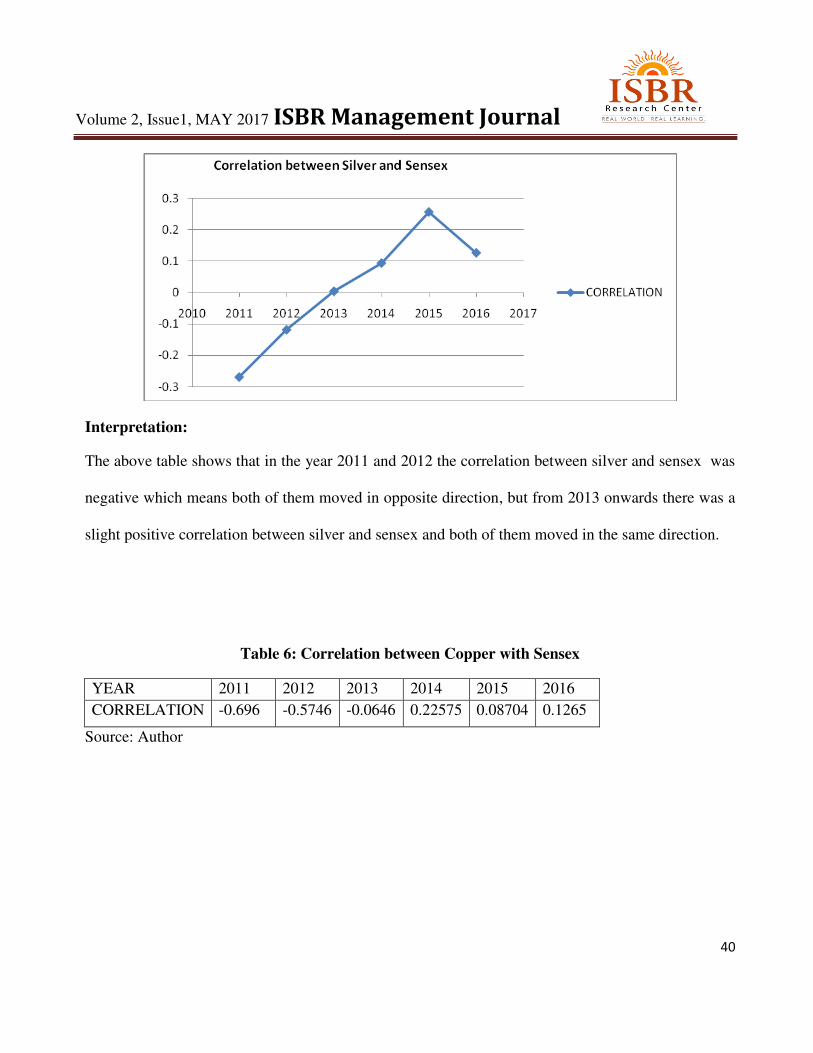
Table 6: Correlation between Copper with Sensex
YEAR 2011 2012 2013 2014 2015 2016
CORRELATION -0.696 -0.5746 -0.0646 0.22575 0.08704 0.1265
Source: Author

Volume 2, Issue1, MAY 2017 ISBR Management Journal
41
Interpretation:
In the years 2011 to 2013 the correlation is negative between copper and sensex. But from the year
2014 onwards the correlation between Sensex and Copper became positive that shows movement of
prices in the same direction.
Table 7: Correlation of Aluminum with Sensex
YEAR 2011 2012 2013 2014 2015 2016
CORRELATION -0.2511 -0.2254 -0.2864 0.22575 0.09397 0.1597
Source: Author

Volume 2, Issue1, MAY 2017 ISBR Management Journal
42
Interpretation:
The correlation between Aluminum and sensex was negative inversely related for years 2011 to 2013
and they became positive 2014 onwards.
Table 8: Correlation of Crude oil with Sensex year wise:
YEAR 2011 2012 2013 2014 2015 2016
CORRELATION -0.1009 -0.1597 -0.2873 -0.241 0.15709 0.1876
Source: Author
Interpretation:
As shown in the above table, from the year 2011 to 2014 correlation between CRUDE OIL and
SENSEX was negative that shows inverse relationship. But in the year 2015 and 2016 their existed a
slight positive correlation and they moved together.
Table: 9 Correlation of Natural gas with Sensex yearwise:
YEAR 2011 2012 2013 2014 2015 2016
CORRELATION -0.4035 -0.3728 0.23917 0.36447 -0.2898 0.0373
Source: Author

Volume 2, Issue1, MAY 2017 ISBR Management Journal
43
Interpretation:
There existed a negative correlation between Natural gas and sensex in the years 2011 and 2012 but
in year 2013 and 2014 the correlation became slight positive but again in the year 2016 the
correlation became little positive but close to zero which indicated the natural gas movement was not
related with sensex movement for that year.
6. Findings and conclusion
The standard deviation computed for a period of 2011 to 2016 indicates that the crude oil is
having17% highest standard deviation which is more risky for investment and more volatile in giving
returns compared to other commodities and sensex. The lowest standard deviation is 4% of BSE
sensex which means investing on stock market has given stable returns to investors over long period
of time. The next lowest standard deviation is of Gold which is also less risky for long term
investments compared to other non agricultural commodities .The correlation between commodities

Volume 2, Issue1, MAY 2017 ISBR Management Journal
44
and BSE sensex are negative for the period. This finding again proves the existing literature which
says the commodity market and stock markets are negatively correlated and they move in opposite
direction. The betas of commodities with respect to sensex are also negative to conclude as the stock
market and commodity market returns are negatively correlated these two are a very good
combination for investors portfolio construction to build optimal portfolio with good returns and less
risk.
7. Bibliography.
1. Beyza Mina Ordu, and Ugur Soyta(2016), “The Relationship Between Energy Commodity Prices
and Electricity and Market Index Performances: Evidence from an Emerging Market”,Emerging
Markets Finance & Trade, 52:2149–2164.
2. Cheng F..H.yntond M. Leuthold and Jean E. Cordier, (1985) “The stock market and the
commodity future market:Diversification and arbitrage potential”Financial Analyst Journal July-
august pp-53-60.
3. Daniele Girardi(2015) “Financialization of food. Modelling the time-varying relation
between agricultural prices and stock market dynamics” International Review of Applied
Economics, Vol. 29, No. 4, 482–505.
4. Dr. Gulsar Meric ,Dr.Niranjan patil & Dr.Ilhan Meric(2011) “co movement of the Indian stock
market with other stock markets – implications for portfolio diversification” Indian Journal of
Finance ,volume-5, no.10,October,pp13-20
5. Greet Bekaert & Kuen Inghhelbrecht (2007) “the determinants of stock and bond return co
movements” NBB working paper no.119 October 2007 Brussels issn-1375-680x(print) ISSN-
1784-2476(Online).
6. Julien Chevalliera, and Florian Ielpob(2013) “ Cross-market linkages between commodities,
stocks and bonds “,Applied Economics Letters, Vol. 20, No. 10, 1008–1018

Volume 2, Issue1, MAY 2017 ISBR Management Journal
45
7. P. Hemavathy & S. Gurusamy(2016) Testing the Causality and Co integration of Gold Price and
NSE (S&P CNX NIFTY): Evidence from India , Amity Global Business Review February pp
79-85
8. Pushan Dutt & Ilian Mihov (2008) “stock market co movement and industrial structure”INSEAD
Faculty and Research working paper December 2008.
9. Prasanna Chandra “Investment analysis and portfolio management” Tata Graw Hill.
10. Rossi.R.P.Gallant, & Tauchen (1992) “stock prices and volume” Review of financial studies
vol.5.
11. Robert Johnson and Luc Soenen “Commodity Prices and Stock Market Behavior in South
American Countries in the Short Run”, Emerging Markets Finance & Trade / July–August 2009,
Vol. 45, No. 4, pp. 69–82.
12. Ranajit chakrabarthy,asima sarkar(2010) “Efficiency of the Indian Commodity and Stock Market
with Focus on Some Agricultural Product” Paradigm Vol. No. XIV, No.1, January – June
13. Robin. M .Green wood (2005)“A cross sectional analysis of the excess co movement of stock
returns” Finance research paper no.05-069 of Harvard business school.
14. Robin. M .Green wood (2005)“A cross sectional analysis of the excess co movement of stock
returns” Finance research paper no.05-069 of Harvard business school.
15. Sanjay Sehgal and Asheesh Pandey(2012) “Strategic Allocation, Asset Pricing and Prior
Return Patterns: Evidence from Indian Commodity Market”, Vision 16(4) 273–28, SAGE
Publication
16. Tarun .K Mukhergee , Atsuyuki & Naka(1995) “Dynamic relations between macro economic
variables and the Japanese stock market an application of vector error correlation model”.the
journal of financial research, XVIII(2) 223,237.
17. Yao.Zheng(2014) “The linkage between aggregate stock market investor sentiment and
commodity futures returns” Applied Financial Economics, Vol. 24, No. 23, 1491–1513.