isa second quarter 2013 financial results medellín, … · page 2 of 19 isa s.a. e.s.p calle 12...
TRANSCRIPT

ISA S.A. E.S.P Calle 12 Sur 18-168 Medellín, Colombia
Relacionamiento con Inversionistas [email protected] [email protected] @ISA_Avanza www.isa.com.co
ISA S.A. E.S.P. (BVC: ISA; OTC: IESFY) (“ISA” or “the Company”), a Colombian organization engaged in the businesses of Energy Transmission, Road Concessions, Telecommunications Transport and Intelligent Management of Real-Time Systems, today announced the financial results for the second quarter of 2013. Unaudited figures are expressed in millions of Colombian pesos (COP). The consolidation process includes 100% of the companies where ISA holds control and the homologation of the accounting practices of each country (Chile, Brazil and Peru currently report based on IFRS – International Financial Reporting Standards), according to Generally Accepted Accounting Principles in Colombia (GAAP). ECONOMIC AND FINANCIAL RESULTS AS OF JUNE 2013
Consolidated operating revenues were COP 1,716,297 million. EBITDA reached COP 937,587 million, with a 54.6% EBITDA margin.
Net income was COP 217,528 million, with a 19.6% margin before minority interest.
Consolidated assets were COP 27,127,210 million.
For the period ended June 2013, accumulated net income for ISA and its companies was COP 217,528 million, representing a 49.3% increase compared to COP 145,652 million for the same period of the previous year. Both, the accumulated financial results for the period ended in June 2013 as well as second quarter results, were positively impacted by the recognition as a financial asset (formerly an intangible asset) of the Chilean and Brazilian concessions. This change became effective for the 2013 fiscal period, according to technical concept
1 issued by the
General Accounting Office (Contaduría General de la Nación, CGN). The concept establishes that prior to the homologation of the financial information and the application of the equity method, it is necessary to determine whether the asset for the concession operator corresponds to a debtor (financial asset) or to an intangible, based on the analysis of the business model and the rights and guarantees stemming from the conditions agreed upon in the concession contract.
1 CGN Notice N° 20132000017991 of 05-28-2013
ISA SECOND QUARTER 2013
FINANCIAL RESULTS
Medellín, Colombia, July 31, 2013

Page 2 of 19
ISA S.A. E.S.P Calle 12 Sur 18-168 Medellín, Colombia Relacionamiento con Inversionistas
[email protected] [email protected] @ISA_Avanza www.isa.com.co
In accordance with the above-mentioned, Chilean road concessions and energy transmission concessions in Brazil are classified as financial assets, given that under the remuneration mechanisms provided in the contracts, the assignor guarantees to operator the recovery of the investment. The main impacts that are generated from the changes from intangible asset to financial asset are the recognition of the accounts receivable balance, removing the intangible assets and the accumulated amortization as well as the recognition of the financial profit (Income Statement) from the accounts receivable, revenues and construction costs, eliminating revenues from toll road from the Chilean road concession, the regulatory remuneration for energy services in the Brazilian concessions and the amortization of the intangible asset. On the other hand, the results include the effects from the early termination and subsequent renewal of Concession Contract 059/2001 in affiliate CTEEP
2, and the consolidation of Evrecy Participações Ltda. since the first quarter of
2013. It is also important to note that the impact from the conversion on the consolidated financial statements generated significant variations in the various items, due to the devaluation effects of the Colombian peso against the Brazilian Real, the U.S. Dollar and the Chilean Peso, with the greatest variations represented in the Brazilian affiliates and subsidiaries
3. However, the effect is largely neutralized in the net result.
CONSOLIDATED INCOME STATEMENT Consolidated operating revenues For the first half of 2013, accumulated operating revenues reached COP 1,716,297 million, a 21.5% or COP 469,903 million decrease compared with the same period of 2012. This was mainly generated by the effects of the early termination and subsequent renewal of Concession Contract 059/2001 in CTEEP.
(Figures in millions)
In the second quarter of 2013, operating revenues decreased 13.8% given the lower revenues from energy transmission in Brazil. Composition of accumulated revenues by business
Energy Transmission4 contributed COP 1,142,226 million, equivalent to 66.6% of operating revenues for
the first half of 2013. This result represented 33.2% decline, compared with the amount reported in the same period in 2012, mainly due to lower revenues from CTEEP. This decrease in Brazil absorbed the
2 See Highlights from 4Q12 Results Report 3 COP/BRL average for 2013 was 898.16 vs. 962.36 for 2012 4 ISA in Colombia, TRANSELCA, CTEEP, ISA Capital do Brasil, Interligação Elétrica de Minas Gerais, Interligação Elétrica Pinheiros, Interligação Elétrica Serra do
Japi, Evrecy Participações Ltda, RED de Energía del Perú, ISA Perú, Transmantaro, ISA Bolívia, Proyectos de Infraestructura del Perú.
OPERATING REVENUES 2Q13 2Q12 Change
COP Var. %
2Q13 USD
6M13 6M12 Change
COP Change
% 6M13 USD
Energy Transmission 616,739 828,375 -211,636 -25.5% 320 1,142,226 1,709,386 -567,160 -33.2% 592
Road Concessions 224,847 167,986 56,861 33.8% 117 465,523 378,971 86,552 22.8% 241
Telecommunications Transport 34,697 28,426 6,271 22.1% 18 66,135 56,911 9,224 16.2% 34
Intelligent management of real-time systems 23,764 19,750 4,014 20.3% 12 42,413 40,932 1,481 3.6% 22
TOTAL OPERATING REVENUES 900,048 1,044,537 -144,489 -13.8% 467 1,716,297 2,186,200 -469,903 -21.5% 890
Page 3 of 19
ISA S.A. E.S.P Calle 12 Sur 18-168 Medellín, Colombia Relacionamiento con Inversionistas
[email protected] [email protected] @ISA_Avanza www.isa.com.co
consolidated revenues from Evrecy Participações Ltda, and higher revenues in Peru that were mainly generated by the entry into operation of the Zapallal Trujillo project in Transmantaro at the end of 2012.
Road Concessions5 contributed 27.1% of all accumulated revenues (6M13), equal to COP 465,523 million,
representing a 22.8% increase compared with the same period last year. This was due to the recognition of concessions as financial assets.
Telecommunications Transport6 contributed COP 66,135 million, which represented 3.9% of total
operating revenues. Accumulated revenues (6M13) increased 16.2% compared to the accumulated revenues reported June 2012, due to new service agreements, mainly in Peru and Colombia.
Intelligent Management of Real-Time Systems7 accounted for COP 42,413 million equal to 2.5% of all
accumulated revenues (6M13) as of June 2013 and increased 3.6% compared with the same period in 2012. This was due to higher regulated revenues in XM, which depend on the levels of investment and expenditures at the Company.
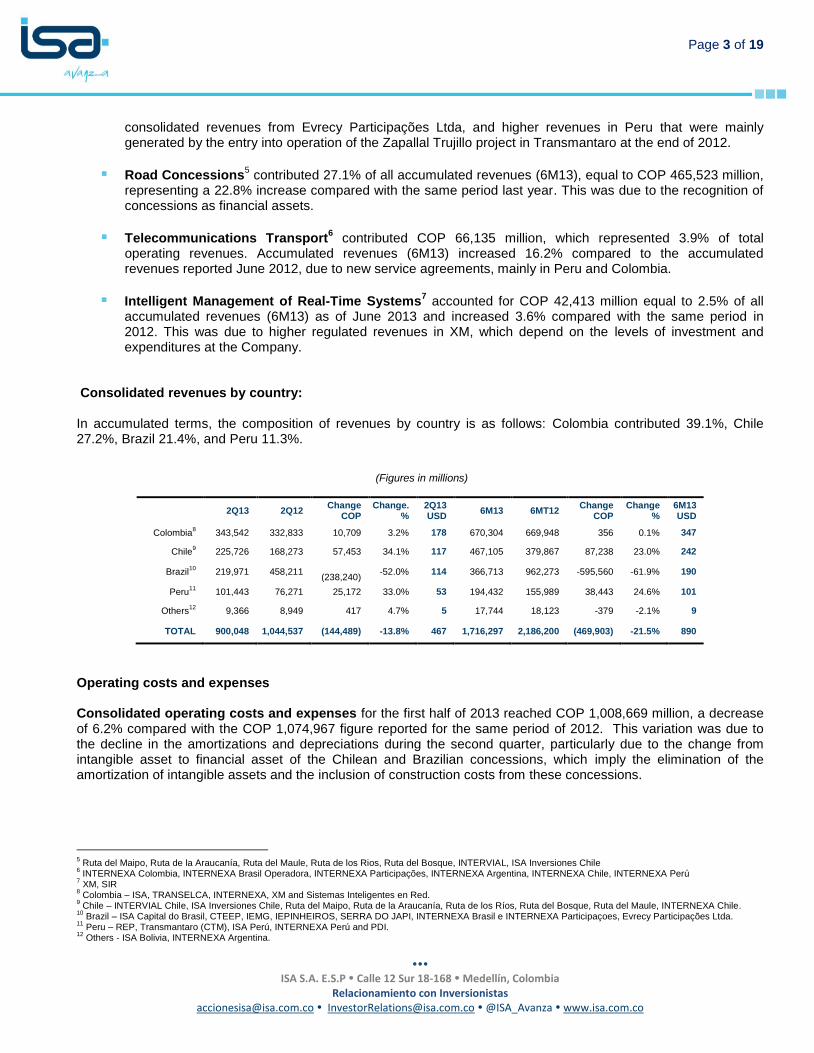
Consolidated revenues by country:
In accumulated terms, the composition of revenues by country is as follows: Colombia contributed 39.1%, Chile 27.2%, Brazil 21.4%, and Peru 11.3%.
(Figures in millions)
2Q13 2Q12 Change
COP Change.
% 2Q13 USD
6M13 6MT12 Change
COP Change
% 6M13 USD
Colombia8 343,542 332,833 10,709 3.2% 178 670,304 669,948 356 0.1% 347
Chile9 225,726 168,273 57,453 34.1% 117 467,105 379,867 87,238 23.0% 242
Brazil10
219,971 458,211
(238,240) -52.0% 114 366,713 962,273 -595,560 -61.9% 190
Peru11
101,443 76,271 25,172 33.0% 53 194,432 155,989 38,443 24.6% 101
Others12
9,366 8,949 417 4.7% 5 17,744 18,123 -379 -2.1% 9
TOTAL 900,048 1,044,537 (144,489) -13.8% 467 1,716,297 2,186,200 (469,903) -21.5% 890
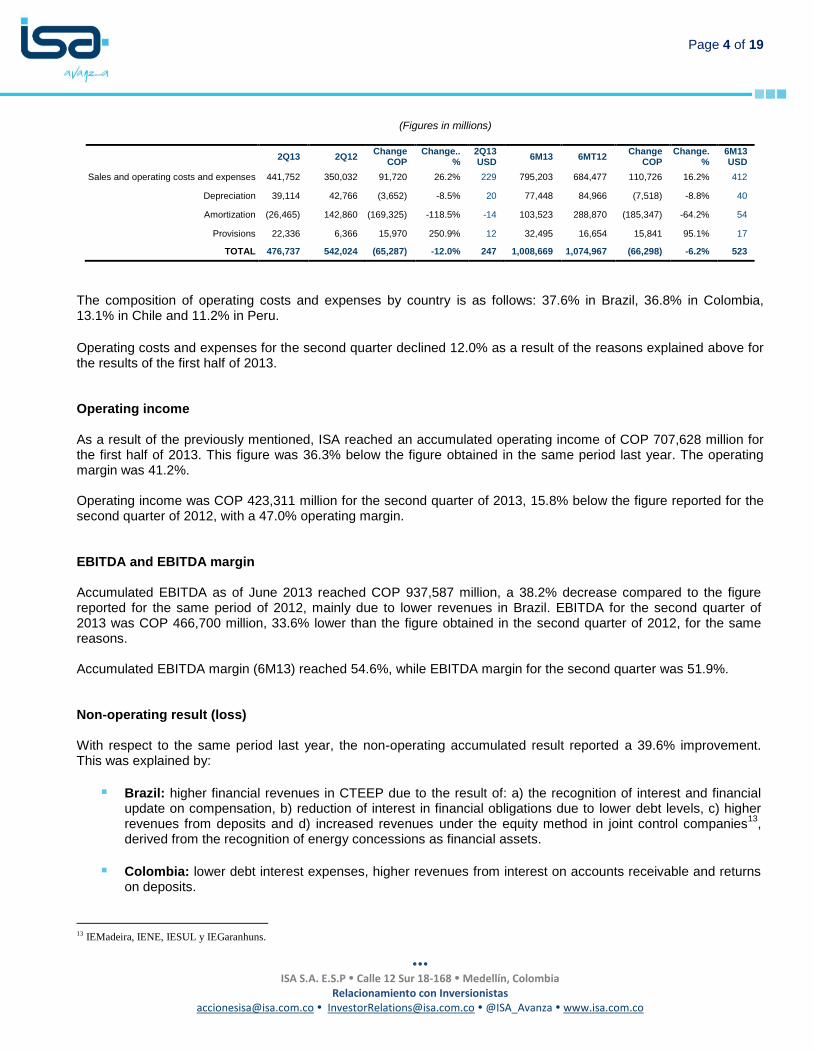
Operating costs and expenses Consolidated operating costs and expenses for the first half of 2013 reached COP 1,008,669 million, a decrease of 6.2% compared with the COP 1,074,967 figure reported for the same period of 2012. This variation was due to the decline in the amortizations and depreciations during the second quarter, particularly due to the change from intangible asset to financial asset of the Chilean and Brazilian concessions, which imply the elimination of the amortization of intangible assets and the inclusion of construction costs from these concessions.
5 Ruta del Maipo, Ruta de la Araucanía, Ruta del Maule, Ruta de los Rios, Ruta del Bosque, INTERVIAL, ISA Inversiones Chile
6 INTERNEXA Colombia, INTERNEXA Brasil Operadora, INTERNEXA Participações, INTERNEXA Argentina, INTERNEXA Chile, INTERNEXA Perú
7 XM, SIR
8 Colombia – ISA, TRANSELCA, INTERNEXA, XM and Sistemas Inteligentes en Red.
9 Chile – INTERVIAL Chile, ISA Inversiones Chile, Ruta del Maipo, Ruta de la Araucanía, Ruta de los Ríos, Ruta del Bosque, Ruta del Maule, INTERNEXA Chile.
10 Brazil – ISA Capital do Brasil, CTEEP, IEMG, IEPINHEIROS, SERRA DO JAPI, INTERNEXA Brasil e INTERNEXA Participaçoes, Evrecy Participações Ltda.
11 Peru – REP, Transmantaro (CTM), ISA Perú, INTERNEXA Perú and PDI.
12 Others - ISA Bolivia, INTERNEXA Argentina.
Page 4 of 19
ISA S.A. E.S.P Calle 12 Sur 18-168 Medellín, Colombia Relacionamiento con Inversionistas
[email protected] [email protected] @ISA_Avanza www.isa.com.co
(Figures in millions)
2Q13 2Q12
Change COP
Change.. %
2Q13 USD
6M13 6MT12 Change
COP Change.
% 6M13 USD
Sales and operating costs and expenses 441,752 350,032 91,720 26.2% 229 795,203 684,477 110,726 16.2% 412
Depreciation 39,114 42,766 (3,652) -8.5% 20 77,448 84,966 (7,518) -8.8% 40
Amortization (26,465) 142,860 (169,325) -118.5% -14 103,523 288,870 (185,347) -64.2% 54
Provisions 22,336 6,366 15,970 250.9% 12 32,495 16,654 15,841 95.1% 17
TOTAL 476,737 542,024 (65,287) -12.0% 247 1,008,669 1,074,967 (66,298) -6.2% 523
The composition of operating costs and expenses by country is as follows: 37.6% in Brazil, 36.8% in Colombia, 13.1% in Chile and 11.2% in Peru.
Operating costs and expenses for the second quarter declined 12.0% as a result of the reasons explained above for the results of the first half of 2013. Operating income As a result of the previously mentioned, ISA reached an accumulated operating income of COP 707,628 million for the first half of 2013. This figure was 36.3% below the figure obtained in the same period last year. The operating margin was 41.2%. Operating income was COP 423,311 million for the second quarter of 2013, 15.8% below the figure reported for the second quarter of 2012, with a 47.0% operating margin. EBITDA and EBITDA margin Accumulated EBITDA as of June 2013 reached COP 937,587 million, a 38.2% decrease compared to the figure reported for the same period of 2012, mainly due to lower revenues in Brazil. EBITDA for the second quarter of 2013 was COP 466,700 million, 33.6% lower than the figure obtained in the second quarter of 2012, for the same reasons. Accumulated EBITDA margin (6M13) reached 54.6%, while EBITDA margin for the second quarter was 51.9%. Non-operating result (loss) With respect to the same period last year, the non-operating accumulated result reported a 39.6% improvement. This was explained by:
Brazil: higher financial revenues in CTEEP due to the result of: a) the recognition of interest and financial update on compensation, b) reduction of interest in financial obligations due to lower debt levels, c) higher revenues from deposits and d) increased revenues under the equity method in joint control companies
13,
derived from the recognition of energy concessions as financial assets.
Colombia: lower debt interest expenses, higher revenues from interest on accounts receivable and returns on deposits.
13 IEMadeira, IENE, IESUL y IEGaranhuns.

Page 5 of 19
ISA S.A. E.S.P Calle 12 Sur 18-168 Medellín, Colombia Relacionamiento con Inversionistas
[email protected] [email protected] @ISA_Avanza www.isa.com.co
Chile: higher financial expenses mainly due to the financial update on preexisting infrastructure liabilities with the Ministry of Public Works, due to recognition of concessions as financial assets in 2013.
Peru: higher financial expenses due to amortization of capitalized debt costs due to prepayment of Transmantaro’s debt, from an international bond issuance under better conditions, in terms of maturity and interest rates; higher interest due to the debt related with the entry into operation of the Zapallal – Trujillo project and higher expenditures due to the exchange rate difference between the U.S. dollar and the Peruvian Sol, over the balances of the accumulated fiscal loans.
The non-operating result in the second quarter improved 15.8% due to the same reasons explained in the first half 2013 results mentioned above. Taxes Income tax expenses decreased 48.0%, from COP 243,856 million in the accumulated results at June 2012 to COP 126,699 million in the same period of 2013. This variation was due to the net result of a) lower taxes at CTEEP associated to lower revenues, and b) higher deferred taxes in Chile due to the tax rate increase from 17% to 20%, as defined in the tax reforms announced at the end of 2012.
The composition of income tax by country was 60.9% in Colombia, 17.9% in Chile, 11.9% in Brazil and 7.5% in Peru. During the second quarter, income tax expenditures declined 55.3% for the same reasons explained in the accumulated result of the year (6M13). Income before minority interest Consolidated income before minority interest for the first half of 2013 was COP 335,580 million, a 27.2% decrease compared with the accumulated figure for the period ended June 2012. The net margin before minority interest was 19.6%. For the first half of 2013, minority interest reached COP 118,052 million, a 62.6% decrease compared with the same period of 2012, explained by lower results in Brazil. Therefore, the margin before minority interest was 22.6% in 2Q13. In the second quarter of 2013, the minority interest decreased 60.2% compared with the same period of 2012, for the reasons mentioned above. Net income As of June 2013, the accumulated net income was COP 217,528 million, representing 49.3% increase compared to the COP 145,652 million reported for the same period of 2012, basically from the impact of the recognition of the Chilean and Brazilian concessions as financial assets, which absorbed the negative effects of the early termination and subsequent renewal of Concession Contract 059/2001 in affiliate CTEEP, mentioned earlier in this report.

Page 6 of 19
ISA S.A. E.S.P Calle 12 Sur 18-168 Medellín, Colombia Relacionamiento con Inversionistas
[email protected] [email protected] @ISA_Avanza www.isa.com.co
CONSOLIDATED BALANCE SHEET Assets Assets for ISA and its companies totaled COP 27,127,210 million, a 5.3% increase compared to December 2012. This increase was the result of the recognition of the Chilean and Brazilian concessions as financial assets as well as the conversion effects due to the devaluation of the Colombian peso versus the local currencies in the countries where ISA is present. The geographical distribution by country of the assets was concentrated in Chile, Colombia and Brazil with 33.6%, 27.6% and 27.5%, respectively. Peru has 10.8% of the assets and the remaining 0.4% was located in other countries. Liabilities Consolidated liabilities were COP 15,358,952 million a decrease of 0.8%, as a result of the debt amortization in CTEEP as well as lower liabilities due to the preexisting infrastructure in Chile
14, partially offset by the conversion
effect and the issue of bonds in Colombia. The distribution of liabilities by country was 45.5% in Chile, 23.6% in Colombia, 18.0% in Brazil, 12.4% in Peru and the remaining 0.5% in Bolivia and Argentina. Minority interest Minority interest reached COP 4,222,030 million, an increase of 1.2% compared to the figure for December 2012. This was due to the conversion effects of the Brazilian companies. Equity Equity reached COP 7,546,228 million, a 23.5% increase, compared with COP 6,110,615 million reported in 2012, mainly due to the recognition of the Chilean and Brazilian concessions as financial assets, the conversion effect of foreign affiliates and the results of the period. CONSOLIDATED CASH FLOW As of June 2013, the figure for cash and cash equivalent was COP 2,760,144 million, an increase of COP 1,083,238 million compared to the end of the 2012 period, basically generated by the receipt of 50% compensation from the early termination and subsequent renewal of Concession Contract 059/2001 in affiliate CTEEP, related to the assets invested after May 2000.
14 Assets received in operation from MOP for maintenance and administration.
Page 7 of 19
ISA S.A. E.S.P Calle 12 Sur 18-168 Medellín, Colombia Relacionamiento con Inversionistas
[email protected] [email protected] @ISA_Avanza www.isa.com.co
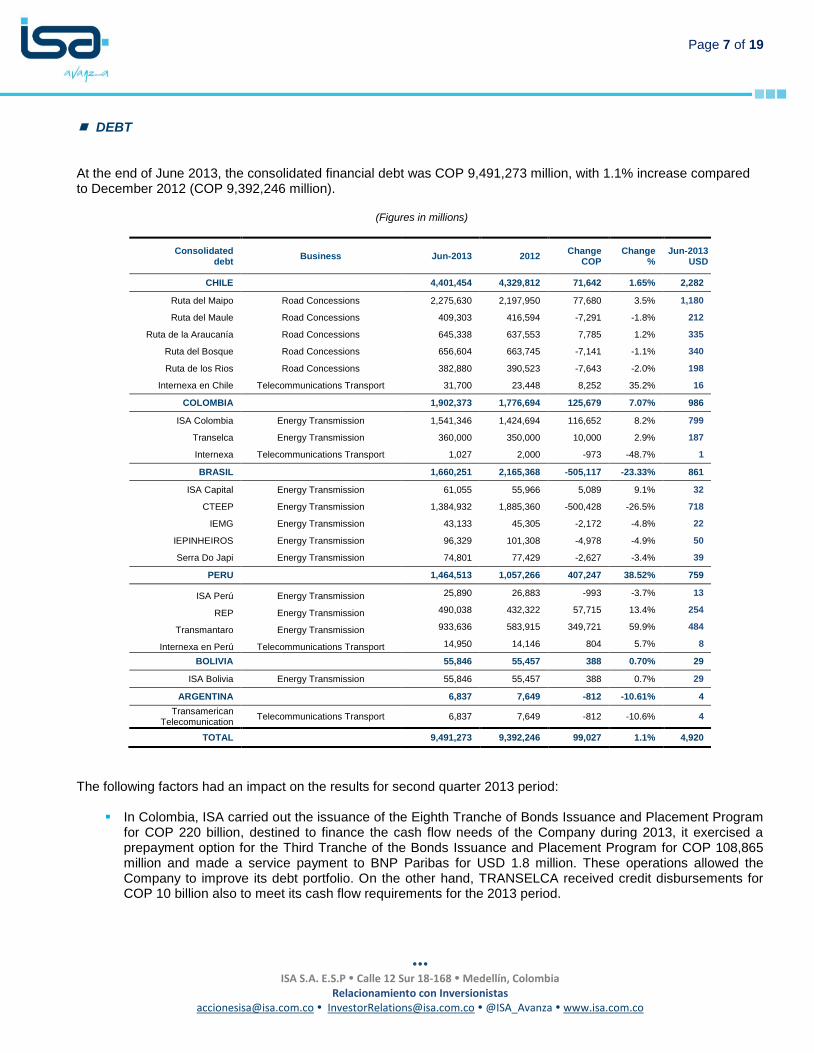
DEBT At the end of June 2013, the consolidated financial debt was COP 9,491,273 million, with 1.1% increase compared to December 2012 (COP 9,392,246 million).
(Figures in millions)
Consolidated debt
Business Jun-2013 2012 Change
COP Change
% Jun-2013
USD
CHILE 4,401,454 4,329,812 71,642 1.65% 2,282
Ruta del Maipo Road Concessions 2,275,630 2,197,950 77,680 3.5% 1,180
Ruta del Maule Road Concessions 409,303 416,594 -7,291 -1.8% 212
Ruta de la Araucanía Road Concessions 645,338 637,553 7,785 1.2% 335
Ruta del Bosque Road Concessions 656,604 663,745 -7,141 -1.1% 340
Ruta de los Rios Road Concessions 382,880 390,523 -7,643 -2.0% 198
Internexa en Chile Telecommunications Transport 31,700 23,448 8,252 35.2% 16
COLOMBIA 1,902,373 1,776,694 125,679 7.07% 986
ISA Colombia Energy Transmission 1,541,346 1,424,694 116,652 8.2% 799
Transelca Energy Transmission 360,000 350,000 10,000 2.9% 187
Internexa Telecommunications Transport 1,027 2,000 -973 -48.7% 1
BRASIL 1,660,251 2,165,368 -505,117 -23.33% 861
ISA Capital Energy Transmission 61,055 55,966 5,089 9.1% 32
CTEEP Energy Transmission 1,384,932 1,885,360 -500,428 -26.5% 718
IEMG Energy Transmission 43,133 45,305 -2,172 -4.8% 22
IEPINHEIROS Energy Transmission 96,329 101,308 -4,978 -4.9% 50
Serra Do Japi Energy Transmission 74,801 77,429 -2,627 -3.4% 39
PERU 1,464,513 1,057,266 407,247 38.52% 759
ISA Perú Energy Transmission 25,890 26,883 -993 -3.7% 13
REP Energy Transmission 490,038 432,322 57,715 13.4% 254
Transmantaro Energy Transmission 933,636 583,915 349,721 59.9% 484
Internexa en Perú Telecommunications Transport 14,950 14,146 804 5.7% 8
BOLIVIA 55,846 55,457 388 0.70% 29
ISA Bolivia Energy Transmission 55,846 55,457 388 0.7% 29
ARGENTINA 6,837 7,649 -812 -10.61% 4
Transamerican Telecomunication
Telecommunications Transport 6,837 7,649 -812 -10.6% 4
TOTAL 9,491,273 9,392,246 99,027 1.1% 4,920
The following factors had an impact on the results for second quarter 2013 period:
In Colombia, ISA carried out the issuance of the Eighth Tranche of Bonds Issuance and Placement Program for COP 220 billion, destined to finance the cash flow needs of the Company during 2013, it exercised a prepayment option for the Third Tranche of the Bonds Issuance and Placement Program for COP 108,865 million and made a service payment to BNP Paribas for USD 1.8 million. These operations allowed the Company to improve its debt portfolio. On the other hand, TRANSELCA received credit disbursements for COP 10 billion also to meet its cash flow requirements for the 2013 period.

Page 8 of 19
ISA S.A. E.S.P Calle 12 Sur 18-168 Medellín, Colombia Relacionamiento con Inversionistas
[email protected] [email protected] @ISA_Avanza www.isa.com.co
TRANSMANTARO in Peru, received disbursements for USD 13 million. It paid credits for USD 34.5 million. It also carried out the First International Bond Issuance under Rule 144A/Regulation S, for USD 450 million, for a 10-year term and a coupon rate of 4.375%, with an oversubscription of 3.1 times. These funds were used to prepay current loans, thereby improving the Company’s debt profile.
ISA Peru paid USD 1.4 million in loans, prepaid a credit held with IFC for USD 6 million and obtained a new credit with Scotiabank for USD 6.6 million, thereby improving the Company’s debt profile.
34.0% of debt is denominated in Unidades de Fomento -UF- (Chile), 18.9% in Colombian pesos, 15.1% in Brazilian Reais, 30.4%
15 in U.S. dollars and 1.6% in other currencies. Approximately 70% of the debt is located in the capital
markets and 30% is located in financial institutions. 82.85% of the debt is long-term and the remaining 17.15% is short-term. CAPEX and INVESTMENTS ISA’s and its companies’ approximate accumulated investments at June 2013 reached COP 526,201 million. During the second quarter it added COP 286,081 million to this amount, including direct investments and capital contributions:
In Colombia, investments were made in new construction and connection for substations projects and capital contributions for ISA Peru and Interchile.
In Brazil, CTEEP made capital contributions to IEMADEIRA, IEPINHEIROS and IESUL as well as operating investments, during the second quarter of 2013.
In Peru, certain reinforcement and connection projects, construction projects as well as changes in the configuration of certain substations and expansions were carried out during the second quarter of 2013.
(figures in millions)
1Q13 2Q13 6M13 % 2013E
Colombia 78,443 78,569 157,011 29.8% 544,792
Brazil 78,22016
138,554 216,775 41.2% 489,162
Peru 68,969 51,731 120,700 22.9% 486,197
Chile 14,451 16,363 30,814 5.9% 13,855
Other 37 865 902 0.2% 1,507
TOTAL 240,120 286,081 526,201 100.0% 1,535,512
The prior information corresponds to the sum of individual investments, not to the result of a consolidation process. Conversion into Colombian pesos was made taking into account the average rate for the quarter. ISA’S RESULTS, INDIVIDUAL
15
It includes Bond 144A of Maipo having a Swap in UFs 16
It includes Serra do Japi and Evrecy Participações

Page 9 of 19
ISA S.A. E.S.P Calle 12 Sur 18-168 Medellín, Colombia Relacionamiento con Inversionistas
[email protected] [email protected] @ISA_Avanza www.isa.com.co
Operating income
The operating result for the first six months of 2013 declined 0.1% compared to the same period of 2012, from COP 244,477 million to COP 244,141 million, mainly explained by:
Lower Operating Revenues of COP 10,814 million, a 2.2% decrease due to lower revenues from construction contracts for third parties and other non-recurrent operating revenues.
Lower operating costs of COP 10,478 million, a 4.1% decrease compared to June 2012, explained by the net effect of a) lower costs associated to construction projects for third parties, b) decline of depreciation expenses, as a result of the review and update of the remaining life of substation assets for the third quarter of 2012, c) decreased maintenance costs, d) decreased personnel costs and expenses and e) higher contributions and taxes.
Operating income for the second quarter increased 2.2% compared with the second quarter of 2013, as net result of a 0.4% revenue increase and a 1.3% decrease in costs and expenses, due to a lower depreciation. EBITDA and EBITDA margin Accumulated EBITDA decreased 3.1%, from COP 310,457 million at June 2012 to COP 300,846 million at June 2013, mainly as a result of lower revenues and costs associated with contracts with third parties as well as higher contributions and taxes. The EBITDA margin went from 62.1% in 6M12 to 61.5% in 6M13. EBITDA decreased 0.8% during 2Q13, compared to 2Q12. Non-operating results (losses) Compared to the accumulated result of June last year, the non-operating result increased COP 78,628 million, from -COP 46,919 million in 2012 to COP 31,709 million in 2013. This was mainly due to the net effect of higher revenues under the equity method, generated by the recognition of the energy transmission concessions in Brazil and road concessions in Chile as financial assets in accordance to Colombian regulation and lower revenues from CTEEP, as a result of the early termination and subsequent renewal of Concession Contract 059/2001. The non-operating result for the second quarter of 2013 increased 222.7% compared to the same period last year, due to the recognition of Brazilian and Chilean concessions as financial assets. Taxes Accumulated income tax provisions for the first six months of 2013 went from COP 51,906 million in 2012 to COP 58,322 million at the end of the same period of 2013, representing an increase of 12.4%. This variation was due to higher fiscal income, derived from lower financial expenses and higher revenues from exchange rate differences from loans to affiliates. For 2Q13, the 10.8% tax increase was due to the same reasons explained for the accumulated results. Net income Net income reached in the first half of 2013 was COP 217,528 million, 49.3% above the figure obtained in the same period last year, especially explained by higher revenues from the equity method. The net margin was 44.4%

Page 10 of 19
ISA S.A. E.S.P Calle 12 Sur 18-168 Medellín, Colombia Relacionamiento con Inversionistas
[email protected] [email protected] @ISA_Avanza www.isa.com.co
compared to 29.1% reported for 2012. Net income for the second quarter of 2012 increased 218.7% compared to the second quarter of 2012, for the reasons mentioned above. ISA’S BALANCE SHEET, INDIVIDUAL As of the end of the second quarter of 2013, the Company’s assets were COP 10,549,945 million, 18.4% above the figure reported at the end of 2012, due to: the recognition of the Brazilian and Chilean concessions as financial asset in accordance with Colombian regulations and the increase derived from the conversion effects on permanent investments; higher investments in construction projects and new funds from the issue of bonds and delegated;. Liabilities were COP 3,009,466 million, representing a 7.8% increase compared to the figure reported at the end of 2012, mainly due to the issuance of bonds and the increase of accounts payable. At the end of the second quarter 2013, equity was COP 7,540,479 million, 23.2% above the figure reported at the end of 2012. This variation was generated as a result of the change of Brazilian and Chilean concessions as financial assets, the conversion effect of foreign investments and the increase of the results of the period. ISA’S CASH FLOW, INDIVIDUAL At the end of the second quarter of 2013, the figure for cash and cash equivalents was COP 305,938 million, an increase of COP 70,352 million compared to the end of 2012, basically generated by operating activities (COP 380,960 million) and mainly utilized for investment activities ($ 155.470 million) such as investments in companies and purchase of property, plant and equipment and for the payment of dividends. HIGHLIGHTS APRIL 2013 – JULY 2013
May 2013 ISA acquired 11,304,604 shares, corresponding to 17.07% of ISA Peru S.A., formerly belonging to the Fund for
Investment on Infrastructure, Public Utilities and Natural Resources, managed by AC Capitales SAFI. Following this transaction, ISA S.A. E.S.P. became the holder of 45.14% of ISA Peru S.A., while TRANSELCA S.A E.S.P. holds 54.86%. The transaction had a value of USD 9,647,006.82.
ISA placed bonds for COP 220 billion in the local market, corresponding to subseries C9 and C15 of the Eighth Tranche of the Company’s Domestic Public Debt Security Placement and Issuance Program. The total amount demanded was COP 436,012 million, oversubscribed 2.9 times (calculated on the amount offered). The funds obtained will be used to finance the Company’s cash flow.
June 2013 ISA’s shareholders received a dividend payment, as approved at the Ordinary Shareholders’ Meeting held in
March 2013. The payment was made in a single installment for COP 188 per share representing a 5.03% increase compared to the 2012 dividend per share and corresponds to 92.4% of the net profit obtained by the Company in the period.

Page 11 of 19
ISA S.A. E.S.P Calle 12 Sur 18-168 Medellín, Colombia Relacionamiento con Inversionistas
[email protected] [email protected] @ISA_Avanza www.isa.com.co
Fitch Ratings affirmed ISA’s AAA (col) rating for the Domestic Public Debt Bond Placement and Issuance Program for COP 2.7 trillion. It also affirmed the F1+(col) rating for the commercial papers of up to COP 200 billion, a stable outlook.
Fitch Ratings-Chicago upgraded the foreign and local currency Issuer Default Rating of ISA S.A. E.S.P. from
BBB- to BBB; the international rating was revised from positive to stable. Standard & Poor’s ratified ISA’s international BBB- rating with a stable outlook.
ISA exercised the prepayment option of the Third Tranche Bonds Issuance and Placement Program for COP
108,865 million, with a price for the exercise corresponding to 4% of the amortized value.
In Santiago, Chile ISA was awarded a new international public bidding process that will enable the Company to design, finance, build, operate and maintain a 174-km. electricity line in the northern region of the country. It consists of the Encuentro-Lagunas project, the Interconnection of the Norte Grande System (Sistema Interconectado del Norte Grande –SING–), a double-circuit 220 kV transmission line, which has perpetual exploitation rights. The project will go into operation in 42 months beginning from the official awarding of the project. Expected annual revenues are USD 5,849,000 and the estimated investment is USD 80,000,000.
ISA’s Board of Directors approved the creation of a new affiliate dedicated to energy transmission, to represent
the electricity assets belonging to ISA in Colombia and to manage, operate and maintain them. The new affiliate will be called INTERCOLOMBIA, it will be fully owned by ISA and will follow the corporate governance principles that have characterized ISA, in accordance with the regulations currently in effect. This initiative is part of the strategic update carried out by the Company, which is based on pillars of growth, efficiency and optimization of the investment portfolio, and that seeks to focus on activities that separate the double role played by ISA, in a matrix focused on corporate strategic issues, and an affiliate that will use and optimize the existing capacities to apply them on energy transmission. ISA estimates that INTERCOLOMBIA will begin operations in early 2014.
July 2013 Camilo Barco Muñoz, ISA’s Corporate Chief Financial Officer since 2008, submitted his resignation effective
from July 15. Judith Cure Cure, Vice President of Affiliates will take over the role, with ample experience in the Company’s financial management.
In Peru, ISA was awarded the bid to design, finance, build, operate and maintain a 500-kV, 900-km long
transmission line and associated substations. Expected annual revenues are approximately USD 41.5 million and the estimated maximum reference investment by Proinversión is approximately USD 412 million. For its implementation, the project will be transferred to Consorcio Transmantaro –CTM- a subsidiary of ISA (60%) and EEB (40%). The Project must be operational in 38 months, beginning from the date of the official awarding of the project, with a concession period of 30 years.

Page 12 of 19
ISA S.A. E.S.P Calle 12 Sur 18-168 Medellín, Colombia Relacionamiento con Inversionistas
[email protected] [email protected] @ISA_Avanza www.isa.com.co
INVESTOR RELATIONS – EVENTS AND ACTIVITIES As part of its communication strategy with the market, which facilitates direct and close interaction of the Company with shareholders and institutional investors, providing information that permits these parties to make a fundamentals-based judgment regarding the value of ISA, during 2013 ISA performed the following events and activities:
Presentation of 4Q12 and 1Q13 Financial Results (Spanish with simultaneous translation into English)
Institutional presentation at MILA Day event organized by BVC
Presence in Chile, Andean Conference, organized by Larrain Vial
Ordinary Shareholders’ Meeting
Participation in Colombia Inside Out event, held in New York City
Dialogues between ISA and its Stakeholders, under the Corporate Social Responsibility framework
Presentation of ISA 2020 Strategic Update project, held in the cities of Bogotá and Medellín
Conference Calls regarding Colombian Electricity Market and Regulation
Attention to visits from private investment funds (local and international)
Ongoing support to analysts and institutional investors regarding concerns regarding ISA and its affiliates
Supply of ongoing information through Investors’ section of ISA’s website:
Corporate presentations. All presentations associated with different activities are published in this section
Annual and quarterly financial information of ISA and its affiliate companies
Strategic progress
Investors’ Q&A, where specific answers provided to any analyst are published
Schedule of activities, among others.
This report main contain forward-looking statements regarding the performance of ISA and should be taken in good faith by institutions; said forward-looking statements reflect the views of management and are based on currently available information, which assumes risks and uncertainties, including economic conditions and those from other markets, as well as the exchange rate variation and other financial variables respect to which ISA S.A. E.S.P. may not be held responsible, directly or indirectly, for financial operations that the public may conduct in reliance of the information hereby presented.

Page 13 of 19
ISA S.A. E.S.P Calle 12 Sur 18-168 Medellín, Colombia Relacionamiento con Inversionistas
[email protected] [email protected] @ISA_Avanza www.isa.com.co
DATA ON MARKET AND ADDITIONAL INFORMATION Exchange rates
EXCHANGE RATES
6M12
average
6M13 Average
Change %
2011 last
Jun-12 last
Change %
2012 last
Jun-13 last
Change
%
COP / DOLLAR USD 1,793.83 1,826.83 1.84% 1,942.70 1,784.60 -8.14% 1,768.23 1,929.00 9.09%
REAL / DOLLAR USD 1.86 2.03 9.12% 1.88 2.02 7.76% 2.04 2.22 8.42%
CPL / DOLLAR USD 492.83 478.68 -2.87% 519.20 501.84 -3.34% 479.96 507.16 5.67%
COP / REAL 962.36 898.16 -6.67% 1,035.66 882.90 -14.75% 865.29 870.64 0.62%
COP/ CPL 3.64 3.82 4.85% 3.74 3.56 -4.96% 3.68 3.80 3.24%
ISA Risk Ratings
Fitch Ratings May 2013
Standard & Poor’s December 2012
Moody’s December 2012
BBB Stable Outlook
BBB- Stable Outlook
Baa3
Stable Outlook
Stock composition at June 2013
Number of shares %
The Colombian Government 569,472,561 51.4%
Private investors (float) 348,226,256 31.4%
EPM- Empresas Públicas de Medellín 112,605,547 10.2%
Companies with public and private capital 77,373,530 7.0%
Subscribed and paid-in Capital 1,107,677,894 100.0%
ISA’s share (valuation and multiples)
ISA CB – Bolsa de Valores de Colombia ADR (1:25) IESFY –OTC Market
%
-11.84 -12.83 -21.15
%
13.11
-2.33
-29.09
PVL RPG DIVIDEND YIELD EV/EBITDA
1.11 24.32 2.48% 6.51
-40%
-30%
-20%
-10%
0%
10%
20%
ene-13 ene-13 feb-13 mar-13 abr-13 may-13 jun-13
ISA COLCAP IGBC
-50%
-30%
-10%
10%
30%
dic-12 ene-13 feb-13 mar-13 abr-13 may-13 jun-13
S&P500 ADR BNYM ADR ISA

Page 14 of 19
ISA S.A. E.S.P Calle 12 Sur 18-168 Medellín, Colombia Relacionamiento con Inversionistas
[email protected] [email protected] @ISA_Avanza www.isa.com.co
ISA S.A. E.S.P. - CONSOLIDATED - INCOME STATEMENT (Unaudited)
JANUARY – JUNE 2013 Figures in millions of Colombian pesos
2Q13 2Q12
Change COP
Change %
2Q13 USD
6M13 6M12 Change
COP Change
% 6M13 USD
OPERATING REVENUES
Energy transmission services 557,212 733,488 (176,276) -24.0% 289 1,033,826 1,504,745 (470,919) -31.3% 536
Connection charges 44,227 85,249 (41,022) -48.1% 23 85,752 175,357 (89,605) -51.1% 44 Dispatch and CND (National Dispatch Center)
11,713 10,028 1,685 16.8% 6 24,171 20,185 3,986 19.7% 13
MEM Services 10,518 8,474 2,044 24.1% 5 15,454 18,048 (2,594) -14.4% 8
Roads 224,815 167,863 56,952 33.9% 117 465,452 378,812 86,640 22.9% 241
Telecommunications 34,698 28,427 6,271 22.1% 18 66,135 56,911 9,224 16.2% 34
Other services 16,865 11,008 5,857 53.2% 9 25,507 32,142 (6,635) -20.6% 13
TOTAL OPERATING REVENUES 900,048 1,044,537 (144,489) -13.8% 467 1,716,297 2,186,200 (469,903) -21.5% 890
COSTS AND OPERATING EXPENSES
Operating costs and administration expenses
441,752 350,032 91,720 26.2% 229 795,203 684,477 110,726 16.2% 412
Depreciation 39,114 42,766 (3,652) -8.5% 20 77,448 84,966 (7,518) -8.8% 40
Amortization -26,465 142,860 (169,325) -118.5% -14 103,523 288,870 (185,347) -64.2% 54
Provisions 22,336 6,366 15,970 250.9% 12 32,495 16,654 15,841 95.1% 17 TOTAL COSTS AND OPERATING 476,737 542,024 (65,287) -12.0% 247 1,008,669 1,074,967 (66,298) -6.2% 523
EXPENSES Operating Income 423,311 502,513 (79,202) -15.8% 219 707,628 1,111,233 (403,605) -36.3% 367
NON - OPERATING REVENUES
Financial 127,485 27,268 100,217 367.5% 66 230,601 56,626 173,975 307.2% 120
Exchange difference 37,727 52,318 (14,591) -27.9% 20 119,385 129,877 (10,492) -8.1% 62
Other 5,618 14,042 (8,424) -60.0% 3 28,402 21,629 6,773 31.3% 15 Total non-operating revenues 170,830 93,628 77,202 82.5% 89 378,388 208,132 170,256 81.8% 196
NON - OPERATING EXPENSES
Financial 215,945 267,009 (51,064) -19.1% 112 437,188 501,094 (63,906) -12.8% 227
Exchange difference 115,924 11,379 104,545 918.8% 60 172,930 90,235 82,695 91.6% 90
Other 7,288 15,069 (7,781) -51.6% 4 13,619 23,275 (9,656) -41.5% 7 Total non-operating expenses 339,157 293,457 45,700 15.6% 176 623,737 614,604 9,133 1.5% 323
Non-operating results (168,327) (199,829) 31,502 -15.8% -87 (245,349) (406,472) 161,123 -39.6% -127
Income before taxes 254,984 302,684 (47,700) -15.8% 132 462,279 704,761 (242,482) -34.4% 240
Income tax provision 51,566 115,374 (63,808) -55.3% 27 126,699 243,856 (117,157) -48.0% 66 Income before minority interests 203,418 187,310 16,108 8.6% 105 335,580 460,905 (125,325) -27.2% 174
Minority interest (MI) 56,192 141,115 (84,923) -60.2% 29 118,052 315,253 (197,201) -62.6% 61
NET INCOME 147,226 46,195 101,031 218.7% 76 217,528 145,652 71,876 49.3% 113
EBITDA 466,700 702,684 (235,984) -33.6% 242 937,587 1,517,854 (580,267) -38.2% 486
EBITDA Margin 51.9% 67.3% 54.6% 69.4%
Operating Margin 47.0% 48.1% 41.2% 50.8%
Net Margin before MI 22.6% 17.9% 19.6% 21.1%
Amounts expressed in millions US dollars in this report are for information purposes only, and do not reflect normally utilized accounting conversion techniques. As of June 30, 2013, the exchange rate was of USD 1.00=COP 1,929.00 (Source: Banco de la República de Colombia).

Page 15 of 19
ISA S.A. E.S.P Calle 12 Sur 18-168 Medellín, Colombia Relacionamiento con Inversionistas
[email protected] [email protected] @ISA_Avanza www.isa.com.co
ISA S.A. E.S.P. - CONSOLIDATED - BALANCE SHEET (Unaudited)
JANUARY – JUNE 2013 Figures in millions of Colombian pesos
June 2013 % Part. 2012 Change
COP Change
% June 2013
USD
CURRENT ASSETS
Cash 444,012 1.6% 429,455 14,557 3.4% 230
Marketable investments 2,316,132 8.5% 1,247,451 1,068,681 85.7% 1,201
Accounts receivable, net 1,332,345 4.9% 2,986,706 (1,654,361) -55.4% 691
Inventories 110,028 0.4% 112,043 (2,015) -1.8% 57
Deferred charges and other assets 152,063 0.6% 119,410 32,653 27.3% 79
Total current assets 4,354,580 16.1% 4,895,065 (540,485) -11.0% 2,257
NON-CURRENT ASSETS
Long-term investments 824,315 3.0% 707,607 116,708 16.5% 427
Long-term accounts receivable 10,821,468 39.9% 1,916,517 8,904,951 464.6% 5,610
Inventories 60,039 0.2% 58,428 1,611 2.8% 31
Property, plant and equipment, net 3,139,017 11.6% 3,031,437 107,580 3.5% 1,627
Deferred charges and other assets 4,912,929 18.1% 12,148,548 (7,235,619) -59.6% 2,547
Reappraisal of assets 3,014,862 11.1% 3,013,387 1,475 0.0% 1,563
Total non- current assets 22,772,630 83.9% 20,875,924 1,896,706 9.1% 11,805
TOTAL ASSETS 27,127,210 100.0% 25,770,989 1,356,221 5.3% 14,063
CURRENT LIABILITIES
Outstanding bonds 406,179 1.5% 412,934 (6,755) -1.6% 211
Financial liabilities 500,196 1.8% 936,531 (436,335) -46.6% 259
Accounts payable 993,188 3.7% 1,017,421 (24,233) -2.4% 515
Labor liabilities 21,471 0.1% 20,919 552 2.6% 11
Accrued liabilities and estimated provisions 210,107 0.8% 176,773 33,334 18.9% 109
Other liabilities 349,759 1.3% 259,299 90,460 34.9% 181
Total current liabilities 2,480,900 9.1% 2,823,877 (342,977) -12.1% 1,286
LONG-TERM LIABILITIES
Outstanding bonds 6,681,932 24.6% 5,574,696 1,107,236 19.9% 3,464
Financial liabilities 1,903,116 7.0% 2,468,086 (564,970) -22.9% 987
Accounts payable 1,152,456 4.2% 1,554,263 (401,807) -25.9% 597
Labor liabilities 1,362 0.0% 1,433 (71) -5.0% 1
Accrued liabilities and estimated provisions 804,620 3.0% 767,931 36,689 4.8% 417
Other liabilities 2,334,566 8.6% 2,296,767 37,799 1.6% 1,210
Total long-term liabilities 12,878,052 47.5% 12,663,176 214,876 1.7% 6,676
TOTAL LIABILITIES 15,358,952 56.6% 15,487,053 (128,101) -0.8% 7,962
Minority interests 4,222,030 15.6% 4,173,321 48,709 1.2% 2,189
Subscribed and paid in capital 36,916 0.1% 36,916 - 0.0% 19
Capital Surplus 1,445,509 5.3% 1,445,509 - 0.0% 749
Reserves 999,186 3.7% 934,492 64,694 6.9% 518
Net income 217,528 0.8% 272,938 (55,410) -20.3% 113
Cumulative translation adjustment 5,749 0.0% (9,091) 14,840 163.2% 3
Equity revaluation 415,645 1.5% 415,645 - 0.0% 215
Surplus from asset reappraisals 2,564,763 9.5% 2,563,287 1,476 0.1% 1,330
Surplus from equity method 1,860,932 6.9% 450,919 1,410,013 312.7% 965
Total Shareholders´ Equity 7,546,228 27.8% 6,110,615 1,435,613 23.5% 3,912
TOTAL LIABILITIES, MINORITY INTERESTS AND SHAREHOLDERS´ EQUITY
27,127,210 100.0% 25,770,989 1,356,221 5.3% 14,063
Amounts expressed in millions US dollars in this report are for information purposes only, and do not reflect normally utilized accounting conversion techniques. As of June 30, 2013, the exchange rate was of USD 1.00=COP 1,929.00 (Source: Banco de la República de Colombia).

Page 16 of 19
ISA S.A. E.S.P Calle 12 Sur 18-168 Medellín, Colombia Relacionamiento con Inversionistas
[email protected] [email protected] @ISA_Avanza www.isa.com.co
ISA S.A. E.S.P. - CONSOLIDATED -
CASH FLOW STATEMENT (Unaudited) JANUARY – JUNE 2013
Figures in millions of Colombian pesos
2Q13 2Q12
Change COP
Change % 2Q13 USD
Cash flows from operating activities:
Net income 217,528 145,653 71,875 49% 113 Plus (minus) – Adjustments to reconcile net income with the net cash provided by operational activities:
Minority interest 118,052 315,253 (197,201) -63% 61 Depreciation of properties, plant and equipment 77,449 84,966 (7,517) -9% 40 Amortization of deferred and other assets 103,523 288,870 (185,347) -64% 54 Amortization of retirement pensions and extralegal benefits – net 16,493 16,130 363 2% 9 Provision for accounts receivable 174 121 53 44% 0 Investment provision 389 70 319 456% 0 Income tax provision 126,699 243,856 (117,157) -48% 66 Loss in property, plant and equipment disposal and retirement 5,777 9,333 (3,556) -38% 3 Cost for rights of anticipated renewal of Concession 059/2001 CTEEP - 9,333 (9,333) -100% - Expense) Income for foreign exchange rate conversion 107,766 (21,224) 128,990 -608% 56 Recovery of provisions - (900) 900 -100% - Accrued interest and commissions 190,260 320,947 (130,687) -41% 99
964,110 1,412,408 (448,298) -32% 500
Changes in operating assets and liabilities: Debtors 126,170 (153,187) 279,357 -182% 65 Receivables for early contract renewal compensation 059/2001 1,344,703 - 1,344,703 697 Inventories 404 18,476 (18,072) -98% 0 Deferred and other assets (30,948) (342,932) 311,984 -91% (16) Accounts payable 200,875 316,547 (115,672) -37% 104 Labor liabilities 481 (21,775) 22,256 -102% 0 Estimated liabilities and provisions 2,314 (191,360) 193,674 -101% 1 Collections in favor of third-parties (5,802) 188,949 (194,751) -103% (3) Minority interest Variation Shareholders’ equity
(120,315) (181,766) 61,451 -34% (62)
Cash flows in other operations: 1 - Retirement pension payments Tax payments (16,210) (13,780) (2,430) 18% (8)
Net cash provided by operating activities (230,959) (540,582) 309,623 -57% (120)
2,234,823 393,448 1,841,375 468% 1,159
Cash flows from investment activities: Variation of permanent and long term investments
Sale of property, plant and equipment 47,457 93,781 (46,324) -49% 25 Intangible acquisitions 785 - 785 0 Purchase of property, plant and equipment (301,252) - (301,252) (156)
Net cash used by investment activities (174,501) (110,137) (64,364) 58% (90)
(427,511) (16,356) (411,155) 2514% (222)
Cash flows from financing activities: Interest received in cash Interest paid in cash 98,195 20,455 77,740 380% 51 Dividends paid (389,728) (461,349) 71,621 -16% (202) Increase in financial obligations (208,243) (245,904) 37,661 -15% (108)
Bond Issue 171,221 629,566 (458,345) -73% 89 Payment of financial obligations 1,220,369 - 1,220,369 633 Bond payment (1,365,899) (392,341) (973,558) 248% (708)
Net cash used by financing activities (249,989) (76,640) (173,348) 226% (130)
(724,074) (526,213) (197,861) 38% (375)
Net increase (decrease) in cash and cash equivalents Cash and equivalents at the beginning of quarter 1,083,238 (149,121) 1,232,359 -826% 562
CASH AND EQUIVALENTS AT QUARTER END 1,676,906 1,412,951 263,955 19% 869
Amounts expressed in millions of US dollars in this report are for informational purposes only, and do not reflect normally utilized accounting conversion techniques. As of June 30, 2013, the exchange rate was of USD 1.00= COP 1,929.00 (Source: Banco de la República de Colombia).

Page 17 of 19
ISA S.A. E.S.P Calle 12 Sur 18-168 Medellín, Colombia Relacionamiento con Inversionistas
[email protected] [email protected] @ISA_Avanza www.isa.com.co
ISA S.A. E.S.P. - INDIVIDUAL - INCOME STATEMENT (Unaudited)
JANUARY – JUNE 2013 Figures in millions of Colombian pesos
2Q13 2Q12
Change COP
Change %
2Q13 USD
6M13 6M12 Change
COP Change
% 6M13 USD
OPERATING REVENUES Energy transmission services 212,028 210,968 1,060 0.5% 110 418,944 417,819 1,125 0.3% 217 Connection charges 24,619 23,663 956 4.0% 13 47,937 47,895 42 0.1% 25 Infrastructure Projects 3,008 2,961 47 1.6% 2 4,051 13,248 (9,197) -69.4% 2 Telecommunications 4,283 4,468 (185) -4.1% 2 8,994 8,976 18 0.2% 5 Other services 5,141 6,143 (1,002) -16.3% 3 9,540 12,342 (2,802) -22.7% 5 TOTAL OPERATING REVENUES 249,079 248,203 876 0.4% 129 489,466 500,280 (10,814) -2.2% 254 COSTS AND OPERATING EXPENSES
Operating costs and administration expenses
105,454 102,860 2,594 2.5% 55 197,922 198,190 (268) -0.1% 103
Depreciation 21,052 26,343 (5,291) -20.1% 11 42,491 52,903 (10,412) -19.7% 22 Amortization 1,792 1,809 (17) -0.9% 1 3,547 3,619 (72) -2.0% 2 Provisions 958 4 954 23850.0% 0 1,365 1,091 274 25.1% 1 TOTAL COSTS AND OPERATING EXPENSES
129,256 131,016 (1,760) -1.3% 67 245,325 255,803 (10,478) -4.1% 127
Operating Income 119,823 117,187 2,636 2.2% 62 244,141 244,477 (336) -0.1% 127 NON - OPERATING REVENUES Financial 6,398 6,530 (132) -2.0% 3 20,567 17,434 3,133 18.0% 11 Exchange difference -1,705 1,271 (2,976) -234.1% (1) 41,885 11,871 30,014 252.8% 22 Equity Method 111,408 33,085 78,323 236.7% 58 138,855 76,367 62,488 81.8% 72 Other 506 2,657 (2,151) -81.0% 0 3,299 7,259 (3,960) -54.6% 2 Total no-operating revenues 116,607 43,543 73,064 167.8% 60 204,606 112,931 91,675 81.2% 106 NON - OPERATING EXPENSES Financial 35,777 36,916 (1,139) -3.1% 19 68,417 75,783 (7,366) -9.7% 35 Exchange difference -8,754 1,726 (10,480) -607.2% (5) 30,738 26,016 4,722 18.2% 16 Equity Method 33,827 50,099 (16,272) -32.5% 18 73,622 57,091 16,531 29.0% 38 Other 23 219 (196) -89.5% 0 120 960 (840) -87.5% 0 Total no-operating expenses 60,873 88,960 (28,087) -31.6% 32 172,897 159,850 13,047 8.2% 90 Non-operating results 55,734 (45,417) 101,151 222.7% 29 31,709 (46,919) 78,628 167.6% 16 Income before taxes 175,557 71,770 103,787 144.6% 91 275,850 197,558 78,292 39.6% 143 Income tax provision 28,331 25,575 2,756 10.8% 15 58,322 51,906 6,416 12.4% 30 NET INCOME 147,226 46,195 101,031 218.7% 76 217,528 145,652 71,876 49.3% 113 EBITDA 148,435 149,642 (1,207) -0.8% 77 300,846 310,457 (9,611) -3.1% 156 EBITDA margin 59.6% 60.3% 61.5% 62.1% Operating margin 48.1% 47.2% 49.9% 48.9% Net margin 59.1% 18.6% 44.4% 29.1%
Amounts expressed in millions US dollars in this report are for information purposes only, and do not reflect normally utilized accounting conversion techniques. As of June 30, 2013, the exchange rate was of USD 1.00=COP 1,929.00 (Source: Banco de la República de Colombia).
Page 18 of 19
ISA S.A. E.S.P Calle 12 Sur 18-168 Medellín, Colombia Relacionamiento con Inversionistas
[email protected] [email protected] @ISA_Avanza www.isa.com.co
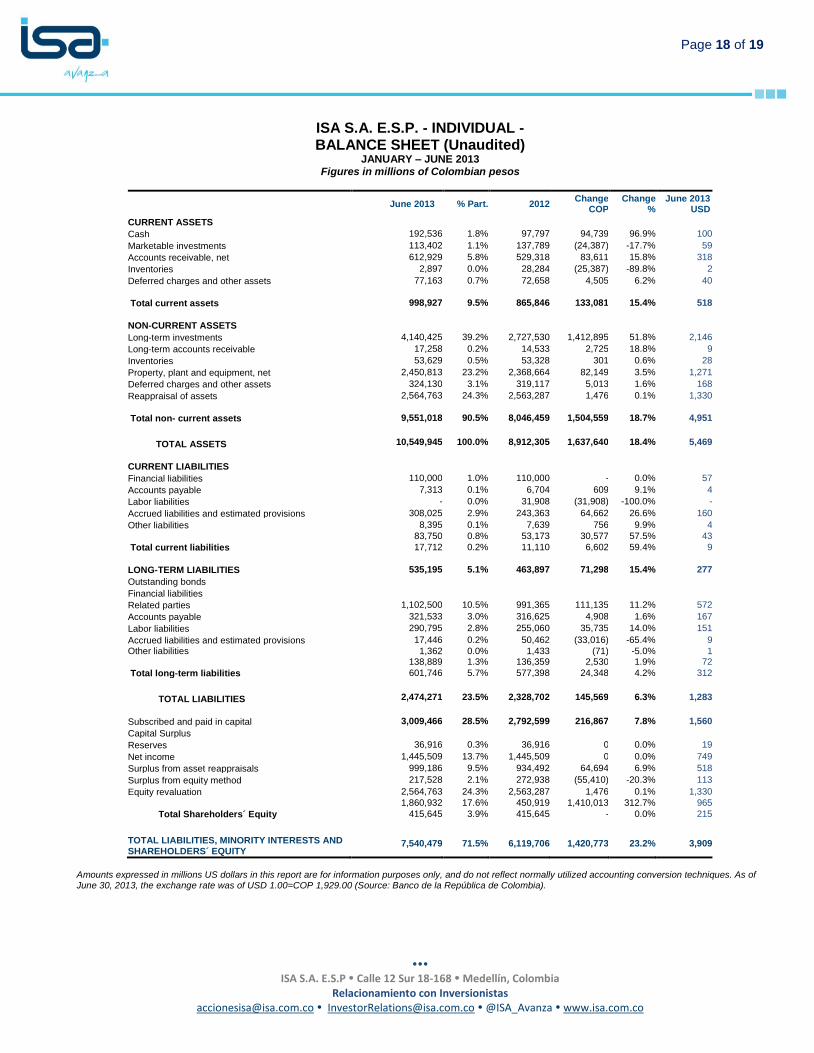
ISA S.A. E.S.P. - INDIVIDUAL - BALANCE SHEET (Unaudited)
JANUARY – JUNE 2013 Figures in millions of Colombian pesos
June 2013 % Part. 2012 Change
COP Change
% June 2013
USD
CURRENT ASSETS
Cash 192,536 1.8% 97,797 94,739 96.9% 100
Marketable investments 113,402 1.1% 137,789 (24,387) -17.7% 59
Accounts receivable, net 612,929 5.8% 529,318 83,611 15.8% 318
Inventories 2,897 0.0% 28,284 (25,387) -89.8% 2
Deferred charges and other assets 77,163 0.7% 72,658 4,505 6.2% 40
Total current assets 998,927 9.5% 865,846 133,081 15.4% 518
NON-CURRENT ASSETS
Long-term investments 4,140,425 39.2% 2,727,530 1,412,895 51.8% 2,146
Long-term accounts receivable 17,258 0.2% 14,533 2,725 18.8% 9
Inventories 53,629 0.5% 53,328 301 0.6% 28
Property, plant and equipment, net 2,450,813 23.2% 2,368,664 82,149 3.5% 1,271
Deferred charges and other assets 324,130 3.1% 319,117 5,013 1.6% 168
Reappraisal of assets 2,564,763 24.3% 2,563,287 1,476 0.1% 1,330
Total non- current assets 9,551,018 90.5% 8,046,459 1,504,559 18.7% 4,951
TOTAL ASSETS 10,549,945 100.0% 8,912,305 1,637,640 18.4% 5,469
CURRENT LIABILITIES
Financial liabilities 110,000 1.0% 110,000 - 0.0% 57
Accounts payable 7,313 0.1% 6,704 609 9.1% 4
Labor liabilities - 0.0% 31,908 (31,908) -100.0% -
Accrued liabilities and estimated provisions 308,025 2.9% 243,363 64,662 26.6% 160
Other liabilities 8,395 0.1% 7,639 756 9.9% 4
83,750 0.8% 53,173 30,577 57.5% 43
Total current liabilities 17,712 0.2% 11,110 6,602 59.4% 9
LONG-TERM LIABILITIES 535,195 5.1% 463,897 71,298 15.4% 277
Outstanding bonds
Financial liabilities
Related parties 1,102,500 10.5% 991,365 111,135 11.2% 572
Accounts payable 321,533 3.0% 316,625 4,908 1.6% 167
Labor liabilities 290,795 2.8% 255,060 35,735 14.0% 151
Accrued liabilities and estimated provisions 17,446 0.2% 50,462 (33,016) -65.4% 9
Other liabilities 1,362 0.0% 1,433 (71) -5.0% 1 138,889 1.3% 136,359 2,530 1.9% 72
Total long-term liabilities 601,746 5.7% 577,398 24,348 4.2% 312
TOTAL LIABILITIES 2,474,271 23.5% 2,328,702 145,569 6.3% 1,283
Subscribed and paid in capital 3,009,466 28.5% 2,792,599 216,867 7.8% 1,560
Capital Surplus
Reserves 36,916 0.3% 36,916 0 0.0% 19
Net income 1,445,509 13.7% 1,445,509 0 0.0% 749
Surplus from asset reappraisals 999,186 9.5% 934,492 64,694 6.9% 518
Surplus from equity method 217,528 2.1% 272,938 (55,410) -20.3% 113
Equity revaluation 2,564,763 24.3% 2,563,287 1,476 0.1% 1,330
1,860,932 17.6% 450,919 1,410,013 312.7% 965
Total Shareholders´ Equity 415,645 3.9% 415,645 - 0.0% 215
TOTAL LIABILITIES, MINORITY INTERESTS AND SHAREHOLDERS´ EQUITY
7,540,479 71.5% 6,119,706 1,420,773 23.2% 3,909
Amounts expressed in millions US dollars in this report are for information purposes only, and do not reflect normally utilized accounting conversion techniques. As of June 30, 2013, the exchange rate was of USD 1.00=COP 1,929.00 (Source: Banco de la República de Colombia).

Page 19 of 19
ISA S.A. E.S.P Calle 12 Sur 18-168 Medellín, Colombia Relacionamiento con Inversionistas
[email protected] [email protected] @ISA_Avanza www.isa.com.co
ISA S.A. E.S.P. - INDIVIDUAL -
CASH FLOW STATEMENT (Unaudited) JANUARY – JUNE 2013
Figures in millions of Colombian pesos
6M13 6M12 Var. $ Var. %
6M13 USD
Cash flows from operating activities:
Net income 217,528 145,653 71,875 49.3% 113 Plus (minus) – Adjustments to reconcile net income with the net cash provided by operational activities:
Depreciation of properties, plant and equipment 42,491 52,903 (10,412) -19.7% 22 Amortization of deferred and other assets 3,547 3,619 (72) -2.0% 2 Amortization of retirement pensions and extralegal benefits – net 9,302 8,366 936 11.2% 5 (Recovery-Write Off) Provision of accounts receivable (151) (180) 29 -16.1% (0) (Recovery) Provision for investments 36 (144) 180 -125.0% 0 Income tax provision 58,322 51,906 6,416 12.4% 30 Loss in property, plant and equipment disposal and retirement 38 694 (656) -94.5% 0 (Expense) Income for foreign exchange rate conversion (10,943) 13,970 (24,913) -178.3% (6) Income for equity method (65,233) (19,275) (45,958) 238.4% (34) Accrued interest and commissions 52,322 65,131 (12,809) -19.7% 27 307,259 322,643 (15,384) -4.8% 159
Changes in operating assets and liabilities: Debtors 29,614 (11,111) 40,725 -366.5% 15 Inventories (251) 7,546 (7,797) -103.3% (0) Deferred and other assets (4,188) (5,743) 1,555 -27.1% (2) Accounts payable 109,629 37,240 72,389 194.4% 57 Labor liabilities 685 606 79 13.0% 0 Estimated liabilities and provisions (3,060) (19,276) 16,216 -84.1% (2) Other liabilities 42,685 32,804 9,881 30.1% 22
Cash flows in other operations:
Retirement pension payments (6,675) (6,550) (125) 1.9% (3) Payment of taxes and contributions (94,738) (90,927) (3,811) 4.2% (49)
Net cash provided by operation activities 380,960 267,232 113,728 42.6% 197
Cash flows from investment activities:
Purchase of permanent and long term investments (22,787) (4,330) (18,457) 426.3% (12) Sale of property and equipment - 412 (412) -100.0% -
Purchase of property, plant and equipment (124,678) (46,312) (78,366) 169.2% (65)
Additions (disposals) of deferred and other assets (8,005) - (8,005) 0.0% (4) Net cash used by investment activities (155,470) (27,745) (127,725) 4 (81)
Cash flows from financing activities: Interest received in cash 2,799 5,837 (3,038) -52.0% 1 Interest paid in cash (57,345) (66,323) 8,978 -13.5% (30) Dividends paid (208,243) (245,904) 37,661 -15.3% (108) Bonds variation 111,135 - 111,135 0.0% 58
Change in financial obligations (3,484) (43,361) 39,878 -92.0% (2) Net cash used by financing activities (155,138) (349,751) 194,614 -55.6% (80)
Net increase (decrease) in cash and cash equivalents 70,352 (110,264) 180,617 -163.8% 36 Cash and equivalents at the beginning of the year 235,586 157,173 78,413 49.9% 122 CASH AND EQUIVALENTS AT THE YEAR END 305,938 46,909 259,030 552.2% 159
Amounts expressed in millions US dollars in this report are for information purposes only, and do not reflect normally utilized accounting conversion techniques. As of June 30, 2013, the exchange rate was of USD 1.00= COP 1,929.00 (Source: Banco de la República de Colombia).