is your business ipo ready
TRANSCRIPT

Is your business IPO ready ? Start here!1. Make sure you have the right people on the bus in the right seats before you start…how do you know ? Read Jim Collins “Good to
Great” Level 5 leaders
2. Engage ALL the stakeholders, ask questions and listen…
3. Understand your numbers in detail (Use a Value Driver Model to help with this), benchmark your performance & measure the theoretical gap. Then get the businesses to take ownership by doing “deep dives” into material gaps, understanding & verifying them, then develop plan to close gap.
4. Set the bar high…make sure your staff are not afraid to fail… your leadership style is critical for this.
5. Understand the risks and develop mitigation strategies
6. Synthesize your story/Strategy and communicate it to ALL. Make sure ALL the stakeholders understand the “size of the prize” or “how close the precipice is”…ensure they all share in the success
7. Instill Key Traits in your team for implementation;
1. Focus on what’s important – KPIs
2. Ensure there is Clear Accountability – Performance linked to incentive schemes and regular performance review
3. Discipline – You must have a Project Management Office (PMO) with leader with access to your ELT
4. Sense of Urgency (not impatience) – Daily, Weekly, Month Reporting
5. Persistence - never loose faith that you will prevail
8. You must have a closed loop “Planning & Performance” management process. This will help systematize the above traits.
9. Use the Pareto 80 / 20 approach to get low hanging fruit first
10. Use “Gilberts 6 windows on Human Performance” as a list of things you need to do to get your people performing

Stage 1
Listen & ask questions
Identify potential improvement
Sell Need for change
Stage 2Deep Dive Reviews
Benchmark &Re-engineerProcesses
Develop Actions
Stage 3Synthesize & Implement
It starts and ends with having a credible story that hangs together?Forget the final presentations which are easy, get these “Building Blocks” right which will give your story credibility.
2
Business Performance
Review
SYNTHESIZE, SIGN OFF. SYNDICATE, IMPLEMENT & MONITOR ACHIEVEMENT OF PLAN
Stewardship Review & Control Processes
Employee Survey
Top 20 Leadership Interviews &
Capability Review
Behavioral change plan developed
External Customer
Survey
KEY GAP “Deep Dives” TO SUPPORT TARGETS WITH ACTIONS
OHS & E Process
Manufacturing Excellence Capability
Work Cap. Mgt
Spend Contro
lS&OP
Management
IT Systems Capability
Internal. Customer Surveys by Dept
Governance Framework,
Policy & Process Standards
Risk Review
Recruitment, Training,
Development & Retention effectiveness
Customer Service
Excellence
Understand Strategy & Review Structure Alignment
Cash & Debt Mgt
Synthesize the critical reasons for change into a Story & Syndicate across/down the organisation to all stakeholders
Product & Market
Development Process
Sales CapabilitySupplier Transactional
Process EfficiencyProcure to Pay
Customer Transactional Process Efficiency
Order to Fulfillment
Employee Transactional Process EfficiencyPayroll & Expense Reimbursement
Planning & Performance Management Process
Margin / Pricing Management Process
Develop Value Driver Model & Theoretical Improvement Potential

3
Stage 1 – Building Blocks & Objectives Understand Strategy & Review Structure Alignment - Understand existing strategy (Shareholder
perceptions / expectations) & review alignment of organisation structure Top Leadership Review - Understand ideas (SWOT) & leadership capability for each of the senior
managers and high potential employee’s – “Are the right people on the bus in the right seats” Internal Customer Surveys - Understand how each department is perceived by its internal
customers for both KRAs and Key Behaviors Business Performance Review - Understand current & forecast business performance. Develop
80/20 broad range of critical KPIs to quickly instill focus, accountability & sense of urgency Risk Review - Understand the key business risks, their potential impact, the mitigation
strategies & probability before & after mitigation External Customer Survey - Understand the customer perceptions of our value proposition &
business performance (& our SWOT) Employee Survey - Understand the Employee perceptions of the business performance (&
SWOT) & their own performance Value driver model - Develop a “Theoretical Potential Improvement “ in the business by
Developing a Value Driver model and benchmark all its components against best practice and measure gap,
Synthesize Story & Syndicate - Ensure everyone in the business can see the prize or precipice so they understand why we have to change

4
Stage 2 – Building Blocks & Objectives Governance Framework, Policy & Process Standards - Ensure a governance framework is in
place that meets best practice & exceeds all listing requirements Behavioral Change Plan - From feedback, develop detailed behavioral change plan needed to
meet all stakeholder objectives (mission, values, targets, etc) Customer Service – Develop detailed plan to ensure the customer service is consistently
competitive, value enhancing & meeting our promise to the customer ? Stewardship Review & Control Processes - Verify Balance sheet values , identify any major
write-offs and/or control weakness with actionable plan Cash Management & Funding Process – Review adequacy of capital structure & funding
facilities. Implement a process ensuring CFO has day to day control of funding and all material cash outflows
CAPEX & Discretionary Spend Process – Put process in place to ensure all CAPEX & Discretionary Spend (Marcom, R&M, etc) is properly justified, approved, prioritised, controlled in timely manner with post implementation review.
Working Capital Management – Put process in place to control & optimize WC % to “Best Practise”
Margin Management Review – Ensure Margin Management Performance & Processes are “Best Practise”. Identify margin improvement potential & process changes.
Planning & Performance Management System - Ensure there is a process in place that drives ongoing systematic improvement, provides clear accountability, focuses the business on things that are important and creates a sense of urgency

5
Stage 2 – Building Blocks & Objectives Supplier – Procure to Pay – Reengineer Process to be “Best Practice” Customer – Order to Fulfillment - Reengineer Process to be “Best Practice” Employee – Payroll & Exp Reimbursement - Reengineer Process to be “Best Practice” Sales Capability - Review Capability, Performance & Processes. Identify improvement opportunities Product & Market Development Process - Do we have an effective process & have we identified &
invested in a sufficient pipeline of growth opportunities to meet our growth targets ? IT / IS Systems Capability - Are these systems appropriate for our strategic & operational needs
and are they efficient and cost effective ? OHS&E - Reengineer Process to be “Best Practice” Manufacturing Capability - Reengineer Process to be “Best Practice” Supply Chain Management - Reengineer Process to be “Best Practice” People - Recruitment, Training, Development & Retention - Understand if performance shortfalls
are due to any systemic factor that can be corrected. Reengineer Process to be “Best Practice” Deep Dives - Turn “Theoretical Gap” into confirmed opportunities with management commitment
and detailed hard action plans

Strategy & Structure
5 Forces Review including trends and scenario’s
SWOT Review
Competitor Review
Vision, Targets
Options & Rational
Key Actions
Key Enablers, Resources & Risks
Sponsor: CEO 1 week timeframe Facilitated by CEO 2 day workshop with Board & Leadership Team
Objective: Understand existing strategy (and shareholder perceptions, expectations) and alignment of structure
6
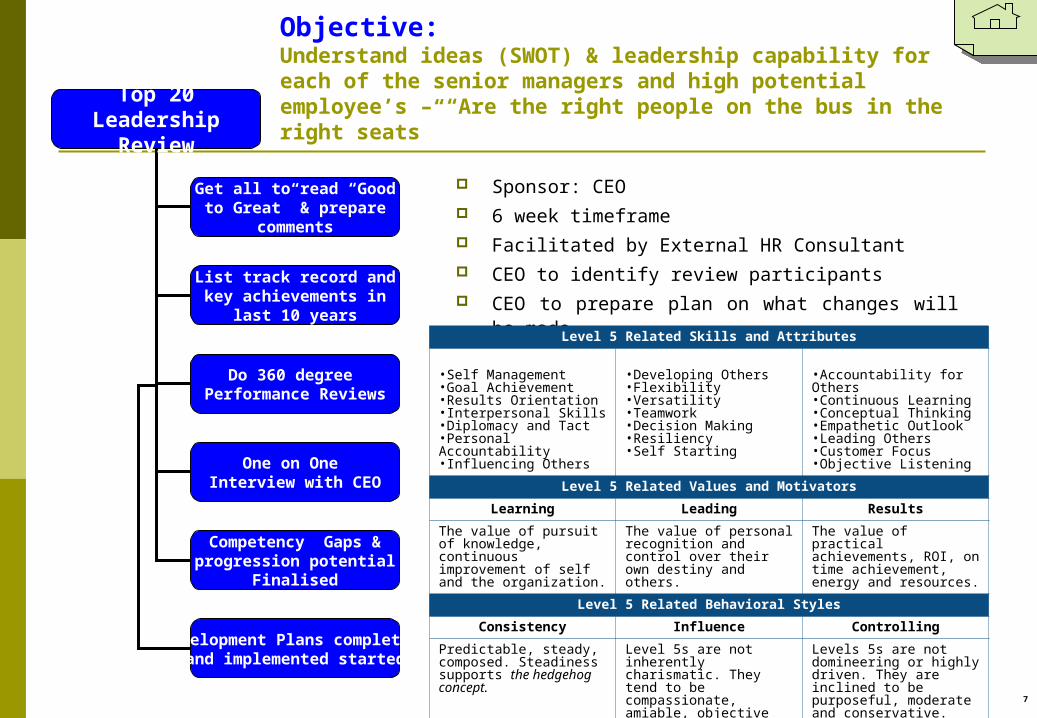
Top 20 Leadership Review
Get all to read “Good to Great” & prepare comments
Do 360 degree Performance Reviews
List track record and key achievements in last 10 years
One on One Interview with CEO
Competency Gaps & progression potential Finalised
Development Plans completed and implemented started
Sponsor: CEO 6 week timeframe Facilitated by External HR Consultant CEO to identify review participants CEO to prepare plan on what changes will be
made
Objective: Understand ideas (SWOT) & leadership capability for each of the senior managers and high potential employee’s – “Are the right people on the bus in the right seats”
7
Level 5 Related Skills and Attributes
•Self Management•Goal Achievement•Results Orientation•Interpersonal Skills•Diplomacy and Tact•Personal Accountability•Influencing Others
•Developing Others•Flexibility•Versatility•Teamwork•Decision Making•Resiliency•Self Starting
•Accountability for Others•Continuous Learning•Conceptual Thinking•Empathetic Outlook•Leading Others•Customer Focus•Objective Listening
Level 5 Related Values and MotivatorsLearning Leading Results
The value of pursuit of knowledge, continuous improvement of self and the organization.
The value of personal recognition and control over their own destiny and others.
The value of practical achievements, ROI, on time achievement, energy and resources.
Level 5 Related Behavioral StylesConsistency Influence Controlling
Predictable, steady, composed. Steadiness supports the hedgehog concept.
Level 5s are not inherently charismatic. They tend to be compassionate, amiable, objective and logical.
Levels 5s are not domineering or highly driven. They are inclined to be purposeful, moderate and conservative.

Employee Survey
20% of employees interviewed by external facilitator
All employees do questionnaire compiled by
external consultant
Present findings
Redo every year to measure trend
Sponsor: CEO 4 week timeframe Facilitated by External HR Consultant Employee questionnaires… example questions;
Summarise your CV What are your Goals Rate your Job Satisfaction KRAs – describe your performance What are your strengths What do you need from company to perform better What do you like about culture that must be
retained What do we need to improve about the culture How can we improve the performance of the
department How can we improve the business performance
Redo in 12 months times to measure change
Objective: Understand the Employee perceptions of the business performance (& SWOT) & their own performance
8

13
Behaviours & Soft Skills - Our Customers (Presidents) Perceptions – Big Improvement
KEY BEHAVIOURS / SOFT SKILLS Nov-05 Jan-07 % ChangeLeadership 7 8 14%Business Acumen 7 7 0%Communication 8 8 0%Creativeness 7 8 14%Customer Focus 7 8 14%Commitment to Quality 7 8 14%Attention to Detail 4 8 100%Discipline 4 7 75%Problem Solving 5 8 60%Planning & Organising 3 8 167%Action Orientated 3 8 167%Interpersonal Sensitivity 8 7 (13%)Flexibility 4 8 100%Resilience 5 7 40%Energy 4 8 100%
Average 6 8 40%
Rating out of 10
Internal Customer Surveys
KRA’s
Behavior / Soft Skills
Sponsor: CEO 4 week timeframe Facilitated by VP HR For all Functional areas; Finance, IT, HR, Procurement,
CS, Logistics, SCM, Manufacturing, OHS & E, S& M Redo in 12 months to measure change
Objective: Understand how each department is perceived by its internal customers for both KRAs and Key Behaviors
14
KRA’s - Our Customers Perceptions - Still some upside, but improving
Key Result Areas Nov-05 Jan-07 % ChangeGovernance (Risk Management)
Safety & Environmental Management 8 8 0%On Time & Accurate Reporting 2 8 300%Working Capital Management 4 7 75%P&L Management 2 5 150%Capital Management 3 7 133%Budgetting & Forecasting 4 8 100%Stores Management 7 8 14%
Performance ImprovementCustomer Service Leadership 6 7 17%
7 7 0%
3 5 67%Asset Management 6 7 17%Strategic Sourcing 8 8 0%
Growth
4 7 75%CEA Project Leadership 7 7 0%
Average 5 7 34%
Employee Recruitment, Training & Development
Rating out of 10
Manage Customer & Product Profitablity Process (CPP)
Manage Value Improvement / Creation Process
COMMERCIALKey Result Areas Nov-05 Jan-07 % ChangeGovernance (Risk Management)
Safety & Environmental Management 8 8 0%6 6 0%
Tax Management 8 8 0%Transaction Management 6 6 0%Administration Management 5 5 0%
Performance ImprovementCustomer Service Leadership 6 7 17%Tax Planning 6 6 0%Transactional Process Improvement 6 6 0%
Growth
4 7 75%
Average 6 7 7%
Employee Recruitment, Training & Development
Rating out of 10
Cash Management
SHARED SERVICES
9
EXAMPLEEXAMPLE EXAMPLEEXAMPLE

Business Performance Review
OHS&E
Financials
Market
Operations
Sponsor: CFO 2 week timeframe Facilitated by CFO One week preparation inputting 5 year history and
forecasts 1 day workshop presenting to Management Team to
review performance. Agree on initial 80/20 KPIs Design & implement daily, weekly reporting
(see example in Appendix 1)
Objective: Understand current & forecast business performance. Develop initial 80/20 broad range of critical KPIs to quickly instill focus, accountability & sense of urgency
10

Risk Review
Brainstorm Key Risks
Select Top 10 Risks
Agree on Potential impact (develop models)
Potential Mitigation Strategies
Probability before & after
If risk & impact still too high develop more mitigation
11
Sponsor: CFO 1 week timeframe Facilitated by External
consultant 2 day workshop with
Board & Leadership Team
Ensure they are incorporated into ongoing monthly reporting so that mitigation efforts are progressed
Objective: Understand the key business risks, their potential impact, the mitigation strategies & probability before & after mitigation

Sponsor: VP S&M 8 week timeframe Facilitated by Market Research Consultant Customer questionnaires. … example questions;
Rate our performance levels relative to competitors Rate our behaviors relative to competitors What are our biggest threats What are our biggest opportunities How can we help your business
Redo in 12 months times to measure change
Objective: Understand the customer perceptions of our value proposition & business performance (& our SWOT)
12
External Customer Survey
20% of customers interviewed by external facilitator
All customers asked do questionnaire compiled by
external consultant
Present findings
Redo every year to measure trend

Value Driver Model
Develop Draft Conceptual Models
Populate models with data
Benchmark model components to best practice
Identify High Level gaps with targeted performance
Sponsor: CFO 8 week timeframe Facilitated by Consultant Prepare draft conceptual model
(see example in Appendix 2) 1 day initial workshop with commercial team &
management reviewing/ explaining model concept and data requirements
Four week preparation inputting & verifying 5 year history and forecasts
Three weeks for benchmarking components 1 day workshop presenting to Management Team to
review performance and see major targeted performance gaps (see example in Appendix 3)
Objective: Develop a “Theoretical Potential Improvement “ in the business by Developing a Value Driver model and benchmark all its components against best practice and measure gap,
13

Objective: Ensure a governance framework is in place that meets best practice & exceeds all listing requirements
Sponsor: Chairman One week timeframe Facilitated by CFO & Auditor
Listing & Regulatory governance requirements
Examples of “Best Practice” governance policies at other companies
CFO to provide example of DOA for review CFO to provide example of Planning & Control
Framework (See Appendix 4) Two Day workshop attended by
ALL Board members All ELT members Facilitator
Conduct workshops to communicate all policies across all employees run by VP HR
14
Governance Framework
Mission & Values
Delegation of Authorities
Compliance & Audit
Code of Conduct
Planning & Control
Syndicate

Behavioral Change Plan
Review Stage 1 feedback from stakeholders
Identify behavioral barriers to achieve objectives
Identify solutions to remove barriers
Develop action plan to implement
Communicate to stakeholders
Sponsor: CEO 8 week timeframe Appoint external Consultant to Facilitate
1513
Behaviours & Soft Skills - Our Customers (Presidents) Perceptions – Big Improvement
KEY BEHAVIOURS / SOFT SKILLS Nov-05 Jan-07 % ChangeLeadership 7 8 14%Business Acumen 7 7 0%Communication 8 8 0%Creativeness 7 8 14%Customer Focus 7 8 14%Commitment to Quality 7 8 14%Attention to Detail 4 8 100%Discipline 4 7 75%Problem Solving 5 8 60%Planning & Organising 3 8 167%Action Orientated 3 8 167%Interpersonal Sensitivity 8 7 (13%)Flexibility 4 8 100%Resilience 5 7 40%Energy 4 8 100%
Average 6 8 40%
Rating out of 10EXAMPLEEXAMPLE
Objective: From feedback, develop detailed behavioral change plan needed to meet all stakeholder objectives (mission, values, targets, etc)

Recruitment, Training, Develop. & Retention
Effectiveness
Is there clear Directional Info. (PD,KRAs,Targets) ?
Does the person have sufficient Resources or Tools
to do the job ?
Are rewards competitive, performance reviews effective &
sufficient recognition given ?
Are there training and development plans ?
Do the employees have the capacity to do their role ?
Are they motivated… a good fit or enjoyable workplace
environment ?
Sponsor: VP HR 8 week timeframe Appoint External HR Consultant to Facilitate Use Gilberts 6 window model to determine process
issues
Objective: Understand if performance shortfalls are due to any systemic factor that can be corrected
16

Stewardship Review & Control Processes
Prepare templates
Undertake Stewardship Review
Management signoff of findings & action plan
Management process in place to ensure gaps are closed
Implement Actions
Sponsor: CFO 3 week timeframe Facilitated by CFO & Auditor – Template provided
by CFO & signed off by Auditor Three weeks to fill in template by accounting team
with all supporting schedules 2 day review with finance team facilitated by CFO
& Auditor with output being actionable issue list
17
Objective: Verify Balance sheet values , identify any major write-offs and/or control weakness with actionable plan

Cash Management & Funding Process
Appoint Regional Cash Management Bank
Design & Implement online payment process
Review Capital structure, facilities
Develop & implement centralized funding
arrangements, align DOA
Sponsor: CFO 8 week timeframe including implementation Facilitated by Treasurer 2 day workshop designing online payment process
led by Treasurer & Bank Review Capital structure, facilities and WAC Gain approval for changes from CEO & Board
Objective: Review adequacy of capital structure & funding facilities. Implement a process ensuring CFO has day to day control of funding and all material cash outflows
18

CAPEX & Discretionary Spend Control Process
Justification Templates & Models
Approval Review
Ranking Process
Implementation Control
Post Implementation Review
Communicate across organisation
Review DOA spend limits
Sponsor: CFO 8 Week Timeframe Appoint facilitator 2 day workshop to review and test process Process signed off by ELT Communication Workshops across all relevant
people run by CFO
Objective: Put process in place to ensure all CAPEX & Discretionary Spend (Marcom, R&M, etc) is properly justified, approved, prioritised, controlled in timely manner with post implementation review.
19

Working Capital Management
Set targets after understanding Value Proposition WC terms & benchmark its
competitiveness
Minimize payment runs to one per month
Make Sales Dept responsible for collection & set weekly collection
targets
Clear Credit Limit, stop credit and legal proceeding rules enforced by Finance
Implement Weekly Cash & WC Forecast / Control process
Cost VP WC Terms into CPP margin numbers
Monthly Sales & Operation Planning meeting to optimize DOI
Objective: Put process in place to control & optimize WC % to “Best Practise”
Sponsor: CFO 8 week timeframe Appoint facilitator
20

Margin Management Review
Margin Calculation Definition & Costing Methodology
Pricing Process & DOA Compliance
Cost Plus v Market Based
Discount & Rebate Structure
CPP Matrix Analysis (Variation)
Reporting
Sponsor: CFO 8 week timeframe Appoint Consultant to Facilitate (PCM ?) Understand margins
Pricing policies and processes Costing policies and processes
Explain variations Identify total improvement potential for margins Identify gaps to “Best Practice” & agree on process
changes
Objective: Ensure Margin Management Performance & Processes are “Best Practise”. Identify margin improvement potential & process changes.
21

Supplier Procure to Pay
Identify Best Practice
Map “AS IS” process
Document Gaps to “Best Practice”
Understand Risk/cost/resources to close gap
Develop longer term plan for delivering last 20%
Develop 80 / 20 strategy for quick implementation
Objective: Reengineer Process to be “Best Practice”
Sponsor: CFO 8 week timeframe Facilitated by Consultant, FC & VP IS/IT
22

CustomerOrder to Fullfillment
Identify Best Practice
Map “AS IS” process
Document Gaps to “Best Practice”
Understand Risk/cost/resources to close gap
Develop longer term plan for delivering last 20%
Develop 80 / 20 strategy for quick implementation
Objective: Reengineer Process to be “Best Practice”
Sponsor: CFO 8 week timeframe Facilitated by Consultant, FC & VP S&M
23

Employee Payroll & Exp. Reimbursement
Identify Best Practice
Map “AS IS” process
Document Gaps to “Best Practice”
Understand Risk/cost/resources to close gap
Develop longer term plan for delivering last 20%
Develop 80 / 20 strategy for quick implementation
Objective: Reengineer Process to be “Best Practice”
Sponsor: CFO 8 week timeframe Facilitated by Consultant, FC & VP IS/IT
24

Sales Capability
Value Proposition Competitiveness
Project Pipeline & Market Intelligence Data Systems
4P Effectiveness (Marcom) & Sales Incentives
Customer & Channel Relationship & Selling Skills
CPP Matrix Analysis (Variation) & Reporting
Bid Quality & Turnaround Times
Sponsor: VP Sales & Marketing 8 week Timeframe Appoint Consultant to Facilitate KPIs compared;
Segment analysis – Quantity. margin p/t, MS% Value Proposition – lead time, quality, Terms Spend on Marcom, # of people, people cost
Objective: Review Capability, Performance & Processes. Identify improvement opportunities
25

Product & Market Development Process
New Channels
New Products / Services
Expand Up / Down Value Chain
New Segments
M & A opportunities
Geographic Footprint Expansion / Coverage
Sponsor: VP Sales & Marketing 8 week Timeframe Facilitated by External Consultant With conservative development success, is there
sufficient projects in the long term pipeline to meet growth targets ?
KPIs compared; Time to Market
New Channel New Segment New Product New Geographic Location
% Projects on / ahead of target 3,5 Year Forecast Gap to Target
Objective: Do we have an effective process & Have we identified & invested in a sufficient pipeline of growth opportunities to meet our growth targets ?
26

IS / IT Systems Capability
Measurement KPIs
Competitiveness of IS system
Age of Infrastructure
Outsourcing Options
Skills & Experience
Technology as enabler of growth
Sponsor: CFO 8 week timeframe Appoint external IS/IT Consultant to Facilitate Do we have sufficient measurement systems ie KPIs =
downtime, Support costs, Development Costs, Coms Costs , manual and legacy systems
Along with pareto analysis , reason codes for all problems
Do we know “Best Practice” performance and process ?
Objective:Are these systems appropriate for our needs and are they efficient and cost effective ?
27

Customer Service Excellence
Measurement of KPIs (Lead Time, Stock Outs, $DOI,
DIFOT%, distribution costs)
Benchmark & Pareto Performance Gap
Competitiveness of Value Proposition
Quality Process
On Time Process
Sponsor: VP Operations 8 week timeframe Appoint external Consultant to Facilitate Do we have sufficient measurement systems ie KPIs =
Customer complaints & Returns, DIFOT%, Customer Loyalty - % of their spend, premium over Next Best Alternative
Along with pareto analysis , reason codes for all problems
Do we know “Best Practice” performance and process ?
28
Objective: Develop detailed plan to ensure the customer service is consistently competitive, value enhancing & meeting our promise to the customer ?

OHS & E Process
Does the leadership put OHS & E as #1 priority ?
Have we implemented mitigating strategies for all High
Impact risks / activities ?
Do we measure incident pyramid ?
Do 100% of employees conduct and questioned in regular audits
?
Are all issues raised in Audits closed out in a timely matter
Is there regular and sufficient training given ?
Sponsor: VP Operations 8 week timeframe Appoint External OHS & E Consultant to Facilitate If we don’t know what is “Best Practice” then we need
to find out… eg BHPSTEEL in 1995 sort advice from leader DUPONT
Objective: Are the OHS & E processes and performance at “Best Practice” levels
29
X

Manufacturing Excellence Capability
Measurement
Fit for purpose Raw Materials & efficient utilization & batch size
Appropriate Equipment (quality and efficiency)
Repairs & Maintenance
Skills & Experience
Production Planning Process & Product Complexity
Sponsor: VP Operations 8 week timeframe Appoint external manufacturing Consultant to
Facilitate Do we have sufficient measurement systems ie KPIs =
downtime, Yield Loss, Throughput, Material Usage Variance, Variable costs, Fixed costs
Along with pareto analysis , reason codes for all problems
Do we know “Best Practice” performance and process ?
Objective: Are the Manufacturing processes and performance at “Best Practice” levels
30

Supply Chain Management
Procurement
Warehousing & Stock Management
Distribution
Forecast Accuracy
Outsourcing
Production Planning Process & Product Complexity
Sponsor: VP Operations 8 week timeframe Appoint external manufacturing Consultant to
Facilitate Do we have sufficient measurement systems ie KPIs =
Procurement cost, Stock Outs, $DOI, Distribution Costs
Along with pareto analysis , reason codes for all problems
Do we know “Best Practice” performance and process ?
Monthly Sales and Operations Planning Meeting
Objective: Are these processes and performance at “Best Practice” levels
31

Planning & Performance Process
Strategy, Value Driver Model,
benchmark & 5Year targets
Actions to Close Gap & 1 year budget
Integrate with
individual STI targets
KPI Reporting Daily, Weekly, Monthly
Corrective Actions
One on One Performance
Reviews
Objective: Ensure there is a process in place that drives ongoing systematic improvement, provides clear accountability, focuses the business on things that are important and creates a sense of urgency
Planning & Performance Management Process
Strategy , benchmark & 5 year plans
Action Plans to close gap along with 1 year budget
Integrate with Individual STI targets
Monitor PerformanceDaily, Weekly, Monthly
KPI Reporting
Take Corrective Actions to close gaps
Undertake Individual Performance
Reviews
Sponsor: CFO 8 week timeframe Facilitated by External Consultant See example in Appendix 5
32

Performance Gap “Deep Dives”
Identify items that make up at least 90% of Gap
Undertake “Deep Dives” for these items with “Best”
Understand why, & develop plan for closure of gap
Reviewed & Signed off by CFO
Sponsor: CFO 8 week timeframe Facilitated by See example “Deep Dive” in Appendix 6
Objective: Turn “Theoretical Gap” into confirmed opportunities with management commitment and detailed hard action plans
33

Synthesize Story & Syndicate
Objective: Ensure everyone in the business can see the prize or precipice so they understand why we have to change
34
Sponsor: CEO 1 week timeframe Facilitated by CEO
& ELT

APPENDIX
35

7
Example – Stage BSimple Value Driver Model
Revenue p /t.
Raw M aterial costs per Input Ton ne.
% Yield .Raw M aterial costs p/t
Distribu tion O ut costs p/t.
M aterial Spread p /t
Electrici ty cost per kwh.
# Kwh p/t.Electrici ty cost p/t
G as cost per M BTU.
M BTU p/t.G as cost p /t
Commissions/Royalties.
Packag ing .
Consumab les.
Environmental.
O ther.
O ther Variab le Costs p/t
Var iable M argin p /t
L ine Speed - L ineal M PM .
M ix - M 2 per tonne.
Schedu led & Unschedu led M aint..
Production Capacity
Forecast 5 year CAG R%.% Capacity Utili sation
Capaci ty Constrained
YOY % G rowth.M arket Size
% M arketshare .Demand Constrai ned
Pri me Tonnes Despatched
Var iable Contr ibu tion
# Employees.
Payro l l & Oncosts per emp loyee.Payrol l & Oncosts
M o tor Veh icles.
Coms & Computers .
Travel & Entertainment.
M arketing & Growth costs.
Rep airs & M aint.
Premises cost.
Consu ltan ts.
Other.
F ixed Overhead
Life .Depreciation
Abnorm als.
EBIT
* The value driver modeling was a technique I learnt from Neil Sylvester (now Partner in PIP) when he was engaged by Boral in the 1990s.
36
APPENDIX 1
EXAMPLE
EXAMPLE
DAILY (Email Template)Good News - WinsMTI, LTI, Enviro Incident, Fraud IncidResignations - Key ManagementBad NewsDespatches Unit Volume - Yesterday Unit Volume - MTD % of Mth FcstMargin % - Act & Mth FcstOrders Received Unit Volume - % of Mth Fcst Margin % - Act & Mth FcstCashflow - Act & Mth FcstCash Position
WEEKLY KPIs. (Email Template)Act Cashflow v 1 week FcstFcst Cashflow Next WeekAct Sales Rev v 1 week FcstFcst Sales Rev Next WeekInterco Payables Overdue% Receivables Overdue% Inventory Over 30 daysInventory - % of Mth FcstDIFOT % - Act & Mth Fcst
MONTHLY ELT REVIEW AGENDAMinutes of Last MeetingTraffic Light SummaryOHS&EC.S. - DIFOT % & Lead Time DaysPEOPLE - Behavioural Change AgendaEBIT - Variance Analysis Volume - Pipeline & Market Margin Spread Selling Price Variable Costs Costs & Efficiencies Manufacturing Logistics S & M Admin & OtherREVENUE - Variance AnalysisCASHFLOW - Variance Analysis WC Inventories Receivables & Payables Capex & DisposalsProject Progress UpdateRisks & OpportunitiesAgreed Actions & Checkout
ONE HOUR ALERT (Phone Call)LTIEnvironment IssueFraud
Reporting / KPI pipeline – Daily, Weekly, Monthly

37
APPENDIX 2
EXAMPLE
EXAMPLE
Value Driver Model
EXAMPLES OF EBIT IMPROVEMENT PROCESS
8
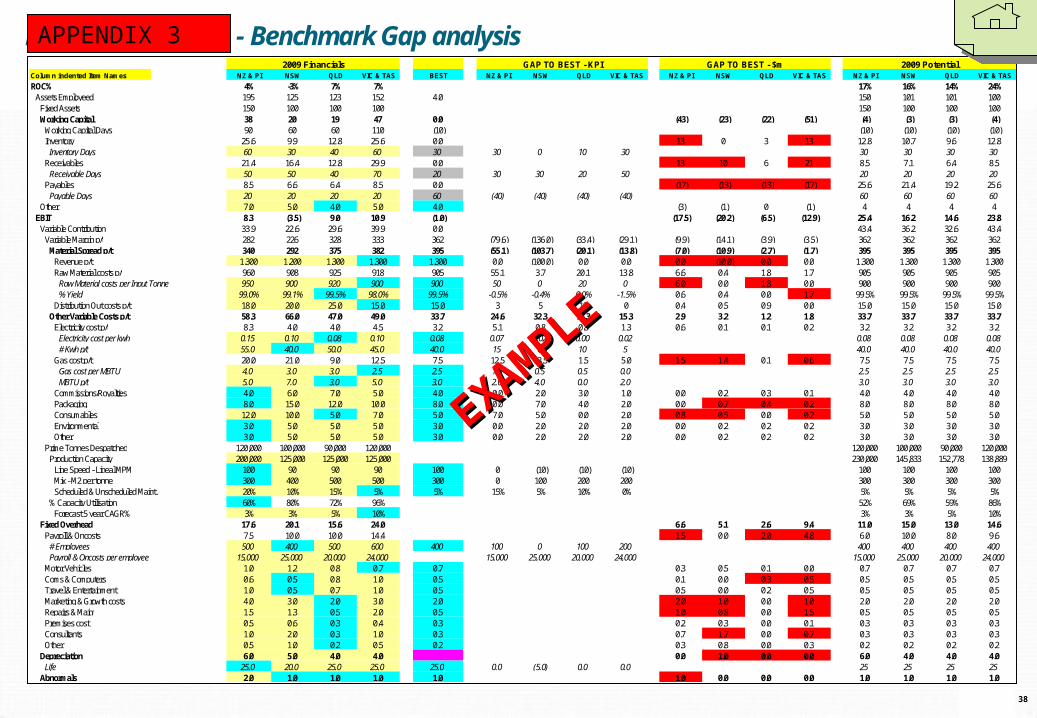
Example – Stage D - Benchmark Gap analysisColumn indented Item Names NZ & PI NSW QLD VIC & TAS BEST NZ & PI NSW QLD VIC & TAS NZ & PI NSW QLD VIC & TAS NZ & PI NSW QLD VIC & TASROC% 4% -3% 7% 7% 17% 16% 14% 24%
Assets Employeed 195 125 123 152 4.0 150 101 101 100Fixed Assets 150 100 100 100 150 100 100 100Working Capital 38 20 19 47 0.0 (43) (23) (22) (51) (4) (3) (3) (4)
Working Capital Days 90 60 60 110 (10) (10) (10) (10) (10)Inventory 25.6 9.9 12.8 25.6 0.0 13 0 3 13 12.8 10.7 9.6 12.8
Inventory Days 60 30 40 60 30 30 0 10 30 30 30 30 30Receivables 21.4 16.4 12.8 29.9 0.0 13 10 6 21 8.5 7.1 6.4 8.5
Receivable Days 50 50 40 70 20 30 30 20 50 20 20 20 20Payables 8.5 6.6 6.4 8.5 0.0 (17) (13) (13) (17) 25.6 21.4 19.2 25.6
Payable Days 20 20 20 20 60 (40) (40) (40) (40) 60 60 60 60Other 7.0 5.0 4.0 5.0 4.0 (3) (1) 0 (1) 4 4 4 4
EBIT 8.3 (3.5) 9.0 10.9 (1.0) (17.5) (20.2) (6.5) (12.9) 25.4 16.2 14.6 23.8Variable Contribution 33.9 22.6 29.6 39.9 0.0 43.4 36.2 32.6 43.4
Variable Margin p/t 282 226 328 333 362 (79.6) (136.0) (33.4) (29.1) (9.9) (14.1) (3.9) (3.5) 362 362 362 362Material Spread p/t 340 292 375 382 395 (55.1) (103.7) (20.1) (13.8) (7.0) (10.9) (2.7) (1.7) 395 395 395 395
Revenue p/t 1,300 1,200 1,300 1,300 1,300 0.0 (100.0) 0.0 0.0 0.0 (10.0) 0.0 0.0 1,300 1,300 1,300 1,300Raw Material costs p/t 960 908 925 918 905 55.1 3.7 20.1 13.8 6.6 0.4 1.8 1.7 905 905 905 905
Raw Material costs per Input Tonne 950 900 920 900 900 50 0 20 0 6.0 0.0 1.8 0.0 900 900 900 900% Yield 99.0% 99.1% 99.5% 98.0% 99.5% -0.5% -0.4% 0.0% -1.5% 0.6 0.4 0.0 1.7 99.5% 99.5% 99.5% 99.5%
Distribution Out costs p/t 18.0 20.0 25.0 15.0 15.0 3 5 10 0 0.4 0.5 0.9 0.0 15.0 15.0 15.0 15.0Other Variable Costs p/t 58.3 66.0 47.0 49.0 33.7 24.6 32.3 13.3 15.3 2.9 3.2 1.2 1.8 33.7 33.7 33.7 33.7
Electricity cost p/t 8.3 4.0 4.0 4.5 3.2 5.1 0.8 0.8 1.3 0.6 0.1 0.1 0.2 3.2 3.2 3.2 3.2Electricity cost per kwh 0.15 0.10 0.08 0.10 0.08 0.07 0.02 0.00 0.02 0.08 0.08 0.08 0.08# Kwh p/t 55.0 40.0 50.0 45.0 40.0 15 0 10 5 40.0 40.0 40.0 40.0
Gas cost p/t 20.0 21.0 9.0 12.5 7.5 12.5 13.5 1.5 5.0 1.5 1.4 0.1 0.6 7.5 7.5 7.5 7.5Gas cost per MBTU 4.0 3.0 3.0 2.5 2.5 1.5 0.5 0.5 0.0 2.5 2.5 2.5 2.5MBTU p/t 5.0 7.0 3.0 5.0 3.0 2.0 4.0 0.0 2.0 3.0 3.0 3.0 3.0
Commissions/Royalties 4.0 6.0 7.0 5.0 4.0 0.0 2.0 3.0 1.0 0.0 0.2 0.3 0.1 4.0 4.0 4.0 4.0Packaging 8.0 15.0 12.0 10.0 8.0 0.0 7.0 4.0 2.0 0.0 0.7 0.4 0.2 8.0 8.0 8.0 8.0Consumables 12.0 10.0 5.0 7.0 5.0 7.0 5.0 0.0 2.0 0.8 0.5 0.0 0.2 5.0 5.0 5.0 5.0Environmental 3.0 5.0 5.0 5.0 3.0 0.0 2.0 2.0 2.0 0.0 0.2 0.2 0.2 3.0 3.0 3.0 3.0Other 3.0 5.0 5.0 5.0 3.0 0.0 2.0 2.0 2.0 0.0 0.2 0.2 0.2 3.0 3.0 3.0 3.0
Prime Tonnes Despatched 120,000 100,000 90,000 120,000 120,000 100,000 90,000 120,000Production Capacity 200,000 125,000 125,000 125,000 230,000 145,833 152,778 138,889
Line Speed - Lineal MPM 100 90 90 90 100 0 (10) (10) (10) 100 100 100 100Mix - M2 per tonne 300 400 500 500 300 0 100 200 200 300 300 300 300Scheduled & Unscheduled Maint. 20% 10% 15% 5% 5% 15% 5% 10% 0% 5% 5% 5% 5%
% Capacity Utilisation 60% 80% 72% 96% 52% 69% 59% 86%Forecast 5 year CAGR% 3% 3% 5% 10% 3% 3% 5% 10%
Fixed Overhead 17.6 20.1 15.6 24.0 6.6 5.1 2.6 9.4 11.0 15.0 13.0 14.6Payroll & Oncosts 7.5 10.0 10.0 14.4 1.5 0.0 2.0 4.8 6.0 10.0 8.0 9.6
# Employees 500 400 500 600 400 100 0 100 200 400 400 400 400Payroll & Oncosts per employee 15,000 25,000 20,000 24,000 15,000 25,000 20,000 24,000 15,000 25,000 20,000 24,000
Motor Vehicles 1.0 1.2 0.8 0.7 0.7 0.3 0.5 0.1 0.0 0.7 0.7 0.7 0.7Coms & Computers 0.6 0.5 0.8 1.0 0.5 0.1 0.0 0.3 0.5 0.5 0.5 0.5 0.5Travel & Entertainment 1.0 0.5 0.7 1.0 0.5 0.5 0.0 0.2 0.5 0.5 0.5 0.5 0.5Marketing & Growth costs 4.0 3.0 2.0 3.0 2.0 2.0 1.0 0.0 1.0 2.0 2.0 2.0 2.0Repairs & Maint 1.5 1.3 0.5 2.0 0.5 1.0 0.8 0.0 1.5 0.5 0.5 0.5 0.5Premises cost 0.5 0.6 0.3 0.4 0.3 0.2 0.3 0.0 0.1 0.3 0.3 0.3 0.3Consultants 1.0 2.0 0.3 1.0 0.3 0.7 1.7 0.0 0.7 0.3 0.3 0.3 0.3Other 0.5 1.0 0.2 0.5 0.2 0.3 0.8 0.0 0.3 0.2 0.2 0.2 0.2
Depreciation 6.0 5.0 4.0 4.0 0.0 1.0 0.0 0.0 6.0 4.0 4.0 4.0Life 25.0 20.0 25.0 25.0 25.0 0.0 (5.0) 0.0 0.0 25 25 25 25
Abnormals 2.0 1.0 1.0 1.0 1.0 1.0 0.0 0.0 0.0 1.0 1.0 1.0 1.0
2009 PotentialGAP TO BEST - KPI2009 Financials GAP TO BEST - $m
38
APPENDIX 3
EXAMPLE
EXAMPLE

MISSION VALUES COC & DOA VISION TARGETS
REPORTING• Hourly Alert • Daily – KPIs• Weekly – Cash• Monthly – BPR• Qtrly – Forecasts• Annual – Budget
• A• B• C• D
• A• B• C• D
SITE VISITS• CEO Business Reviews• CEO / CFO Major Capital Project Reviews• CFO Stewardship & Commercial Reviews• ELT Monthly Reviews• Board Meetings• External & Internal Audits
ELT GOVERNANCE FRAMEWORK
OTHER• “Whistle Blower” System• OHS & E Alert System• Weekly Telecons – Cash• COC & DOA Training Programs• Values / Leadership Training Program
OCT• Forecast
Review
JUL• LY Review
FEB• Capex & WC
AUG• Behavioral
Change
MAR• Deep Dive
Signoff
SEP• OHS&E
APR• Budget &
Risk Review
JAN• Strategy &
Growth
MAY• Stewardship &
Internal Audit
NOV• Benchmark
JUN• People &
KRAs
DEC• CPP
ELT MONTHLY ONE DAY REVIEWS SPECIAL AGENDA (DEEP DIVES)
APPENDIX 4
39
EXAMPLE
EXAMPLE

40
APPENDIX 5KPI: Owner: Target % Change:
Key Objective: EBIT Sensitivity 1% :Performance: Target EBIT Impact:
Forecast % Change:Forecast EBIT Impact:
10
Increase Uptime from average of 70% in 2006 to 83% in 2007YTD Uptime is 2% below BUD (10% higher than LY). Expect to finish the year 1% below BUD (12% higher than LY). YTD improvement is due to Uptime Project. Month – worse than forecast: Due to Bottom Dross removal.
UPTIME % - MCL VP Manufacturing
YTD Downtime % - Pareto AnalysisYTD Downtime % - Pareto Analysis
STATUS COMMENTSSTATUSIMPACTWHOTOP 3 ACTIONS / PROJECTS TO DELIVER THIS QTR FORECASTREF.
UML3
UML2
UML1
On-trackMCL MgrBottom Dross Issue: Manage bottom dross growth until main pot replacement, by consistency of schedule cleaning and implement of dross grab to removed mushy dross.
On-trackMCL MgrProcedure: Implement Reliability Workshop action plans
DoneMCL MgrEquipment: Replace MCL Welder control to give consistency of welding quality
On-trackMaint MgrJul’07Review potential local vendor for pot replacement.UML7
UML8
STATUS COMMENTSSTATUSIMPACTWHOWHENTOP 5 ACTIONS / PROJECTS TO IMPACT BEYOND THIS QTRREF.
On-trackMaint MgrOct’07Equipment : Placing PO and commitment for main pot replacement project.UML6
InitiatedMCL Manager
Dec ’07Standardization process map resin areaUML5
UML4 InitiatedVP MfgOct ‘07Bottom dross issue: Ensure new pot design is capable of minimizing dross build-up
10.6
3.7 3.4 1.5 1.3 0.5 0.2 - 0.2-5.0
10.015.020.025.0
%
10.6
3.7 3.4 1.5 1.3 0.5 0.2 - 0.2-5.0
10.015.020.025.0
%
Trend – MonthTrend – MonthPerformancePerformance
83
88
82
7269
7570
81
88
82 79
50556065707580859095
100
Month YTD Full Year
%Last Year Bud Fcst Actual
83
88
82
7269
7570
81
88
82 79
50556065707580859095
100
Month YTD Full Year
%Last Year Bud Fcst Actual
50556065707580859095100
J A S O N D J F M A M J
%Last year Budget
Forecast Actual
13%US$0.3m *US$3.9m12%US$3.6m
EXAMPLE
EXAMPLE
MONTHLY KPI REPORT – Situation, Reason, Action

EXAMPLES OF EBIT IMPROVEMENT PROCESS
9
Example - E - Deep Dive Summary on Material Benchmark Gap for Packaging cost per tonne
SBU - NSW
• Implementation Leader – Joe Brown (NSW Packaging Mgr)
• ARITHMETIC BENCHMARK GAP TO BE ANALYSED = A$700k
Cost per Tonne = A$15 , Best A$8 ( SBU NZ )
Annual Tonnes despatched by Company NSW = 100,000 , therefore A$7 p/t gap = A$700,000 p.a.
Key reasons
Different material type of packaging – impact A$200k p.a.
Outsourcing used by NSW but in-house by NZ – impact A$400k p.a.
Different labor rates between countries that two businesses operate – impact A$100k. The labor rate difference
cannot be closed as it reflects different market rates between the two countries..but will attempt to recover it in the
selling price to the customer (see spread analysis)
Risks – Ensure NSW customers will accept NZ packaging
Therefore Agreed Gap for targeted closure – A$600k
Target implementation completion – Week 45
41
APPENDIX 6
EXAMPLE
EXAMPLE