is public safety realignment reducing recidivism in ... public safety realignment reducing...
TRANSCRIPT

Is Public Safety Realignment Reducing Recidivism in California?
June 2014
Magnus Lofstrom, Steven Raphael, and Ryken Grattet with research support from Brandon Martin
Supported with funding from the Smith Richardson Foundation

Summary
California has had one of the highest recidivism rates in the nation for more than a decade. This contributed to overcrowding in the state’s expensive prison system and helped to motivate wide-ranging corrections reform legislation in 2011, commonly referred to as public safety realignment. Realignment essentially halted the practice of sending parole violators back to state prison and instead made counties responsible for supervising and sanctioning most released offenders. It also cut in half the maximum sentence for a supervision violation—from one year to six months.
How are these changes affecting the state’s recidivism rates? We find that the post-realignment period has not seen dramatic changes in arrests or convictions of released offenders. In the context of realignment’s broad reforms to the corrections system, our findings suggest that offender behavior has not changed substantially.
Overall arrest rates of released offenders are down slightly, with the proportion of those arrested within a year of release declining by 2 percentage points. At the same time, the proportion of those arrested multiple times has increased noticeably, by about 7 percentage points. These higher multiple arrest rates may reflect the substantial increase in the time that released offenders spend on the streets—a result of counties’ limited jail capacity (Lofstrom and Raphael 2013).
Convictions among released offenders have increased, but this increase does not appear to reflect changes in offender behavior so much as changes in arrest procedures and prosecutorial approaches. The likelihood that an arrest will lead to a conviction has increased by roughly 3 percentage points. Furthermore, the proportion of released offenders who are actually convicted has increased about 1.2 percentage points—a small but statistically significant rise—and nearly all of these new convictions are for felonies. Together, these findings suggest that new offenses are increasingly being processed through the courts as formal felony charges and convictions, rather than as technical violations through the Board of Parole Hearings.
Finally, our analysis shows that realignment has, as intended, led to a considerable 33 percentage point drop in the proportion of released inmates who are returned to state prison. This demonstrates that realignment has made substantial progress in one of its main goals: reducing the use of prison as a sanction for parole violations and minor criminal offenses.
Taken together, our findings suggest that county efforts are at least partly offsetting the effects of increased street time among released offenders. Changes in arrest and conviction rates have been modest—but these rates remain high in the post-realignment period. State and local authorities need to develop more effective, targeted policies aimed at both deterring crime and connecting released offenders to rehabilitative services. California needs such strategies to bring recidivism rates down to levels that will relieve pressure on state prison and county jails, and help the state reach the federally mandated prison population threshold.
http://www.ppic.org/main/home.asp Is Public Safety Realignment Reducing Recidivism in California? 2

Contents
Summary 2
Figures 4
Tables 4
Abbreviations 5
Introduction 6
Realignment Has Dramatically Changed Reliance on Prisons 8
Measures of Recidivism and Methods for Gauging the Effect of Realignment 11 Adjusting for changes in the composition of release groups 12 Empirical Strategy 14
Changes in Offender Characteristics Affected Recidivism Rates 17
Conclusions 27
References 29
About the Authors 30
Acknowledgments 30
Technical appendices to this paper are available on the PPIC website: www.ppic.org/content/pubs/other/614RGR_appendix.pdf

Figures
1 Parolee returns to California state prisons stood out before realignment 9
2 Released inmates have served longer terms and are less likely to be released after a parole revocation 13
3 Prisons in California are no longer housing inmates for short stays 14
4 Unadjusted recidivism rates fell with realignment 18
5 Recidivism trends are different after adjusting for released prisoner characteristics 19
6 Key recidivism trends declined after realignment after adjusting for released offender characteristics 20
7 Returns to custody without arrest are disappearing 21
8 Felony arrests are higher among post-realignment offenders 21
9 Released offender misdemeanor conviction rate fell post-realignment 22
10 Felony conviction rates rose after adjusting for released prisoner characteristics 22
11 Statistically adjusted conviction rates are higher after realignment 23
12 Multiple arrests vary noticeably across release cohorts 25
13 Post-realignment released offenders are more likely to be arrested multiple times 26
14 The increase in multiple arrest is especially noticeable 26
Tables
1 Differences between pre- and post-realignment released offenders are notable 16
http://www.ppic.org/main/home.asp Is Public Safety Realignment Reducing Recidivism in California? 4

Abbreviations
CDCR California Department of Corrections and Rehabilitation
PRCS Post-Release Community Supervision
RTC Return-to-Custody
http://www.ppic.org/main/home.asp Is Public Safety Realignment Reducing Recidivism in California? 5

Introduction
Recidivism is the term corrections policymakers and experts use to describe the return to offending by individuals previously convicted of a crime. It is the most salient measure of a correctional system’s overall performance. For more than a decade, California has had one of the highest recidivism rates in the United States (PEW Center on the States 2011), widely regarded as a mark of the failure of the state’s correctional system.1 Historically, unique features of California’s system partly explained its high rates. Most importantly, California placed every released offender under state parole supervision and returned large numbers of released offenders to prison for parole violations as measured by returns to prison (Grattet, Petersilia, and Lin 2008).
In 2011, California enacted Assembly Bill 109, known as public safety realignment. This legislation significantly changed the system. Instead of state parole, most inmates released from state prison now go to county probation as Post-Release Community Supervision (PRCS) cases. Individuals who violate PRCS rules and most of those who remain under the state parole system are now locally sanctioned. They serve short jail terms or some non-jail alternative instead of returning to state custody. Former prison inmates under PRCS or state parole are eligible for discharge from supervision if they have no violations for six months, down from 13 months before realignment. Under realignment, it is difficult to return released inmates to prison. Released offenders must be convicted either of a new crime involving a serious, violent, or sexual offense, or, for people with histories of serious, violent, or sexual offenses, of a new felony. Moreover, the maximum sentence for a supervision violation is reduced from one year to six months and the state parole board no longer has authority to return offenders to prison. Thus, realignment has essentially ceased the flow of released inmates back to prison. As a result, prison and state parole populations have dropped dramatically (Lofstrom and Raphael 2013a; Grattet and Hayes 2013a; Grattet and Hayes 2013b).
In this report, we assess how these changes have affected recidivism among inmates released from the state prison system. Realignment has eliminated the practice of returning parolees to state prison for parole violations, reduced the maximum sentences for a supervision violation from one year to six months, placed more emphasis on local sanctions, and relaxed thresholds for early discharge from community corrections supervision. Former inmates who before realignment would probably be in prison for parole violations are no longer behind bars. In other words, the reform has increased the “street time” of former prisoners (Lofstrom and Raphael 2013a). We explore how these changes have affected measures of recidivism, including arrests and convictions.2
Our study does not include one important group of released prisoners convicted of a felony: so-called 1170(h) felons. These are lower-level offenders convicted of nonsexual, nonviolent, and non-serious crimes (so-called triple-non offenses) who do not have such crimes on their criminal records. Realignment requires that they serve their sentences in county jail instead of state prison. Statewide data do not currently track these offenders.
1 Citing the state’s high rate of recidivism, the Little Hoover Commission declared the state’s parole system “a billion dollar failure” (Little Hoover Commission. 2007. Solving California’s Corrections Crisis: Time is Running Out. p. ii.) 2 Measuring recidivism poses difficult challenges. CDCR historically focused on return to custody. Other groups favor arrest, conviction, or felony arrest or conviction for particular, sometimes self-interested, reasons. No single measure of recidivism truly captures offender behavior. Instead, discretionary system responses to offender behavior can cause variation in the significance of arrest, conviction, and return to custody. These measurement challenges are currently the focus of state efforts to standardize a recidivism definition. For this report, we rely on measures available in the CDCR data: arrest, conviction, and return to prison. However, proper interpretation of these measures requires further clarification, which we provide in the report.
http://www.ppic.org/main/home.asp Is Public Safety Realignment Reducing Recidivism in California? 6

Evidence presented in two CDCR Office of Research reports (2013a, 2013b) suggests little change in recidivism under realignment. Arrests of released prisoners are down slightly and convictions are about the same. As anticipated, far fewer released offenders are returning to CDCR custody. The CDCR reports that arrest and conviction rates apparently declined in each month of the post-realignment period.
In this report, we build on the CDCR reports by expanding the analysis along several dimensions. First, we reanalyze recidivism trends by defining pre- and post-realignment groups of released prisoners. We examine one-year follow-up periods that fall entirely in either the pre-realignment or post-realignment periods. This allows a cleaner comparison of outcomes before and after realignment. This reanalysis confirms the CDCR finding of declining arrest rates of former inmates within a year of release. It also confirms declining conviction rates for new felonies. We also document the sharp decline in the probability that a released inmate will return to a state prison within a year of release. Interestingly, for parolees whose observation year partially extends into the post-realignment period, the decline began a year before realignment’s implementation.
Our analysis shows that changes in the characteristics of released prisoners are contributing to these improvements in recidivism. Specifically, inmates released from prison today have on average served more time and are much less likely to have been in prison for a parole violation. In other words, prisoners released post-realignment are less likely to be like the pre-reform “frequent flyers” who cycled in and out of prison on parole revocations.
Our goal is to determine whether two comparable individuals, one released pre-realignment and one post-realignment, differ in recidivism. Specifically, we want to know whether recidivism is affected by the shift in responsibility from states to localities, potentially shorter supervision terms, and/or the increase in street time among former inmates.3 An answer to that question must take into account the changes in the composition of the released inmate population noted in the previous paragraph. We use statistical methods to adjust for these changes, allowing us to make apples-to-apples comparisons.
Our report begins by placing California in the national context, noting how realignment has all but ended the state’s practice of returning parolees to prison via the parole board. We then discuss the channels through which realignment may affect recidivism rates. Using CDCR data, we describe how recidivism patterns are changing after realignment. We finish with a series of analyses comparing pre- and post-realignment released offenders, adjusting for differences in the two populations and other factors.
3 The increased street time arises from sentencing changes and county incarceration patterns under realignment. These include split sentencing, with reduced incarceration periods because the sentence consists of a jail term followed by a period of probation, and reductions of maximum incarceration sentences for probation or parole violations from one year to six months. Split sentencing does not apply directly to our inmate sample because they are all released from state prison. In addition, released offenders are now eligible for discharge from supervision after six months compared with 13 months before realignment. Furthermore, counties now must bear the full cost of locally served incarceration for parole and probation violations, which is likely to reduce incarceration of post-realignment released prisoners. Findings consistent with these patterns are reported in Lofstrom and Raphael (2013a).
http://www.ppic.org/main/home.asp Is Public Safety Realignment Reducing Recidivism in California? 7

Realignment Has Dramatically Changed Reliance on Prisons
In the decade before realignment, recidivism rates among California’s released offenders were consistently among the highest in the nation (PEW Center on the States 2011). CDCR’s primary recidivism measure, the proportion of inmates released from CDCR who returned to prison within three years, did decline before realignment from 67.5 percent of released offenders in 2005–2006 to 61.0 percent of released offenders in 2008–2009 (CDCR 2014). Three-year arrest rates and reconviction were relatively flat, ranging between 75.3 and 77.2 percent and 47.7 and 51.5 percent, respectively.
Historically, several practices set the state apart from the rest of the nation. First, parole revocation rates for technical violations were strikingly high. Second, parole terms were relatively lengthy, increasing the proportion of released offenders at risk of revocation and return to prison. A recent Bureau of Justice Statistics (BJS) report using data from 42 states provides a national context. The BJS does not provide information on the probability that a given group of released inmates will return to prison. However, the BJS does track the size of the parole population and total prison admissions due to parole failure. Dividing parolee admissions over a year by the parole population at the beginning of the year provides a rough estimate of a parolee’s risk of going back to prison during the year. This calculation allows a comparison of California with other states in the pre-realignment period.
Figure 1 shows the number of released offenders who were returned to prison in 2010 divided by the parole population at the beginning of the year. During the pre-reform period, California’s 68 percent return ratio was the highest in the nation. North Dakota was a distant second at 43 percent. Strikingly, the average for all states except California was 15 percent.
http://www.ppic.org/main/home.asp Is Public Safety Realignment Reducing Recidivism in California? 8

FIGURE 1 Parolee returns to California state prisons stood out before realignment
SOURCE: U.S. Bureau of Justice Statistics (Glaze and Bonczar, 2013).
NOTE: The bars represent parolee admissions to prison in 2010 as a share of the parole population at the beginning of the year.
In the post-realignment period, the pattern is drastically different. Bureau of Justice Statistics state-level data are not yet available for 2012. However, we can glean from various sources how California’s return rate has changed. We estimate it fell from 68 percent during the pre-realignment period to 9 percent post-realignment.4 In other words, realignment has brought California more in line with the rest of the country in terms of returns to prison among released inmates.
Realignment has made it much harder to send released inmates back to state prison. Before realignment, a released offender arrested for a criminal or noncriminal parole violation had a hearing before the Board of Parole Hearings (BPH). These procedures generally resulted in an average return to prison of four months but sometimes as much as a year (Grattet, Petersilia, and Lin 2008). The BPH’s high return-to-custody rate reflected several factors. First, the BPH’s evidentiary standard, the preponderance of evidence, is much less stringent than the beyond-a-reasonable-doubt standard that applies in criminal court. Second, parolees were technically still under state supervision, which made parole revocation relatively straightforward and common. Third, from the viewpoint of local corrections, it was cheaper and easier to send a released inmate back to prison via parole revocation rather than a new criminal conviction. A study of the pre-realignment period revealed that authorities frequently used parole revocations rather than new criminal prosecutions to
4 The Bureau of Justice Statistics estimates that the combined parolee/PRCS population was 111,703 on January 1, 2012. CDCR reports that, during 2012, 8,030 active parolees returned to its custody. We assume this does not include returns to custody of those on PRCS for new felony convictions. Hence, we add to the total 7.2 percent of the average of the PRCS populations at the beginning of 2012 and end of 2012 (see Bonczar and Glaze 2013 for PRCS population estimates). The 7.2 percent is our estimate of the rate at which prisoners released in the first six months of 2012 returned to state custody. This adds 1,636 admissions, generating a total admissions estimate of 9,666. Dividing by 111,703 gives a return-to-custody rate of 0.09.
0
0.1
0.2
0.3
0.4
0.5
0.6
0.7
0.8
Cal
iforn
iaN
orth
Dak
ota
Col
orad
oIll
inoi
sU
tah
Ariz
ona
Min
neso
taM
assa
chus
etts
Flor
ida
Rho
de Is
land
Wes
t Virg
inia
Neb
rask
aSo
uth
Dak
ota
Kans
asKe
ntuc
kyM
onta
naId
aho
New
Yor
kIn
dian
aM
ichi
gan
Wis
cons
inVe
rmon
tM
aryl
and
Wyo
min
gH
awai
iAr
kans
asPe
nnsy
lvan
iaM
isso
uri
New
Jer
sey
Sout
h C
arol
ina
Ore
gon
Tenn
esse
eG
eorg
iaN
evad
aLo
uisi
ana
Nor
th C
arol
ina
Virg
inia
Texa
sAl
abam
aO
hio
Alas
kaO
klah
oma
Paro
lees
retu
rned
to c
usto
dy d
urin
g 20
10
divi
ded
by p
arol
e po
pula
tion
at b
egin
ning
of y
ear
http://www.ppic.org/main/home.asp Is Public Safety Realignment Reducing Recidivism in California? 9

return parolees arrested for technical parole violations and a wide range of felonies to prison. Revocations were even used for arrests involving very serious felonies (Grattet, Petersilia, and Lin 2008). This back-end sentencing through the BPH contributed greatly to California’s high parole failure rate (Travis 2007).
Realignment has upended this system. It is now nearly impossible for authorities to send released offenders back to prison for a technical parole violation (Petersilia and Greenlick Snyder 2013).5 Former inmates under PRCS or parolees with no history of serious or violent offenses may go to state prison only if they are convicted of new serious, violent, or sexual felonies. (Parolees with histories of serious or violent crimes may go back to prison if they are convicted of any new felony.) Instead, violators are sanctioned locally, which may include incarceration in county jails for short stays, sometimes referred to as flash incarcerations. The intent is to carry out these sanctions with certainty and swiftness. Local authorities may also revoke parole or impose various forms of graduated sanctions.
These changes may affect recidivism through a number of channels. On one hand, realignment gives county officials discretion to use a mix of sanctions and intervention to tailor programs locally. Counties may use realignment money to fund community-based alternatives, programs based on approaches that research shows reduce recidivism (evidence-based practices), and other initiatives. To the extent that these alternatives have been effective, recidivism rates may have declined. In addition, shorter supervision times and the prospect of early discharge may dissuade released offenders from committing crimes.
On the other hand, realignment has substantially reduced the number of released prisoners behind bars, increasing their presence in the community (Lofstrom and Raphael 2013a). This increased “street time” provides more opportunities to commit crimes, which in turn generates more arrests and convictions.6 Furthermore, locally supervised PRCS populations face a far different set of incentives than did inmates who left prison before realignment. For example, they face different sanctions for violating conditional release terms. These range from flash incarceration in county jail, to community service, mandatory treatment, electronic monitoring, or other county-imposed penalties. Recidivism may drop if released offenders perceive local sanctions as swift and certain (Hawken and Kleinman 2009). By contrast, recidivism might increase if local sanctions are perceived as less severe than in the past. Similarly, the lower probability of prison time under realignment could embolden some parolees to commit crimes (Lofstrom and Raphael 2013a).
Other aspects of realignment, however, may deter released inmates from committing felonies. PRCS offenders arrested for new felonies may now be more likely to face prosecution and conviction because the option to send them back to prison by revoking parole no longer exists. New felony convictions carry stiffer sentences than do technical parole violations. Moreover, county jail space is costly and limited, which may further increase the probability that re-offending will lead to prison time.
In the rest of the report, we examine whether changes in California’s recidivism rates are due to realignment. We compare data on arrests, convictions, and returns to state prison (known as return-to-custody or RTC) in the pre- and post-realignment periods to assess how realignment has affected recidivism among former state prisoners. Specifically, we analyze changes in the rates of arrest, multiple arrests, new criminal convictions, and returns to state prison within one year.
5 Released offenders who have served an indeterminate life sentence may still go back to prison for a parole violation (Petersilia and Greenlick Snyder 2013). 6 The increase in offender street time caused by realignment led to a slight increase in property crime in the first post-realignment year (Lofstrom and Raphael 2013b).
http://www.ppic.org/main/home.asp Is Public Safety Realignment Reducing Recidivism in California? 10
Measures of Recidivism and Methods for Gauging the Effect of Realignment
In this section, we describe in detail the data we use and our statistical methodology. The California Department of Corrections and Rehabilitation (CDCR) Office of Research provided us with individual administrative records for all inmates released from state prison between October 1, 2009, and June 30, 2012. In most respects, these are comparable with the data used in the CDCR reports on recidivism and realignment (2013a, 2013b). We requested release data going back further than the period analyzed by CDCR to allow us to construct a comparison group of inmates not affected by realignment.
The CDCR records include information on post-release arrests, criminal convictions, and returns to state prison due either to parole revocation or new conviction, referred to as a parole revocation with a new term. The data combine CDCR administrative records with information from automated individual criminal history files maintained by the California Department of Justice. We track each released inmate for one year following release. Within this year, we can observe arrests, the arrest charge, and conviction for a new crime. We also consider the probability that a released offender will be arrested or convicted multiple times. In addition, we determine whether released offenders go back to prison. However, we do not have information on local sanctions imposed for supervision violations, including time in county jail.
We divide released offenders into three groups that vary in the extent to which the one-year observation period following release coincided with realignment. State parole authorities supervised members of the first two groups. County probation personnel monitored the larger share of the third group, while state parole authorities supervised the rest.
The first group consists of inmates released between October 1, 2009, and September 30, 2010. Their one-year post-release observation period ended before implementation of realignment on October 1, 2011. Hence, observation of this group occurs entirely under the pre-realignment state parole supervision system.
The second group includes inmates released under state parole supervision between October 1, 2010, and September 30, 2011. Offenders who would have been eligible for PRCS, but were released in the year before October 1, 2011, spent part of the one-year observation period under the old parole system and part under the new system. Notable changes included a six-month discharge for parolees with no violations and incarceration in county jail rather than state prison for parole revocations. The degree to which this group was exposed to realignment varied. The earlier released inmates, for example those released from prison soon after October 2010, had relatively little exposure. The later released inmates, for example those released closer to October 2011, had more exposure. To illustrate, an inmate released in early July 2011 experienced three months under the old system and nine months under the new. Given the decline in returns to prison for parole revocation, prison admissions rates should have fallen even for inmates released as much as one year before realignment’s implementation.
The final group of inmates includes those released between October 1, 2011, and June 30, 2012, supervised either by state parole or county probation (PRCS). As these release dates follow the implementation of realignment, the full one-year observation period occurs under the new realignment structure for all members of this group. Of course, those released to PRCS arguably experienced the greatest practical changes in post-release supervision as they were monitored by county probation departments rather than state parole authorities. Our primary estimates of realignment’s effects on recidivism compare the first and third groups.
http://www.ppic.org/main/home.asp Is Public Safety Realignment Reducing Recidivism in California? 11

However, we also analyze what happened to inmates partially exposed to the reform. By contrast, the CDCR’s analysis compared released inmates in our second group with inmates in our third group.
It is important to note, again, that this study focuses solely on recidivism among released prison inmates. We do not analyze recidivism among nonviolent, nonsexual, non-serious offenders sentenced to local sanctions under section 1170(h) of the amended penal code.
Adjusting for changes in the composition of release groups
We examine recidivism before and after realignment to evaluate how released inmates are doing under the new rules, compared to how they fared under the old parole system. Based on the CDCR reports, the raw trends suggest that released offenders are doing well under realignment, that is, recidivism rates are generally lower. However, we must be cautious before concluding realignment has led to this improvement. First, as we have noted, for those released from prison in the twelve months before the beginning of realignment, part of their one-year follow-up extended into the post-realignment period. For those released just before October 1, 2011, nearly all the follow-up occurred after realignment. A more valuable assessment is to compare recidivism among a group of offenders not affected by realignment with recidivism in a group entirely exposed to the reform. The CDCR reports do not do this.
Second, the characteristics of inmates released from prison began to change quickly after the reform’s implementation. The parolee return-to-custody rate in the pre-realignment period was high. Parole revocations accounted for the great majority of state prison admissions. Often these inmates served very short prison terms. Consequently, in the pre-realignment period, a disproportionate number of prison releases consisted of inmates leaving prison after a short stay following parole revocation. These individuals, who cycled in and out of prison on very short spells, were sometimes called “frequent flyers.” 7
Figure 2 shows the proportion of inmates released in a given month who have been released after a parole revocation (that is to say, the proportion that are re-releases or “frequent flyers”) as well as the average time served for the most recent prison stay among those released.8 Vertical lines demarcate our three groups. Before October 2011, the proportion of inmates who were released following a parole revocation hovered between 43 and 45 percent. Nine months into the reform, this proportion dropped below 10 percent. The frequent flyers were no longer going back to prison. Meanwhile, in the pre-realignment period, the average time a released offender served was slightly more than 400 days. In the post-realignment period, it rose to more than 800 days. Recent research demonstrates that recidivism rates are lower for inmates who have served more time (Kuziemko 2013). Thus, the sharp drop in imprisonment for parole violations and longer prison stays would both tend to reduce recidivism rates independently of any effect of changes in post-release supervision practices.
7 The improved economy in California is another factor that may contribute to lower recidivism rates. 8 The declines in time served and percent of re-releases are direct consequences of realignment. Re-releases have been falling because parolees no longer return to custody for parole violations or for non-violent, non-serious new crimes. Nor can parolees or offenders released under PRCS be imprisoned while a revocation is pending and then returned to the community, as sometimes happened before realignment. Realignment limited the time these offenders could spend in custody. Subtracting them from the prison population would necessarily increase the average time served by those who were released.
http://www.ppic.org/main/home.asp Is Public Safety Realignment Reducing Recidivism in California? 12

FIGURE 2 Released inmates have served longer terms and are less likely to be released after a parole revocation
SOURCE: Authors’ calculations based on CDCR individual administrative data.
NOTE: The figure shows the share of re-releases (those released after a parole revocation) and average number of days in custody at release by monthly release cohort. These cohorts are defined by month of release relative to realignment. For example, realignment month 0 consists of all offenders released in October 2011, the first month of realignment.
The dramatic change in the composition of released inmates is even more striking when we examine in greater detail the amount of time served among those released. Figure 3 compares those released during two specific pre- and post-realignment periods: May through June 2010, with no exposure to realignment; and May through June 2012, with full exposure to realignment.9 The figure breaks down days served by percentile. For example, during the no-exposure-to-realignment period, at the 10th percentile, 10 percent of released offenders were in CDCR custody for 21 days or less and 90 percent for more than 21 days. In the full-exposure-to-realignment period, the 10th percentile level rose to 201 days. At the 25th percentile level, one quarter of released offenders served 83 days or less in prison before realignment compared with 285 days after realignment. The median time served by a released prisoner is the level at which half of all offenders served less time and half served more. In the pre-reform period, the median offender had served slightly longer than six months. After reform, the median rose to more than 14 months.
9 These are the most recent releases in our data.
0%
10%
20%
30%
40%
50%
60%
0
100
200
300
400
500
600
700
800
900
-24 -22 -20 -18 -16 -14 -12 -10 -8 -6 -4 -2 0 2 4 6 8
Shar
e of
re-r
elea
ses
Day
s in
cus
tody
Realignment month
Days in Custody
Re-Releases
No Realignment Exposure
Some Realignment Exposure
All Realignment Exposure
http://www.ppic.org/main/home.asp Is Public Safety Realignment Reducing Recidivism in California? 13

FIGURE 3 Prisons in California are no longer housing inmates for short stays
SOURCE: Authors’ calculations based on CDCR individual administrative data.
Comparisons of released prisoners before and after realignment clearly illustrate that the characteristics of offenders have changed in important ways. Released offenders are now substantially less likely to be frequent flyers. Furthermore, many newly convicted lower-level felons now serve time in county jail instead of state prison. That means that released prisoners are likely to have been convicted of different types of crimes under realignment than before the reform. Other factors also may affect the probability of recidivism. Any attempt to isolate the effects of realignment on recidivism must take into account these compositional changes.
Empirical Strategy
Analyzing the effects of realignment on recidivism requires several adjustments. First, we must separate pre-realignment and post-realignment groups. That means comparing released offenders for whom the one-year follow-up is entirely in the pre-realignment period with those for whom the follow-up is completely post-realignment. To make this clean comparison, we set aside our second group of released offenders, those let out between October 1, 2010, and September 30, 2011, whose one-year follow-up spans the pre-realignment and post-realignment periods.10 Rather than using the combination of the ”Some Realignment Exposure” and “All Realignment Exposure” groups as the pre-period comparison group (similar to what is done in the CDCR recidivism reports), our primary analysis compares the ”No Realignment Exposure” to the ”All Realignment Exposure” group. We do however include the “Some Realignment Exposure” group in our graphical analysis of statistically adjusted trends to illustrate some gradual changes that have occurred in recidivism outcomes.
Second, we need to account for changes in the characteristics of released prisoners in our assessment of whether recidivism rates have changed with realignment. Table 1 illustrates these changes. The table compares the average characteristics of a pre-realignment group of inmates released between October 1,
10 This is the “Some Realignment Exposure” group in Figure 2.
21 83
197
397
859
201 285
437
823
1,751
0
200
400
600
800
1,000
1,200
1,400
1,600
1,800
2,000
10th 25th 50th 75th 90th
Day
s in
CD
CR
cus
tody
at
tim
e of
rele
ase
Percentile of distribution of days in custody
May to June 2010 releases
May to June 2012 releases
http://www.ppic.org/main/home.asp Is Public Safety Realignment Reducing Recidivism in California? 14
2009, and June 30, 2010, with a post-realignment group released between October 1, 2011 and June 30, 2012.11 Table 1 shows differences between the pre- and post-realignment release cohorts in average age, race/ethnicity, criminal history, mental health status, and other variables. There is a large difference in the percentage who are re-releases (those released after being sent to prison on a parole revocation); 45.6 percent were re-releases in the earlier period compared with 26.5 percent in the later period. Another key difference lies in the average days in CDCR custody. This increased from 406.7 days in the pre-realignment period to 609.5 in the post-realignment period. As expected, fewer post-realignment inmates served time for property and drug crimes. In our empirical analysis, we statistically adjust for the differences in the pre-realignment and post-realignment cohorts shown in Table 1 using multivariate regression modeling. We present results with and without these statistical adjustments. This permits us to reproduce CDCR’s analysis and assess whether recent trends in unadjusted recidivism measures are in part due to the changing characteristics of those released from state prison. We provide a detailed discussion of our statistical methodology in the technical appendix.
11 To ensure seasonality is not affecting recidivism, we use two cohorts that cover the same nine months, October through June, of releases.
http://www.ppic.org/main/home.asp Is Public Safety Realignment Reducing Recidivism in California? 15
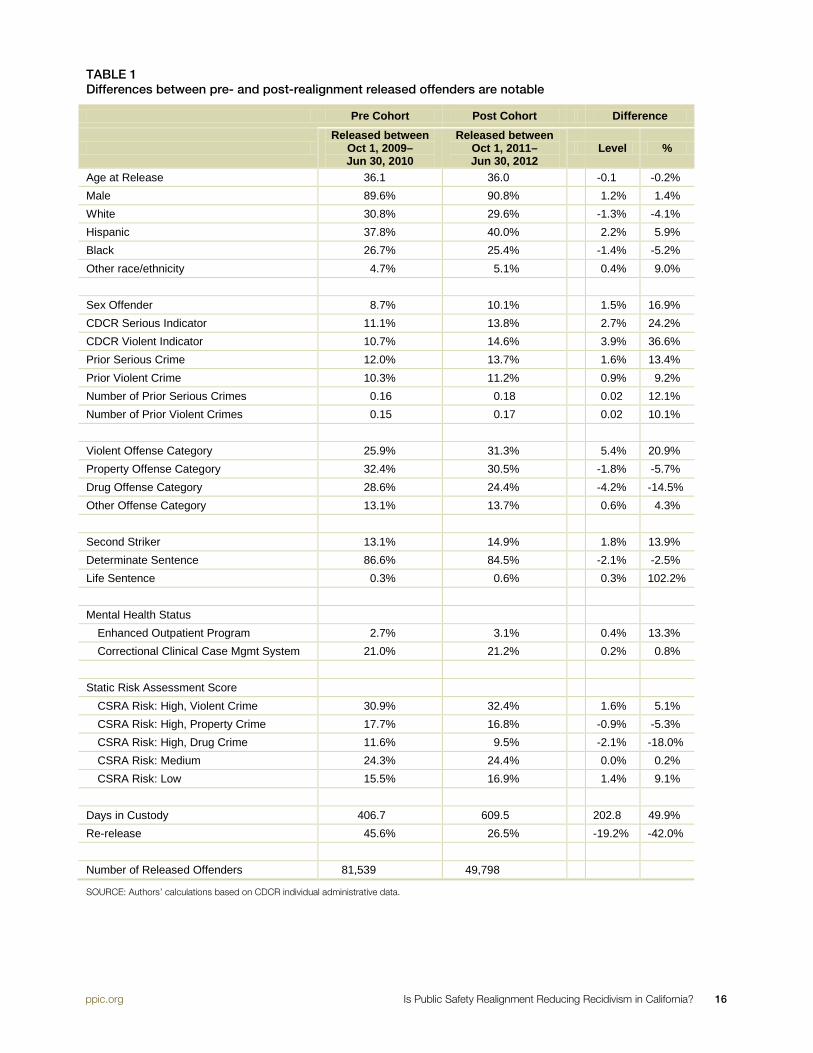
TABLE 1 Differences between pre- and post-realignment released offenders are notable
Pre Cohort Post Cohort Difference
Released between
Oct 1, 2009– Jun 30, 2010
Released between Oct 1, 2011– Jun 30, 2012
Level %
Age at Release 36.1 36.0 -0.1 -0.2% Male 89.6% 90.8% 1.2% 1.4% White 30.8% 29.6% -1.3% -4.1% Hispanic 37.8% 40.0% 2.2% 5.9% Black 26.7% 25.4% -1.4% -5.2% Other race/ethnicity 4.7% 5.1% 0.4% 9.0%
Sex Offender 8.7% 10.1% 1.5% 16.9% CDCR Serious Indicator 11.1% 13.8% 2.7% 24.2% CDCR Violent Indicator 10.7% 14.6% 3.9% 36.6% Prior Serious Crime 12.0% 13.7% 1.6% 13.4% Prior Violent Crime 10.3% 11.2% 0.9% 9.2% Number of Prior Serious Crimes 0.16 0.18 0.02 12.1% Number of Prior Violent Crimes 0.15 0.17 0.02 10.1%
Violent Offense Category 25.9% 31.3% 5.4% 20.9% Property Offense Category 32.4% 30.5% -1.8% -5.7% Drug Offense Category 28.6% 24.4% -4.2% -14.5% Other Offense Category 13.1% 13.7% 0.6% 4.3%
Second Striker 13.1% 14.9% 1.8% 13.9% Determinate Sentence 86.6% 84.5% -2.1% -2.5% Life Sentence 0.3% 0.6% 0.3% 102.2%
Mental Health Status
Enhanced Outpatient Program 2.7% 3.1% 0.4% 13.3% Correctional Clinical Case Mgmt System 21.0% 21.2% 0.2% 0.8%
Static Risk Assessment Score
CSRA Risk: High, Violent Crime 30.9% 32.4% 1.6% 5.1% CSRA Risk: High, Property Crime 17.7% 16.8% -0.9% -5.3% CSRA Risk: High, Drug Crime 11.6% 9.5% -2.1% -18.0% CSRA Risk: Medium 24.3% 24.4% 0.0% 0.2% CSRA Risk: Low 15.5% 16.9% 1.4% 9.1%
Days in Custody 406.7 609.5 202.8 49.9% Re-release 45.6% 26.5% -19.2% -42.0%
Number of Released Offenders 81,539 49,798
SOURCE: Authors’ calculations based on CDCR individual administrative data.
http://www.ppic.org/main/home.asp Is Public Safety Realignment Reducing Recidivism in California? 16
Changes in Offender Characteristics Affected Recidivism Rates
In this section, we present our findings in a series of charts. We depict trends in recidivism outcomes for released offenders by their month of release and present evidence on trends with and without statistically adjusting for changes in the characteristics of released offenders. We then formally estimate the effect of realignment on recidivism by comparing the pre-realignment and post-realignment cohorts.
Figure 4 shows unadjusted one-year arrest rates, conviction rates, and returns according to month of release for inmates leaving California prisons.12 The measurement period includes each of the 24 months preceding realignment’s implementation and the first nine months of the post-reform period. Months are measured along the horizontal axis. The value of October 2011 is set to zero and other months are measured relative this month of implementation.
We use two alternative definitions of arrests: arrest and arrest adjusted for return to custody (RTC). The first measures the proportion of released offenders arrested and officially booked at a California police station or jail, which generates a new record of arrest in an individual’s criminal history record maintained by the California Department of Justice. The second definition includes arrests made by parole officers. When a parole officer takes a detained parolee directly to a prison reception center, the arrest is not always recorded in the individual’s criminal history. Under realignment, state parole authorities supervise many fewer released offenders and RTCs are greatly restricted. Thus, these types of parolee arrests are increasingly rare and don’t occur at all for former prisoners released under PRCS.13 This point is important because a pre- and post-realignment comparison of arrests not adjusted for the RTC factor will understate pre-realignment arrests much more than post-realignment arrests.
Figure 4 reveals that one-year arrest rates declined among post-realignment released offenders. The arrest rate not adjusted for direct returns to custody rose leading up to the reform’s implementation. However, the adjusted arrest rate, including arrests made by law enforcement and parole officers, was relatively stable in the pre-reform period. As expected, the two series converged in the post-realignment period. Parole officers could no longer directly revoke most paroles. As a result, virtually all parolee arrests began to include an official booking.
12 We define each release cohort by the first prison release for all those released in a given month. It is possible, but extremely rare, to be released twice in a month. 13 CDCR recidivism reports also make this adjustment.
http://www.ppic.org/main/home.asp Is Public Safety Realignment Reducing Recidivism in California? 17
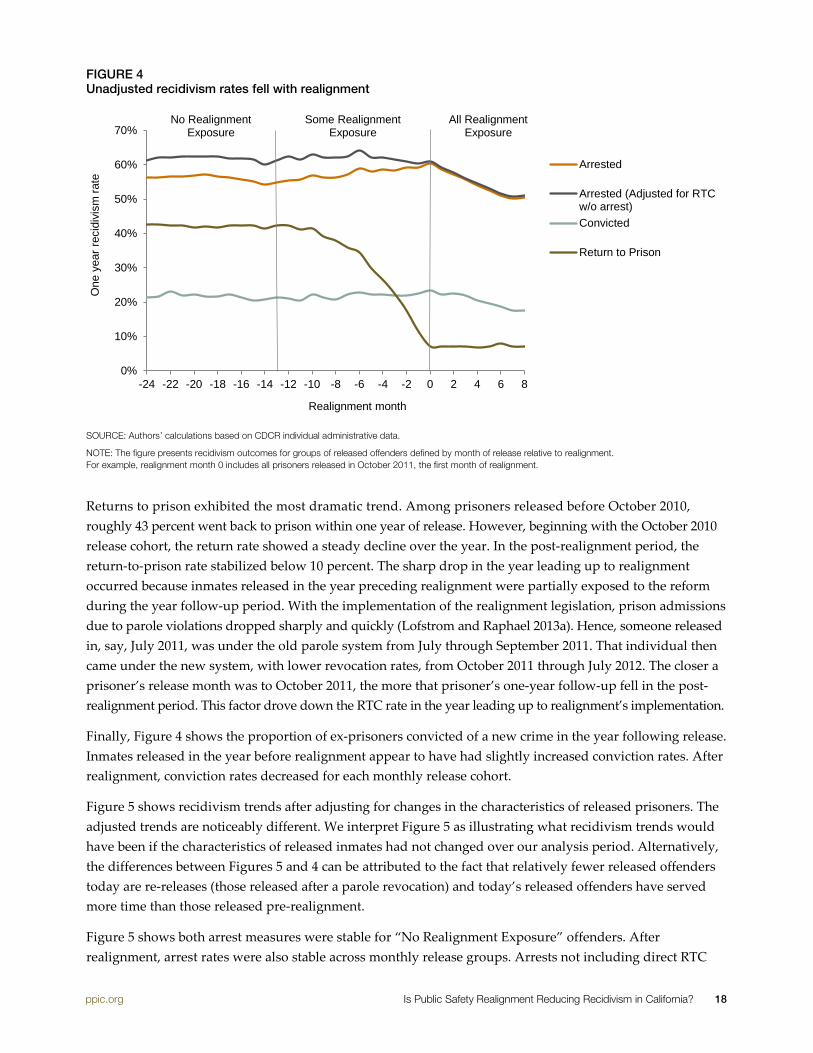
FIGURE 4 Unadjusted recidivism rates fell with realignment
SOURCE: Authors’ calculations based on CDCR individual administrative data.
NOTE: The figure presents recidivism outcomes for groups of released offenders defined by month of release relative to realignment. For example, realignment month 0 includes all prisoners released in October 2011, the first month of realignment.
Returns to prison exhibited the most dramatic trend. Among prisoners released before October 2010, roughly 43 percent went back to prison within one year of release. However, beginning with the October 2010 release cohort, the return rate showed a steady decline over the year. In the post-realignment period, the return-to-prison rate stabilized below 10 percent. The sharp drop in the year leading up to realignment occurred because inmates released in the year preceding realignment were partially exposed to the reform during the year follow-up period. With the implementation of the realignment legislation, prison admissions due to parole violations dropped sharply and quickly (Lofstrom and Raphael 2013a). Hence, someone released in, say, July 2011, was under the old parole system from July through September 2011. That individual then came under the new system, with lower revocation rates, from October 2011 through July 2012. The closer a prisoner’s release month was to October 2011, the more that prisoner’s one-year follow-up fell in the post-realignment period. This factor drove down the RTC rate in the year leading up to realignment’s implementation.
Finally, Figure 4 shows the proportion of ex-prisoners convicted of a new crime in the year following release. Inmates released in the year before realignment appear to have had slightly increased conviction rates. After realignment, conviction rates decreased for each monthly release cohort.
Figure 5 shows recidivism trends after adjusting for changes in the characteristics of released prisoners. The adjusted trends are noticeably different. We interpret Figure 5 as illustrating what recidivism trends would have been if the characteristics of released inmates had not changed over our analysis period. Alternatively, the differences between Figures 5 and 4 can be attributed to the fact that relatively fewer released offenders today are re-releases (those released after a parole revocation) and today’s released offenders have served more time than those released pre-realignment.
Figure 5 shows both arrest measures were stable for “No Realignment Exposure” offenders. After realignment, arrest rates were also stable across monthly release groups. Arrests not including direct RTC
0%
10%
20%
30%
40%
50%
60%
70%
-24 -22 -20 -18 -16 -14 -12 -10 -8 -6 -4 -2 0 2 4 6 8
One
yea
r rec
idiv
ism
rate
Realignment month
Arrested
Arrested (Adjusted for RTCw/o arrest)Convicted
Return to Prison
No Realignment Exposure
Some Realignment Exposure
All Realignment Exposure
http://www.ppic.org/main/home.asp Is Public Safety Realignment Reducing Recidivism in California? 18

increased slightly, while arrests including RTC fell a bit. After adjustment, the proportion of inmates returned to prison within a year still fell sharply. However, in the first few months of realignment, the statistically adjusted RTC rate rose from roughly 7 to 14 percent. Finally, when we adjust for released prisoner characteristics, the post-realignment decline in conviction rates evident in Figure 4 vanished and the rate increased slightly.
FIGURE 5 Recidivism trends are different after adjusting for released prisoner characteristics
SOURCE: Authors’ calculations based on CDCR individual administrative data.
NOTE: The figure presents statistically adjusted recidivism outcomes for groups of offenders defined by month of release relative to realignment. For example, realignment month 0 includes all prisoners released in October 2011, the first month of realignment.
Figure 6 shows average recidivism measures for pre-realignment and post-realignment groups with and without adjustment for changes in released offender characteristics. Thus, the figure presents our formal estimates of the effect of realignment on recidivism.
Without statistical adjustment, the probability of arrest within a year of release, not counting direct returns to custody, decreased slightly. With adjustment, the probability increased 2.6 percentage points, which is marginally statistically significant.14 However, when direct returns to custody are included, both the unadjusted and adjusted estimates showed statistically significant declines in one-year arrest rates. The decline in arrest rates adjusted for RTC is one of the principal findings of the CDCR analyses. We are able to reproduce the department’s results here using distinct pre- and post-realignment comparison groups.
14 See the formal analysis in Technical Appendix Tables A1 and A2 and the accompanying discussion for a more complete examination of the statistical significance of the estimates in this section.
0%
10%
20%
30%
40%
50%
60%
70%
-24 -22 -20 -18 -16 -14 -12 -10 -8 -6 -4 -2 0 2 4 6 8
One
yea
r rec
idiv
ism
rate
Realignment month
Arrested
Arrested (Adjusted for RTCw/o arrest)Convicted
Return to Prison
No Realignment Exposure
Some Realignment Exposure
All Realignment Exposure
http://www.ppic.org/main/home.asp Is Public Safety Realignment Reducing Recidivism in California? 19

FIGURE 6 Key recidivism trends declined after realignment after adjusting for released offender characteristics
SOURCE: Authors’ estimates based on CDCR individual-level administrative data.
NOTE: See Technical Appendix Tables A1 and A2 for formal estimation results with standard errors.
Without adjustment, we estimate a slight, statistically insignificant decline in new conviction rates. Adjusting for released prisoner characteristics, we estimate, on average, the “Full Realignment Exposure” group was 1.2 percentage points more likely than the “No Realignment Exposure” group to acquire a new conviction. As we will show shortly, this increase in the conviction rate for post-realignment offenders is likely driven in its entirety bv a notable increase in the likelihood of conviction among former inmates who are arrested following release. Finally, our unadjusted and adjusted measures show 35 and 33 percentage point drops in the probability of return to prison within a year. These are very large declines.
Figure 7 displays the unadjusted changes in arrest patterns in the months before and after realignment subdivided into supervision violations, felonies, and misdemeanors. For supervision violations, we show both standard arrest rates and return-to-custody rates, which allows us to account for the pre-realignment practice of returning parole violators to prison without recording an arrest. Before realignment, the difference between arrest and RTC rates ranged from about 4 to 6 percentage points. After realignment, the lines tracked each other in a registering a sharp 8-percentage-point drop before tacking up slightly among prisoners released in later months. The proportion of released offenders arrested for felonies rose slightly among those let out immediately after realignment. However, for groups released in subsequent months, the felony arrest rate fell. Misdemeanor arrest rates declined steadily after realignment. The tiny proportion of arrests for unknown causes increased slightly.
-1.1%
-6.1%
-0.9%
-35.4%
2.6%
-2.0%
1.2%
-33.1%
-40%
-35%
-30%
-25%
-20%
-15%
-10%
-5%
0%
5%
Arrested Arrested Adjustedfor RTC w/o arrest
Convicted Returned to prison
Estim
ated
diif
eren
ces
in re
cidi
vism
out
com
es,
pre-
and
pos
t-rea
lignm
ent
No statisitcal adjustmentStatistically adjusted
http://www.ppic.org/main/home.asp Is Public Safety Realignment Reducing Recidivism in California? 20

FIGURE 7 Returns to custody without arrest are disappearing
SOURCE: Authors’ calculations based on CDCR individual administrative data.
NOTE: The figure presents recidivism outcomes for groups of released offenders defined by month of release relative to realignment. For example, realignment month 0 includes all prisoners released in October 2011, the first month of realignment.
Figure 8 presents comparable arrest trends after statistically adjusting for changes in the characteristics of released prisoners. Misdemeanor arrests dropped by a statistically significant 1.2 percentage points. Supervision violation arrests dropped on average by 3.7 percentage points but increased for those released in the last months of the measurement period. Felony arrests averaged 2.1 percentage points higher in the post-realignment period but fell slightly among the later groups of released offenders.
FIGURE 8 Felony arrests are higher among post-realignment offenders
SOURCE: Authors’ calculations based on CDCR individual administrative data.
NOTE: The figure presents regression-adjusted recidivism outcomes for groups of released prisoners defined by month of release relative to realignment. For example, realignment month 0 includes all prisoners released in October 2011, the first month of realignment.
0%
5%
10%
15%
20%
25%
30%
-24 -22 -20 -18 -16 -14 -12 -10 -8 -6 -4 -2 0 2 4 6 8
One
yea
r arr
est r
ate
Realignment month
Supervision Violation/RTC
Supervision Violation
Felony
Misdemeanor
Unknown
No Realignment Exposure
Some Realignment Exposure
All Realignment Exposure
0%
5%
10%
15%
20%
25%
30%
-24 -22 -20 -18 -16 -14 -12 -10 -8 -6 -4 -2 0 2 4 6 8
One
yea
r arr
est r
ate
Realignment month
Supervision Violation/RTC
Supervision Violation
Felony
Misdemeanor
Unknown
No Realignment Exposure
Some Realignment Exposure
All Realignment Exposure
http://www.ppic.org/main/home.asp Is Public Safety Realignment Reducing Recidivism in California? 21

Figure 9 presents estimates of the proportion of each release cohort convicted of a new felony or a new misdemeanor within a year of release. The figure shows that the proportion of released offenders convicted of a felony in the first few months following realignment’s implementation rose slightly then declined. Post-realignment, the proportion convicted of a new misdemeanor fell almost uniformly.
FIGURE 9 Released offender misdemeanor conviction rate fell post-realignment
SOURCE: Authors’ calculations based on individual level administrative data provided by CDCR.
NOTE: The figure presents recidivism outcomes for groups of released offenders defined by month of release relative to realignment. For example, realignment month 0 is all offenders released in the month of October 2011, the first month of realignment.
Figure 10, controlling for changes in released offender characteristics, shows a modest, but more sustained increase in the felony conviction rate. With adjustment, post-realignment misdemeanor convictions declined modestly, but showed no statistically significant difference from the pre-realignment period.
FIGURE 10 Felony conviction rates rose after adjusting for released prisoner characteristics
SOURCE: Authors’ calculations based on individual CDCR administrative data.
NOTE: The figure presents regression adjusted recidivism outcomes for groups of offenders defined by month of release relative to realignment. For example, realignment month 0 is all offenders released in October 2011, the first month of realignment.
0%
2%
4%
6%
8%
10%
12%
14%
16%
-24 -22 -20 -18 -16 -14 -12 -10 -8 -6 -4 -2 0 2 4 6 8
One
yea
r con
vict
ion
rate
s
Realignment month
FelonyMisdemeanor
No Realignment Exposure
Some Realignment Exposure
All Realignment Exposure
0%
2%
4%
6%
8%
10%
12%
14%
16%
-24 -22 -20 -18 -16 -14 -12 -10 -8 -6 -4 -2 0 2 4 6 8
One
yea
r con
vict
ion
rate
Realignment month
Felony
Misdemeanor
No Realignment Exposure
Some Realignment Exposure
All Realignment Exposure
http://www.ppic.org/main/home.asp Is Public Safety Realignment Reducing Recidivism in California? 22

Figure 11 presents our formal estimates of the effects of realignment on felony and misdemeanor conviction rates with and without statistical adjustment. Unadjusted felony convictions declined slightly post-realignment. With adjustment, the likelihood of a felony conviction rose by roughly one percentage point under realignment. Unadjusted misdemeanor convictions edged down a statistically significant 0.9 percentage point. With adjustment, we estimate the misdemeanor conviction rate increased a slight but statistically significant 0.2 percentage point.
Hence, the increase in new convictions among released inmates is mostly driven by an increase in the likelihood of a felony conviction. Which mechanisms are leading to this increase in conviction rates? This question is especially important in light of our finding that the proportion of released offenders arrested within one year has declined. There are two broad possibilities. First, the greater amount street time associated with realignment may yield higher offending levels among those likely to be arrested. In this case, realignment would be directly contributing to higher crime rates. Alternatively, prosecutors may be choosing to prosecute cases that in the pre-realignment period would have been diverted (often by default) to the Board of Parole Hearings, resulting in higher conviction rates relative to what was observed in the past. We are able to partially explore this issue by assessing whether the likelihood of being convicted, given an arrest, has changed. To the extent that this probability increases, an arrest today is more likely to result in a new conviction relative to an arrest in the past, when an arrest could lead to prison incarceration through a parole revocation.
Figure 11 presents unadjusted and statistically adjusted estimates of the effects of realignment on this probability. With no adjustment, we observe an increase of 2.5 percentage points in conviction rates among those arrested within one year. Adjusting for the changes in the composition of released offenders increases this estimate to 3.1 percentage points. Both are statistically significant.
FIGURE 11 Statistically adjusted conviction rates are higher after realignment
SOURCE: Authors’ estimates based on CDCR individual administrative data.
NOTE: See Technical Appendix Tables A1 and A2 for formal estimation results with standard errors.
-0.02%
-0.9%
2.5%
1.0%
0.2%
3.1%
-1.5%
-1.0%
-0.5%
0.0%
0.5%
1.0%
1.5%
2.0%
2.5%
3.0%
3.5%
Felony conviction Misdemeanor conviction Convicted conditional onarrest
Estim
ated
diif
eren
ces
in re
cidi
vism
out
com
es,
pre-
and
pos
t-rea
lignm
ent
No statistical adjustment
Statistically adjusted
http://www.ppic.org/main/home.asp Is Public Safety Realignment Reducing Recidivism in California? 23

This change, likely reflecting a change in practice by prosecutors across the state, is of sufficient magnitude to fully explain the increase in conviction rates in our statistically adjusted models.15 Our estimates indicate that the probability of conviction given an arrest increase about 0.031 (that is, an increase of about 3.1 percentage points). Our analysis of arrest trends show that in the pre-realignment period the one-year arrest probability is roughly 0.6, that is 60 percent were arrested within one year. With an arrest probability of 0.6 and an increase in the likelihood of conviction conditional on arrest of 0.031, the change in the proportion convicted of a new crime due to a prosecutorial change alone would be about 1.9 percentage points (found by multiplying 0.6 x 0.031). As we observe an increase in conviction rates of 1.2 percentage points, the higher likelihood of a conviction among those arrested is of sufficient magnitude to explain the entirety of the increase in conviction rates.
Our final set of results assess changes in the proportion of released offenders who are arrested or convicted multiple times within the year after their release. As we have noted in our earlier work (Lofstrom and Raphael 2013), “street time” for offenders released from state prison has increased. As a result, offenders released after realignment who are motivated to commit crime have greater opportunity to do so and thus more opportunity for interaction with the criminal justice system—therefore, any given released offender may generate a greater number of formal arrests.
We have already shown that the likelihood of conviction conditional on arrest has increased. Increases in street time could drive up convictions just as it may have done for arrests. Also, given that realignment eliminated the parole board’s management of “frequent flyer” offenders, it would follow that prosecutors might increase their propensity to seek convictions in relation to those offenders.
Figure 12 presents, by month of release, the unadjusted proportion of inmates who are arrested and convicted multiple times during the year following their release from prison. The figure reveals that the proportion experiencing multiple arrests increased among pre-realignment releases as we approach October 2011, suggesting that as exposure to the post-realignment changes in parole revocations increased, the likelihood of multiple arrests also increased. However, in the post-realignment period this proportion declined each month.
15 To be specific, note that the conviction rate is equal to the number of individual convicted within one year divided by the population total for the specific release cohort. With a simple re-writing of this formula, one can show that the convictions rate is equal to the one-year arrest rate multiplied by the conviction rate among those arrested, or 𝐶𝑜𝑛𝑣𝑖𝑐𝑡𝑖𝑜𝑛 𝑅𝑎𝑡𝑒 = 𝑐𝑜𝑛𝑣𝑖𝑐𝑡𝑖𝑜𝑛𝑠
𝑝𝑜𝑝𝑢𝑙𝑎𝑡𝑖𝑜𝑛= 𝑎𝑟𝑟𝑒𝑠𝑡𝑠
𝑝𝑜𝑝𝑢𝑙𝑎𝑡𝑖𝑜𝑛. 𝑐𝑜𝑛𝑣𝑖𝑐𝑡𝑖𝑜𝑛𝑠
𝑎𝑟𝑟𝑒𝑠𝑡𝑠.
http://www.ppic.org/main/home.asp Is Public Safety Realignment Reducing Recidivism in California? 24

FIGURE 12 Multiple arrests vary noticeably across release cohorts
SOURCE: Authors’ calculations based on CDCR individual administrative data.
NOTE: The figure presents recidivism outcomes for groups of released offenders defined by month of release relative to realignment. For example, realignment month 0 is all offenders released in October 2011, the first month of realignment.
Figure 13 presents the comparable trends after statistically adjusting for the changing composition of released offenders. The statistically adjusted trends clearly show that post-realignment, released offenders are substantially more likely to experience multiple arrests within one year of release. Comparing Figures 12 and 13, it becomes clear that the post-realignment decline in multiple arrests is driven by the changing characteristics of who is released (in particular, there are fewer offenders released after a parole revocation in the post-realignment months). The proportion of released offenders convicted multiple times over the course of one year is very low in both figures (below 5 percent) and relatively stable through the policy changes.
0%
5%
10%
15%
20%
25%
30%
35%
40%
45%
50%
-24 -22 -20 -18 -16 -14 -12 -10 -8 -6 -4 -2 0 2 4 6 8
One
yea
r mul
tiple
arr
est
and
conv
ictio
n ra
tes
Realignment month
Multiple Arrests
Multiple Convictions
No Realignment Exposure
Some Realignment Exposure
All Realignment Exposure
http://www.ppic.org/main/home.asp Is Public Safety Realignment Reducing Recidivism in California? 25

FIGURE 13 Post-realignment released offenders are more likely to be arrested multiple times
SOURCE: Authors’ calculations based on CDCR individual administrative data.
NOTE: The figure presents regression adjusted recidivism outcomes for groups of released offenders defined by month of release relative to realignment. For example, realignment month 0 is all offenders released in October 2011, the first month of realignment.
Figure 14 presents our formal estimates of realignment’s effects on multiple arrests and convictions. Without adjustment, the proportion of released offenders with multiple arrests increased approximately 4.1 percentage points and, with adjustment, about 7.4 percentage points. Both estimates are highly statistically significant. The unadjusted data show a small and statistically insignificant increase in the proportion of offenders with multiple convictions. With adjustment, we estimate a slightly larger, statistically significant increase of about 0.4 percentage points.
FIGURE 14 The increase in multiple arrest is especially noticeable
SOURCE: Authors’ estimates based on CDCR individual administrative data.
NOTE: See Technical Appendix Tables A1 and A2 for formal estimation results with standard errors.
0%
5%
10%
15%
20%
25%
30%
35%
40%
-24 -22 -20 -18 -16 -14 -12 -10 -8 -6 -4 -2 0 2 4 6 8
One
yea
r rec
idiv
ism
rate
Realignment month
Multiple Arrests
Multiple Convictions
No Realignment Exposure
Some Realignment Exposure
All Realignment Exposure
4.1%
0.1%
7.4%
0.4%
0%
1%
2%
3%
4%
5%
6%
7%
8%
Multiple arrests Multiple convictions
Est
imat
ed d
iifer
ence
s in
reci
divi
sm o
utco
mes
, pr
e- a
nd p
ost-r
ealig
nmen
t
No statistical adjustment
Statistically adjusted
http://www.ppic.org/main/home.asp Is Public Safety Realignment Reducing Recidivism in California? 26

Conclusions
Prior to the implementation of California’s 2011 public safety realignment, the state’s prison system had one of the nation’s highest recidivism rates. A major goal of the reform was to slow the flow of offenders returning to prison, which had significantly contributed to overcrowding in the state’s expensive prison system. Realignment stopped the practice of returning released offenders to prison for parole violations—instead, these offenders are now sanctioned in the counties. The law also stressed county use of evidence-based practices to discourage return to crime.
These and other changes have transformed the landscape for released offenders. Periods of post-release supervision are often shorter and released offenders are considerably less likely to be re-incarcerated for technical parole violations. While released offenders are perhaps more likely to experience incarceration spells in local jails, these spells are designed by law to be shorter than typical prison spells for revocation in the pre-realignment period. Moreover, in many counties jail incarceration is likely limited by capacity constraints.
Realignment’s success depends largely on efforts addressing recidivism among former prison inmates and other convicted offenders diverted from prison as a result of the reform. This report has examined how realignment has affected recidivism patterns, as measured by arrests, convictions, and returns to state prison. We have stressed the importance of accounting for changes in the released offender population and also noted recidivism patterns that may stem primarily from prosecutorial changes.
Our key findings include:
The rate at which released inmates are being returned to state custody has declined sharply. In a relatively short period, California has gone from having the highest return-to-custody rate in the nation to having a rate that is below the national average. However, after dropping dramatically, returns to custody have begun to increase.
The proportion of released offenders arrested within a year has declined slightly. However, the proportion arrested multiple times has increased about 7 percentage points. Higher multiple arrest rates indicate that realignment has placed greater responsibility on local law enforcement and community corrections. It also may signal limited jail capacity, which has led to a substantial increase in released prisoner street time (Lofstrom and Raphael 2013).
Post-realignment conviction rates have increased roughly 1.2 percentage points, nearly all of which reflect higher felony conviction rates. We also find an increased conviction rate of arrested released offenders. Together, the increases in felony convictions and the rate at which arrests result in convictions suggest that prosecutors are successfully prosecuting offenders for offenses that in the past would have been processed administratively through the Board of Parole Hearings.
The proportion of released prisoners with multiple convictions has increased slightly by about 0.4 percentage points.
The slight declines in arrest rates and modest increase in conviction rates suggest that released inmates are generally not offending at a higher rate in the post-realignment period, but that when they do offend they are more likely to be formally prosecuted. The increase in multiple arrests may stem from increased street time, which provides released offenders more opportunity to commit crime if they are inclined to do so. It is also possible that this increase reflects the enhanced role of local authorities in monitoring and enforcing compliance with an offender’s conditions of release from prison. In either case, the increase in the proportion
http://www.ppic.org/main/home.asp Is Public Safety Realignment Reducing Recidivism in California? 27

of released offenders with multiple arrests comes with considerable cost savings from reduced use of the most expensive resource in the state criminal just system—the prison. Still, we need to understand better the underlying causes of higher multiple arrest rates. We also need to make additional efforts to control re-offending among those offenders who remain criminally active. These efforts may include further targeted sanctions, which will probably require resources to address aging facilities and jail capacity in a number of counties (Martin and Lofstrom 2014).
Our results suggest that parole violations involving actual new offenses are increasingly being processed through the courts as formal felony charges and convictions, rather than as technical violations through the Board of Parole Hearings. These patterns are consistent with the idea that realignment is encouraging prosecutors to bring formal charges for new offenses rather than relying on “back-door” sentencing. Offenders sentenced to prison for new crimes probably face longer terms than those imposed for parole violations. However, other factors may be at work. For example, consider up-charging—prosecution for prison-eligible crimes, which shifts incarceration responsibility back to the state. Up-charging is not aimed at improving public safety, but rather at avoiding costs. One avenue for future research is to understand prosecutorial responses to realignment. Both up-charging and increased prosecution of supervision violators may be contributing to the recent increase in returns to state prison.
In all, these findings suggest that realignment has made substantial progress toward one of its main goals—reducing the use of prison for sanctioning parole violations and minor criminal offenses. Arrests and convictions have not increased dramatically under realignment. County efforts appear to be at least partially offsetting the effects of increased street time among released offenders. These findings are consistent with a previous PPIC report that found no convincing evidence that realignment had affected reported violent crime and had only a limited effect on reported property crime (Lofstrom and Raphael 2013b). However, among inmates released from state prison during realignment’s first year, arrest and conviction rates remain high. This finding suggests the need for even more effective, targeted crime-deterring policies and for improvements in connecting former inmates to appropriate programming and rehabilitative services. These efforts are necessary to reducing recidivism and relieving pressures on state prisons and county jails—which will ultimately allow California to reach its federally mandated prison population threshold.
http://www.ppic.org/main/home.asp Is Public Safety Realignment Reducing Recidivism in California? 28

http://www.ppic.org/main/home.asp Is Public Safety Realignment Reducing Recidivism in California? 29
References
Bonczar, Thomas P. and Lauren E. Glaze. 2013. Adults On Parole, Federal And State‐By‐State, 1975–2012. Bureau of Justice Statistics.
California Department of Corrections and Rehabilitation. 2013a. Realignment Report A One‐year Examination of Offenders Released from State Prison in the First Six Months of Public Safety Realignment. May 2013. Available at www.cdcr.ca.gov/realignment/docs/Realignment%206%20Month%20Report%20Final_5%2016%2013%20v1.pdf.
California Department of Corrections and Rehabilitation. 2013b. An Examination of Offenders Released from State Prison in the First Year of Public Safety Realignment. December 2013. Available at www.cdcr.ca.gov/Adult_Research_Branch/Research_Documents/Realignment_1_Year_Report_12‐23‐13.pdf.
California Department of Corrections and Rehabilitation. 2014. 2013 Outcome Evaluation Report. January 2014. Available at www.cdcr.ca.gov/Adult_Research_Branch/Research_Documents/Outcome_Evaluation_Report_2013.pdf.
Fischer, Ryan. 2005. “Are California’s Recidivism Rates Really the Highest in the Nation? It Depends on What Measure of Recidivism You Use.” the Bulletin 1(1). UC Irvine Center for Evidence‐based Corrections. 1–4. Available at ucicorrections.seweb.uci.edu/files/2013/06/bulletin_2005_vol‐1_is‐1.pdf.
Grattet, Ryken and Joseph Hayes. 2013. “California’s Changing Parole Population.” Just the Facts (August). Public Policy Institute of California. Available at www.ppic.org/main/publication_show.asp?i=1066.
Grattet, Ryken and Joseph Hayes. 2013. “California’s Changing Prison Population.” Just the Facts (June). Public Policy Institute of California. Available at www.ppic.org/main/publication_show.asp?i=702.
Grattet, Ryken, Joan Petersilia, and Jeffrey Lin. 2008. Parole Violations and Revocations in California. Final Report to the National Institute of Justice. Available at https://www.ncjrs.gov/pdffiles1/nij/grants/224521.pdf.
Kuziemko, Ilyana. 2013. “How Should Inmates Be Released from Prison? An Assessment of Parole Versus Fixed‐Sentence Regimes.” Quarterly Journal of Economics 128 (1): 371‐424. Available at http://qje.oxfordjournals.org/content/128/1/371.
Little Hoover Commission. 2007. Solving California’s Corrections Crisis: Time is Running Out. Report to the Governor of California and the State Legislature. Available at www.lhc.ca.gov/lhc/185/Report185.pdf.
Lofstrom, Magnus and Steven Raphael. 2013a. Impact of Realignment on County Jail Populations. Public Policy Institute of California. Available at www.ppic.org/main/publication.asp?i=1063.
Lofstrom, Magnus and Steven Raphael. 2013b. Public Safety Realignment and Crime Rates in California. Public Policy Institute of California. Available at www.ppic.org/main/publication.asp?i=1075.
Martin, Brandon and Magnus Lofstrom. 2014. Key Factors in California’s Jail Construction Needs. Public Policy Institute of California. Available at www.ppic.org/main/publication_quick.asp?i=1098.
Petersilia, Joan and Jessica Greenlick Snyder. 2013. “Looking Past the Hype: 10 Questions Everyone Should Ask About California’s Prison Realignment.” California Journal of Politics and Policy 5(2): 266–306. Available at http://papers.ssrn.com/sol3/papers.cfm?abstract_id=2254110.
Pew Center on the States. 2011. State of Recidivism: The Revolving Door of America’s Prisons (Washington, DC: The Pew Charitable Trusts, April). Available at www.pewtrusts.org/en/research‐and‐analysis/reports/2011/04/12/state‐of‐recidivism‐the‐revolving‐door‐of‐americas‐prisons.
Travis, Jeremy. 2007. “Back‐End Sentencing: A Practice in Search of a Rationale.” Social Research 74(2):631‐644. Available at www.jstor.org/discover/10.2307/40971948?uid=3739560&uid=2&uid=4&uid=3739256&sid=21104379525093.

About the Authors
Magnus Lofstrom is a research fellow at PPIC. He also holds appointments as research fellow at the Institute for the Study of Labor (IZA) in Bonn, Germany; community scholar at the Julian Samora Research Institute at Michigan State University; and research associate at the Center for Comparative Immigration Studies at the University of California, San Diego. He is a member of the California State Controller’s Council of Economic Advisors and serves on the editorial board of Industrial Relations. His research focuses on public safety, immigration, entrepreneurship, and education. He has been widely published in academic journals and books and has been funded by the Russell Sage, Kauffman, and Smith Richardson Foundations. Prior to joining PPIC, he was an assistant professor of economics at the University of Texas, Dallas. He received his Ph.D. in economics from the University of California, San Diego.
Steven Raphael is professor of Public Policy at the Goldman School of Public Policy at the University of California, Berkeley. He is the author of the recently published book Why Are So Many Americans in Prison? His research focuses on the economics of low-wage labor markets, housing, and the economics of crime and corrections. His most recent research focuses on the social consequences of the large increases in U.S. incarceration rates. His research interests also include immigration policy, racial inequality, the economics of labor unions, social insurance policies, homelessness, and low-income housing. He is the editor in chief of Industrial Relations and a research fellow at the University of Michigan National Poverty Center, the University of Chicago Crime Lab, and the Institute for the Study of Labor (IZA) in Bonn, Germany. He holds a Ph.D. in economics from the University of California, Berkeley.
Ryken Grattet is a research fellow at PPIC and a professor of sociology at the University of California, Davis. He previously served as assistant secretary of research in the California Department of Corrections and Rehabilitation. His current work focuses on California correctional policy at the state and local levels. He is the author of Making Hate a Crime: From Social Movement to Law Enforcement (with Valerie Jenness), Parole Violations and Revocations in California (with Joan Petersilia and Jeffrey Lin), and numerous articles in professional and policy publications. His scholarship and public service contributions have been honored by the American Sociological Association’s Section on the Sociology of Law, the Law and Society Association, the Pacific Sociological Association, the Society for the Study of Social Problems Crime and Delinquency Section, as well as the UC Davis Distinguished Scholarly Public Service Award and the College of Letter’s and Sciences Dean’s Innovation Award.
Acknowledgments
This report has benefited significantly from comments and suggestions by Laurel Beck, Mia Bird, Lee Seale, Susan Turner, and Lynette Ubois. We also would like to thank Denise Allen, Jay Atkinson, Brenda Grealish, Jacqui Coder, and Loran Sheley of the California Department of Corrections and Rehabilitation for timely and insightful assistance with data used in this study. Any errors are our own.
http://www.ppic.org/main/home.asp Is Public Safety Realignment Reducing Recidivism in California? 30

PUBLIC POLICY INSTITUTE OF CALIFORNIA
Board of Directors
Donna Lucas, Chair Chief Executive Officer Lucas Public Affairs
Mark Baldassare President and CEO Public Policy Institute of California
Ruben Barrales President and CEO GROW Elect
María Blanco Vice President, Civic Engagement California Community Foundation
Brigitte Bren Attorney
Walter B. Hewlett Member, Board of Directors The William and Flora Hewlett Foundation
Phil Isenberg Vice Chair Delta Stewardship Council
Mas Masumoto Author and Farmer
Steven A. Merksamer Senior Partner Nielsen, Merksamer, Parrinello, Gross & Leoni, LLP
Kim Polese Chairman ClearStreet, Inc.
Thomas C. Sutton Retired Chairman and CEO Pacific Life Insurance Company

The Public Policy Institute of California is dedicated to informing and improving public policy in California through independent, objective, nonpartisan research on major economic, social, and political issues. The institute’s goal is to raise public awareness and to give elected representatives and other decisionmakers a more informed basis for developing policies and programs.
The institute’s research focuses on the underlying forces shaping California’s future, cutting across a wide range of public policy concerns, including economic development, education, environment and resources, governance, population, public finance, and social and health policy.
PPIC is a public charity. It does not take or support positions on any ballot measures or on any local, state, or federal legislation, nor does it endorse, support, or oppose any political parties or candidates for public office. PPIC was established in 1994 with an endowment from William R. Hewlett.
Mark Baldassare is President and Chief Executive Officer of PPIC. Donna Lucas is Chair of the Board of Directors.
Short sections of text, not to exceed three paragraphs, may be quoted without written permission provided that full attribution is given to the source.
Research publications reflect the views of the authors and do not necessarily reflect the views of the staff, officers, or Board of Directors of the Public Policy Institute of California.
Copyright © 2014 Public Policy Institute of California All rights reserved. San Francisco, CA
PUBLIC POLICY INSTITUTE OF CALIFORNIA 500 Washington Street, Suite 600 San Francisco, California 94111 phone: 415.291.4400 fax: 415.291.4401 www.ppic.org
PPIC SACRAMENTO CENTER Senator Office Building 1121 L Street, Suite 801 Sacramento, California 95814 phone: 916.440.1120 fax: 916.440.1121