is operational control risk informative of financial ... · is operational control risk informative...
TRANSCRIPT
Is Operational Control Risk Informative of Financial Reporting Risk?
Alastair Lawrence Haas School of Business
University of California at Berkeley [email protected]
Miguel Minutti-Meza University of Miami
School of Business Administration [email protected]
Dushyantkumar Vyas
Dept. of Management (UTM) & Rotman School of Management University of Toronto
May 2014
ABSTRACT: This study provides evidence concerning the significance of assessing operational control risks as part of an integrative evaluation of internal controls. The current SOX regulatory framework in the U.S. requires assessments of the adequacy of financial reporting controls; however, assessments of operational controls are not mandated. In this study, we examine the implications of the current limited regulatory focus on controls over financial reporting from an investor perspective. We document two principal findings. First, using computer data breaches and an index-based risk measure to indicate operational control risk, we document a positive leading relation between operational control risk and near future financial reporting quality problems, inferred via restatements and SEC comment letters. Second, using audit fees as a proxy for audit risk, we find evidence that auditors already appear to incorporate operational risk in assessing audit risk. Collectively, we interpret our findings as suggesting that public assessments of operational control risks could inform investors in assessing financial reporting risk, and that requiring such assessments are not likely to be incrementally onerous. KEYWORDS: Operational controls; financial reporting quality; audit fees; data breaches. DATA AVAILABILITY: Breach data are available subject to the approval of the Identity Theft Resource Center. All other data are publicly available from the sources identified in the article. We have benefited from the comments of Dirk Black, Gus De Franco, Ole-Kristian Hope, Clive Lennox, Linda Myers, Steven Salterio, Wally Smieliauskas, Kevin Veenstra, Taylor Wiesen, Kun Yu, and workshop participants at the 2010 Midyear Meeting of the American Accounting Association Auditing Section (San Diego), the 2010 London Business School Transatlantic Doctoral Conference, and the 2010 Annual Meeting of the American Accounting Association (San Francisco). We thank the Identity Theft Resource Center for providing the breach data and Heather Li for the assistance with the textual analysis. A previous version of this paper was titled “The Implications of Operational Control Risk for Audit Risk and SOX-Mandated Internal Control Assessments.”

1
I. INTRODUCTION
This study provides evidence concerning the significance of assessing operational control
risks as part of an integrative evaluation of internal controls. Operational control risks have been
overshadowed in the past decade as many firms have focused on strengthening financial
reporting controls as defined in Section 404 of the Sarbanes–Oxley Act of 2002 (SOX). Our
study documents two main findings. First, we use publicly disclosed computer data breaches
(often also referred to as cyber breaches or privacy breaches) and an index-based measure from
firm’s 10-K forms to proxy for operational control risk, and find that operational control risks are
associated with near future manifestations of weaknesses in financial reporting quality such as
restatements and receipt of comment letters from the Securities Exchange Commission (SEC).1
In other words, investors could potentially use weaknesses in operational controls as precursors
to financial reporting problems (i.e. indicators of financial reporting risk). Second, we infer by
examining audit fees that auditors seem to incorporate operational control risk in their audit risk
assessments. Our findings suggest that such assessments are already built into extant procedures,
and accordingly, are not likely to be incrementally onerous. However, despite the apparent
usefulness to investors, under the current SOX regulatory framework operational control risk is
not directly translated into public control risk assessments.
A comprehensive view of internal control includes controls over operations, financial
reporting, and regulatory compliance. For example, the Committee of Sponsoring Organizations
of the Treadway Commission (COSO 2013) recognizes that controls over operations are part of a
comprehensive view of internal controls. COSO defines internal control as:
1 Data breaches are generally defined as the intentional or unintentional release of secure information to an untrusted environment.

2
a process, effected by an entity’s board of directors, management, and other personnel, designed to provide reasonable assurance regarding the achievement of objectives relating to operations, reporting, and compliance.
The COSO framework (COSO 1992), originally published in 1992 and updated in 2013 (COSO
2013), is the most widely used standard for assessing the effectiveness of internal control in the
U.S. The Securities and Exchange Commission (SEC) initially used the COSO framework as
guidance that companies could use for compliance with SOX (Compliance Week 2012).
Following the implementation of SOX the public focus on internal control has been
primarily limited to financial reporting risks rather than operating and regulatory risks. The lack
of external attention to controls over operations and regulatory compliance has been a concern
among professionals and senior executives. Businesses could be susceptible to material control
risks despite having a clean assessment of internal controls over financial reporting (e.g., Ernst &
Young 2006). The narrow focus on financial reporting controls in recent years motivated COSO
to issue a revised version of its framework. In an interview relating to the revised control
framework (Tysiac 2012), the COSO Chairman David Landsittel explained that:
“some people because of the implementation of our framework under SOX 404 and SOX think of it as a financial reporting framework that really relates to published financial statements. But it’s broader than that. We want to have the reader recognize more vividly the relevance and opportunities to adopt the framework as it relates to operations and compliance.”
This study focuses on the relation between operational control risk and financial reporting
risk. Operational risk can be broadly defined as “the risk of loss resulting from inadequate or
failed internal processes, people and systems or from external events (BIS 2003)”. Operational
risk can include fraud, security, privacy protection, legal risks, physical (e.g. infrastructure
shutdown), and environmental risk. In general, sound strategies to mitigate operational risks are
related to good management; however, as long as people, systems, and processes remain

3
imperfect, operational risk cannot be fully eliminated (Credit Suisse Group 2003). Operational
risks impact client satisfaction, reputation and shareholder value, all while increasing overall
business risk. Moreover, many underlying control platforms, such as system software, firm-level
controls, and access controls, usually support entity-wide control activities (e.g., IFAC 2010).
Higher levels of operational control risk caused by the underlying systems and procedures may
also indicate higher levels of financial reporting and regulatory compliance control risks.
We posit that weaknesses in internal controls are positively related to subsequently
revealed weaknesses in financial reporting quality (i.e., restatements and SEC comment letters
indicate financial reporting quality problems, which in turn increase financial reporting risk). We
hypothesize a link between operational control risks and financial reporting risk for two reasons.
First, operating and financial reporting activities rely on shared controls; therefore, weaknesses
in the underlying systems and procedures would likely affect both financial reporting and
operating activities. Second, weaknesses in one control area may reflect management’s
commitment to building a strong internal control environment as its attitude towards controls has
pervasive effects on the actual control procedures throughout the organization (e.g., COSO
2009). In addition, we examine whether auditors’ risk assessments, as reflected in audit fees, are
associated with operational control risk.
Among several types of operational risks, computer data breaches have become pervasive
and increasingly onerous. For instance, TJX Companies’ data breach of 45.7 million credit and
debit card numbers in 2007 and the recent credit and debit card data breach of more than 110
million customers at Target have resulted in material losses to investors and may have been
prevented with stronger operational controls. Reflecting the immense potential financial fallouts
of such events, Target’s stock price fell approximately 10 percent in the two months following
4
the breach disclosure, it announced the resignation of its Chief Information Officer, and equity
analysts have cited privacy-breach related costs as the main reason for downgrading Target’s
shares in 2014.2 Further reflecting the economic importance of Target’s data breach, recent
media reports suggest that it might have been a contributory factor in the recent resignation of
Target’s Chief Executive Officer.
Computer data breaches have become so prevalent in the past few years that on October
13, 2011 the SEC issued specific guidance—CF Disclosure Guidance: Topic No. 2:
Cybersecurity—mandating that cyber breaches be disclosed in Management’s Discussion and
Analysis (MD&A) of the financial statements (SEC 2011). The guidance requires that firms now
disclose material data breaches including a description of the property that was stolen, the likely
financial effects, and the resulting future revenue and cost projections, if material. A review by
BDO United States of the Form 10-Ks of the 100 largest publicly-traded U.S. technology
companies released in 2012 revealed that “71% listed technology security or data breaches as
risk factors this year, up from 57% last year and 44% who did so in 2010” (WSJ 2012).
In this study we use data breach incidences that are publicly disclosed and an operational
control risk index created through textual analysis of Form 10-Ks as our proxies for operational
control risk. Data breaches are actual realizations of operational control risk and accordingly, we
consider incidences of data breaches (cybersecurity attacks) to be strong ex post indicators of a
2 A report by the U.S. General Accountability Office (GAO 2007) highlights that “available evidence indicates that data breaches occur frequently and under varying circumstances”. The GAO report uses data from Privacy Rights Clearinghouse, Identity Theft Resource Center, and Attrition and notes “our analysis of the three lists of data breaches maintained by these organizations indicated that at least 572 breaches were reported in the news media from January 2005 through December 2006. These breaches were reported to have affected more than 80 million records (GAO 2007, p. 11).” A second GAO report examining data breaches by U.S. federal agencies, including the SEC, finds that “despite steps taken to protect personal identifiable information (PII) at federal agencies, breaches continue to occur on a regular basis. During fiscal year 2012, federal agencies reported a record number of data breaches to the U.S. Computer Emergency Readiness Team. Specifically, 22,156 incidents involving PII were reported—a substantial increase over the 15,584 incidents reported in fiscal year 2011 (GAO 2013, p. 2).”

5
firm’s operational control risk. The index measure is based on a framework developed by
Deloitte Consulting for assessing operational risk (Deloitte 2011). We construct our index to
pertain directly to operational control risk using information contained in Form 10-Ks.3
Our empirical findings support the preceding discussion regarding the importance of
operational control risks. Specifically, we document a significant positive leading relation
between operational control risk and financial reporting risk. For example, using our data breach
proxy, we find that firms with high operational risk are 1.39 times more likely to have an
accounting restatement, and 1.46 times more likely to receive a SEC comment letter in the near
future. Moreover, we find that both audit fees and auditor switches are increasing in operational
control risks, suggesting that auditors increase their assessments of audit risk in the presence of
operational control risks. Our results are robust to controlling for internal control weaknesses
disclosed as per SOX Section 404, other determinants of financial reporting risks, and firm and
industry characteristics. Our empirical evidence is also suggestive of a positive relation between
operational control risk and SOX internal control weaknesses disclosures.
This study contributes to the nascent stream of literature that relates internal controls over
operations and regulatory compliance to audit risk and financial reporting controls (Li, Simunic,
and Ye 2014; Altamuro, Gray, and Zhang 2014). In particular, Li et al. (2014) document a
positive relation between environmental compliance risk and audit fees, while Altamuro et al.
(2014) report a positive contemporaneous relationship between regulatory noncompliance of
firms (that are regulated by the Food and Drug Administration) and earnings restatements. The
findings reported in our paper complement those reported in the above-mentioned studies and
collectively suggest that public assessments of operational control could inform investors in
3 Untabulated analyses indicate that the two proxies are significantly positively correlated are explained by size, complexity, and operating performance in a predictable manner. Section III discusses the measures in detail.

6
assessing financial reporting risk. This study also has normative implications for regulators
focused on the role of internal controls and their effects on financial reporting quality. Although
we do not study the costs of assessing such risks directly, our results pertaining to audit fees and
auditor switches indicate that auditors already incorporate operational control risks in their
testing and risk assessment procedures.
However, we caution the readers that our findings do not necessarily imply a causal
relation between operational control and financial reporting risk, but that manifestations of
operational control weaknesses are a reflection of firm-wide internal control weaknesses that
could result in financial reporting quality problems. This study also supports COSO’s recent
initiative to increase the emphasis on operational control risks, and we hope that it will
encourage regulators to revisit the current regulatory framework over operational controls.
Finally, our findings may be of interest to a wide audience, including firms, regulators and other
researchers interested in the measurement, causes and consequences of operational risk.4
The remainder of this paper is organized as follows. Section II provides the motivation
and predictions. Section III describes the operational control risk measures, sample selection, and
model specification. Section IV presents the results, Section V includes additional analyses, and
Section VI concludes the paper.
4 The BIS Sound Practices for the Management and Supervision of Operational Risk remark that “In the past, banks relied almost exclusively upon internal control mechanisms within business lines, supplemented by the audit function, to manage operational risk. While these remain important, recently there has been an emergence of specific structures and processes aimed at managing operational risk.” (BIS 2003) Banking regulators require banks to hold capital against potential losses derived from operational risk. However, financial institutions have struggled in identifying and measuring operational risk, as well as determining the costs of operational risk (Jobst 2010).

7
II. MOTIVATION AND PREDICTIONS
Extant literature
In recent years, there has been a significant amount of research relating to internal
controls. The extant literature has studied primarily firms’ and auditors’ assessment of controls
over financial reporting, rather than controls over operations and regulatory compliance. This
research investigates, inter alia, topics including the determinants of material weaknesses in
controls over financial reporting (e.g., Ashbaugh-Skaife, Collins, and Kinney 2007; Doyle, Ge,
and McVay 2007a) and the relations between: (i) financial reporting quality and internal controls
over financial reporting (e.g., Doyle, Ge, and McVay 2007b; Ashbaugh-Skaife, Collins, Kinney,
and LaFond 2008; Goh and Li 2011); (ii) audit fees and internal control over financial reporting
(e.g., Hogan and Wilkins 2008; Hoitash, Hoitash, and Bedard 2008; Huang, Raghunandan, and
Rama 2009); and (iii) management effectiveness and internal control over financial reporting
(e.g., Feng, Li, and McVay 2009; Li, Peters, Richardson, and Watson 2012; Feng, Li, McVay,
and Skaife 2014).
Our paper seeks to address the question of whether regulatory imposed internal control
assessments should pertain not only to financial reporting controls, but also to operating and
regulatory compliance controls. However, as noted in point (i) of the preceding paragraph, the
current internal control literature takes the investor perspective in assessing the impact of
internal controls over financial reporting on financial reporting quality, but is generally silent
about the role internal control over operations. Two recent but notable exceptions are studies by
Li et al. (2014) and Altamuro et al. (2014) that examine the risk of environmental and regulatory
noncompliance, respectively. While the study by Li et al. (2014) focuses on the impact of
environmental noncompliance risk on audit fees, Altamuro et al. (2014) appeals to “tone at the

8
top” arguments and investigates the relation between regulatory noncompliance risk of firms in
FDA-regulated industries and earnings restatements. Accordingly, we address this void in the
literature by providing initial evidence concerning the significance of assessing operational
control risks as part of an integrative evaluation of internal controls.
Predicted association between operational and financial reporting risk
Operational risk can be broadly defined as “the risk of loss resulting from inadequate or
failed internal processes, people and systems or from external events (BIS 2003)”. We consider
operational control risk to be the risk of a material disruption to normal operations or a loss
arising from operations that will not be prevented or detected on a timely basis by the company’s
internal control. Operational risk can include fraud, security, privacy protection, legal risks,
infrastructure risk (e.g., plant shutdowns), and environmental risk.
In general, sound strategies to mitigate operational risks are related to good management;
however, as long as people, systems, and processes remain imperfect, operational risk cannot be
fully eliminated (Credit Suisse Group 2003). Manifestations of operational risks impact client
satisfaction, reputation and shareholder value. Operational risk is mitigated by investments in
internal control systems and infrastructure. Many of these underlying control platforms, such as
system software, firm-level controls, and access controls, usually support entity-wide control
activities (e.g., IFAC 2010). Higher levels of operational control risk caused by the underlying
systems and procedures may also indicate higher levels of financial reporting and regulatory
compliance control risks. In COSO’s framework (COSO 1992; COSO 2013) operational controls
are a critical component of a system of internal control. Not only are operational controls
important to the success of every business organization, through improving operational

9
efficiencies and supporting firm-wide goals, they also provide insights into the comprehensive
view of the firm’s internal control.
We predict a positive leading association between manifestations of operational control
risk and financial reporting quality. We outline the mechanisms underlying this predicted
association below.
First, many underlying control platforms, such as system software, firm-level controls,
and access controls, usually support entity-wide control activities (e.g., IFAC 2010); in turn,
higher levels of operational control risk caused by the underlying systems and procedures may
also indicate higher levels of financial reporting and regulatory compliance control risks. For
example, if a firm uses an all-inclusive software program that services operations and financial
reporting processes (e.g., an Enterprise Resource Planning system that has several modules
including financial reporting), weak software access controls pertaining to its operating functions
could likely indicate similar access control issues with its financial reporting processes.5 In other
words, firms that operate in environments with high-control risk are likely to have high control
risk throughout the organization. Hence, a discovery of higher levels of operational control risk
would likely be associated with higher levels of financial reporting control deficiencies and
result in financial reporting quality problems. For example, in recent years, the increasing
operational risks associated with safeguarding sensitive client information (especially in
industries such as banking, retail, and airlines) will be highly related to protecting the integrity of
the financial reporting information given that the two types of information are significantly
integrated. Supporting these arguments, The Analyst’s Accounting Observer (2012) states that:
5 In additional analyses (Section V), we document a positive relation between operational control risk and weaknesses in internal control over financial reporting.

10
“…insufficient defences against cyberattacks might make the firm’s reporting controls vulnerable as well. Cybersecurity isn’t just about liability to customers whose personal profiles have been filched in a cyber-raid. If a firm’s internal reporting mechanisms are compromised, it might be unable to complete its external reporting to shareholders, making cybersecurity an internal control issue.”
Second, the existence of larger operational control risks may reflect management’s
commitment to support a strong internal control environment. As management’s attitude towards
controls can have pervasive effects on the actual control procedures throughout the organization
(Ge and McVay 2005; COSO 2009), higher levels of operational control risk could provide cues
as to management’s overall focus pertaining to internal control. Taking the foregoing
considerations together, we expect that operational control risks will provide useful information
concerning the extent of overall organizational control risk, including financial reporting control
risks that manifest in lower observed financial reporting quality. We formally state our first
prediction below.
P1: There is a positive leading association between operational control risk and financial reporting quality.
Predicted association between operational and audit risk
Auditing Standard No. 8 on Audit Risk (PCAOB 2010) provides guidance for auditors’
consideration of audit risk and highlights that higher levels of control risk increase overall audit
risk. While control risk in this standard refers to financial reporting control risk—“the risk that a
misstatement due to error or fraud that could occur and that could be material…will not be
prevented or detected on a timely basis by the company’s internal control”—it is important to
point out that control risk “is a function of the effectiveness of the design and operation of
internal control.” Recall that in COSO’s framework, internal control encompasses financial

11
reporting controls, operational controls, and regulatory compliance controls. Accordingly,
weaknesses in operational controls can increase control risk and overall audit risk. Thus,
COSO’s framework of internal control, combined with the Public Company Accounting
Oversight Board’s (PCAOB) current audit risk model, leads us to generate the following
prediction concerning operational control risk and audit risk:
P2: There is a positive association between operational control risk and overall audit risk.
P1 and P2 together highlight a possible conundrum that while the auditors’ existing
testing procedures are adequate to assess operational control risks, their clients do not undertake
adequate prompt corrective action based on these assessments. This relation results from the fact
that current regulations do not require auditors to suggest their clients take corrective action
relating to financial reporting control risks despite the fact that they acknowledge the heightened
audit risk and increase their own fees—focusing only on financial reporting control risks for
external public reporting purposes.
III. OPERATIONAL RISK PROXIES, SAMPLE SELECTION, AND MODEL
SPECIFICATION
Computer data breaches
We consider the actual realization of operational control risk to be one of the strongest
and most reliable indicators of the existence of operational control risk. Accordingly, we use one
such type of realization — publicly disclosed computer data breach incidences — as an ex post
proxy for operational control risk. Occurrence of disclosed data breaches not only provide a rare
opportunity for those external to the company to observe weaknesses in a firm’s internal control
over operations, but also represent one of management’s top operational control concerns.

12
Among several types of operational risks, data breaches have become pervasive and
increasingly onerous.6 According to a report issued by the Ponemon Institute (2011), an
organization dedicated to independent research on data protection, privacy, and information
security policy, the estimated cost of a privacy breach reported by companies in 2010 was
approximately $214 dollars per compromised customer record.7 Moreover, research documents
abnormal decreases in market values for public companies of over 500 basis points following a
data breach (Campbell, Gordon, Loeb, and Zhou 2003).
Data breaches have become so prevalent in the past few years that on October 13, 2011
the SEC issued specific guidance—CF Disclosure Guidance: Topic No. 2: Cybersecurity—
mandating that cyber breaches be disclosed in Management’s Discussion and Analysis (MD&A)
of the financial statements (SEC 2011). The guidance requires that firms now disclose material
data breaches including a description of the property that was stolen, the likely financial effects,
and the resulting future revenue and cost projections, if material. Furthermore, the American
Institute of Certified Public Accountants (AICPA 2012) Top Technological Initiatives survey
indicates that “securing the IT environment” and “managing and retaining data” are the
respondents’ top two technology initiatives in 2012 and have been among their top ten
technology initiatives since 2001. Thus, a data breach reflects a deficiency of a fundamental
operational control and provides us as researchers some insights to the strength of the firm’s
internal control over operations. A review by BDO United States of the Form 10-Ks of the 100
largest publicly-traded U.S. technology companies released in 2012 revealed that “71% listed
6 Companies recently breached include: AIG Inc., Apple Inc., CardSystems Solutions Inc., Citigroup Inc., ChoicePoint Inc., Heartland Payment Systems Inc., Las Vegas Sands Corp., Lockheed Martin, Michaels Stores Inc., Snapchat, Sony Corp., Target Corp., TJX Companies Inc., and Time Warner Inc. 7 This estimate includes direct costs from the privacy breach as well as an estimate for indirect costs which reflect a loss of current customers and potential future customers due the breach. However, the survey does not include companies that experienced breaches with more than 150,000 compromised records, and is subject to a non-response bias.
13
technology security or data breaches as risk factors this year, up from 57% last year and 44%
who did so in 2010” (WSJ 2012).
Our breach data is obtained with permission from the Identity Theft Resource Center
(ITRC). In 2005, the ITRC started compiling a database of all the publicly reported breach
disclosures in the United States for all organizations, public and private. According to the
Identity Theft Resource Center (ITRC), the number of breach disclosures reported across all
organizations, public and private, in the United States increased 201 percent from 157 breaches
in 2005 to 472 breaches in 2012. In Appendix A we provide more information on U.S. breach
notification laws and in Appendix B we provide an example of a corporate breach disclosure.
The ITRC database includes information pertaining to the type of breach, the estimated date that
the breach occurred, the date the breach was disclosed, and when available, the number of
individual records that were compromised. The sample period begins in January 2005, as the
sample is restricted by ITRC’s data, and continues until fiscal year end 2012, including 2013 to
calculate those variables that require data from fiscal year t+1. The total number of breaches
reported by all organizations during calendar years 2005 to 2013, per the ITRC’s records, is
3,632. Of those breaches, we identified 381 firm-years with breaches that pertain to public
companies or subsidiaries of public companies that have necessary data availability for our
dependent and control variables in COMPUSTAT and Audit Analytics.8 Our sample also
8 The data breaches in our sample can be considered material given that they motivated the firms involved to issue a public disclosure and that they typically involve thousands of compromised records involving individual private information. As explained by a U.S. General Accountability Office report (GAO 2007, p. 2) “the term “data breach” generally refers to an organization’s unauthorized or unintentional exposure, disclosure, or loss of sensitive personal information, which can include personally identifiable information such as Social Security numbers (SSN) or financial information such as credit card numbers.” Also a recent General Accountability Office report highlights why data breaches are important “protecting personal identifiable information and responding to a data breach are critical because the loss or unauthorized disclosure of sensitive information can lead to serious consequences such as identity theft or other fraudulent activity and can result in substantial harm. While some identity theft victims can resolve their problems quickly, others face substantial costs and inconvenience in repairing damage to their credit

14
includes all other firms without breaches and available data for our dependent and control
variables in COMPUSTAT and Audit Analytics in fiscal years 2005 to 2013 (30,734
observations). Table 1 describes our sample selection procedure.9
Operational risk index
Our second measure of operational control risk is an operational control risk index
created through textual analysis of Form 10-Ks in the SEC EDGAR database. Our index is based
on a framework developed by Deloitte Consulting for assessing operational risk (Deloitte
2011)10. Deloitte’s framework was designed for financial institutions. We modify it to make it
more generally suitable to all types of companies. We scan the 10-K filings of all publicly-listed
companies from 2004 to 2011 for companies’ disclosures of their responses to operational risk.
In particular, we code companies’ response to operational risk through the following dimensions:
(i) formalized risk management systems and controls, (ii) interaction between board and risk
management, (iii) risk appetite, (iv) risk committee, (v) risk culture and oversight, (vi) chief risk
officer, (vii) enterprise risk management, (viii) interaction between compensation and risk, (ix)
data management, (x) formal risk reporting, and (xi) types of risk information reporting. Our text
extraction program was able to extract 69,570 firm-year (or 10-K) observations from the SEC’s
EDGAR database. Appendix C provides details of our text extraction procedure and the specific
items codified in the index. Merging the sample with operational risk index reduces it to 25,248
observations. An advantage of using an operational risk index is that it provides cross-sectional
records. According to the Bureau of Justice Statistics, millions of American households have reported cases of identity theft (GAO 2013, p. 3).” 9 There are 70 industries (2-digit SIC codes) included in our sample, but only 47 industries have observations with breaches in the period from 2005 to 2012. In terms of the total number of observations, 92.5 percent are from the industries with breaches. Financial firms (SIC codes 60-69) represent 145 out of the 381 breach observations in our sample. In Section V we describe several sensitivity analyses to mitigate the influence of industry effects. 10 Deloitte’s annual risk management survey is a comprehensive periodic examination of risk management at financial institutions. The 2011 assessment was based on responses from 131 financial institutions around the world answering questions about their risk assessment processes.

15
variation for a large number of firms in our analyses. On the other side, it relies on general risk
disclosures and has limited variation year-over-year and may be more indicative of the level of
inherent control risk.
Financial reporting quality and operational risk model
Our first hypothesis predicts a positive leading association between operational control
risks and financial reporting quality. We use two commonly employed measures of financial
reporting quality: (i) financial statement restatements (Hribar and Jenkins 2004; Palmrose,
Richardson, and Scholz 2004; Doyle et al. 2007b; Hennes, Leone, and Miller 2008; Coa, Myers,
and Omer 2012; Chen, Cheng, and Lo 2013) and (ii) SEC Comment Letters (Ettredge,
Johnstone, Stone, and Wang 2011; Robinson, Xue, and Yu 2011; Cassell, Dreher, and Myers
2013; Dechow, Lawrence, and Ryans 2014; Hribar, Kravet, and Wilson 2014).
Restatements (RESTATEi,t,t+1) reflect adjustments for material errors in prior financial
statements and SEC Comment Letters (SEC_COMMENTi,t,t+1) provide independent regulatory
assessments on the extent to which company filings comply with Generally Accepted
Accounting Principles (GAAP). Since Sarbanes-Oxley, the SEC’s Division of Corporation
Finance is mandated to review each registrant’s filings once every three years. If the SEC
identifies any concerns with the financial reporting they issue a comment letter (in private) to the
registrant. Hence, the receipt of an SEC Comment Letter signals that the SEC’s CPAs have
identified concerns with the registrant’s financial reporting. The registrant then has 10 business
days to respond and the back and forth continues until the SEC’s concerns are resolved. Since
2005, the SEC publicly discloses SEC Comment Letters (UPLOAD files) and registrants’
responses (CORRESP files) on EDGAR no earlier than 45 days (20 business days post 2011)
16
following the review completion. As the Division of Corporation Finance employs CPAs to
review the financial statements, we believe that SEC Comment Letters are good indicators of a
firm’s financial reporting quality. Moreover, given that the vast majority of SEC Comment
Letters result in prospective changes in financial reporting, there is very little overlap between
restatements and the receipt of an SEC comment letter (Dechow et al. 2014).
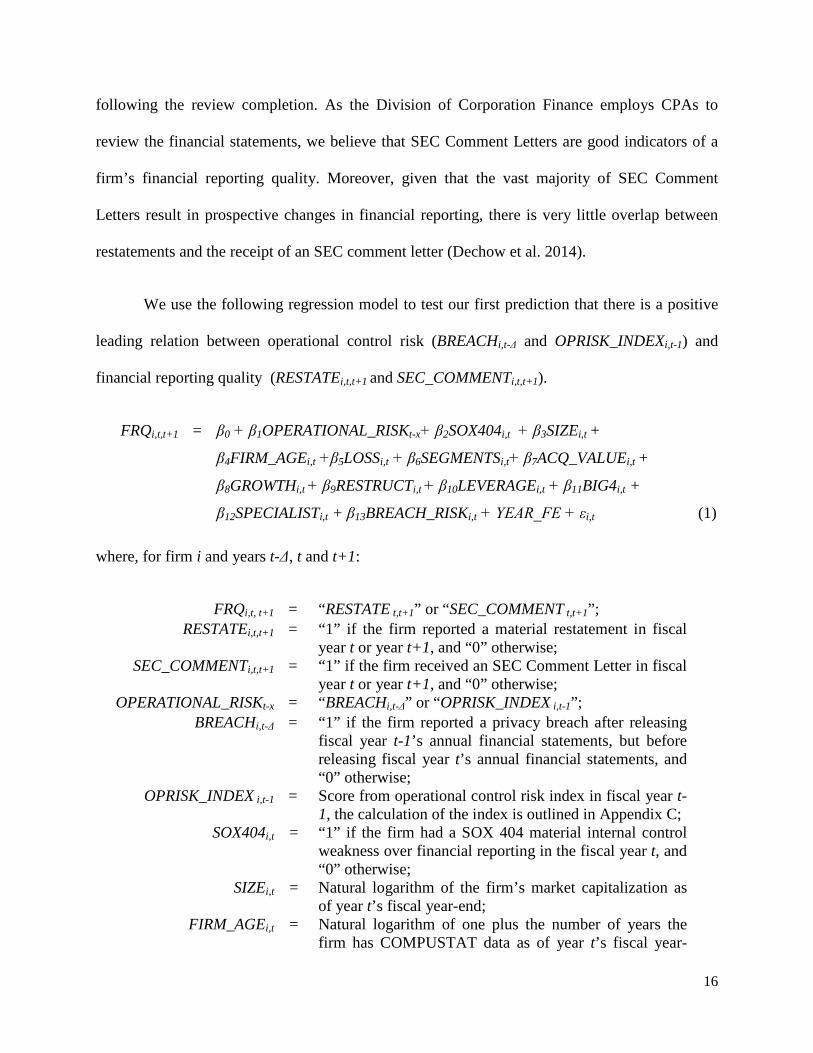
We use the following regression model to test our first prediction that there is a positive
leading relation between operational control risk (BREACHi,t-Δ and OPRISK_INDEXi,t-1) and
financial reporting quality (RESTATEi,t,t+1 and SEC_COMMENTi,t,t+1).
FRQi,t,t+1 = β0 + β1OPERATIONAL_RISKt-x+ β2SOX404i,t + β3SIZEi,t +
β4FIRM_AGEi,t +β5LOSSi,t + β6SEGMENTSi,t+ β7ACQ_VALUEi,t +
β8GROWTHi,t + β9RESTRUCTi,t + β10LEVERAGEi,t + β11BIG4i,t +
β12SPECIALISTi,t + β13BREACH_RISKi,t + YEAR_FE + εi,t (1)
where, for firm i and years t-Δ, t and t+1:
FRQi,t, t+1 = “RESTATE t,t+1” or “SEC_COMMENT t,t+1”; RESTATEi,t,t+1 = “1” if the firm reported a material restatement in fiscal
year t or year t+1, and “0” otherwise; SEC_COMMENTi,t,t+1 = “1” if the firm received an SEC Comment Letter in fiscal
year t or year t+1, and “0” otherwise; OPERATIONAL_RISKt-x = “BREACHi,t-Δ” or “OPRISK_INDEX i,t-1”;
BREACHi,t-Δ = “1” if the firm reported a privacy breach after releasing fiscal year t-1’s annual financial statements, but before releasing fiscal year t’s annual financial statements, and “0” otherwise;
OPRISK_INDEX i,t-1 = Score from operational control risk index in fiscal year t-1, the calculation of the index is outlined in Appendix C;
SOX404i,t = “1” if the firm had a SOX 404 material internal control weakness over financial reporting in the fiscal year t, and “0” otherwise;
SIZEi,t = Natural logarithm of the firm’s market capitalization as of year t’s fiscal year-end;
FIRM_AGEi,t = Natural logarithm of one plus the number of years the firm has COMPUSTAT data as of year t’s fiscal year-

17
end; LOSSi,t = “1” if net income before extraordinary items is less than
zero in fiscal year t, and “0” otherwise; SEGMENTSi,t = Natural logarithm of one plus the number of operating
and geographic segments as of year t’s fiscal year-end; ACQ_VALUEi,t = The aggregate dollar value of acquisitions that the
acquired company in the fiscal year t-1, scaled by market capitalization as of fiscal year-end t;
GROWTHi,t = Quintiles of year-over-year sales growth in fiscal year t, and “0” otherwise;
RESTRUCTi, t = The aggregate restructuring charges in the fiscal years t and t-1, scaled by market capitalization as of year t’s fiscal year-end;
LEVERAGEi,t = Debt divided by total assets as of year t’s fiscal year-end; BIG4i,t = “1” if the client has a Big 4 auditor in fiscal year t, and
“0” otherwise; SPECIALISTi,t = “1” if the firm’s auditor has the highest market share in
the client’s industry, measured using audit fees in fiscal year t, and “0” otherwise;
BREACH_RISKi = The natural logarithm of the number of breaches in the firm’s industry, to control for the inherent privacy breach risk of the firm’s industry; and,
YEAR_FE = Year fixed effects.
Figure 1 further explains the variable measurement timeline. In line with our first
prediction (P1), we expect positive coefficients on our operational risk proxies BREACHi,t-Δ and
OPRISK_INDEXi,t-1 if there is indeed a positive leading relation between operating control risks
and future financial reporting quality. Figure 1 depicts the measuring period for the proxies used
in our analyses.
Given that we are examining the relation between operating control risks and future
financial reporting quality, it is important to also control for financial reporting control risks to
ensure that our findings are not simply reflecting the previously documented relation between
financial reporting control risks and financial reporting quality (e.g., Doyle et al. 2007b).
SOX404i,t equals “1” if the firm had a SOX 404 material internal control weakness over

18
financial reporting in the fiscal year t, and “0” otherwise.11 All other variables are defined in
Equation (1) and control for other determinants of financial reporting quality (e.g., firm size, age,
profitability, financial reporting complexity, restructuring, financial distress, etc.). Section V
describes additional matched sample analyses to isolate the effect of operational control risk on
financial reporting quality.
Audit fees and operational risk model
Next, we test our prediction that operational control risk increases the overall audit risk
faced by external auditors. Following an extensive literature that documents a relation between
total audit risk and audit fees (e.g., Pratt and Stice 1994; Bell, Landsman, and Shackelford 2002;
Hay, Knechel, and Wong 2006; Hogan and Wilkins 2008; Stanley 2011) we use audit fees as a
proxy for overall audit risk, controlling for known determinants of audit fees (i.e., client size and
complexity). We model the determination of audit fees (LOGFEESi,t) using the following
regression specification:
LOGFEESi,t = β0 + β1OPERATIONAL_RISKi,t-x+ β2SOX404i,t + β3SIZEi,t +
β4BIG4i,t +β5ATURNi,t + β6EXPORTi,t + β7LEVERAGEi,t + β8ROAi,t +
β9ABSEXTRA + β10LOSSi,t + β11ROA*LOSSi,t + β12SEGMENTSi,t +
β13SPECIALISTi,t + β14DEC_YRENDi,t + β15OPINIONi,t + YEAR_FE + εit (2)
where, for firm i and year t:
LOGFEESi,t = Natural logarithm of total audit fees in the fiscal year t;12
ATURNi,t = Sales in fiscal year t divided by total assets as of fiscal year t’s year-end;
11 In additional analyses, we obtain similar inferences as those documented in Tables 3 to 5, when we use a lagged indicator for SOX 404 internal control weaknesses (SOX404i,t-1) measured as of fiscal year t-1 rather than as of fiscal year t. 12 In additional analyses, we obtain similar inferences as those documented in Table 5, when we use LOGFEES measured as of fiscal year t+1 rather than as of fiscal year t.
19
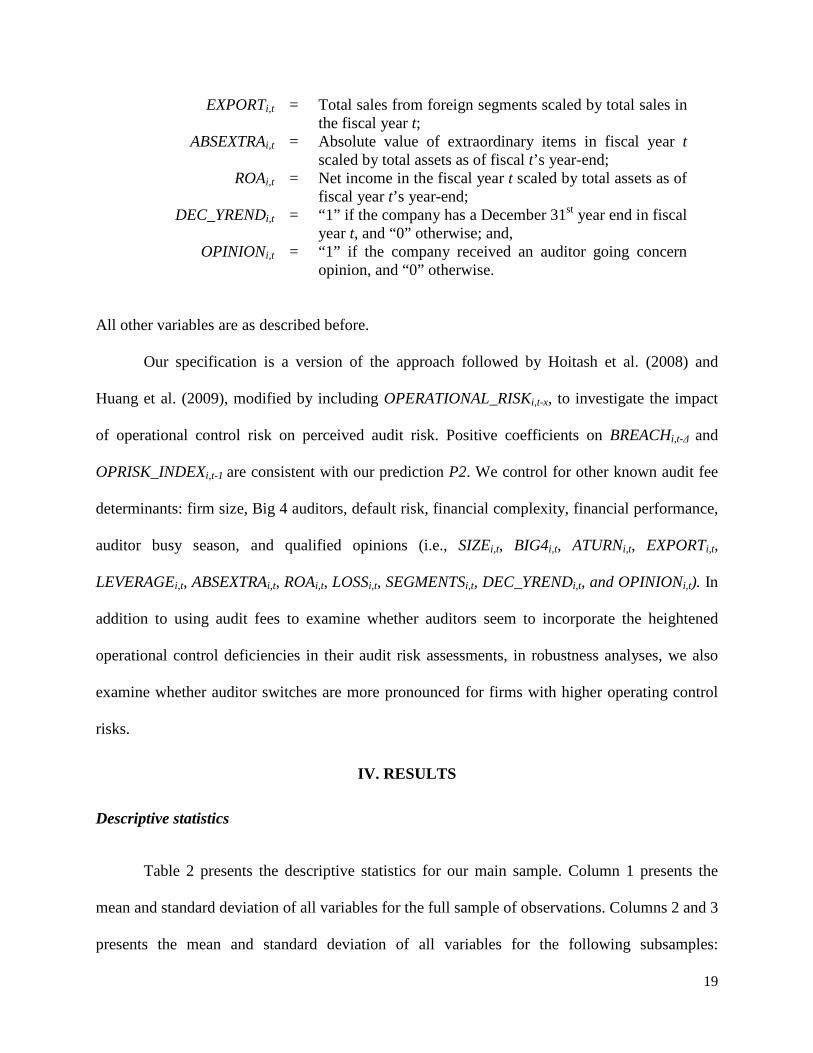
EXPORTi,t = Total sales from foreign segments scaled by total sales in the fiscal year t;
ABSEXTRAi,t = Absolute value of extraordinary items in fiscal year t scaled by total assets as of fiscal t’s year-end;
ROAi,t = Net income in the fiscal year t scaled by total assets as of fiscal year t’s year-end;
DEC_YRENDi,t = “1” if the company has a December 31st year end in fiscal year t, and “0” otherwise; and,
OPINIONi,t = “1” if the company received an auditor going concern opinion, and “0” otherwise.
All other variables are as described before.
Our specification is a version of the approach followed by Hoitash et al. (2008) and
Huang et al. (2009), modified by including OPERATIONAL_RISKi,t-x, to investigate the impact
of operational control risk on perceived audit risk. Positive coefficients on BREACHi,t-Δ and
OPRISK_INDEXi,t-1 are consistent with our prediction P2. We control for other known audit fee
determinants: firm size, Big 4 auditors, default risk, financial complexity, financial performance,
auditor busy season, and qualified opinions (i.e., SIZEi,t, BIG4i,t, ATURNi,t, EXPORTi,t,
LEVERAGEi,t, ABSEXTRAi,t, ROAi,t, LOSSi,t, SEGMENTSi,t, DEC_YRENDi,t, and OPINIONi,t). In
addition to using audit fees to examine whether auditors seem to incorporate the heightened
operational control deficiencies in their audit risk assessments, in robustness analyses, we also
examine whether auditor switches are more pronounced for firms with higher operating control
risks.
IV. RESULTS
Descriptive statistics
Table 2 presents the descriptive statistics for our main sample. Column 1 presents the
mean and standard deviation of all variables for the full sample of observations. Columns 2 and 3
presents the mean and standard deviation of all variables for the following subsamples:

20
BREACHi,t-Δ =0 and BREACHi,t-Δ =1. Column 4 reports t-tests of differences in means for all
variables between the two. Our data contains 381 observations with BREACHi,t-Δ =1. The
operational risk index (OPRISK_INDEXi,t-1) has a mean of 3.48, with larger values indicating a
comparatively higher operational control risk. The correlation between the two operational
control risk proxies for is 0.07 and is statistically significant at the one percent level. The mean
values of RESTATEi,t,t+1 and SEC_COMMENTi,t,t+1 in the full sample are 0.132 and 0.548.
Comparing across breach and non-breach firms, breach firms have a higher incidence of both
restatements and SEC comment letters than do non-breach firms. Also, breach firms have higher
audit fees than do non-breach firms; however, we caution the reader that this effect could partly
be explained by a difference in firm size between these two sub-samples. All other control
variables have generally similar distributions to those reported in prior research studies that use
these variables to explain financial reporting quality and audit risk.
Financial reporting quality and operational control risk
Table 3 reports logistic regression results for Equation (1), which tests the relation
between operational control risk (BREACHi,t-Δ and OPRISK_INDEXi,t-1) and future financial
reporting restatements (RESTATEi,t,t+1). Consistent with our expectations, we find firms with
higher operational control risk are more likely to have restatements in the future. Specifically, in
Column (1) the coefficient on BREACHi,t-Δ is 0.331 (p < 0.05) indicating that breach firms are
approximately 1.39 times more likely to have a restatement in fiscal years t or t+1 than are non-
breach firms. In Column (2) we use OPRISK_INDEXi,t-1 and find that the coefficient on this test
variable is 0.117 (p < 0.01). Comparing observations below and above the median
OPRISK_INDEXi,t-1, firms above the median are 1.10 times more likely to have a restatement in
fiscal years t or t+1 than firms below the median. These findings are robust to controlling for

21
material weaknesses in internal control over financial reporting reported as per SOX Section 404.
The coefficient on SOX404i,t is positive and significant (p <0.01) in Columns (1) and (2),
confirming prior research that restatements are related to internal control weaknesses over
financial reporting (Blankley, Hurt, and MacGregor 2012, Table 5). The control variables
highlight that future restatements are higher for smaller and less profitable firms, and firms with
Big 4 auditors and industry audit specialists.
Table 4 reports the regression results when FRQ is measured using SEC Comment
Letters (SEC_COMMENTi,t,t+1). Consistent with the findings in Table 3, the coefficient
coefficient on BREACHi,t-Δ in Column (1) is 0.384 (p < 0.01) indicating that breach firms are
approximately 1.46 times more likely to experience an SEC review with questions in fiscal years
t or t+1 than are non-breach firms. In Column (2) we use OPRISK_INDEXi,t-1 and find that the
coefficient on this variable is 0.073 (p < 0.05). Comparing observations below and above median
OPRISK_INDEXi,t-1, firm-year observations above the median approximately 1.09 times more
likely to have a SEC Comment Letter in fiscal years t or t+1 than observations below the
median.
Unlike Table 3, the coefficient on SOX404i,t is insignificant in Columns (1) and (2)
suggesting that there is not a relation between financial reporting control risk and the receipt of
future SEC Comment Letter reviews. Moreover, consistent with evidence in Cassell et al. (2013),
the coefficient on other control variables highlight that SEC Comment Letters are more likely for
larger, older, less profitable, and less financially complex firms. Overall, the results in Tables 3
and 4 provide support for P1 that there is a positive leading relation between operational control
risks and future financial reporting quality. These findings also suggest that current operational
control deficiencies can be used as cues for deficiencies in financial reporting. Accordingly, we

22
interpret these findings as suggesting that investors can benefit from public assessments of the
quality of operational controls by auditors.
Audit fees and operational risk results
Table 5 examines whether the heightened audit risk for operationally risky firms is
reflected in higher audit fees using the auditor fee regressions of Equation (2). Our principal
finding in this analysis is that audit fees are increasing in both the operational control risk
proxies. Specifically, the estimated coefficient on BREACHi,t-Δ in Column (1) is 0.341 (p < 0.01)
and the coefficient on OPRISK_INDEXi,t-1 in Column (2) is 0.187 (p < 0.01) highlighting that
auditors recognize the heightened operational control risk. Moreover, we find that the control
variables load in a predictable manner. Specifically, we find that audit fees are increasing in
financial reporting control risk (SOX404i,t), firm size (SIZEi,t), leverage (LEVERAGEi,t), the
amount of extraordinary items (ABSEXTRAi,t), the number of business segments (SEGMENTSi,t),
specialist auditors (SPECIALISTi,t) and with poor firm performance (LOSSi,t and ROAi,t). The
results show that operational control risk explains variation in auditors’ fees, and in turn, risk
assessments. Overall, these results support our second main prediction (P2) that existing audit
procedures help auditors’ assessment of audit risk in the presence of operating control risks,
suggesting that mandating assessments over operating control risks is unlikely to be
incrementally onerous for auditors.13
13 Inferences are also robust to controlling for the probability of bankruptcy using the Zmijewski score, calculated as -4.336 -4.513*(Net Income/Total Assets) + 5.679*(Total Liabilities/Total Assets) +0.004*(Current Assets/Current Liabilities) in a sub-sample of non-financial firms as bankruptcy prediction models typically used in accounting studies do not apply to financial firms.

23
V. ADDITIONAL ANALYSES
Association between operational and financial reporting control weaknesses
A key inference of this study is that there is a positive relation between operating control
risk and near future financial reporting quality. In Section II, we hypothesize that one reason for
this relation is that weaknesses in firm-wide underlying control systems and procedures can
manifest in high levels of operational control risk and deficiencies in financial reporting quality.
To further understand the underlying mechanism the underlying mechanism of the relation
between operational control risk and financial reporting quality, we examine whether there is a
relation between operational control risks and deficiencies in specific internal controls that
pertain to financial reporting (inferred through weaknesses reported under SOX Section 404).
Specifically, we investigate whether operational control risks are related to weaknesses in
internal control over financial reporting disclosed at year-end and with other firm characteristics
associated with financial reporting risk (i.e., size, complexity, and auditor type). We estimate the
following model of operational control risk:
OPERATIONAL_RISKi,t = β0 + β1SOX404i,t+ β2SIZE i,t + β3FIRM_AGEi,t+ β4LOSSi,t +
β5SEGMENTSi,t + β6LEVERAGEi,t +β7SPECIALISTi,t +
β8BIG4i,t + β9STD_ROAi,t + β10GROWTHi,t +
INDUSTRY_FE + YEAR_FE + εi,t (3)
where, for firm i and year t:
STD_ROAi,t = Standard deviation for annual ROAi,t in years t, t-1 and t-
2; and, INDUSTRY_FE = Industry (2-digit SIC code) fixed effects.
All other variables are as defined before. We expect a positive coefficient on SOX404i,t. We
expect operational control risk to increase with size, complexity, income volatility, losses, and

24
growth. Accordingly, we expect positive coefficients on SIZEi,t, SEGMENTSi,t, STD_ROAi,t,
LOSSi,t, and GROWTHi,t. The auditor type variables, firm age, and leverage can be associated
with higher complexity but could also reflect cross-sectional variation in control risk. Finally, we
expect operational risk to be related to industry (i.e., operational risk plays an important role in
financial institutions as noted by Baxter, Bedard, Hoitash, and Yezegel 2013) and change over
time (i.e., post-SOX firms became increasingly more aware of control risks). We do not have
directional predictions for SPECIALISTi,t, BIG4i,t, LEVERAGEi,t, and FIRM_AGEi,t.
In untabulated analyses, we find a positive and statistically significant association
between SOX404i,t and BREACHi,t (the coefficient on SOX404i,t in Equation (3) using breaches as
the dependent variable and estimated using logistic regression is 0.532 with p<0.01). In addition,
we find that the model has a pseudo-R2 of 0.217, indicating that these determinants explain the
incidence of breaches relatively well. We also find a positive and statistically significant
coefficients (at the one-percent level) for SIZEi,t, and FIRM_AGEi,t.. These findings are
qualitatively similar if we control for industry effects by including BREACH_RISKi,t, the natural
logarithm of the number of breaches in the firm’s industry.
We also find a positive and statistically significant association between SOX404i,t and
OPRISK_INDEXi,t (the coefficient on SOX404i,t in Equation (3) using the operational control
index as dependent variable and estimated using OLS is 0.135 with p<0.01). We find that the
model has an adjusted R2 of 0.359, indicating that these determinants explain the variation in our
operational risk index relatively well. We also find positive and statistically significant
coefficients (at the one-percent level) for all variables, except GROWTHi,t that is positive but not
significant.(at the ten-percent level) and FIRM_AGEi,t that is negative and significant.(at the one-
percent level).

25
Matched Sample analyses
A potential criticism of our study is that the results could be confounded by firm
characteristics that are correlated with both operational control risks and financial reporting
problems. For example, one such potentially correlated variable is deficiencies in internal
controls over financial reporting reported under SOX Section 404 (SOX404i,t). To better isolate
the relationship between operational control risk, financial reporting quality, and audit risk, we
conduct the matched sample analyses for Equations 1 and 2. We report both Propensity Score
Matching (PSM) and simple attribute-based matching approaches.
For the PSM analyses, we match BREACHi,t-Δ =0 and and BREACHi,t-Δ =1 observations
using propensity scores estimated using the determinants model (Equation 3) including
BREACH_RISKi,t-1. Similarly, we match firms with values above and below the median of
OPRISK_INDEXi,t-1, transforming it into an indicator variable OPRISK(1/0)i,t-1. We also conduct
analyses using a relatively simpler attribute-based matching approach. Specifically, we match
firm-year observations with BREACHi,t-Δ =0 and and BREACHi,t-Δ =1 (and OPRISK(1/0)i,t-1 =0
and OPRISK(1/0)i,t-1 =1) on SIZEi,t-1, industry (2-digit SIC), and fiscal year.
Table 6 summarizes the findings of our results using matched samples. For brevity, we
only report the coefficients on our variables of interest BREACHi,t-Δ and OPRISK(1/0) i,t-1. Panel
A shows the results for the model that predicts restatements. Panel B shows the results for the
SEC comment letter model and Panel C shows the results for the model predicting audit fees.
The samples used in Columns (1) and (2) are comprised of observations matched on propensity
score estimated using all variables as described above, and the samples used in Columns (3) and
(4) are comprised of observations matched on propensity score estimated using all variables

26
SIZEi,t,, industry (SIC 2-digit), and year. Panels A-C show a positive association between the
operational control risk proxies and indicators of financial reporting quality problems
(restatements and SEC comment letter receipts) and audit risk (as reflected in audit fees), after
controlling for reported SOX 404 deficiencies and other firm characteristics.14
Association between auditor switches and operational risk
In our main analyses, we provide some evidence that auditors increase their perception of
audit risk in the presence of operating control risks. To provide further evidence in this regard,
we examine whether auditor turnover is more pronounced in firms with higher operational
control risk. In our sample we find that the incidence of auditor switches is nine percent; coded
as one if there is auditor turnover in year t or t+1, and zero otherwise. In untabulated analyses,
we find evidence that operational control risk is related to future auditor switches only using our
control risk index and not the incidence of data breaches. We cautiously view this as additional
evidence suggesting that auditors increase their perceived audit risk in the presence of operating
control risks.
Association between future audit fees and operational risk
In the main analyses, we examine the relation between manifestation of operational
control risks between fiscal year-ends t-1 and t, and audit fees in fiscal year t. A concern with
using fiscal year t audit fees is that the audit firms might not have adequate response time to
increase the audit fees due to discovery of heightened operational control risks prior to the fiscal
14 We match observations on the closest propensity score (estimated using logistic regression), without replacement and within common support. Results are qualitatively similar without including BREACH_RISKi,t as a determinant in the full model, or matching on the logarithm of total assets, industry and year.

27
t year-end. Hence, in untabulated robustness tests, we rerun the audit fees regressions using audit
fees reported for fiscal year t+1, and find similar inferences.
Mitigating the impact of industry effects
A potential confounding factor in our analyses is the difference in operational control risk
across industries, particularly between industries with and without breaches and between
financial and non-financial firms. There are 70 industries (2-digit SIC codes) included in our
sample, but only 47 industries have observations with breaches in the period from 2005 to 2012.
In terms of the total number of observations, 92.5 percent are from the industries with breaches.
Financial firms (SIC codes 60-69) represent 145 out of 381 breach observations in our sample.
We mitigate the industry effects in our analyses by: (i) including BREACH_RISKi,t, the
natural logarithm of the number of breaches in the firm’s industry, as a control variable in our
regression models, Equations (1) and (2) in Tables 3 to 6; (ii) estimating our regression models
using a subsample of non-financial firms (excluding observations in SIC codes 60 to 69) for our
two operational risk proxies, finding similar results (untabulated); (iii) estimating our regression
models using a subsample of firms in industries with breaches (exclude observations in 23 SIC
codes without breaches in years 2005 to 2012) for our BREACHi,t-Δ risk proxy, finding
qualitatively similar results; (iv) estimating our regression models including industry fixed
effects, finding similar results (untabulated); and (v) including industry as a matching variable in
our propensity score matching models.

28
VI. CONCLUSION
This study provides evidence concerning the significance of assessing operational control
risks as part of an integrative evaluation of internal controls. Using data breaches and a 10-K
based index to indicate operational control risk, we document a positive leading relation between
operational control risk and financial reporting quality problems, and show that operational
control risk increases auditors’ perceived engagement risk. Due to the limitations and obvious
weaknesses associated with using external proxies of operational control risk proxies compared
to those actually observed by auditors, we believe our findings provide a lower bound estimate to
the importance of assessing operational control risks.
Collectively, we interpret our two main findings as evidence that public assessments of
operational control quality by auditors, were they to be mandated, would result in significant
benefits to investors who could use such disclosures as precursors for detecting near future
problems in financial reporting quality. The study’s inferences support the view that internal
control assessments under SOX solely over financial reporting appear to overlook operational
control risks that predict future financial reporting quality. Even though we do not directly study
the costs of assessing operational control risks, our results pertaining to audit fees and auditor
switches indicate that auditors already incorporate operational control risks in their testing and
risk assessment procedures. Thus, it appears that requiring auditor assessments over operating
control risks is unlikely to be incrementally onerous. Moreover, the findings also support
COSO’s revised internal control framework that emphasizes the importance of assessing internal
control pertaining to operations and regulatory compliance, and we encourage regulators to
revisit the current regulatory framework for operational controls. Finally, our findings may be of

29
interest to a wide audience, including firms, regulators and other researchers interested in the
measurement, causes and consequences of operational control risk.

30
REFERENCES
American Institute of Certified Public Accountants (AICPA). 2012. Top Technology Initiatives. AICPA, New York.
Altamuro, J., J. Gray, and H. Zhang. 2014. A commitment to compliance: An examination of financial
and operational noncompliance for FDA-Regulated Industries. Working paper, Ohio State University.
Ashbaugh-Skaife, H., D. Collins, and W. Kinney. 2007. The discovery and reporting of internal control
deficiencies prior to sox-mandated audits. Journal of Accounting and Economics 44 (1-2): 166-192.
———, ———, ———, and R. La Fond. 2008. The effect of SOX internal control deficiencies and their
remediation on accrual quality. The Accounting Review 83 (1): 217-250. Association of Business Trial Lawyers Report (ABTL). 2007. Is your client prepared to comply with the
data security notification laws? Spring 2007. Bank for International Settlements (BIS). 2003. Sound practices for the management and supervision of
operational risk. Basel, Switzerland. Available at: http://www.bis.org/publ/bcbs96.pdf Baxter, R., J. Bedard, R. Hoitash, and A. Yezegel. 2013. Enterprise risk management program quality:
Determinants, value relevance, and the financial crisis. Contemporary Accounting Research 30 (4) 1264–1295
Bell, T., W. Landsman, and D. Shackelford. 2002. Auditors’ perceived business risk and audit fees:
Analysis and evidence. Journal of Accounting Research 39 (1): 35-43. Blankley, A., D. Hurt, and J. MacGregor. 2012. Abnormal audit fees and restatements. Auditing: A
Journal of Practice & Theory 31 (1) 79-96. California State Senate. 2003. California SB 1386. Civil Code Section 1798.29 and 1798.82. State of
California. Campbell, K., L. Gordon, M. Loeb, and L. Zhou. 2003. The economic cost of publicly announced
information security breaches: empirical evidence from the stock market. Journal of Computer Security 11(3): 431-448.
Cao, Y., L. Myers, and T. Omer. 2012. Does company reputation matter for financial reporting quality?
Evidence from restatements. Contemporary Accounting Research 29 (3) 956-990. Cassell, C., L. Dreher, and L. Myers. 2013. reviewing the sec’s review process: 10-k comment letters and
the cost of remediation. The Accounting Review 88 (6): 1875-1908. Chen, X., Q, Cheng, and A. Lo. 2013. Accounting restatements and external financing choices.
Contemporary Accounting Research 30 (2): 750-779. Committee of Sponsoring Organizations of the Treadway Commission (COSO). 1992. Internal Control—
Integrated Framework. The Framework. New York, NY: COSO.
31
———. 2009. Internal Control—Integrated Framework. Guidance on Monitoring Internal Control Systems. New York, NY: COSO.
———. 2013. 2013 Internal Control—Integrated Framework. New York, NY: COSO. Compliance Week. 2012. COSO Framework Overhaul Sparking Deeper Debates. April 24, 2012. Credit-Suisse Group. 2003. Operational risks in financial services an old challenge in a new environment.
Basel, Switzerland. Available at: https://www.credit-suisse.com/governance/doc/operational_risk.pdf
Dechow, P., A. Lawrence, and J. Ryans. 2014. SEC comment letters and insider sales. Working paper,
University of California at Berkeley. Deloitte. 2011. Global Risk Management Survey. New York, NY. Available at:
https://www.deloitte.com/assets/Dcom-UnitedStates/Local%20Assets/Documents/us_fsi_grms_031711.pdf
Doyle, J., W. Ge, and S. McVay. 2007a. Determinants of weaknesses in internal control over financial
reporting. Journal of Accounting and Economics 44 (1-2): 193-223. ———, ———, and ———. 2007b. Accruals quality and internal control over financial reporting. The
Accounting Review 82 (5): 1141-1170. Ernst & Young. 2006. Leveraging value from internal controls. London, U.K. Ettredge, M., K. Johnstone, M. Stone, and Q. Wang. 2011. The effects of firms size, corporate
governance quality, and bad news on disclosure compliance. Review of Accounting Studies 16 (4): 866-889.
Feng, M., C. Li., and S. McVay 2009. Internal control and management guidance. Journal of Accounting
& Economics 48 (2-3): 190-209. ———, ———, ———, and Skaife. 2014. ineffective internal control over financial reporting and firm
operations. Working paper, University of Pittsburgh. Ge, W., and S. McVay. 2005. The disclosure of material weaknesses in internal control after the
Sarbanes-Oxley Act. Accounting Horizons 19 (3): 137-158. Goh, B, and D. Li. 2011. Internal controls and conditional conservatism. The Accounting Review 86 (3):
975-1005. Hay, D., R. Knechel, and N. Wong. 2010. Audit fees: A meta-analysis of the effect of supply and demand
attributes. Contemporary Accounting Research 23 (1): 141-191. Hennes, K., A. Leone, and B. Miller. 2008. The importance of distinguishing errors from irregularities in
restatement research: The case of restatements and CEO/CFO turnover. The Accounting Review 83 (6): 1487-1519.
Hogan, C., and M. Wilkins. 2008. Evidence on the audit risk model: Do auditors increase audit fees in the
presence of internal control deficiencies? Contemporary Accounting Research 25 (1): 219-242.

32
Hoitash, R., U. Hoitash, and J. Bedard. 2008. Internal control quality and audit pricing under the
Sarbanes-Oxley Act. Auditing: A Journal of Practice & Theory 27 (1): 105-126. Hribar, P. and N. Jenkins. 2004. The effect of accounting restatements on earnings revisions and the
estimated cost of capital. Review of Accounting Studies 9 (2-3): 337-356. ———, T. Kravet, and R. Wilson. 2014. A new measure of accounting quality. Review of Accounting
Studies 19 (1): 506-538. Huang, H-W., K. Raghunandan, and D. Rama. 2009. Audit fees for initial audit engagements before and
after SOX. Auditing: A Journal of Practice & Theory 28 (1): 171-190. International Federation of Accountants (IFAC). 2010. New brooms sweep clean. New York, NY. Jobst, A. 2010. The credit crisis and operational risk: Implications for practitioners and regulators.
Journal of Operational Risk: 5 (2): 43–62. Li, C., G. Peters, V. Richardson, and M. Watson. 2012. The consequences of information technology
control weaknesses on management information systems: The case of Sarbanes-Oxley internal control reports. MIS Quarterly 36 (1): 179-203.
Li, Y., D. Simunic, and M. Ye. 2014. Corporate environmental compliance risk and audit fees. Working
paper, University of Toronto. Palmrose, Z-V., V. Richardson, and S. Scholz. 2004. Determinants of market reactions to restatement
announcements. Journal of Accounting and Economics 37 (1): 59-89. Ponemon Institute. 2011. 2010 Annual Study: U.S. Cost of Data Breach. Ponemon Institute. Pratt, J., and J. Stice. 1994. The effects of client characteristics on auditor litigation risk judgments,
required audit evidence, and recommended audit fees. The Accounting Review 69 (4): 639-656. Public Company Accounting Oversight Board (PCAOB). 2010. Auditing Standard No. 8: Audit Risk.
Washington, DC: PCAOB. Robinson, J., Y. Xue, and Y. Yu. 2011. Determinants of disclosure noncompliance and the effect of the
SEC review: Evidence from the 2006 mandated compensation disclosure regulations. The Accounting Review 86 (4): 1415-1444.
Securities and Exchange Commission (SEC). 2011. CF Disclosure Guidance: Topic No. 2: Cybersecurity.
Washington, DC: SEC. Stanley, J. 2011. Is the audit fee disclosure a leading indicator of clients’ business risk? Auditing: A
Journal of Practice & Theory 30 (3): 157-179. The Accounting Analyst’s Observer. 2012. What Keeps The SEC Busy – 2013. December 18, 2012. The Wall Street Journal (WSJ). 2012. Tech Company Worries Shift to Growth Issues. May 10, 2012.

33
Tysiac, K. 2012. COSO Chair says updated framework is a ‘refresh’. Journal of Accountancy January 23, 2012.
U.S. General Accountability Office. 2007. Data breaches are frequent, but evidence of resulting identity
theft is limited; however, the full extent is unknown. Washington, D.C: GAO. Available at: http://www.gao.gov/assets/270/262899.pdf
———. 2013. Agency responses to breaches of personally identifiable information need to be more
consistent. Washington, D.C: GAO. Available at: http://www.gao.gov/assets/660/659572.pdf

34
APPENDIX A Privacy breach laws
As the U.S. Congress has yet to enact a federal law mandating breach notifications, since 2003,
the majority of states have passed their own breach notification laws. California adopted the first privacy
breach notification law, California SB 1386 (California State Senate 2003), on July 1st, 2003, and since
then “other states have since adopted similar laws modeled after, but not the same as, the California law”
(ABTL 2007). The California laws specify that any entity that conducts business in California and
licenses, maintains or owns computerized customer data, must notify law enforcement agencies and any
Californian resident whose data has been acquired by unauthorized means. Moreover, if the breach
involves more than 500,000 records, then a nation-wide media release must be made and hence, a public
privacy breach disclosure by the company is mandatory. However, as the breach notification laws vary
from state to state and companies generally do not disclose all the specific states that were affected by a
breach, from a research perspective, it is difficult to determine whether a public disclosure by the
company was voluntary or mandatory. Going forward, such a task should be easier once a federal
notification law makes its way through congress. On the whole, given the various state laws state
generally require the firm to disclose the breach to their clients, the majority of public breach disclosures
are likely mandatory disclosures. Moreover, on October 13, 2011 the SEC issued guidance mandating that
material cyber breaches be disclosed in the MD&A of financial statements (SEC 2011). In addition to
state notification laws, the following U.S. legislation has implications for information privacy practices:
the Health Insurance Portability and Accountability Act (HIPAA) mandates how health information
should be protected; the Gramm-Leach-Bliley Act (GLBA) regulates the use of information obtained by
financial institutions; the Family Educational Rights and Privacy Act (FERPA) governs the access to
student educational records; the Fair and Accurate Credit Transactions Act regulates the disposal of
consumer information; the U.S.A. Patriot Act mandates all U.S. businesses to disclose customer
information to law enforcement initiatives; and The Identity Theft Penalty Enhancement Act sets forth
that acquiring unauthorized personal information is a federal crime.
35
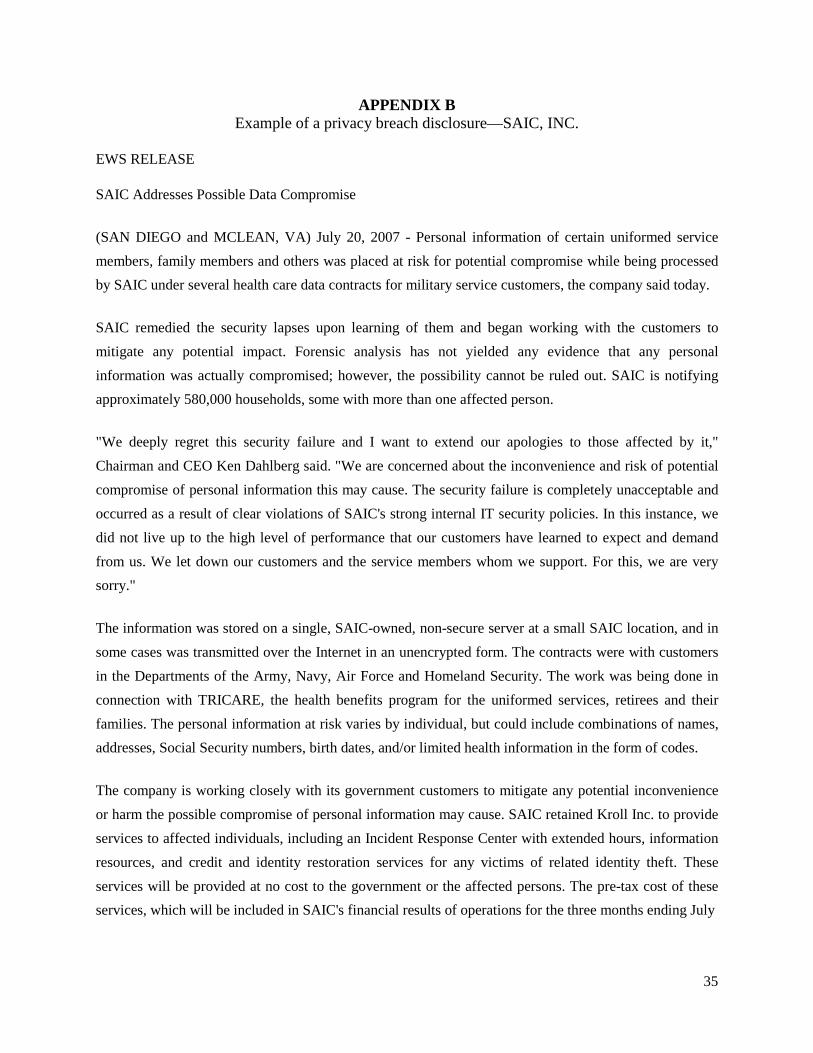
APPENDIX B Example of a privacy breach disclosure—SAIC, INC.
EWS RELEASE
SAIC Addresses Possible Data Compromise
(SAN DIEGO and MCLEAN, VA) July 20, 2007 - Personal information of certain uniformed service members, family members and others was placed at risk for potential compromise while being processed by SAIC under several health care data contracts for military service customers, the company said today.
SAIC remedied the security lapses upon learning of them and began working with the customers to mitigate any potential impact. Forensic analysis has not yielded any evidence that any personal information was actually compromised; however, the possibility cannot be ruled out. SAIC is notifying approximately 580,000 households, some with more than one affected person.
"We deeply regret this security failure and I want to extend our apologies to those affected by it," Chairman and CEO Ken Dahlberg said. "We are concerned about the inconvenience and risk of potential compromise of personal information this may cause. The security failure is completely unacceptable and occurred as a result of clear violations of SAIC's strong internal IT security policies. In this instance, we did not live up to the high level of performance that our customers have learned to expect and demand from us. We let down our customers and the service members whom we support. For this, we are very sorry."
The information was stored on a single, SAIC-owned, non-secure server at a small SAIC location, and in some cases was transmitted over the Internet in an unencrypted form. The contracts were with customers in the Departments of the Army, Navy, Air Force and Homeland Security. The work was being done in connection with TRICARE, the health benefits program for the uniformed services, retirees and their families. The personal information at risk varies by individual, but could include combinations of names, addresses, Social Security numbers, birth dates, and/or limited health information in the form of codes.
The company is working closely with its government customers to mitigate any potential inconvenience or harm the possible compromise of personal information may cause. SAIC retained Kroll Inc. to provide services to affected individuals, including an Incident Response Center with extended hours, information resources, and credit and identity restoration services for any victims of related identity theft. These services will be provided at no cost to the government or the affected persons. The pre-tax cost of these services, which will be included in SAIC's financial results of operations for the three months ending July

36
APPENDIX B (continued)
31, 2007, is estimated to be in the range of $7 million to $9 million, excluding costs for credit restoration services if any related identity theft occurs.
"Our focus is on offering services and support to those who may be affected by the potential compromise of their information," according to Arnold Punaro, Executive Vice President, the company official leading the support effort.
The company has responded to this situation in a comprehensive way by taking the following actions:
• conducted a detailed forensic analysis of the server and data, which included assistance from some of the company's and the government's top experts in computer security;
• launched an internal investigation using outside counsel to determine exactly how this security failure occurred and placed a number of employees on administrative leave pending the outcome of the investigation;
• established a company-wide task force to ensure that the company responsibly addresses any adverse impact on the company's customers and any affected individuals;
• initiated a systematic, company-wide assessment to assure that such lapses do not exist elsewhere in the company and determine whether any changes in policy, methods, tools and monitoring are needed to make sure that such a lapse does not recur.
SAIC is a leading provider of scientific, engineering, systems integration and technical services and solutions to all branches of the U.S. military, agencies of the Department of Defense, the intelligence community, the U.S. Department of Homeland Security and other U.S. Government civil agencies, as well as to customers in selected commercial markets. With more than 44,000 employees in over 150 cities worldwide, SAIC engineers and scientists solve complex technical challenges requiring innovative solutions for customers' mission-critical functions. SAIC had annual revenues of $8.3 billion for its fiscal year ended January 31, 2007. SAIC: FROM SCIENCE TO SOLUTIONS™
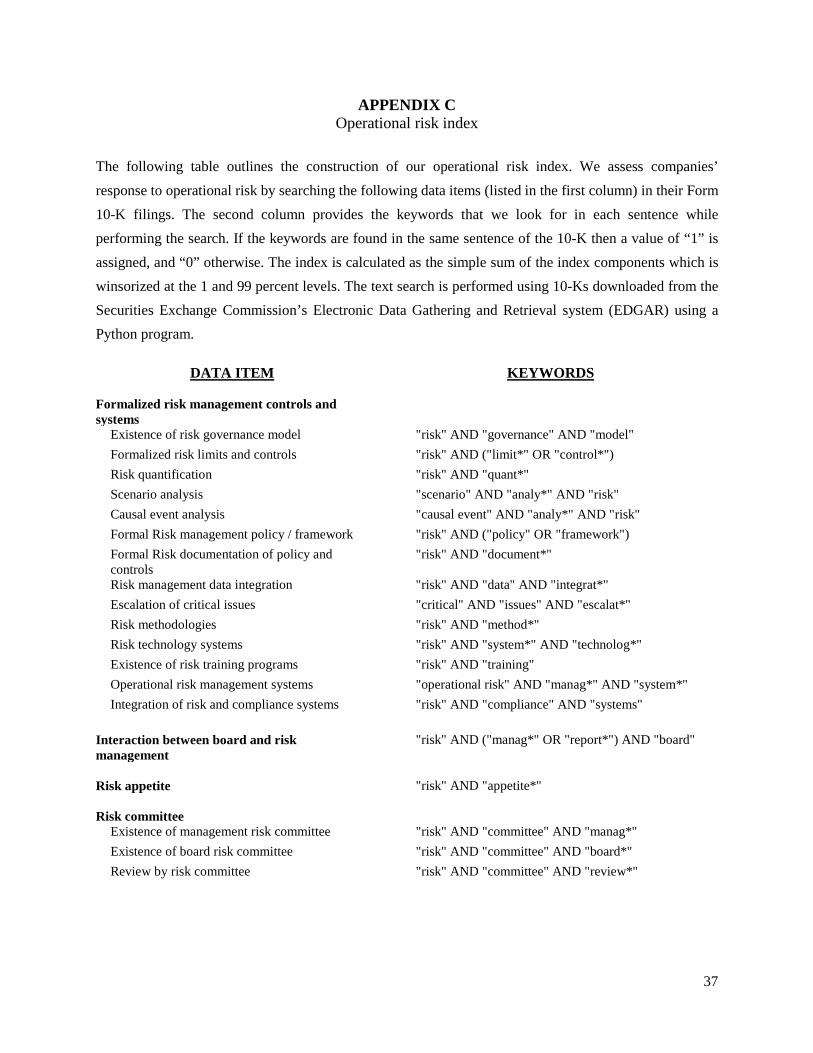
37
APPENDIX C Operational risk index
The following table outlines the construction of our operational risk index. We assess companies’ response to operational risk by searching the following data items (listed in the first column) in their Form 10-K filings. The second column provides the keywords that we look for in each sentence while performing the search. If the keywords are found in the same sentence of the 10-K then a value of “1” is assigned, and “0” otherwise. The index is calculated as the simple sum of the index components which is winsorized at the 1 and 99 percent levels. The text search is performed using 10-Ks downloaded from the Securities Exchange Commission’s Electronic Data Gathering and Retrieval system (EDGAR) using a Python program.
DATA ITEM KEYWORDS Formalized risk management controls and systems
Existence of risk governance model "risk" AND "governance" AND "model"
Formalized risk limits and controls "risk" AND ("limit*" OR "control*")
Risk quantification "risk" AND "quant*"
Scenario analysis "scenario" AND "analy*" AND "risk"
Causal event analysis "causal event" AND "analy*" AND "risk"
Formal Risk management policy / framework "risk" AND ("policy" OR "framework")
Formal Risk documentation of policy and controls
"risk" AND "document*"
Risk management data integration "risk" AND "data" AND "integrat*"
Escalation of critical issues "critical" AND "issues" AND "escalat*"
Risk methodologies "risk" AND "method*"
Risk technology systems "risk" AND "system*" AND "technolog*"
Existence of risk training programs "risk" AND "training"
Operational risk management systems "operational risk" AND "manag*" AND "system*"
Integration of risk and compliance systems "risk" AND "compliance" AND "systems"
Interaction between board and risk management
"risk" AND ("manag*" OR "report*") AND "board"
Risk appetite
"risk" AND "appetite*"
Risk committee
Existence of management risk committee "risk" AND "committee" AND "manag*"
Existence of board risk committee "risk" AND "committee" AND "board*"
Review by risk committee "risk" AND "committee" AND "review*"

38
APPENDIX C (continued)
Risk culture and oversight
Organization recognizes a specific risk management culture
"risk" AND "culture"
Organization recognizes importance of risk oversight
"risk" AND ("oversight" OR "governance")
CRO
Existence of CRO "chief risk officer" OR "CRO"
Management or board interaction with CRO "chief risk officer" OR "CRO" AND ("board" OR "manag*)
ERM
Existence of ERM "enterprise risk management" OR "ERM"
Management or board involvement with ERM "enterprise risk management" OR "ERM" AND ("board" OR "manag*)
Interaction between compensation /incentives and risk
"risk" AND ("compensation" OR "incentive")
Data management
Data integrity issues "data" AND ("integrity" OR "risk")
Data governance "data" AND "governance"
Data management / maintenance "data" AND ("manag*" OR "maintain*)
Data controls / checks "data" AND ("control*" OR "check*)
Data standards "data" AND "standards"
Data process architecture "data" AND "process"
Risk data quality "data" AND "quality"
Formal risk reporting
Risk reporting "risk" AND "report*"
Risk dashboard "risk" AND "dashboard"
Board received risk reporting "risk" AND "report*" AND "board"
Management received risk reporting "risk" AND "report*" AND "manag*"
CEO received risk reporting "risk" AND "report*" AND "CEO" OR "chief risk officer"
Types of risk information reporting
Operational failures "operation*" AND ("failure*" OR "risk")
Sensitivity analyses "sensitivity" AND ("test" OR "analy*") AND "risk"
Risk exceptions "risk" AND "exception*"
Business continuity "business" AND "continuity"
Fraud risk "fraud" AND "risk"
IT risk ("IT" OR "Information Technology") AND "risk"
Customer risk "customer*" AND "risk"
Privacy breaches "privacy" OR "privacy breach OR "identity" OR "identity theft"
Reputation risk "reputation" AND "risk"

39
APPENDIX D Variable definitions
RESTATEi,t,t+1 = “1” if the firm reported a material restatement due to an error in fiscal year t or year t+1, and “0” otherwise;
SEC_COMMENTi,t,t+1 = “1” if the firm received an SEC Comment Letter in fiscal year t or year t+1, and “0” otherwise;
BREACHi,t-Δ = “1” if the firm reported a privacy breach after releasing fiscal year t-1’s annual financial statements, but before releasing fiscal year t’s annual financial statements, and “0” otherwise;
OPRISK_INDEX i,t-1 = Score from operational control risk index in fiscal year t-1, the calculation of the index is outlined in Appendix C;
SOX404i,t = “1” if the firm had a SOX 404 material internal control weakness over financial reporting during the fiscal year t, and “0” otherwise;
SIZEi,t = Natural logarithm of the firm’s market capitalization as of year t’s fiscal year-end;
FIRM_AGEi,t = Natural logarithm of one plus the number of years the firm has COMPUSTAT data as of year t’s fiscal year-end;
LOSSi,t = “1” if net income before extraordinary items is less than zero in fiscal year t, and “0” otherwise;
SEGMENTSi,t = Natural logarithm of one plus the number of operating and geographic segments as of year t’s fiscal year-end;
ACQ_VALUEi,t = The aggregate dollar value of acquisitions that the acquired company in the fiscal year t-1, scaled by market capitalization as of fiscal year-end t;
GROWTHi,t = Quintiles of year-over-year sales growth in fiscal year t, and “0” otherwise;
RESTRUCTi, t = The aggregate restructuring charges in the fiscal years t and t-1, scaled by market capitalization as of year t’s fiscal year-end;
LEVERAGEi,t = Debt divided by total assets as of year t’s fiscal year-end; BIG4i,t = “1” if the client has a Big 4 auditor in fiscal year t, and “0” otherwise;
SPECIALISTi,t = “1” if the firm’s auditor has the highest market share in the client’s industry, measured using audit fees in fiscal year t, and “0” otherwise;
BREACH_RISKi = The natural logarithm of the number of breaches in the firm’s industry, to control for the inherent privacy breach risk of the firm’s industry;
LOGFEESi,t = Natural logarithm of total audit fees in the fiscal year t; ATURNi,t = Sales in fiscal year t divided by total assets as of fiscal year t’s year-
end; EXPORTi,t = Total sales from foreign segments scaled by total sales in the fiscal
year t; ABSEXTRAi,t = Absolute value of extraordinary items in fiscal year t scaled by total
assets as of fiscal t’s year-end; ROAi,t = Net income in the fiscal year t scaled by total assets as of fiscal year t’s
year-end; DEC_YRENDi,t = “1” if the company has a December 31st year end in fiscal year t, and
“0” otherwise; OPINIONi,t = “1” if the company received an auditor going concern opinion, and “0”
otherwise; and, STD_ROAi,t = Standard deviation for annual ROAi,t in years t, t-1 and t-2.
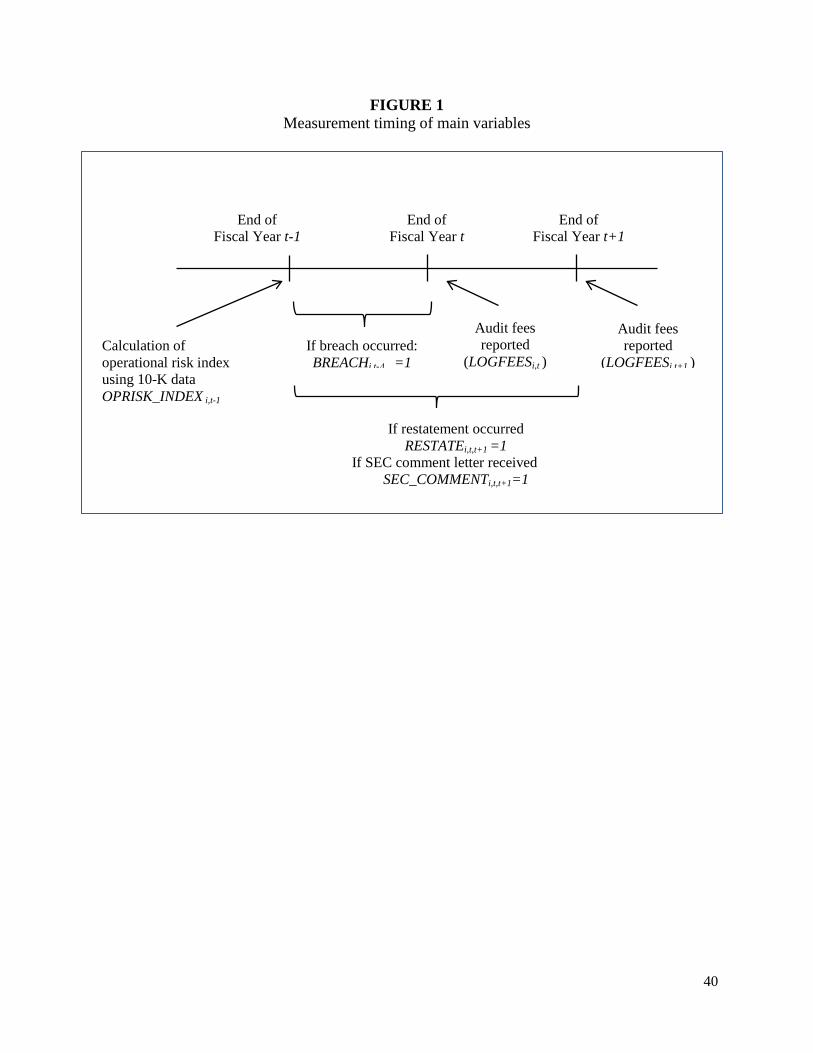
40
FIGURE 1 Measurement timing of main variables
End of Fiscal Year t-1
End of Fiscal Year t
End of Fiscal Year t+1
If breach occurred: BREACHi,t-Δ =1
If restatement occurred RESTATEi,t,t+1 =1
If SEC comment letter received SEC_COMMENTi,t,t+1=1
Audit fees reported
(LOGFEESi,t )
Audit fees reported
(LOGFEESi,t+1 )
Calculation of operational risk index using 10-K data OPRISK_INDEX i,t-1

41
TABLE 1 Sample Selection
Start Date Final Date Breach Obs. Total Obs. Public firms in breach file from ITRC 12-Feb-05 28-Oct-13 712
Merge with COMPUSTAT firms
FYR 2004 FYR 2013 457 71,709 Total Assets, GVKEY and CIK
Merge with Audit Analytics FYR 2004 FYR 2013 398 34,493
Keep only years with breaches and FYR 2005 FYR 2012 381 30,734
data available for control variables
Observations used in main analyses
381 30,734 using BREACHi,t-Δ variable
Observations used in main analyses
25,248 using operational risk index
The breach data is obtained with permission from the Identity Theft Resource Center (ITRC). The ITRC database includes information pertaining to the type of breach, the estimated date that the breach occurred, the date the breach was disclosed, and when available, the number of individual records that were compromised. The sample period begins in January 2005, as the sample is restricted by ITRC’s data, and continues until the end of fiscal year 2012. The total number of breaches reported by all organizations during calendar years 2005 to 2013, per the ITRC’s records, is 3,632. Of those breaches, we identified 381 public companies or subsidiaries of public companies that have necessary data availability for our dependent and control variables in COMPUSTAT and Audit Analytics. The number of breaches in each fiscal year is as follows: 22 in 2005, 32 in 2006, 47 in 2007, 64 in 2008, 55 in 2009, 74 in 2010, 46 in 2011, and 41 in 2012. The operational risk data is based on textual analysis of 10-K filings in the SEC EDGAR database of all publicly-listed companies from 2004 to 2011. The operational risk index calculation is described in Appendix C.

42
TABLE 2
Descriptive Statistics
Variables
(1) All Obs. Mean
(St. Dev.)
(2) BREACHi,t-Δ =0
Mean (St. Dev.)
(3) BREACHi,t-Δ =1
Mean (St. Dev.)
(4) Difference Mean 3 – 2 (t-statistic)
OPRISK_INDEX i,t-1 3.480 3.475 3.905 0.431*** (0.68) (0.68) (0.77) (10.31) RESTATEi,t,t+1 0.132 0.132 0.136 0.004 (0.34) (0.34) (0.34) (0.24) SEC_COMMENTi,t,t+1 0.568 0.566 0.732 0.166*** (0.50) (0.50) (0.44) (7.25) LOGFEESi,t 14.011 13.993 15.433 1.439*** (1.17) (1.15) (1.26) (22.14) SOX404i,t 0.062 0.062 0.045 -0.017 (0.24) (0.24) (0.21) (-1.62) SIZEi,t 6.831 6.805 8.948 2.143*** (1.73) (1.71) (1.89) (21.98) FIRM_AGEi,t 2.764 2.759 3.175 0.417*** (0.72) (0.72) (0.69) (11.62) LOSSi,t 0.253 0.255 0.139 -0.116*** (0.43) (0.44) (0.35) (-6.44) SEGMENTSi,t 1.199 1.198 1.258 0.060* (0.60) (0.60) (0.64) (1.81) ACQ_VALUEi,t 0.021 0.021 0.019 -0.002 (0.06) (0.06) (0.05) (-0.66) GROWTHi,t 3.139 3.140 3.045 -0.096 (1.34) (1.34) (1.13) (-1.64) RESTRUCTi, t 0.002 0.002 0.002 0.000 (0.00) (0.00) (0.00) (0.63) LEVERAGEi,t 0.548 0.547 0.672 0.125*** (0.28) (0.28) (0.25) (9.64) BIG4i,t 0.815 0.814 0.940 0.126*** (0.39) (0.39) (0.24) (10.13) SPECIALISTi,t 0.265 0.264 0.357 0.093*** (0.44) (0.44) (0.48) (3.78) ATURNi,t 0.783 0.783 0.803 0.020 (0.72) (0.72) (0.75) (0.52) EXPORTi,t 0.322 0.322 0.311 -0.011 (0.40) (0.40) (0.37) (-0.59) ROAi,t 0.000 -0.000 0.033 0.034*** (0.18) (0.18) (0.10) (6.34) ABSEXTRAi,t 0.002 0.002 0.002 -0.001* (0.01) (0.01) (0.01) (-1.78) BREACH_RISKi,t 2.531 2.523 3.121 0.598*** (1.27) (1.27) (1.07) (10.82)

43
OPINIONi,t 3.480 3.475 3.905 0.431*** (0.68) (0.68) (0.77) (10.31) DEC_YRENDi,t 0.753 0.753 0.759 0.006 (0.43) (0.43) (0.43) (0.26) Observations 30,734 30,353 381 30,734 This table presents descriptive statistics for variables used in the main regression analyses (tables 3 to 5). Variable definitions are included in Appendix D. Column 1 presents the mean and standard deviation of all variables for the full sample. Columns 2 and 3 reports the mean and standard deviation of all variables for subsamples based on partitioning observations by BREACHi,t-Δ =0 and BREACHi,t-Δ =1. Column 4 presents the t-tests of differences in means between the two subsamples (BREACHi,t-Δ =0 and BREACHi,t-Δ =1).

44
TABLE 3 Relation between restatements and operational control risk
(1) (2)
Dependent Variable Dependent Variable
Variables RESTATEi,t,t+1 RESTATEi,t,t+1 BREACHi,t-Δ 0.331**
(2.00) OPRISK_INDEX i,t-1
0.117***
(2.71)
SOX404i,t 2.368*** 2.509***
(40.83) (38.47)
SIZEi,t -0.077*** -0.061***
(-4.49) (-3.02)
FIRM_AGEi,t -0.014 -0.062
(-0.41) (-1.54)
LOSSi,t 0.162*** 0.193***
(3.10) (3.39)
SEGMENTSi,t 0.045 0.059
(1.00) (1.17)
ACQ_VALUEi,t 0.846*** 0.406
(2.73) (1.17)
GROWTHi,t -0.031** -0.026
(-2.01) (-1.54)
RESTRUCTi, t 1.519 -1.120
(0.37) (-0.25)
LEVERAGEi,t 0.307*** 0.147
(3.51) (1.54)
BIG4i,t 0.151** 0.192**
(2.19) (2.56)
SPECIALISTi,t 0.156*** 0.137**
(2.98) (2.43)
BREACH_RISKi,t -0.030 -0.052**
(-1.45) (-2.22)
Constant -1.404*** -1.649***
(-8.40) (-7.90)
Year Fixed Effects Included Included Observations 30,734 25,248 Pseudo R2 0.113 0.117
This table presents the results of the analyses examining the relation between restatements and operational control risk. Variable definitions are included in Appendix D. *, **, *** indicate significance at the 0.10, 0.05, and 0.01 levels, respectively, using two-tailed tests. T-statistics and p-values are calculated using clustered standard errors by firm. For brevity, year-specific intercepts are not reported.
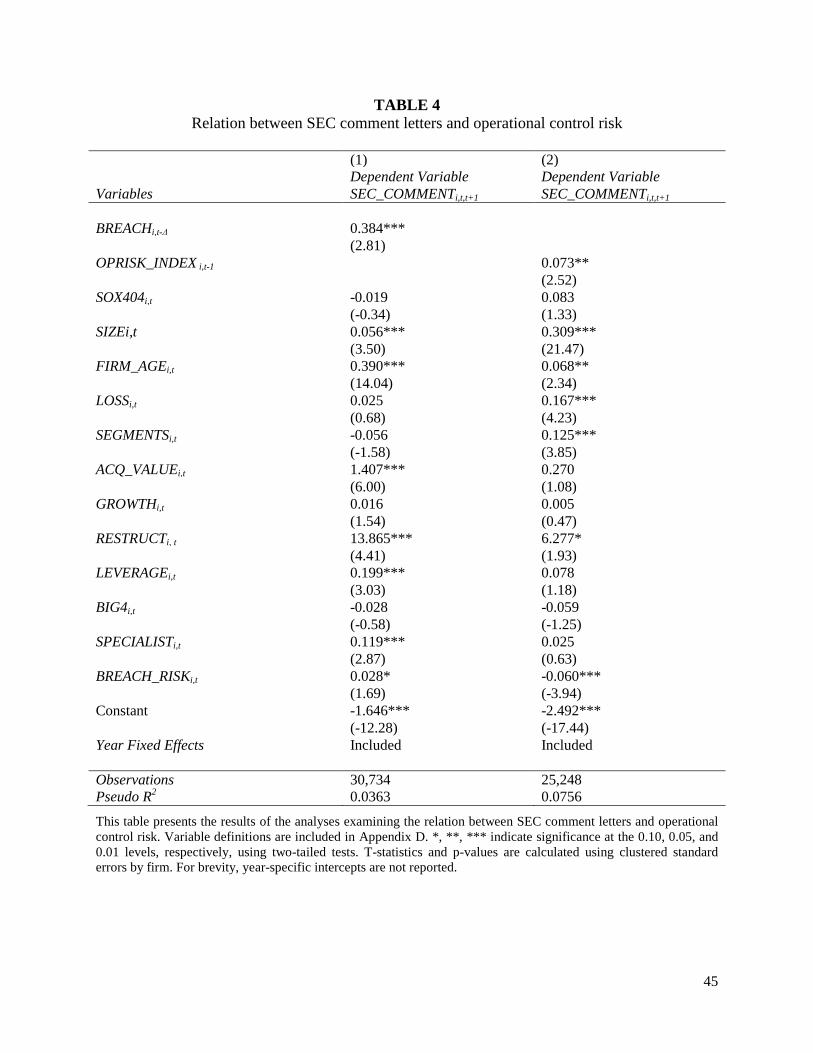
45
TABLE 4 Relation between SEC comment letters and operational control risk
(1) (2) Dependent Variable Dependent Variable Variables SEC_COMMENTi,t,t+1 SEC_COMMENTi,t,t+1 BREACHi,t-Δ 0.384***
(2.81) OPRISK_INDEX i,t-1
0.073**
(2.52) SOX404i,t -0.019 0.083 (-0.34) (1.33) SIZEi,t 0.056*** 0.309*** (3.50) (21.47) FIRM_AGEi,t 0.390*** 0.068** (14.04) (2.34) LOSSi,t 0.025 0.167*** (0.68) (4.23) SEGMENTSi,t -0.056 0.125*** (-1.58) (3.85) ACQ_VALUEi,t 1.407*** 0.270 (6.00) (1.08) GROWTHi,t 0.016 0.005 (1.54) (0.47) RESTRUCTi, t 13.865*** 6.277* (4.41) (1.93) LEVERAGEi,t 0.199*** 0.078 (3.03) (1.18) BIG4i,t -0.028 -0.059 (-0.58) (-1.25) SPECIALISTi,t 0.119*** 0.025 (2.87) (0.63) BREACH_RISKi,t 0.028* -0.060*** (1.69) (-3.94) Constant -1.646*** -2.492*** (-12.28) (-17.44) Year Fixed Effects Included Included
Observations 30,734 25,248 Pseudo R2 0.0363 0.0756
This table presents the results of the analyses examining the relation between SEC comment letters and operational control risk. Variable definitions are included in Appendix D. *, **, *** indicate significance at the 0.10, 0.05, and 0.01 levels, respectively, using two-tailed tests. T-statistics and p-values are calculated using clustered standard errors by firm. For brevity, year-specific intercepts are not reported.

46
TABLE 5 Relation between audit fees and operational control risk
(1) (2) Dependent Variable Dependent Variable Variables LOGFEESi,t LOGFEESi,t BREACHi,t-Δ 0.341***
(6.92) OPRISK_INDEX i,t-1
0.187***
(14.47)
SOX404i,t 0.357*** 0.371***
(14.65) (15.68)
SIZEi,t 0.441*** 0.418***
(68.73) (58.83)
BIG4i,t 0.448*** 0.457***
(20.15) (20.12)
ATURNi,t 0.220*** 0.233*** (16.94) (18.07) EXPORTi,t 0.204*** 0.263*** (7.30) (8.42) LEVERAGEi,t 0.611*** 0.436***
(18.75) (13.15)
ROAi,t -2.941*** -2.872***
(-16.57) (-15.68)
ABSEXTRAi,t 3.653*** 3.545***
(7.82) (7.09)
LOSSi,t 0.140*** 0.165***
(7.75) (8.92)
ROA*LOSSi,t 3.427*** 3.324***
(18.65) (17.68)
SEGMENTSi,t 0.334*** 0.337***
(18.14) (16.46)
SPECIALISTi,t 0.064*** 0.071***
(3.91) (4.22)
DEC_YRENDi,t -0.023 -0.005
(-1.18) (-0.27)
OPINIONi,t 0.080* 0.129***
(1.96) (2.92)
Constant 9.719*** 9.332***
(209.60) (162.06)
Year Fixed Effects Included Included Observations 30,732 25,248 Adj. R2 0.706 0.711
This table presents the results of the analyses examining the relation between audit fees and operational control risk. Variable definitions are included in Appendix D. *, **, *** indicate significance at the 0.10, 0.05, and 0.01 levels, respectively, using two-tailed tests. T-statistics and p-values are calculated using clustered standard errors by firm. For brevity, year-specific intercepts are not reported.

47
TABLE 6 Matched sample analyses
Panel A: Relation between restatements and operational control risk (1) (2) (3) (4) Propensity Score Matching Matching on Size, Industry and Year Dep Var = RESTATEi,t,t+1 Dep Var = RESTATEi,t,t+1 Variables
BREACHi,t-Δ 0.525**
0.657***
(2.05)
(2.62) OPRISK(1/0) i,t-1
0.118**
0.096*
(2.21)
(1.82)
Control Variables Included Included Included Included
Observations 746 24,276 760 24,766 Pseudo R2 0.161 0.118 0.150 0.116 Panel B: Relation between SEC comment letters and operational control risk (1) (2) (3) (4) Propensity Score Matching Matching on Size, Industry and Year Dep Var = SEC_COMMENTi,t,t+1 Dep Var = SEC_COMMENTi,t,t+1 Variables
BREACHi,t-Δ 0.725**
0.559***
(3.86)
(3.07) OPRISK(1/0) i,t-1
0.068**
0.085*
(1.85)
(2.34)
Control Variables Included Included Included Included
Observations 746 24,276 760 24,766 Pseudo R2 0.074 0.075 0.074 0.076

48
Panel C: Relation between audit fees and operational control risk (1) (2) (3) (4) Propensity Score Matching Matching on Size, Industry and Year Dep Var = LOGFEESi,t Dep Var = LOGFEESi,t Variables BREACHi,t-Δ 0.185**
0.225***
(3.23)
(3.69) OPRISK(1/0) i,t-1
0.160**
0.160*
(11.53)
(11.70)
Control Variables Included Included Included Included
Observations 746 24,276 760 24,766 Adj. R2 0.738 0.701 0.726 0.703
This table presents the results of the analyses examining the relation between restatements (Panel A), SEC comment letters (Panel B) and audit fees (Panel C) and operational control risk. Variable definitions are included in Appendix D. *, **, *** indicate significance at the 0.10, 0.05, and 0.01 levels, respectively, using two-tailed tests. T-statistics and p-values are calculated using clustered standard errors by firm. For brevity, control variables and year-specific intercepts are not reported (but are included in the statistical analyses). The samples used in Columns (1) and (2) are comprised of observations matched on propensity score estimated using the determinants model (Equation 3) including BREACH_RISKi,t-1, and the samples used in Columns (3) and (4) are comprised of observations matched on SIZEi,t-1, industry (2-digit SIC), and fiscal year.