is gifted education a bright idea? assessing the impact of
TRANSCRIPT
1 Department of Economics, 204 McElhinney Hall, Houston, TX 77204-5019. Correspondenceshould be made to Imberman at [email protected] or Craig at [email protected]. © 2010 by SaBui, Scott Imberman and Steven Craig. All rights reserved. We would like to thank Aimee Chin,Brian Kovak, Jacob Vigdor and seminar participants at APPAM, University of Maryland andCarnegie Mellon University.
Is Gifted Education a Bright Idea?Assessing the Impact of Gifted and Talented Programs on
Achievement and Behavior
Sa Bui1
Steven G. Craig
Scott Imberman
Department of EconomicsUniversity of Houston
Abstract
In this paper we determine how the receipt of receiving gifted and talented (GT) servicesaffects student outcomes. We identify the causal relationship through a regression discontinuity oneligibility guidelines, and find that for students on the margin of elgibility there is no discernableimpact. While the peers of marginal GT students improves, grades are found to fall by over 2 points,leading us to suspect invidious comparison to explain lack of achievement. We then examine lotteryoutcomes for two magnet schools, and find that despite the wider variety of initial student qualitythat there are no measurable achievement impacts.
April, 2011
2 See Kulik and Kulik (1997) for a review.
I. Introduction
Gifted education has received renewed interest due to the pending reauthorization of the No
Child Left Behind Act (NCLB), in part because some research has shown that NCLB may have
diverted resources from programs such as gifted and talented (GT) programs for high achieving
students (Neal and Schanzenbach, 2010; Rebeck, 2008). The opportunity costs of such resources are
difficult to discern, however, because little is known about the effectiveness of GT programs for the
three million US GT students that receive these services. GT programs might be effective because
either they result in the grouping of students by ability, or because they offer a variety of specialized
resources, including specially trained teachers and a more advanced curriculum. While early
research found that ability grouping was helpful, many of these studies were likely biased due to
unobserved characteristics of students, such as motivation, that simultaneously lead students to be
successful and to be grouped in high ability classrooms.2 Recently, some researchers have tried to
address the bias issue in ability grouping, but with mixed results over a range of students (Argys,
Rees and Brewer, 1996; Betts and Shkolnik, 2000; Epple, Newlon and Romano, 2002; Figlio and
Page, 2002; and Duflo, Dupas and Kremer, forthcoming). Our work here significantly expands the
research scope for understanding gifted and talented programs, as we explicitly address the overall
effectiveness of GT programs with two unique strategies for overcoming the potential bias issues.
One strategy is a regression discontinuity on the student eligibility border, the other is an analysis
of a GT lottery for magnet students.
Specifically, all fifth grade students in a particular large urban school district in the

2
Southwest (LUSD-SW) have been evaluated since 2007 to determine eligibility for gifted and
talented services starting in 6th grade. Eligibility is identified by a set of well-defined cutoffs on an
index score that is based on achievement tests, a non-verbal ability test, grades, teacher
recommendations, and socio-economic status. We exploit these cutoff scores to set up a regression
discontinuity (RD) design whereby students who score just above the cutoffs are compared to those
who score just below. Under certain conditions, for which we provide evidence that this analysis
meets, our estimates can be interpreted as the causal impact of enrolling in a gifted and talented
program on achievement and behavior. The RD design only evaluates students at the border of
eligibility, thus our estimates are of a local average treatment effect (LATE). This research design
allows us to ascertain the effectiveness of GT programs conditional on how the minimum criteria
for eligibility is set.
The second research strategy that we employ covers the entire range of student ability (as
measured by the school district), but for a small sample. Specifically, two of the middle schools
with magnet GT programs in this school district are over-subscribed. They fill their magnet slots
for students, therefore, by randomly conducting a lottery among students who are eligible for GT
services. This allows us to examine achievement differences between students that win the lottery
and attend the magnet GT schools, and those who lose the lottery and attend neighborhood schools
with GT services. These estimates, therefore, are of the advantage of a magnet GT program that is
pervasive throughout the school compared to a localized program inserted as part of a neighborhood
school.
To our knowledge, only Bhatt (2009) specifically studies the effect of GT programs on
student outcomes, although Davis, Engberg, Epple, Sieg and Zimmer (2010) find that higher income

3 Based on Stanford Achievement Test scores for students within 10 distance units (described inmore detail below) of the eligibility cutoff.
3
parents are more likely to stay in public schools when their children are eligible for GT programs.
While Bhatt finds significant improvements in math achievement, her instrumental variables (IV)
methodology suffers from weak instruments, leaving open the potential that her estimates are biased.
Our work offers a somewhat wider scope of inquiry, and further offers the two distinct identification
strategies. Thus, our study will be the first to establish credibly causal estimates of the impacts GT
programs on student achievement.
The results from our RD analysis, which is a LATE on marginally GT students, is that
students exposed to GT curriculum for the entirety of 6th grade plus half of 7th grade are found to
exhibit no significant improvement in achievement. This is despite substantial increases in average
peer achievement, the likelihood of being placed in advanced classes, and the likelihood of attending
a GT magnet program, and teacher quality in the magnet programs. This is also the case for most
subgroups, although we find evidence of improvements in language for Hispanic students. The
lottery results for the two magnet middle schools also show little improvement in overall 7th grade
achievement, although we generally find that science scores improve relative to students who attend
their neighborhood GT program. In our large urban school district (LUSD), the RD population
corresponds to students for whom the inter-quartile ranges for achievement are between the 69th and
89th percentiles in reading and the 81st and 94th percentiles in math.3 The lottery results suggests the
full range of students is more likely to show positive effects of the GT program, although these
effects seem to be concentrated in science, and not in reading, language, math, or social studies.
There are several pathways through which exposure to a GT curriculum might increase
4 Conversations with school district officials suggests that the curriculum is more likely toinclude more detail, rather than cover the regular curriculum more quickly.
4
achievement. One path is the teacher herself. GT teachers receive additional voluntary training
compared to regular program teachers, and thus may be more motivated by higher achieving
students in addition to any beneficial effects of the training. Additionally, principals may assign GT
classes to teachers who are more effective at generating learning regardless of their credentials.
Further, pertinent to the lottery test, magnet schools for GT programs may offer a more attractive
environment for teachers interested in gifted students, and thus they may have the opportunity to
attract the most effective teachers for this group.
GT program participation could also affect students through peer effects. Students in a GT
classroom will spend that time in the company of other gifted students, and will thus be exposed to
higher achieving peers. For a marginal GT student, however, the peer effect may not necessarily be
positive. That is, a marginal GT student is likely to go from being near the top of the regular class
to being near the bottom of the GT class. If peer effects follow a monotonic model whereby being
surrounded by higher achieving students improves one’s own achievement as found in Imberman,
Kugler and Sacerdote (2010), then this should be helpful. On the other hand the invidious
comparison model, proposed by Hoxby and Weingarth (2006), suggests students may be
demoralized from going from the top of the regular student distribution to the bottom of the GT
student distribution. We present suggestive evidence using course grades that indicates that
invidious comparison may be one important component.
A third pathway is that the GT curriculum itself may be helpful, either because it is more
effective by being targeted, or more stimulating.4 Again for marginal GT students, however, a more
5
advanced curriculum may or may not be helpful depending on the appropriateness of the
qualification threshold. A fourth pathway is that being declared GT may induce parents to take a
more active role in their children’s education. Finally, GT identification could open up access to
different schools through magnet programs. These schools could be of higher quality than others and
they could generate a better student-school match due to the increase in schooling options for the
student. Our results here do not address all of these mechanisms, but nonetheless allow a broader
view at some of them in the context of our overall findings. Specifically, the RD addresses the
LATE for the marginal student, and depending on the school district’s objective no overall effect
may be optimal for the district. Showing that the LATE balances higher achieving peers with lower
grades and lower attendance suggests, without firmly identifying, how some of the mechanisms
trade-off.
The lottery effects are also interesting in this context, as they work on a different margin.
Specifically, the lottery results evaluate the relative effect of magnet GT schools compared to GT
programs in neighborhood schools. We demonstrate that there are significant quality differences
between magnet and neighborhood schools in teachers as well as peers, although some argue that
there are no curricular differences. Unfortunately, we are not able to say whether the small scope
of observable achievement differences is because the advantages in teachers and peers is offset by
invidious comparison or material that is too advanced, or whether standardized achievement tests
are not the appropriate measurement tool.
II. The Gifted and Talented Program in LUSD

5 This could be offset by the extra wages that GT certified teachers receive.
6 For socioeconomic status, students get 5 extra points (out of 100) for having limited Englishproficiency, being classified as special education or being classified as economicallydisadvantaged. Students who are members of a minority group get a further 3 point bonus.
7 Students can reach 16 points from the Stanford Achievement Tests using a variety of differenttest scores across subjects in different combinations. For example a student who is in the 90th
6
LUSD is a very large school district in the Southwestern US with over 200,000 students. In
general, the district is heavily minority and very low income as is the case with most inner-city
districts in the US, although the minority population is more heavily Hispanic rather than African-
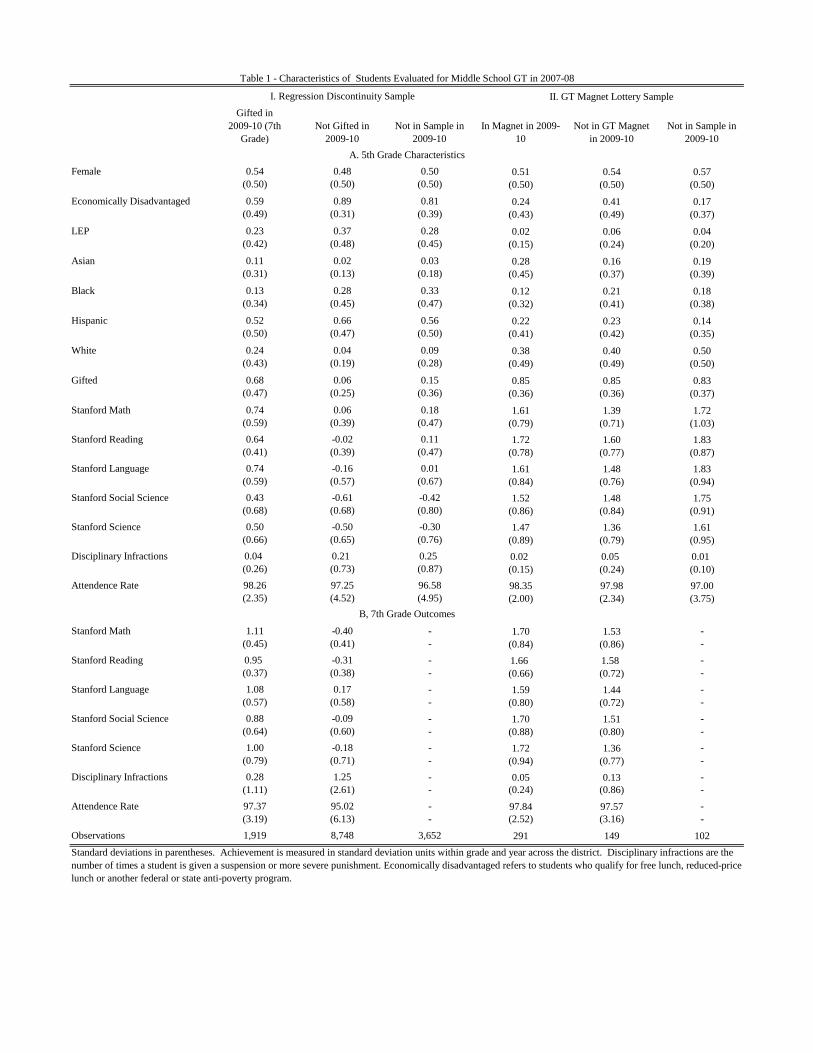
American. Table 1 shows that gifted students in LUSD are less likely to be on free or reduced price
lunch than other students, are more likely to be white, are less likely to have limited English
proficiency, and perform better on both cognitive and non-cognitive measures of output. Schools
in LUSD also have a potential incentive for attracting gifted students as LUSD provides a funding
boost of 12% over the average daily allotment for a regular student.5
In order to be identified as GT in LUSD, a student must meet the eligibility criteria set forth
in the “gifted and talented identification matrix,” which we will refer to as “the matrix.” A copy of
the matrix for 2009-10 is provided in Figure 1. The matrix converts scores on standardized tests –
Stanford Achievement Test for English speaking students, the Aprenda exam for some Spanish
speaking students with limited English proficiency – scores on the Naglieri non-verbal abilities test
(NNAT), average course grades, teacher recommendations, and indicators for socio-economic status
into an index score we call “total matrix points.” 6
There are two pathways by which students can meet the threshold for GT classification using
the matrix scores. First, they can be identified if they have 56 total matrix points, including at least
16 points from the Stanford Achievement test and 10 points from the NNAT.7 Alternatively, students
percentile in math and the 80th percentile in reading will qualify regardless of science and socialstudies scores. Alternatively a student could meet this requirement by scoring in the 80th
percentile in all four exams. See Figure 1 for details on the score to points conversions. For theNaglieri test a score of 104 (no percentiles are given) would be equivalent to 10 matrix points.
8 All students are also evaluated for GT services in kindergarten, but unfortunately the matrixdata was incomplete prohibiting us from evaluating the GT program in elementary school.
9 One reason for a ‘fuzzy’ specification is because there seem to be a few exceptions to thematrix points. Students who qualify for GT in middle or high school generally keep their statusthrough graduation, although they can be removed from the GT program if they perform poorly.
10 Later we provide evidence that the missing data does not appear to substantially influence ourresults.
7
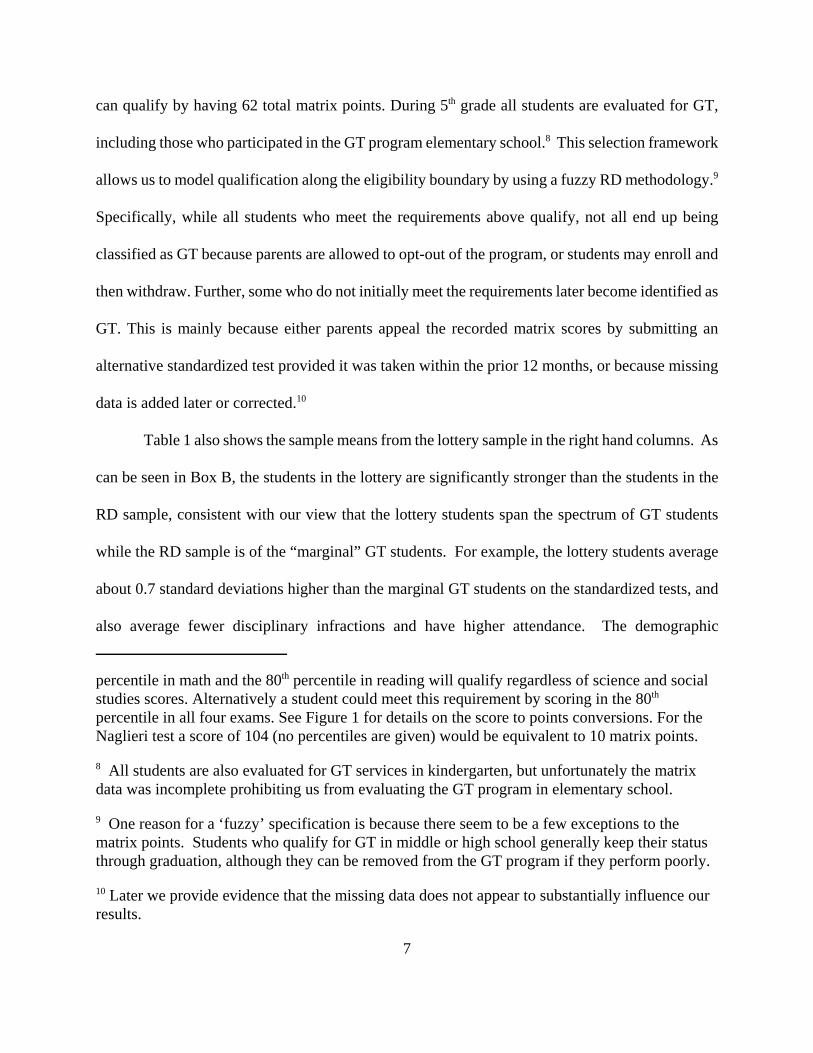
can qualify by having 62 total matrix points. During 5th grade all students are evaluated for GT,
including those who participated in the GT program elementary school.8 This selection framework
allows us to model qualification along the eligibility boundary by using a fuzzy RD methodology.9
Specifically, while all students who meet the requirements above qualify, not all end up being
classified as GT because parents are allowed to opt-out of the program, or students may enroll and
then withdraw. Further, some who do not initially meet the requirements later become identified as
GT. This is mainly because either parents appeal the recorded matrix scores by submitting an
alternative standardized test provided it was taken within the prior 12 months, or because missing
data is added later or corrected.10
Table 1 also shows the sample means from the lottery sample in the right hand columns. As
can be seen in Box B, the students in the lottery are significantly stronger than the students in the
RD sample, consistent with our view that the lottery students span the spectrum of GT students
while the RD sample is of the “marginal” GT students. For example, the lottery students average
about 0.7 standard deviations higher than the marginal GT students on the standardized tests, and
also average fewer disciplinary infractions and have higher attendance. The demographic

8
characteristics of the lottery students also vary from the RD sample. The key element we primarily
take from the lottery sample, however, is the selective attrition rate. That is, of the 542 students that
entered the lottery, 18.8% are not in the school district by 7th grade (and in fact, most attrit in 6th).
This is actually a lower rate than in the RD sample, where 25.5% of the students evaluated in 5th
grade exit by 7th grade. It is not a random sample, however, because Table 1 also shows that lottery
losers are generally of higher achievement than others. As we are unable to follow students who do
not remain in LUSD, we weight our lottery regressions to mimic the original sample of students that
enter the lottery. While much smaller than the RD sample, the lottery sample allows us to examine
the potential returns to the magnet GT schools over the entire range of student quality.
III. Model and Specification
1. GT Program Evaluation Using RD Analysis
The objective of the RD analysis is to estimate a LATE which will differentiate students who
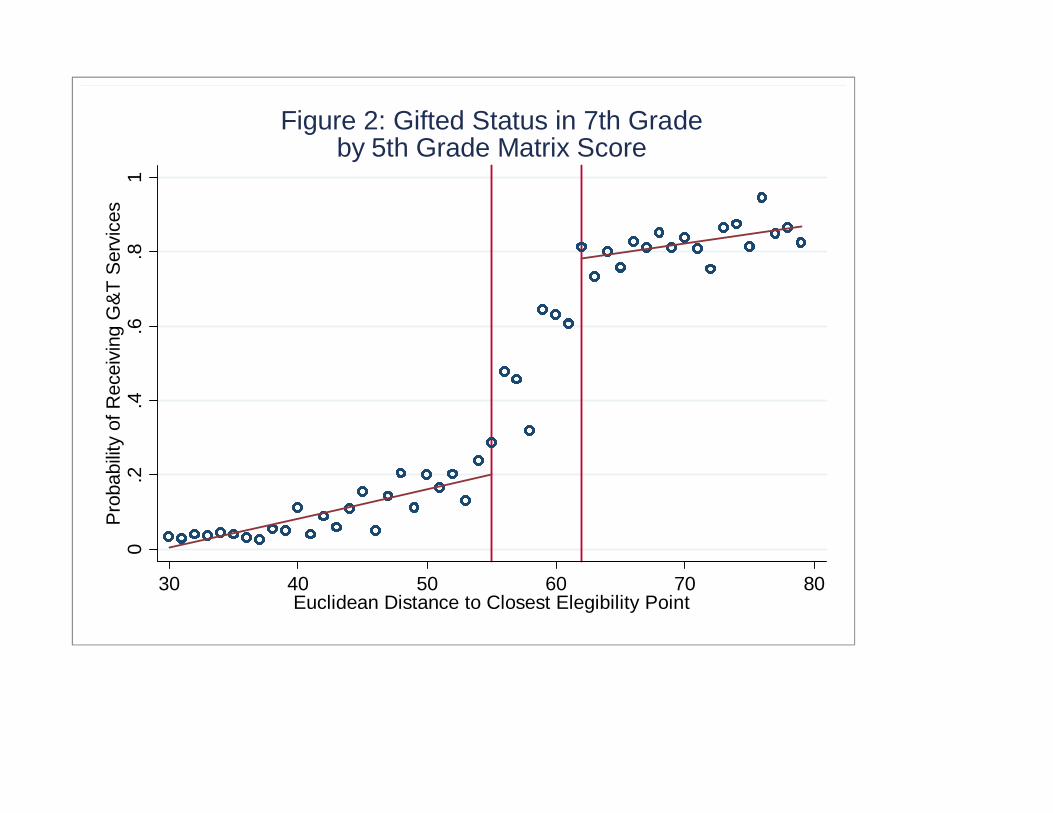
enroll into the GT program from students who do not, but who are otherwise equivalent. Figure 2
shows the increase in GT identification one and two years after evaluation (6th and 7th grade,
respectively) as students’ matrix points increase. The gradual increase up to 28% at the first cutoff
(of students with a matrix score of 56) reflects missing data as well as the District’s appeals process.
Upon reaching the first threshold GT enrollment jumps to around 45%. Enrollment increases further
at a steep rate between the two cutoffs, hitting 79% at the second cutoff (62 matrix points). After
reaching the second cutoff at 62 points, GT enrollment slightly increases further to 82%.

11 We thank Jake Vigdor for this idea.
12 The Euclidean distance is measured as
where irefers to the student’s own score and s refers to the closest integer combination on the surface. We thank Jake Vigdor for first suggesting this method to us.
9
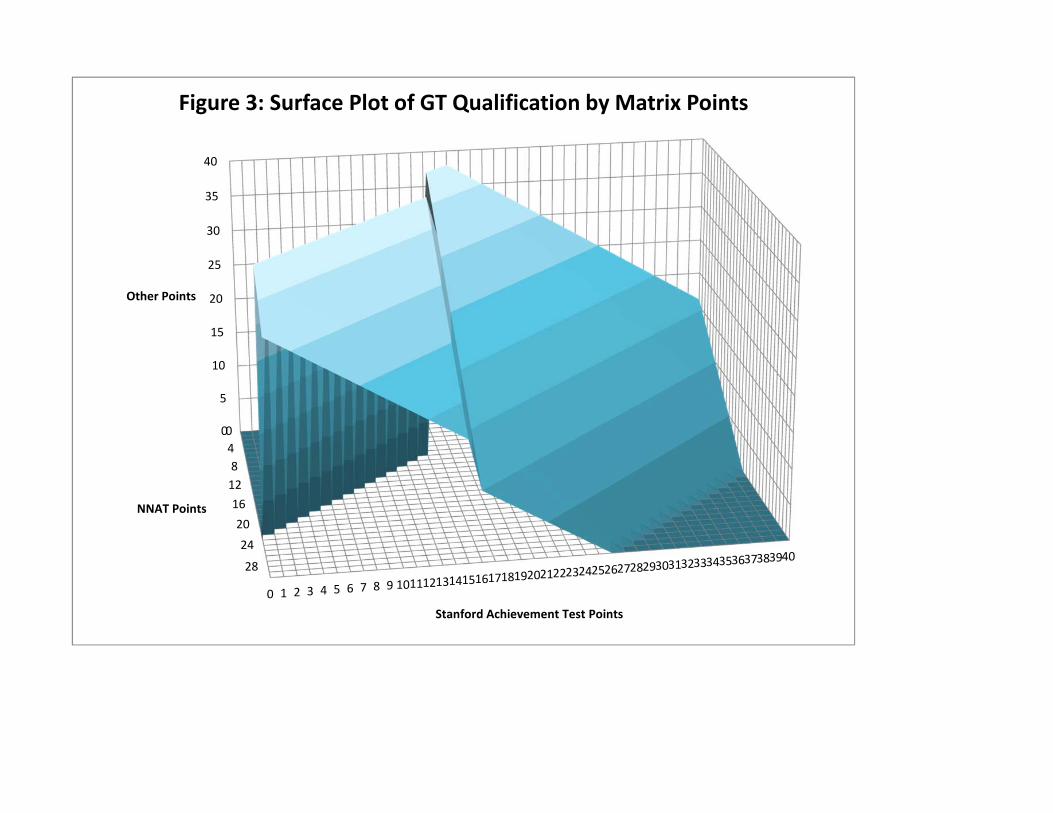
Given that the increase in GT over this range, while steep, is not discontinuous, we convert
the two thresholds into a single cutoff.11 To do this we map the matrix scores into three-dimensional
space as shown in Figure 3. Each axis reflects one of the three portions of the matrix score that
determines eligibility – NNAT points, Stanford points, and other points. Students who are on or
above the surface are eligible for GT while those below or behind are ineligible. We then take the
Euclidean distance from each student’s total matrix points to the nearest integer combination on the
surface.12 The resulting value, which we call the distance to the qualification threshold, equals zero
if the student just barely qualifies for GT. Figure 4 shows GT enrollment as a function of distance
from the GT Euclidean threshold. Students just below the cutoff have about a 25% likelihood of
being in GT, however students just above the threshold have a likelihood of approximately 79%.
Since qualification for GT via the observed matrix score does not translate perfectly with
enrollment in GT due appeals, substitute exams, and data issues, our estimation strategy uses a
“fuzzy RD” model where we conduct a two-stage least squares regression within a range of values
that includes the cutoff (Hahn, Todd and Van der Klaauw, 2001; Lee and Lemieux, 2009). For most
of this paper we will use ten matrix points below and above the cutoff for our bandwidth since the
relationship between distance and gifted status is close to linear over this range, allowing us to use
a linear smoother. Nonetheless, we will show later that our results are not sensitive to the choice of
bandwidth or smoother. Hence, we estimate the following two-stage least squares (2SLS) model:

13 There are 8 GT magnet middle schools in total (out of 38 middle schools), but only two areover-subscribed. By seventh grade, of the 109 lottery losers, 13 end up in one of the lotterymagnet schools, and 8 in the other, while only 5 attend one of the other six GT magnet programs. On the other hand, of the 265 lottery winners, 3 attend one of the other six GT magnets by 7th
grade.
10
where Aboveit is an indicator for whether student i in year t has a distance measure above the cutoff,
Distance is the Euclidean distance of the student’s matrix score to the eligibility cutoff, and X is a
set of pre-existing (5th grade) observable characteristics which includes the 5th grade dependent
variable (e.g. lagged achievement), gender, ethnicity, gifted status, and LEP status. GT is an
indicator for whether the student is enrolled in a GT program in year t + k and Y is a test score,
attendance, or disciplinary infractions in that year. Since students are tested in January of each year,
we focus on scores in the second year after evaluation (7th grade) as assessment in the first year will
only provide five months of program exposure, although we also provide estimates for 6th grade.
2. GT Magnet Evaluation Using School Lotteries
LUSD has two GT middle school magnet programs which are over-subscribed, and as a
result the district uses lotteries to allocate the available spaces.13 Specifically, GT eligible students
who do not reside in the school attendance zones are allowed to apply to one magnet school. While
the losers of the lottery will still have the opportunity to receive GT services in their neighborhood
11
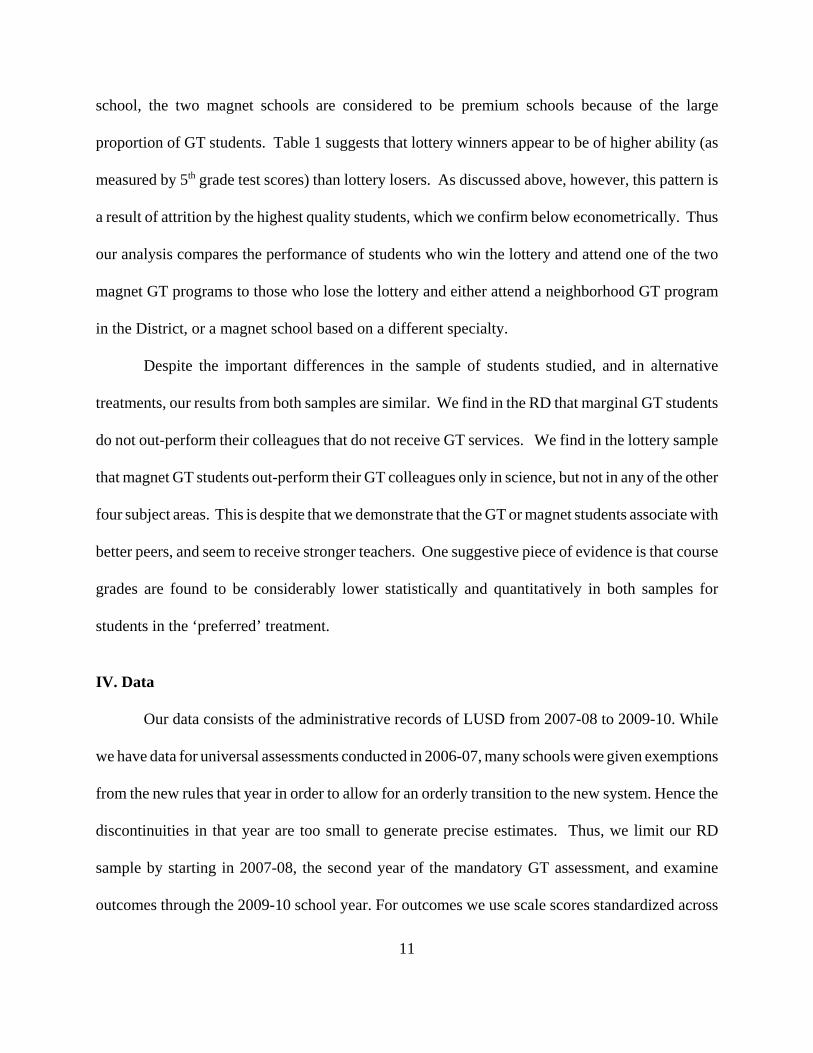
school, the two magnet schools are considered to be premium schools because of the large
proportion of GT students. Table 1 suggests that lottery winners appear to be of higher ability (as
measured by 5th grade test scores) than lottery losers. As discussed above, however, this pattern is
a result of attrition by the highest quality students, which we confirm below econometrically. Thus
our analysis compares the performance of students who win the lottery and attend one of the two
magnet GT programs to those who lose the lottery and either attend a neighborhood GT program
in the District, or a magnet school based on a different specialty.
Despite the important differences in the sample of students studied, and in alternative
treatments, our results from both samples are similar. We find in the RD that marginal GT students
do not out-perform their colleagues that do not receive GT services. We find in the lottery sample
that magnet GT students out-perform their GT colleagues only in science, but not in any of the other
four subject areas. This is despite that we demonstrate that the GT or magnet students associate with
better peers, and seem to receive stronger teachers. One suggestive piece of evidence is that course
grades are found to be considerably lower statistically and quantitatively in both samples for
students in the ‘preferred’ treatment.
IV. Data
Our data consists of the administrative records of LUSD from 2007-08 to 2009-10. While
we have data for universal assessments conducted in 2006-07, many schools were given exemptions
from the new rules that year in order to allow for an orderly transition to the new system. Hence the
discontinuities in that year are too small to generate precise estimates. Thus, we limit our RD
sample by starting in 2007-08, the second year of the mandatory GT assessment, and examine
outcomes through the 2009-10 school year. For outcomes we use scale scores standardized across
14 Ideally one would like to conduct McCrary’s (2008) test. However, by construction thedistance measure has an empty mass between 0 and 1 and -1 and 0 since the smallest distance toanother integer point is 1. Since there is positive mass between integers further out, this couldmistakenly generate a positive result. Hence, instead we test for discontinuities at the two cutoffsin the total matrix points to check for manipulation. In both cases the test is statisticallyinsignificant.
12
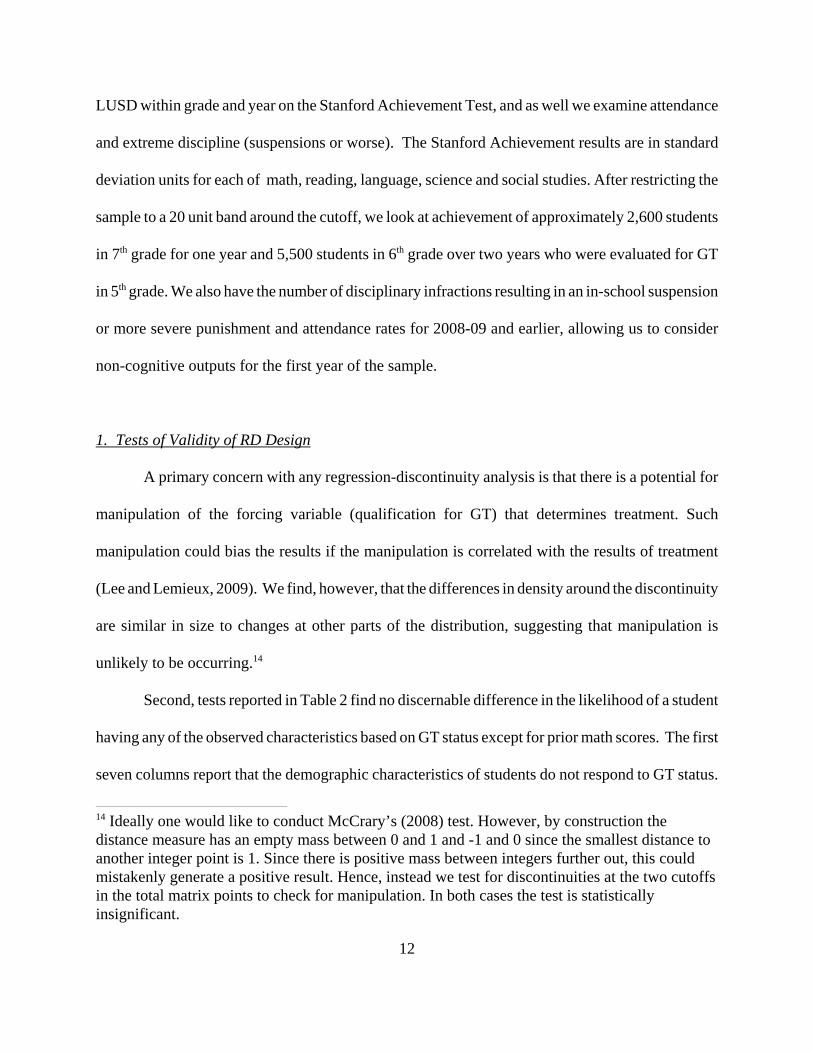
LUSD within grade and year on the Stanford Achievement Test, and as well we examine attendance
and extreme discipline (suspensions or worse). The Stanford Achievement results are in standard
deviation units for each of math, reading, language, science and social studies. After restricting the
sample to a 20 unit band around the cutoff, we look at achievement of approximately 2,600 students
in 7th grade for one year and 5,500 students in 6th grade over two years who were evaluated for GT
in 5th grade. We also have the number of disciplinary infractions resulting in an in-school suspension
or more severe punishment and attendance rates for 2008-09 and earlier, allowing us to consider
non-cognitive outputs for the first year of the sample.
1. Tests of Validity of RD Design
A primary concern with any regression-discontinuity analysis is that there is a potential for
manipulation of the forcing variable (qualification for GT) that determines treatment. Such
manipulation could bias the results if the manipulation is correlated with the results of treatment
(Lee and Lemieux, 2009). We find, however, that the differences in density around the discontinuity
are similar in size to changes at other parts of the distribution, suggesting that manipulation is
unlikely to be occurring.14
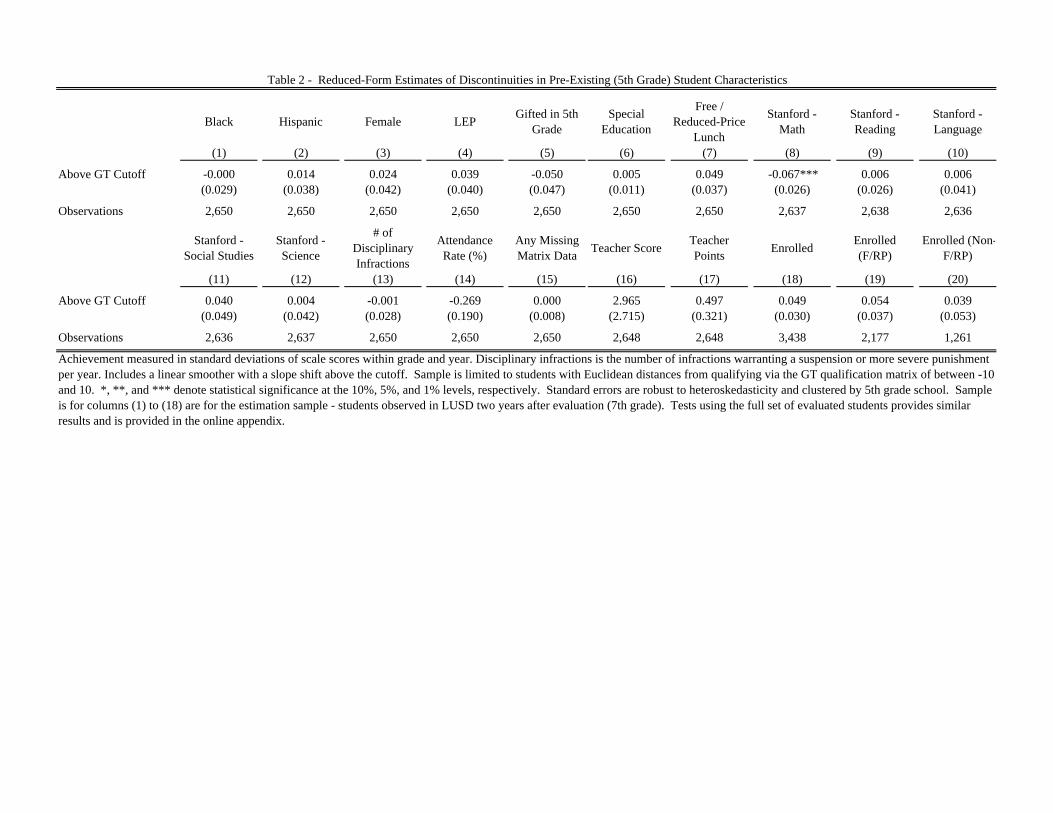
Second, tests reported in Table 2 find no discernable difference in the likelihood of a student
having any of the observed characteristics based on GT status except for prior math scores. The first
seven columns report that the demographic characteristics of students do not respond to GT status.
15 Tests using the 6th grade sample were similar for all measures except for females which show asmall but statistically significant increase.
16 Although teacher recommendations are due before the achievement scores are calculated,district officials informed us that this is a soft deadline and many teachers submitted theirrecommendations late.
13
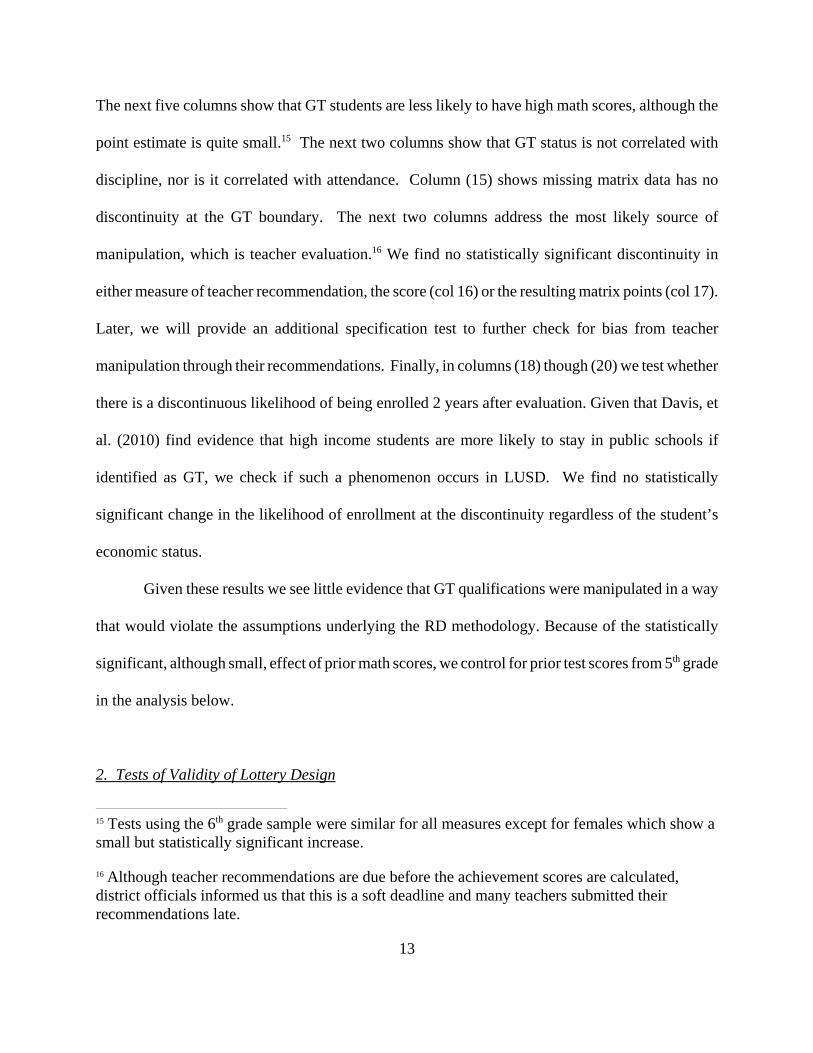
The next five columns show that GT students are less likely to have high math scores, although the
point estimate is quite small.15 The next two columns show that GT status is not correlated with
discipline, nor is it correlated with attendance. Column (15) shows missing matrix data has no
discontinuity at the GT boundary. The next two columns address the most likely source of
manipulation, which is teacher evaluation.16 We find no statistically significant discontinuity in
either measure of teacher recommendation, the score (col 16) or the resulting matrix points (col 17).
Later, we will provide an additional specification test to further check for bias from teacher
manipulation through their recommendations. Finally, in columns (18) though (20) we test whether
there is a discontinuous likelihood of being enrolled 2 years after evaluation. Given that Davis, et
al. (2010) find evidence that high income students are more likely to stay in public schools if
identified as GT, we check if such a phenomenon occurs in LUSD. We find no statistically
significant change in the likelihood of enrollment at the discontinuity regardless of the student’s
economic status.
Given these results we see little evidence that GT qualifications were manipulated in a way
that would violate the assumptions underlying the RD methodology. Because of the statistically
significant, although small, effect of prior math scores, we control for prior test scores from 5th grade
in the analysis below.
2. Tests of Validity of Lottery Design
14
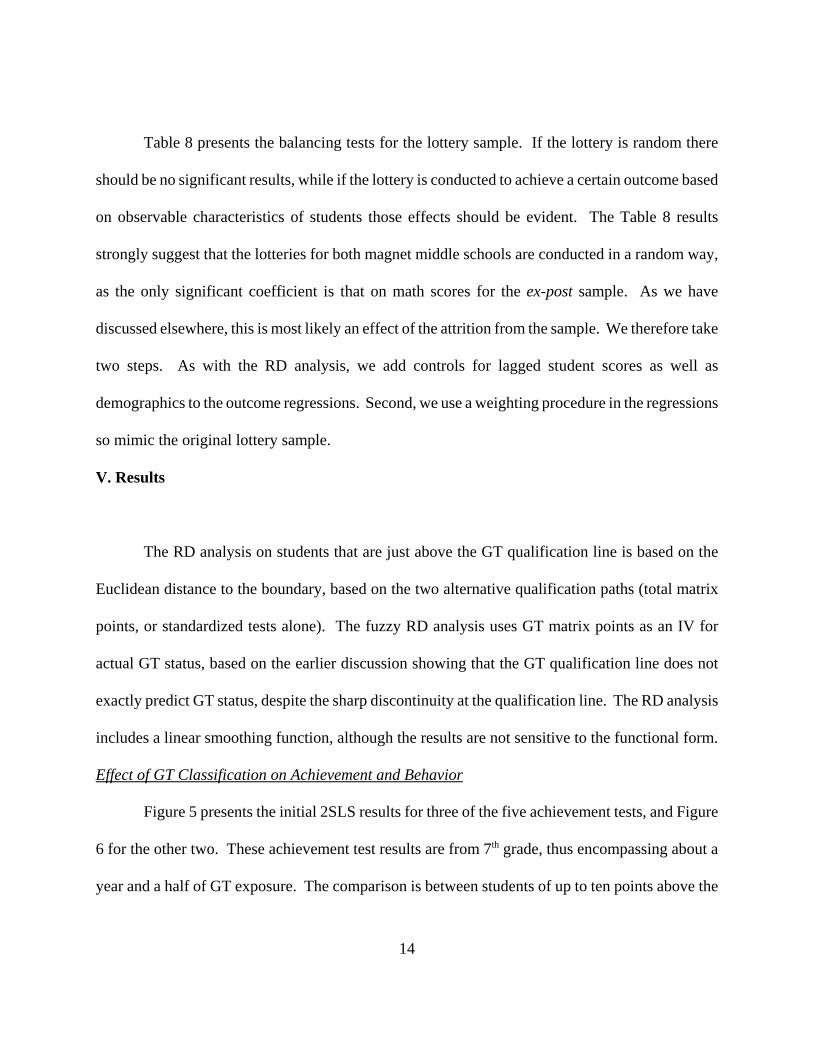
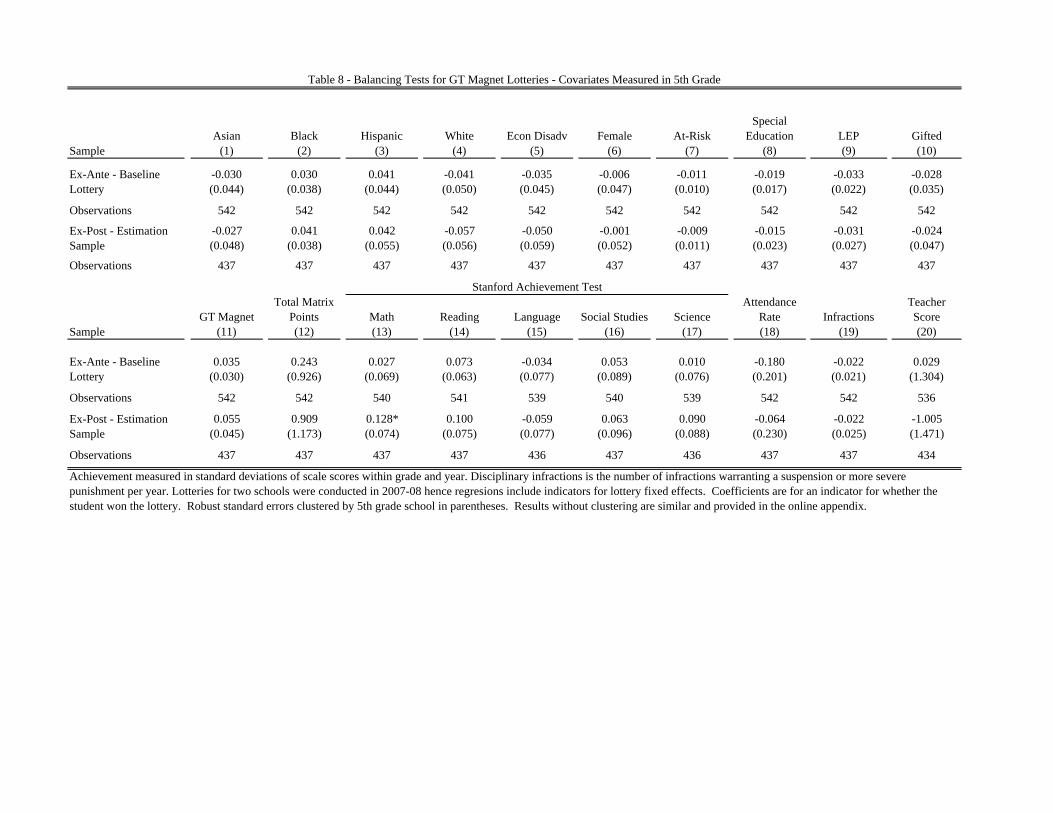
Table 8 presents the balancing tests for the lottery sample. If the lottery is random there
should be no significant results, while if the lottery is conducted to achieve a certain outcome based
on observable characteristics of students those effects should be evident. The Table 8 results
strongly suggest that the lotteries for both magnet middle schools are conducted in a random way,
as the only significant coefficient is that on math scores for the ex-post sample. As we have
discussed elsewhere, this is most likely an effect of the attrition from the sample. We therefore take
two steps. As with the RD analysis, we add controls for lagged student scores as well as
demographics to the outcome regressions. Second, we use a weighting procedure in the regressions
so mimic the original lottery sample.
V. Results
The RD analysis on students that are just above the GT qualification line is based on the
Euclidean distance to the boundary, based on the two alternative qualification paths (total matrix
points, or standardized tests alone). The fuzzy RD analysis uses GT matrix points as an IV for
actual GT status, based on the earlier discussion showing that the GT qualification line does not
exactly predict GT status, despite the sharp discontinuity at the qualification line. The RD analysis
includes a linear smoothing function, although the results are not sensitive to the functional form.
Effect of GT Classification on Achievement and Behavior
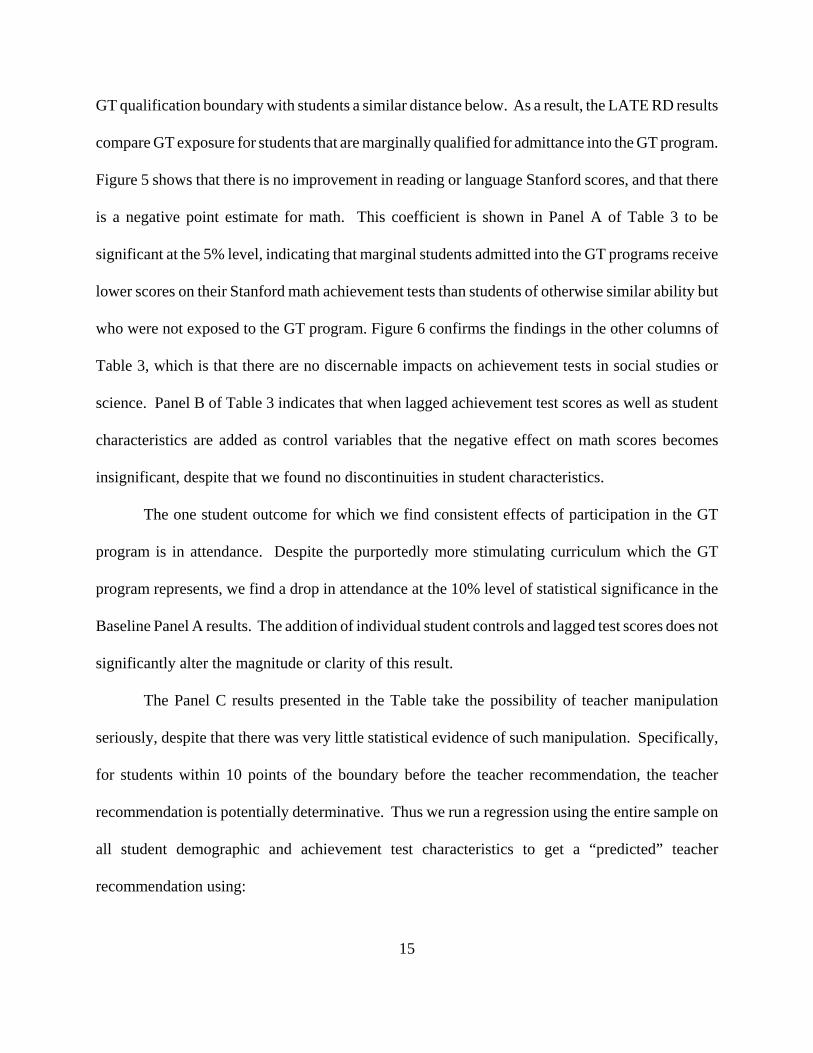
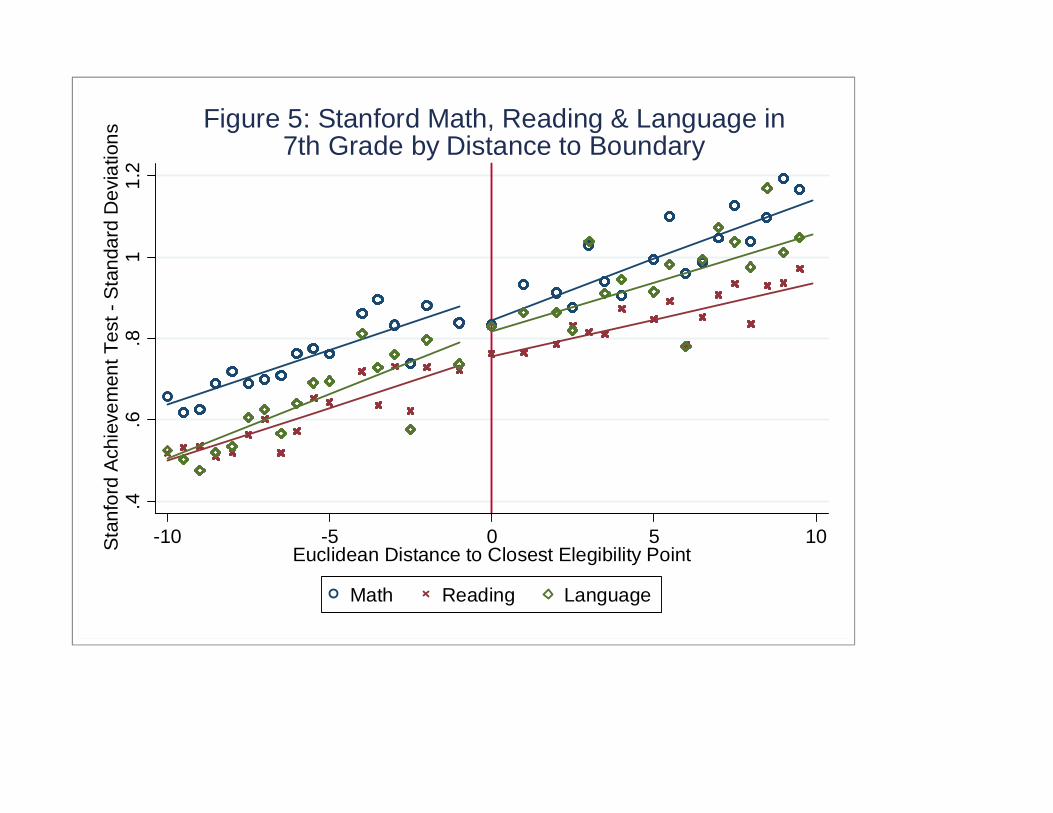
Figure 5 presents the initial 2SLS results for three of the five achievement tests, and Figure
6 for the other two. These achievement test results are from 7th grade, thus encompassing about a
year and a half of GT exposure. The comparison is between students of up to ten points above the
15
GT qualification boundary with students a similar distance below. As a result, the LATE RD results
compare GT exposure for students that are marginally qualified for admittance into the GT program.
Figure 5 shows that there is no improvement in reading or language Stanford scores, and that there
is a negative point estimate for math. This coefficient is shown in Panel A of Table 3 to be
significant at the 5% level, indicating that marginal students admitted into the GT programs receive
lower scores on their Stanford math achievement tests than students of otherwise similar ability but
who were not exposed to the GT program. Figure 6 confirms the findings in the other columns of
Table 3, which is that there are no discernable impacts on achievement tests in social studies or
science. Panel B of Table 3 indicates that when lagged achievement test scores as well as student
characteristics are added as control variables that the negative effect on math scores becomes
insignificant, despite that we found no discontinuities in student characteristics.
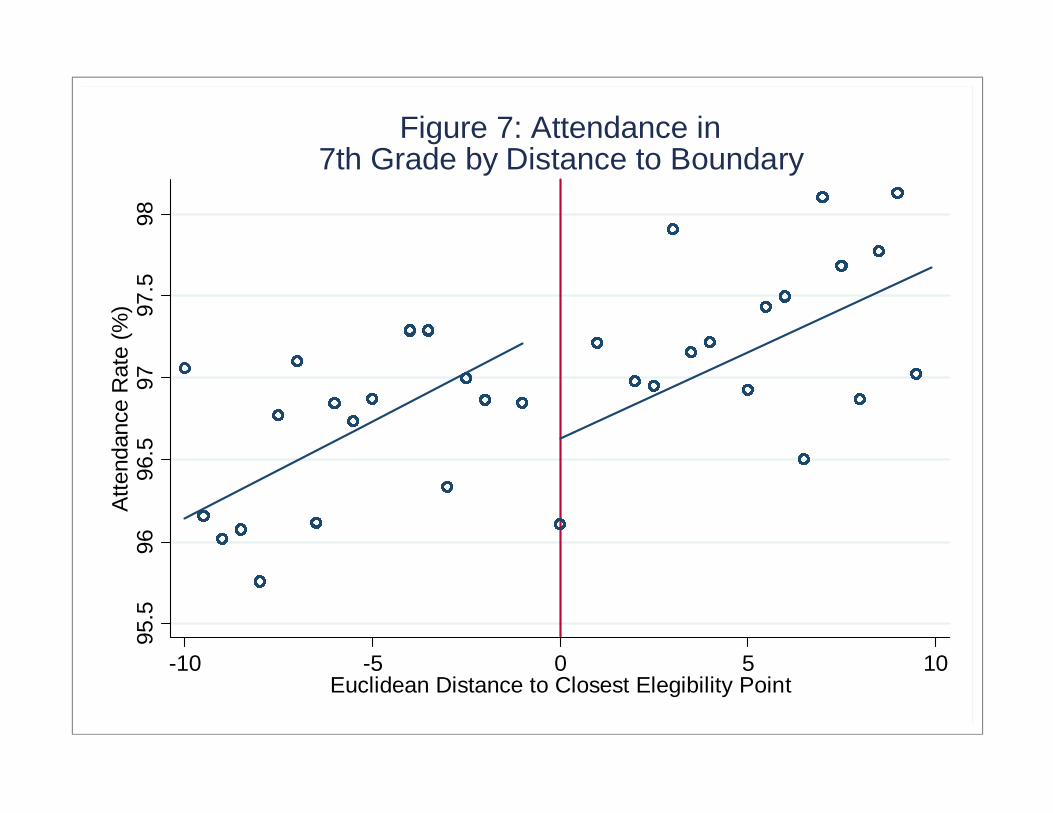
The one student outcome for which we find consistent effects of participation in the GT
program is in attendance. Despite the purportedly more stimulating curriculum which the GT
program represents, we find a drop in attendance at the 10% level of statistical significance in the
Baseline Panel A results. The addition of individual student controls and lagged test scores does not
significantly alter the magnitude or clarity of this result.
The Panel C results presented in the Table take the possibility of teacher manipulation
seriously, despite that there was very little statistical evidence of such manipulation. Specifically,
for students within 10 points of the boundary before the teacher recommendation, the teacher
recommendation is potentially determinative. Thus we run a regression using the entire sample on
all student demographic and achievement test characteristics to get a “predicted” teacher
recommendation using:

16
where TotalPoints is the student’s final score on the GT qualification matrix, StanfordPoints are the
number of matrix points received from performance on Stanford Achievement Tests, NNATPoints
are matrix points from the non-verbal abilities test, ObstaclePoints are matrix points from
socioeconomic status, and GradePoints are matrix points from the student’s average grades in 5th
grade. The point of this test is to remove the influence of the student’s own teacher recommendation
from the total matrix score, in case a teacher knows how close a student is to the qualification
boundary. The Panel C results show that the only result that is sensitive to this change is that on
attendance, where the otherwise negative coefficient we observe becomes positive, although
insignificant at conventional levels. This evidence combined with the lack of a discontinuity in
teacher scores shown in Table 3 suggests that teacher manipulation of recommendations is not
affecting our results.
Impacts of GT on Student Subgroups
To test for heterogeneity in program impacts across student characteristics, Table 4 provides
2SLS estimates for 7th grade for various student populations. In general, we find little evidence of
differences by gender, demographics, or economic status. The only distinction is that we find women
and Black students who are in the GT program are likely to have lower attendance than their
otherwise similar counterparts that are not in a GT program, while for other groups we see no effects
on attendance. Thus one possibility is that the weak attendance results in the overall table is because
the impact is relevant only for these particular students.
17
Specification Tests
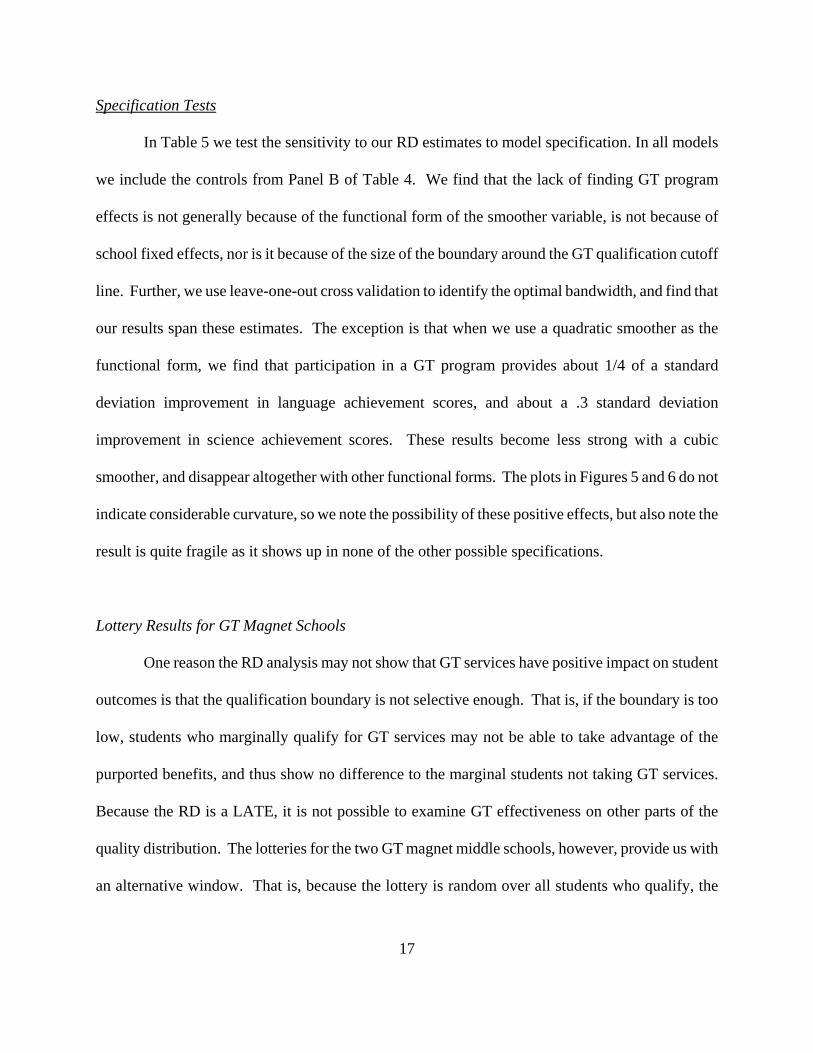
In Table 5 we test the sensitivity to our RD estimates to model specification. In all models
we include the controls from Panel B of Table 4. We find that the lack of finding GT program
effects is not generally because of the functional form of the smoother variable, is not because of
school fixed effects, nor is it because of the size of the boundary around the GT qualification cutoff
line. Further, we use leave-one-out cross validation to identify the optimal bandwidth, and find that
our results span these estimates. The exception is that when we use a quadratic smoother as the
functional form, we find that participation in a GT program provides about 1/4 of a standard
deviation improvement in language achievement scores, and about a .3 standard deviation
improvement in science achievement scores. These results become less strong with a cubic
smoother, and disappear altogether with other functional forms. The plots in Figures 5 and 6 do not
indicate considerable curvature, so we note the possibility of these positive effects, but also note the
result is quite fragile as it shows up in none of the other possible specifications.
Lottery Results for GT Magnet Schools
One reason the RD analysis may not show that GT services have positive impact on student
outcomes is that the qualification boundary is not selective enough. That is, if the boundary is too
low, students who marginally qualify for GT services may not be able to take advantage of the
purported benefits, and thus show no difference to the marginal students not taking GT services.
Because the RD is a LATE, it is not possible to examine GT effectiveness on other parts of the
quality distribution. The lotteries for the two GT magnet middle schools, however, provide us with
an alternative window. That is, because the lottery is random over all students who qualify, the

18
comparison is between both strong and less strong students. The disadvantage, however, is that the
lottery results will only compare the magnet GT schools to the GT programs in neighborhood
schools, or in other magnet schools based on other criteria (non-GT magnets).
The impact on student achievement from winning the lottery and attending one of the two
magnet GT middle schools is shown in Table 9. Our preferred specification is the fourth one, which
is weighted least squares analysis including controls for lagged test scores and student
characteristics. In fact, however, the specification differences are not very important, as all of the
results indicate that the magnet GT students perform about .25 of a standard deviation better than
students attending other District schools in science. One specification, unweighted but with
controls, also shows a positive effect on language for the magnet GT students. The regressions
weighted for the original sample, however, show no evidence for such an effect.
Potential Mechanisms
Our analysis is not sufficiently detailed to fully explore the possible mechanisms for finding
only extremely modest impacts of GT services. In both of our samples, however, we decisively
show that GT students (in the RD sample- see Table 6), and magnet students (in the lottery sample-
see Table 10) take their classes with stronger peers than do their otherwise similar students. Given
the strength with which peer effects have been found to operate in several different contexts, it might
be expected that simply based on peers alone that the GT programs would be found to be effective
irrespective of other inputs. Table 6 does show that GT students are more likely to take more
challenging courses, although they are not found to be with teachers with larger fixed effects (as
measured by equation 3). The lottery student winners, however, are found not only to have stronger
19
peers than their otherwise similar colleagues who lose the lottery, but to have stronger teacher fixed
effects as well. It is ironic that the only teacher fixed effect to fail conventional significance tests
is in science, where the most robust achievement gains are to be found.
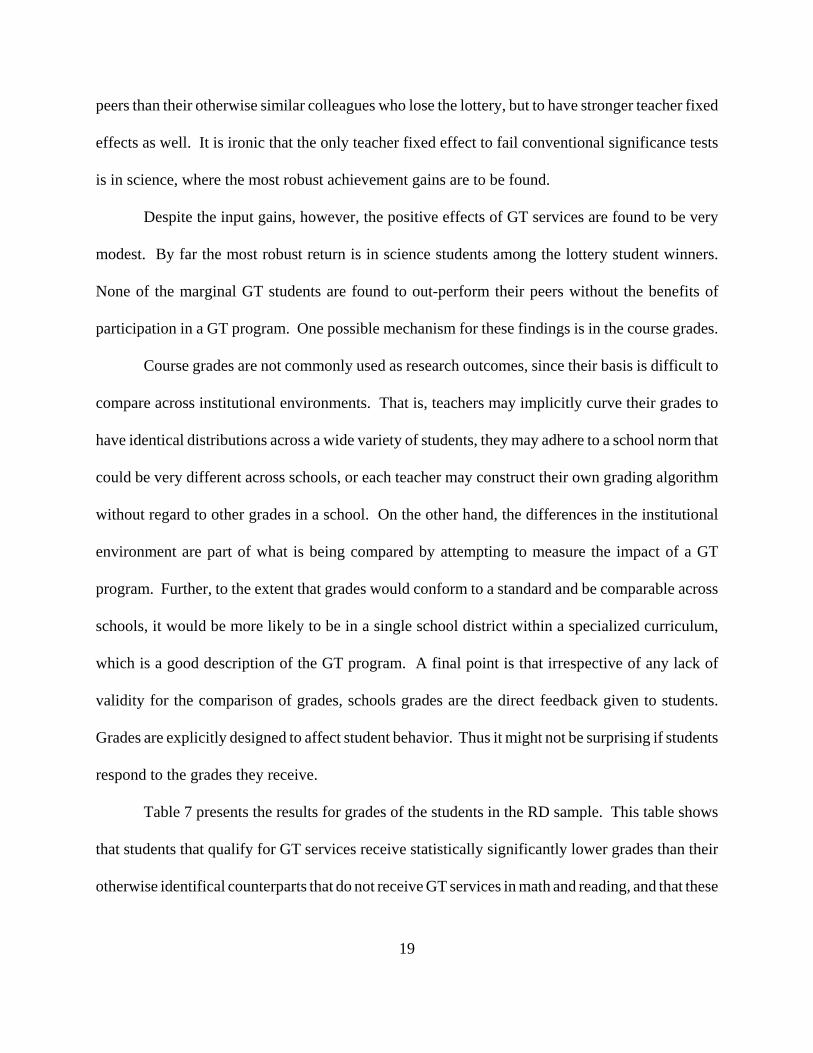
Despite the input gains, however, the positive effects of GT services are found to be very
modest. By far the most robust return is in science students among the lottery student winners.
None of the marginal GT students are found to out-perform their peers without the benefits of
participation in a GT program. One possible mechanism for these findings is in the course grades.
Course grades are not commonly used as research outcomes, since their basis is difficult to
compare across institutional environments. That is, teachers may implicitly curve their grades to
have identical distributions across a wide variety of students, they may adhere to a school norm that
could be very different across schools, or each teacher may construct their own grading algorithm
without regard to other grades in a school. On the other hand, the differences in the institutional
environment are part of what is being compared by attempting to measure the impact of a GT
program. Further, to the extent that grades would conform to a standard and be comparable across
schools, it would be more likely to be in a single school district within a specialized curriculum,
which is a good description of the GT program. A final point is that irrespective of any lack of
validity for the comparison of grades, schools grades are the direct feedback given to students.
Grades are explicitly designed to affect student behavior. Thus it might not be surprising if students
respond to the grades they receive.
Table 7 presents the results for grades of the students in the RD sample. This table shows
that students that qualify for GT services receive statistically significantly lower grades than their
otherwise identifical counterparts that do not receive GT services in math and reading, and that these

20
differences are large, about 4 points out of 100 (3 points changes a grade from a B+ to a B, for
example). Further, grades in the other 3 subjects also show negative point estimates, and of
sufficient magnitude to guess that the lack of precision may be related to sample size.
The results for the lottery sample, shown in Table 10, are even more dramatic. All four
subjects show that students in the magnet schools receive statistically significantly lower grades than
students in other GT programs. The point estimates range from a minimum of 4 points up to over
8 points in math (out of 100). One possibility for the larger difference in grades among the lottery
students compared to the RD students may be because of an implicit minimum grade, in that all GT
students are expected to achieve a certain level to maintain their GT status. Irrespective, however,
the data is clear that otherwise identical students will receive lower grades in the more rigorous
programs. This is not surprising, and is also consistent with the higher achieving peers that we
document in both samples.
The impact of peers, however, is not completely clear. Hoxby and Weingarth (2006) propose
that peer effects could potentially operate through an invidious comparison (IC) model whereby
being surrounded by higher achieving peers is demoralizing, and can reduce achievement. They find
some weak evidence that this occurs at the top of the achievement distribution. Imberman, Kugler
and Sacerdote (2009) test for IC and find little support for the model. They are only able, however,
to identify IC effects at a more aggregate school-wide level, and can only test the model for students
below the 75th percentile of achievement. Meanwhile, there is evidence from educational psychology
that students who are placed in higher achieving ability groups lose confidence in their ability and
exhibit less happiness (Vaille, Heaven and Ciarrochi, 2007; Peterson, Duncan and Canady, 2009;
Preckel, Gotz and Frenzel, 2010; Preckel and Brull, 2010). Another somewhat related theory is that

21
the marginal GT students cannot handle the more difficult GT curriculum and hence become
demoralized through that mechanism. Thus it is possible that invidious comparison or
demoralization of marginal students through the difficulty of the material can play a role in the
achievement of gifted students. Whether this effect would be strong enough to counter-balance the
other positive effects of GT services requires further examination of all the possible mechanisms
determining student performance.
Among the other possible mechanisms which are beyond the reach of our present effort are
the ability of the Stanford test to measure outcomes. That is, the Stanford Achievement Test may
not distinguish between students at this level since students get almost all of the answers correct.
While this may be the case for higher achieving GT students in the lottery sample, it is unlikely for
the marginal student in the RD context as they tend to have substantial room for improvement. And
in fact, we find larger test gains for the lottery students than the students in the RD sample. Another
possibility is that the GT curriculum does not address topics covered in the achievement tests
beyond what students learn in a regular class. This is potentially more salient as the GT program
focuses more on creative projects and critical thinking rather than an expansion of actual substance
covered. Although we cannot rule out this possibility, again it would appear to be more important
for the lottery sample than the RD sample.
Another potential explanation for the lack of impact is that GT does not actually generate
much of a treatment. For example if students are kept in the same classroom as regular students and
perhaps given no more than an extra assignment each week, then the impacts of GT would probably
be minimal. Columns (6) through (11) of Table 6 investigate the RD student’s course selection. We
classify math and English/reading courses into three types – regular, pre-AP (Advanced Placement),

17 We do not perform this analysis for the GT magnet schools because the entire focus of themagnet schools is theoretically directed at the GT students.
22
and Vanguard – where the latter is a pre-AP course specifically designed for GT students. Students
who qualify for GT are much more likely to be enrolled in a Vanguard course than in a standard pre-
AP course and are less likely to be enrolled in a regular non-pre-AP math course.17
Finally, in columns (15) through (18) of Table 7, and in columns (6) through (9) of Table 10
we investigate whether GT students are assigned to higher quality teachers. To do this we estimate
teacher fixed-effects using data on all students in grades 6 through 8 from 2006-07 through 2009-10.
Thus we estimate the following model separately for each subject of the Stanford Achievement Test:
where A is student achievement; X is a set of student level controls including gender, ethnicity,
economic disadvantage, LEP, special education, and grade-by-year fixed effects; is a set of
teacher fixed-effects; are student fixed-effects; and is random error. We estimate this model
such that each observation is assigned a weight that reflects the fact that each teacher is only
responsible for a portion of the impact on a student proportional to her share of classes in that
subject taught to that student. For example if a student takes a class in US history and another class
in geography, then the student will have two observations in the social studies regression, one for
each class, where he would be given a weight of ½ for each observation. Additionally, since the
Stanford exams are given in January, we assign to each student the teachers they had in the spring
of the previous academic year and the fall of the current academic year.
After collecting the teacher fixed-effects we match the estimates to student-course
combinations for each semester, once again assigning a student-year observation to the courses the
student takes in the fall of that year and the spring of the previous year. Finally, we average the
23
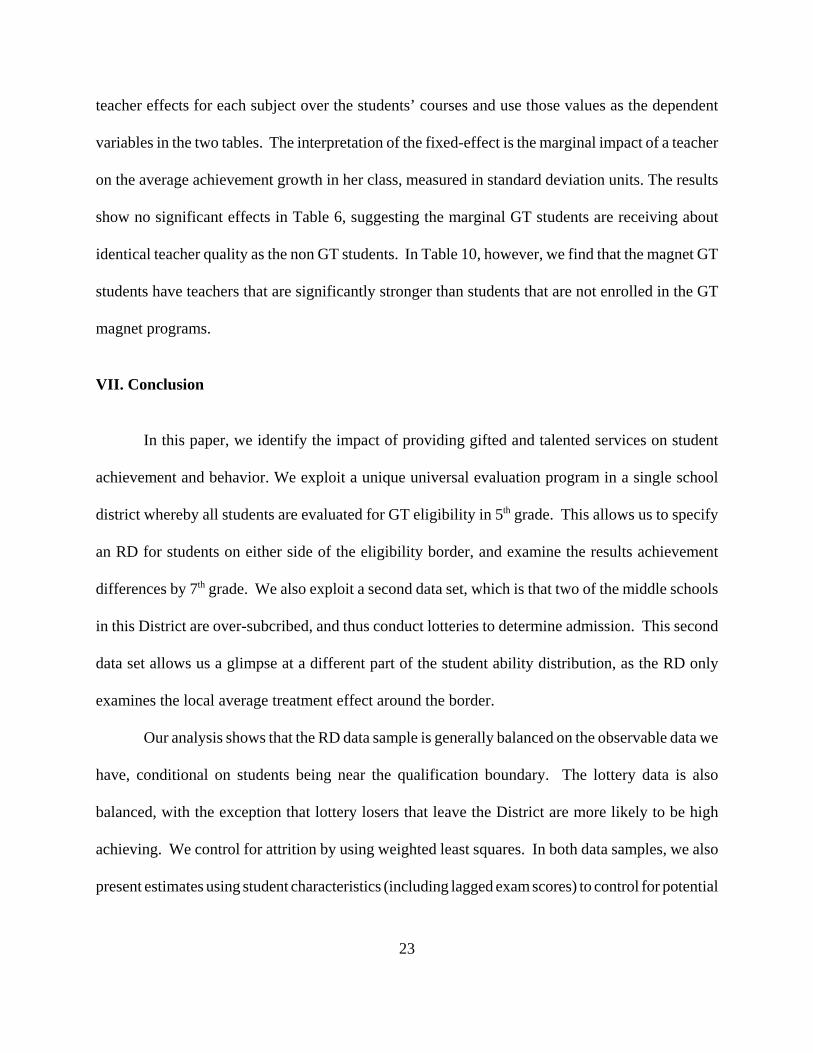
teacher effects for each subject over the students’ courses and use those values as the dependent
variables in the two tables. The interpretation of the fixed-effect is the marginal impact of a teacher
on the average achievement growth in her class, measured in standard deviation units. The results
show no significant effects in Table 6, suggesting the marginal GT students are receiving about
identical teacher quality as the non GT students. In Table 10, however, we find that the magnet GT
students have teachers that are significantly stronger than students that are not enrolled in the GT
magnet programs.
VII. Conclusion
In this paper, we identify the impact of providing gifted and talented services on student
achievement and behavior. We exploit a unique universal evaluation program in a single school
district whereby all students are evaluated for GT eligibility in 5th grade. This allows us to specify
an RD for students on either side of the eligibility border, and examine the results achievement
differences by 7th grade. We also exploit a second data set, which is that two of the middle schools
in this District are over-subcribed, and thus conduct lotteries to determine admission. This second
data set allows us a glimpse at a different part of the student ability distribution, as the RD only
examines the local average treatment effect around the border.
Our analysis shows that the RD data sample is generally balanced on the observable data we
have, conditional on students being near the qualification boundary. The lottery data is also
balanced, with the exception that lottery losers that leave the District are more likely to be high
achieving. We control for attrition by using weighted least squares. In both data samples, we also
present estimates using student characteristics (including lagged exam scores) to control for potential

24
mild deviations.
Both the RD and the lottery results indicate that GT services do not have large impacts on
student outcomes. The exception to this statement is that the lottery magnet winners appear to attain
higher achievement scores in science. The estimates from these two samples and specifications are
reduced forms, in that they do not differentiate among the many mechanisms by which student
achievement might be impacted. Our work here is not able to finely differentiate between all of the
alternative paths by which a GT program operates on student achievement. Nonetheless, we do find
that course grades are lower for the marginal students that enter the GT program. Further, we find
that course grades are lower in the highly regarded GT magnet schools. In some sense, the lower
grades would seem to be correlated with the higher performing peers. Whether these two effects
would always balance in a reduced form sense definitely awaits a more detailed analysis. We can
only note that the lack of a positive overall impact is despite the evidence we present of substantial
improvements in students’ educational environments in both samples. Students who exceed the
cutoff score for GT qualification and enroll in a GT program have significantly higher achieving
peers, are more likely to be placed in advanced courses, and are more likely to attend GT magnet
schools. Students in the GT magnet schools have all of these things, plus we find they are taught
by higher quality teachers. We have not completed all of the pieces to the puzzle of understanding
GT programs, but have peeled back another layer of the onion.

25
References
Argys, Laura, Daniel Rees, and Dominic Brewer. "Detracking America's Schools: Equity at ZeroCost?" Journal of Policy Analysis and Management 15, no. 4 (1996): 623-645.
Betts, Julian, and Jaimie Shkolnik. "The Effects of Ability Grouping on Student Achievement andResource Allocation in Secondary Schools." Economics of Education Review 19, no. 1 (2000): 1-15.
Bhatt, Rachana. "The Impacts of Gifted and Talented Education." SSRN Working Paper No. 09-11(2009).
Davis, Billie, John Engberg, Dennis N. Epple, Holger Sieg, and Ron Zimmer, “Evaluating the GiftedProgram of an Urban School District using a Modified Regression Discontinuity Design,” NBERWorking Paper #16414, September, 2010.
Duflo, Esther, Pascaline Dupas, and Michael Kremer. “Peer Effects, Teacher Incentivers, and theImpact of Tracking: Evidence from a Randomized Evaluation in Kenya,” American EconomicReview, forthcoming.
Epple, Dennis, Elizabeth Newton, and Richard Romano. "Ability Tracking, School Competition,and the Distribution of Educational Benefits." Journal of Public Economics 83, no. 1 (2002): 1-48.
Figlio, David, and Marianne Page. "School Choice and the Distributional Effects of AbilityTracking: Does Separation Increase Equality?" Journal of Urban Economics 51, no. 3 (2002): 497-514.
Hahn, Jinyong, Petra Todd, and Wilbert Van der Klaauw. "Identification and Estimation ofTreatment Effects With a Regression-Discontinuity Design." Econometrica 69, no. 1 (2001): 201-209.
Hoxby, Caroline and Gretchen Weingarth. “Taking Race Out of the Equation: School Reassignmentand the Structure of Peer Effects,” American Economic Association Annual Meetings, http://www.aeaweb.org/annual_mtg_papers/2006/0108_1300_0803.pdf (2006).
Imberman, Scott A., Adriana D. Kugler, and Bruce I. Sacerdote. "Katrina's Children: Evidence onthe Structure of Peer Effects from Hurricane Evacuees." University of Houston, mimeo (2009).
Kulik, Chen-lin, and James Kulik. "Ability Grouping." In Handbook of Gifted Education, edited byNicholas Colangelo and Gary Davis, 230-242. Boston: Allyn and Bacon (1997).
Lee, David, and Thomas Lemieux. "Regression Discontinuity Designs in Economics." NBERWorking Paper No. 14723, 2009.

26
McCrary, Justin. “Manipulation of the Running Variable in the Regression Discontinuity Design:A Density Test.” Journal of Econometrics 142, no. 2 (2008): 698 – 714.
Neal, Derek, and Diane Whitmore Schanzenbach. "Left Behind by Design: Proficiency Counts andTest-Based Accountability." Review of Economics and Statistics, 2010 forthcoming.
Peterson, Jean, Nancy Duncan and Kate Canady. “A Longitudinal Study of Negative Life Events,Stress, and School Experiences of Gifted Youth.” Gifted Child Quarterly 53 (2009), no. 1: 34-49.
Preckel, Franzis and Matthias Brull. “The Benefit of Being a Big Fish in a Big Pond: Contrast andAssimilation Effects on Academic Self-Concept” Learning and Individual Differences 20 (2010),no. 5: 522-531.
---, Thomas Gotz and Anne Frenzel. “Ability Grouping of Gifted Students: Effects on AcademicSelf-Concept and Boredom.” British Journal of Educational Psychology 80 (2010), no. 3: 451-472.
Reback, Randall. "Teaching to the Rating: School Accountability and the Distribution of StudentAchievement." Journal of Public Economics 92, no. 5-6 (2008): 1394-1415.
Vialle, Wilma, Patrick C. L. Heaven and Joseph Ciarrochi. “On Being Gifted, but Sad andMisunderstood: Social, Emotional, and Academic Outcomes of Gifted Students in the WollongongYouth Study.” Educational Research and Evaluation 13 (2007), no. 6: 569-586.
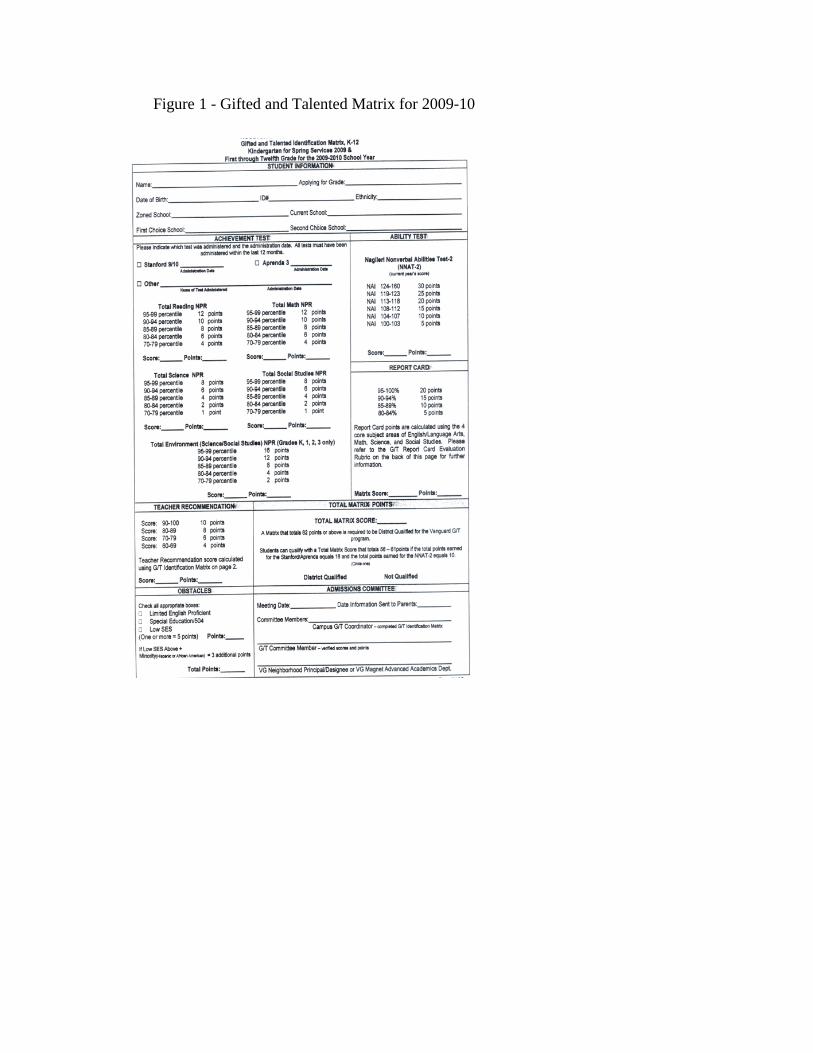
Figure 1 - Gifted and Talented Matrix for 2009-10
0.2
.4.6
.81
Pro
babi
lity
of R
ecei
ving
G&T
Ser
vice
s
30 40 50 60 70 80Euclidean Distance to Closest Elegibility Point
Figure 2: Gifted Status in 7th Gradeby 5th Grade Matrix Score
0 1 2 3 4 5 6 7 8 9 1011121314151617181920212223242526
2728293031323334353637383940
0
5
10
15
20
25
30
35
40
048121620
24
28
Stanford Achievement Test Points
Other Points
NNAT Points
Figure 3: Surface Plot of GT Qualification by Matrix Points

0.2
.4.6
.81
Prob
abilit
y of
Rec
eivi
ng G
&T
Serv
ices
-10 -5 0 5 10Euclidean Distance to Closest Elegibility Point
Figure 4: Gifted Status in 7th Grade by Distance to BoundaryBased on 5th Grade Matrix Points
.4.6
.81
1.2
Stan
ford
Ach
ieve
men
t Tes
t - S
tand
ard
Dev
iatio
ns
-10 -5 0 5 10Euclidean Distance to Closest Elegibility Point
Math Reading Language
Figure 5: Stanford Math, Reading & Language in7th Grade by Distance to Boundary

.2.4
.6.8
1St
anfo
rd A
chie
vem
ent T
est -
Sta
ndar
d D
evia
tions
-10 -5 0 5 10Euclidean Distance to Closest Elegibility Point
Social Studies Science
Figure 6: Stanford Social Studies & Science in7th Grade by Distance to Boundary
95.5
9696
.597
97.5
98A
ttend
ance
Rat
e (%
)
-10 -5 0 5 10Euclidean Distance to Closest Elegibility Point
Figure 7: Attendance in7th Grade by Distance to Boundary

8082
8486
8890
Num
eric
al G
rade
s (m
ax 1
00)
-10 -5 0 5 10Euclidean Distance to Closest Elegibility Point
Math English Reading
Figure 8: Grades in 7th Grade by Distance to BoundaryMath, English and Reading

8082
8486
88N
umer
ical
Gra
des
(max
100
)
-10 -5 0 5 10Euclidean Distance to Closest Elegibility Point
Science Social Science
Figure 9: Grades in 7th Grade by Distance to BoundaryScience and Social Science
Gifted in 2009-10 (7th
Grade)Not Gifted in
2009-10Not in Sample in
2009-10In Magnet in 2009-
10Not in GT Magnet
in 2009-10Not in Sample in
2009-10
Female 0.54 0.48 0.50 0.51 0.54 0.57(0.50) (0.50) (0.50) (0.50) (0.50) (0.50)
Economically Disadvantaged 0.59 0.89 0.81 0.24 0.41 0.17(0.49) (0.31) (0.39) (0.43) (0.49) (0.37)
LEP 0.23 0.37 0.28 0.02 0.06 0.04(0.42) (0.48) (0.45) (0.15) (0.24) (0.20)
Asian 0.11 0.02 0.03 0.28 0.16 0.19(0.31) (0.13) (0.18) (0.45) (0.37) (0.39)
Black 0.13 0.28 0.33 0.12 0.21 0.18(0.34) (0.45) (0.47) (0.32) (0.41) (0.38)
Hispanic 0.52 0.66 0.56 0.22 0.23 0.14(0.50) (0.47) (0.50) (0.41) (0.42) (0.35)
White 0.24 0.04 0.09 0.38 0.40 0.50(0.43) (0.19) (0.28) (0.49) (0.49) (0.50)
Gifted 0.68 0.06 0.15 0.85 0.85 0.83(0.47) (0.25) (0.36) (0.36) (0.36) (0.37)
Stanford Math 0.74 0.06 0.18 1.61 1.39 1.72(0.59) (0.39) (0.47) (0.79) (0.71) (1.03)
Stanford Reading 0.64 -0.02 0.11 1.72 1.60 1.83(0.41) (0.39) (0.47) (0.78) (0.77) (0.87)
Stanford Language 0.74 -0.16 0.01 1.61 1.48 1.83(0.59) (0.57) (0.67) (0.84) (0.76) (0.94)
Stanford Social Science 0.43 -0.61 -0.42 1.52 1.48 1.75(0.68) (0.68) (0.80) (0.86) (0.84) (0.91)
Stanford Science 0.50 -0.50 -0.30 1.47 1.36 1.61(0.66) (0.65) (0.76) (0.89) (0.79) (0.95)
Disciplinary Infractions 0.04 0.21 0.25 0.02 0.05 0.01(0.26) (0.73) (0.87) (0.15) (0.24) (0.10)
Attendence Rate 98.26 97.25 96.58 98.35 97.98 97.00(2.35) (4.52) (4.95) (2.00) (2.34) (3.75)
Stanford Math 1.11 -0.40 - 1.70 1.53 -(0.45) (0.41) - (0.84) (0.86) -
Stanford Reading 0.95 -0.31 - 1.66 1.58 -(0.37) (0.38) - (0.66) (0.72) -
Stanford Language 1.08 0.17 - 1.59 1.44 -(0.57) (0.58) - (0.80) (0.72) -
Stanford Social Science 0.88 -0.09 - 1.70 1.51 -(0.64) (0.60) - (0.88) (0.80) -
Stanford Science 1.00 -0.18 - 1.72 1.36 -(0.79) (0.71) - (0.94) (0.77) -
Disciplinary Infractions 0.28 1.25 - 0.05 0.13 -(1.11) (2.61) - (0.24) (0.86) -
Attendence Rate 97.37 95.02 - 97.84 97.57 -(3.19) (6.13) - (2.52) (3.16) -
Observations 1,919 8,748 3,652 291 149 102
Table 1 - Characteristics of Students Evaluated for Middle School GT in 2007-08
II. GT Magnet Lottery Sample
Standard deviations in parentheses. Achievement is measured in standard deviation units within grade and year across the district. Disciplinary infractions are the number of times a student is given a suspension or more severe punishment. Economically disadvantaged refers to students who qualify for free lunch, reduced-price lunch or another federal or state anti-poverty program.
B, 7th Grade Outcomes
A. 5th Grade Characteristics
I. Regression Discontinuity Sample
Black Hispanic Female LEPGifted in 5th
GradeSpecial
Education
Free / Reduced-Price
Lunch
Stanford - Math
Stanford - Reading
Stanford - Language
(1) (2) (3) (4) (5) (6) (7) (8) (9) (10)
-0.000 0.014 0.024 0.039 -0.050 0.005 0.049 -0.067*** 0.006 0.006(0.029) (0.038) (0.042) (0.040) (0.047) (0.011) (0.037) (0.026) (0.026) (0.041)
Observations 2,650 2,650 2,650 2,650 2,650 2,650 2,650 2,637 2,638 2,636
Stanford - Social Studies
Stanford - Science
# of Disciplinary Infractions
Attendance Rate (%)
Any Missing Matrix Data
Teacher ScoreTeacher Points
EnrolledEnrolled (F/RP)
Enrolled (Non-F/RP)
(11) (12) (13) (14) (15) (16) (17) (18) (19) (20)
0.040 0.004 -0.001 -0.269 0.000 2.965 0.497 0.049 0.054 0.039(0.049) (0.042) (0.028) (0.190) (0.008) (2.715) (0.321) (0.030) (0.037) (0.053)
Observations 2,636 2,637 2,650 2,650 2,650 2,648 2,648 3,438 2,177 1,261
Above GT Cutoff
Above GT Cutoff
Table 2 - Reduced-Form Estimates of Discontinuities in Pre-Existing (5th Grade) Student Characteristics
Achievement measured in standard deviations of scale scores within grade and year. Disciplinary infractions is the number of infractions warranting a suspension or more severe punishment per year. Includes a linear smoother with a slope shift above the cutoff. Sample is limited to students with Euclidean distances from qualifying via the GT qualification matrix of between -10 and 10. *, **, and *** denote statistical significance at the 10%, 5%, and 1% levels, respectively. Standard errors are robust to heteroskedasticity and clustered by 5th grade school. Sample is for columns (1) to (18) are for the estimation sample - students observed in LUSD two years after evaluation (7th grade). Tests using the full set of evaluated students provides similar results and is provided in the online appendix.

Math Reading Language Social Science
Science
(1) (2) (3) (4) (5) (6) (7)
-0.061** -0.005 -0.004 -0.020 -0.011 -0.006 -0.691**(0.030) (0.029) (0.044) (0.038) (0.060) (0.120) (0.311)
0.440*** 0.443*** 0.442*** 0.440*** 0.440*** 0.436*** 0.438***(0.057) (0.057) (0.058) (0.058) (0.057) (0.058) (0.058)
-0.138** -0.011 -0.008 -0.045 -0.025 -0.014 -1.578*(0.068) (0.065) (0.100) (0.085) (0.135) (0.276) (0.802)
2,612 2,614 2,612 2,610 2,612 2,653 2,652
-0.016 -0.001 0.005 -0.007 0.008 0.003 -0.502*(0.022) (0.020) (0.031) (0.031) (0.048) (0.112) (0.268)
0.465*** 0.457*** 0.457*** 0.454*** 0.456*** 0.451*** 0.456***(0.060) (0.061) (0.061) (0.061) (0.061) (0.060) (0.060)
-0.035 -0.002 0.010 -0.016 0.017 0.007 -1.101*(0.047) (0.044) (0.068) (0.068) (0.106) (0.248) (0.653)
2,597 2,600 2,596 2,594 2,597 2,650 2,649
-0.024 -0.028 -0.028 -0.054 0.002 0.088 0.346(0.028) (0.020) (0.039) (0.041) (0.059) (0.130) (0.309)
0.229*** 0.232*** 0.230*** 0.228*** 0.229*** 0.230*** 0.229***(0.038) (0.038) (0.039) (0.039) (0.038) (0.038) (0.038)
-0.106 -0.121 -0.120 -0.236 0.011 0.382 1.509(0.122) (0.085) (0.170) (0.188) (0.256) (0.568) (1.328)
2,579 2,580 2,579 2,576 2,578 2,619 2,618
B. With Individual Controls
Reduced Form
Observations
2SLS - 1st Stage Above GT Cutoff
2SLS - 2nd Stage Enrolled in GT
Above GT Cutoff
2SLS - 2nd Stage
Stanford Achievement Test
Enrolled in GT
Observations
2SLS - 1st Stage
Above GT Cutoff
Above GT Cutoff
Table 3 - Regression Discontinuity Estimates of Impact of Receiving G&T Services
Reduced Form
Attendance Rate (%)
A. Baseline
Dependent Variable
ModelDisciplinary Infractions
C. Using Synthetic Matrix Scores
Achievement measured in standard deviations of scale scores within grade and year. Disciplinary infractions is the number of infractions warranting a suspension or more severe punishment per year. Synthetic matrix scores replace matrix scores for students where a teacher recommendation could be pivotal (e.g. total points w/o the recommendation is fewer than 10 away from the relevant cutoff) with the predicted value from a regression of total points on all components excluding the teacher points. See text for details. Controls for race, gender, economic
Reduced Form Above GT Cutoff
2SLS - 1st Stage Above GT Cutoff
2SLS - 2nd Stage Enrolled in GT
Observations

Math Reading LanguageSocial
Science ScienceDisciplinary Infractions
Attendance Rate (%)
(1) (2) (3) (4) (5) (6) (7) (8)
(1) Females 0.531*** -0.023 -0.030 -0.028 -0.041 -0.003 0.177 -1.909**(0.063) (0.054) (0.049) (0.068) (0.083) (0.114) (0.230) (0.726)
Observations 1,336 1,336 1,335 1,335 1,333 1,336 1,361 1,360
(2) Males 0.410*** -0.022 0.044 0.093 0.040 0.046 -0.205 0.029(0.076) (0.081) (0.061) (0.106) (0.110) (0.147) (0.495) (1.119)
Observations 1,237 1,237 1,240 1,236 1,237 1,237 1,260 1,260
(3) Free/Reduced-Price Lunch 0.512*** 0.009 -0.032 0.014 -0.016 -0.031 0.160 -0.895(0.064) (0.050) (0.047) (0.079) (0.083) (0.113) (0.306) (0.671)
Observations 1,644 1,644 1,645 1,644 1,644 1,645 1,669 1,669
(4) No Free/Reduced-Price Lunch 0.366*** -0.126 0.076 0.000 -0.023 0.095 -0.613 -1.370(0.088) (0.097) (0.076) (0.130) (0.177) (0.178) (0.606) (1.367)
Observations 929 929 930 927 926 928 952 951
(5) Black 0.605*** -0.068 0.124 -0.100 0.092 0.092 -0.181 -2.006*(0.116) (0.082) (0.081) (0.144) (0.154) (0.177) (0.366) (1.027)
Observations 435 435 435 435 433 434 447 447
(6) Hispanic 0.453*** -0.024 -0.032 0.058 -0.043 0.048 -0.067 -1.109(0.059) (0.066) (0.057) (0.087) (0.086) (0.126) (0.400) (0.865)
Observations 1,680 1,680 1,682 1,679 1,679 1,680 1,708 1,708
(7) White 0.289 0.015 -0.195 0.014 0.093 -0.446 -0.151 2.301*(0.183) (0.257) (0.221) (0.277) (0.375) (0.529) (0.513) (1.285)
Observations 325 325 325 325 325 326 330 329
(8) Gifted in 5th Grade 0.368*** -0.096 0.033 0.182 0.093 0.129 0.699 -2.041(0.082) (0.102) (0.095) (0.124) (0.159) (0.230) (0.558) (1.421)
Observations 1,003 1,003 1,005 1,004 1,003 1,004 1,017 1,016
(9) Not Gifted in 5th Grade 0.534*** -0.003 -0.005 -0.045 -0.035 -0.027 -0.291 -0.666(0.071) (0.056) (0.053) (0.077) (0.090) (0.122) (0.288) (0.636)
Observations 1,570 1,570 1,570 1,567 1,567 1,569 1,604 1,604
First Stage
Stanford Achievement Test
Table 4 - 2SLS Estimates of Impact of Receiving G&T ServicesEstimates for Sub-Populations
Achievement measured in standard deviations of scale scores within grade and year. Disciplinary infractions is the number of infractions warranting a suspension or more severe punishment per year. Controls for race, gender, economic disadvantage and lagged (5th grade) dependent varable included, along with a linear smoother with a slope shift above the cutoff included. Standard errors are robust to heteroskedasticity and clustered by 7th grade school. Sample is limited to students with Euclidean distances from qualifying via the GT qualification matrix of between -10 and 10.

Math Reading LanguageSocial
Science ScienceDisciplinary Infractions
Attendance Rate (%)
(1) (2) (3) (4) (5) (6) (7) (8)
0.424*** 0.120 0.007 0.246** 0.146 0.305* -0.445 -0.565(0.063) (0.112) (0.071) (0.111) (0.135) (0.159) (0.505) (1.253)
Observations 2,609 2,597 2,600 2,596 2,594 2,597 2,650 2,649
0.371*** 0.057 -0.029 0.276 -0.019 0.409 -0.617 -0.455(0.103) (0.238) (0.157) (0.203) (0.244) (0.332) (0.745) (2.036)
Observations 2,609 2,597 2,600 2,596 2,594 2,597 2,650 2,649
0.460*** -0.014 0.007 0.041 0.009 0.023 0.067 -1.039*(0.057) (0.037) (0.041) (0.065) (0.065) (0.112) (0.249) (0.600)
Observations 2,609 2,597 2,600 2,596 2,594 2,597 2,650 2,649
0.456*** -0.027 0.003 0.013 -0.004 0.029 0.068 -1.186*(0.061) (0.048) (0.044) (0.067) (0.068) (0.108) (0.263) (0.684)
Observations 2,538 2,526 2,528 2,525 2,522 2,525 2,577 2,576
0.387*** 0.116 -0.097 0.132 -0.029 0.338 -0.762 -0.835(0.084) (0.167) (0.111) (0.159) (0.170) (0.246) (0.518) (1.647)
Observations 849 845 848 845 842 844 860 859
0.462*** 0.005 0.014 0.111 0.056 0.115 -0.162 -0.638(0.056) (0.058) (0.046) (0.072) (0.080) (0.103) (0.325) (0.758)
Observations 2,057 2,047 2,052 2,047 2,044 2,047 2,084 2,083
0.472*** -0.009 0.018 -0.013 0.007 0.019 0.001 -0.823(0.055) (0.039) (0.036) (0.057) (0.063) (0.086) (0.209) (0.549)
Observations 3,178 3,162 3,163 3,158 3,158 3,160 3,222 3,220
0.488*** -0.022 0.009 -0.015 -0.022 0.017 0.100 -0.438(0.055) (0.035) (0.030) (0.045) (0.061) (0.077) (0.179) (0.497)
Observations 3,756 3,735 3,736 3,731 3,729 3,733 3,806 3,804
- 0.073 0.000 0.019 0.056 0.222 1.476 -0.434- (0.117) (0.072) (0.186) (0.080) (0.177) (1.002) (1.203)
Observations - 1,075 1,078 708 2,044 1,074 429 1,092
Bandwidth (from Leave-One-Out Cross Validation)
- 5 5 3 8 5 2 5
(5)
(6) Distance Between -4 & 4
(6) Distance Between -16 & 16
(6)
(7)
Achievement measured in standard deviations of scale scores within grade and year. Disciplinary infractions is the number of infractions warranting a suspension or more severe punishment per year. Controls for race, gender, economic disadvantage, LEP, prior gifted status and lagged (5th grade) dependent varable included and a linear smoother with a slope shift above the cutoff except where noted.. Sample is limited to students with Euclidean distances from qualifying via the GT qualification matrix of between -10 and 10. *, **, and *** denote statistical significance at the 10%, 5%, and 1% levels, respectively. Standard errors are robust to heteroskedasticity and clustered by 7th grade school.
First Stage
Table 5 - 2SLS Regression Discontinuity Estimates of Impact of Receiving G&T ServicesSpecification Checks
Local Linear Regressions with Rectangular Kernel
(3) Add Middle School Fixed Effects
Stanford Achievement Test
Distance Between -12 & 12
Limited to Observations With No Missing Matrix Data
Distance Between -8 & 8
Quadratic Smoother
Cubic Smoother
(1)
(2)
(4)

Peer Math Scores in Math
Classes
Peer Reading Scores in Read/Eng Classes
Peer Lang Scores in Read/Eng Classes
Peer Soc Scores in Soc
Classes
Peer Science Scores in
Science Classes# of Core
Regular Classes
# of Core Vanguard Classes
Enrolled in Vanguard Math
Enrolled in Vanguard English
(1) (2) (3) (4) (5) (6) (7) (8) (9)
0.348** 0.287* 0.311** 0.235* 0.272* -0.014 1.145* 0.315* 0.241(0.166) (0.156) (0.146) (0.132) (0.150) (0.267) (0.624) (0.158) (0.171)
Observations 2,629 2,494 2,494 2,567 2,567 2,643 2,643 2,629 2,497
Enrolled in Vanguard
Social Science
Enrolled in Vanguard Science
Attends Zoned School
Attends Non-Zoned GT
Magnet CampusAttends Other
Non-ZonedMath Teacher Fixed Effect
Read/Eng Teacher Fixed
EffectScience Teacher
Fixed Effect
Social Science Teacher Fixed
Effect(10) (11) (12) (13) (14) (15) (16) (17) (18)
0.282* 0.282* -0.050 0.260** -0.210** -0.001 0.016 0.005 0.014(0.165) (0.165) (0.109) (0.109) (0.098) (0.025) (0.010) (0.014) (0.013)
Observations 2,567 2,567 2,623 2,623 2,623 2,650 2,621 2,621 2,621
Table 6 - 2SLS Estimates of Impacts of G&T ServicesEffects on Educational Environment and Student Choices
Enrolled in GT
Enrolled in GT
Achievement measured in standard deviations of scale scores within grade and year. Teacher fixed effects are estimates from a student-level regression of achievement on lagged achievement, peer lagged achievement, race, gender, special education, LEP, at-risk status, teacher fixed-effects and school fixed-effects. Controls for race, gender, economic disadvantage, LEP, prior gifted status and lagged (5th grade) dependent varable included. Also includes a linear smoother with a slope shift above the cutoff. Peers are defined by teacher-course id-grade cells. Sample is limited to students with Euclidean distances from qualifying via the GT qualification matrix of between -10 and 10. *, **, and *** denote statistical significance at the 10%, 5%, and 1% levels, respectively. Standard errors are robust to heteroskedasticity and clustered by 7th grade school.

Math English Reading Social Studies Science(1) (2) (3) (5) (4)
-4.142** -2.621 -4.048* -1.501 -2.473(1.616) (1.744) (2.062) (1.052) (1.645)
Observations 2,643 2,510 1,439 2,602 2,581
-3.516*** -1.939 -2.698* -3.395** -3.002**(1.177) (1.489) (1.373) (1.438) (1.353)
Observations 2,734 2,604 2,608 2,728 2,749
Achievement measured in standard deviations of scale scores within grade and year. Controls for race, gender, economic disadvantage, LEP, and prior gifted status are included along with a linear smoother with a slope shift above the cutoff. Sample is limited to students with Euclidean distances from qualifying via the GT qualification matrix of between -10 and 10. *, **, and *** denote statistical significance at the 10%, 5%, and 1% levels, respectively. Standard errors are robust to heteroskedasticity and clustered by 7th grade school.
Table 7 - 2SLS Estimates of Impacts of G&T ServicesEffects on Course Grades (2007-08 Evaluation Cohort)
Enrolled in GT
Enrolled in GT
A. 7th Grade
B. 6th Grade
Asian Black Hispanic White Econ Disadv Female At-RiskSpecial
Education LEP Gifted(1) (2) (3) (4) (5) (6) (7) (8) (9) (10)
-0.030 0.030 0.041 -0.041 -0.035 -0.006 -0.011 -0.019 -0.033 -0.028(0.044) (0.038) (0.044) (0.050) (0.045) (0.047) (0.010) (0.017) (0.022) (0.035)
Observations 542 542 542 542 542 542 542 542 542 542
-0.027 0.041 0.042 -0.057 -0.050 -0.001 -0.009 -0.015 -0.031 -0.024(0.048) (0.038) (0.055) (0.056) (0.059) (0.052) (0.011) (0.023) (0.027) (0.047)
Observations 437 437 437 437 437 437 437 437 437 437
GT MagnetTotal Matrix
Points Math Reading Language Social Studies ScienceAttendance
Rate InfractionsTeacher Score
(11) (12) (13) (14) (15) (16) (17) (18) (19) (20)
0.035 0.243 0.027 0.073 -0.034 0.053 0.010 -0.180 -0.022 0.029(0.030) (0.926) (0.069) (0.063) (0.077) (0.089) (0.076) (0.201) (0.021) (1.304)
Observations 542 542 540 541 539 540 539 542 542 536
0.055 0.909 0.128* 0.100 -0.059 0.063 0.090 -0.064 -0.022 -1.005(0.045) (1.173) (0.074) (0.075) (0.077) (0.096) (0.088) (0.230) (0.025) (1.471)
Observations 437 437 437 437 436 437 436 437 437 434
Ex-Ante - Baseline Lottery
Achievement measured in standard deviations of scale scores within grade and year. Disciplinary infractions is the number of infractions warranting a suspension or more severe punishment per year. Lotteries for two schools were conducted in 2007-08 hence regresions include indicators for lottery fixed effects. Coefficients are for an indicator for whether the student won the lottery. Robust standard errors clustered by 5th grade school in parentheses. Results without clustering are similar and provided in the online appendix.
Sample
Table 8 - Balancing Tests for GT Magnet Lotteries - Covariates Measured in 5th Grade
Ex-Post - Estimation Sample
Ex-Post - Estimation Sample
Stanford Achievement Test
Sample
Ex-Ante - Baseline Lottery

Math Reading Language Social Studies Science(1) (2) (3) (4) (5) (6)
0.042 0.023 0.102 0.039 0.249** -0.434(0.178) (0.103) (0.065) (0.083) (0.114) (0.636)
Observations 437 438 436 437 437 440
-0.100 -0.058 0.142* -0.032 0.208* -0.425(0.112) (0.105) (0.081) (0.098) (0.119) (0.411)
Observations 437 438 436 437 437 440
-0.266 -0.130 -0.060 -0.120 0.243 0.043(0.291) (0.221) (0.148) (0.214) (0.201) (1.996)
Observations 436 437 435 436 436 439
-0.224 -0.018 0.001 -0.036 0.281** 0.364(0.171) (0.172) (0.114) (0.136) (0.130) (1.489)
Observations 436 437 435 436 436 439
-0.019 -0.095 0.074 -0.064 0.344* -(0.196) (0.157) (0.162) (0.185) (0.180) -
Observations 437 438 436 437 437 -
-0.353 -0.310 -0.207 -0.389 -0.013 -(0.251) (0.192) (0.215) (0.249) (0.248) -
Observations 437 438 436 437 437 -
Table 9 - Effect of Attending a GT Magnet School Relative to a GT Neighborhood Program
Achievement measured in standard deviations of scale scores within grade and year. Lotteries for two schools were conducted in 2007-08 hence all regresions include indicators for lottery fixed effects. Coefficients are for an indicator for whether the student is enrolled in a GT magnet program in 7th grade. Robust standard errors clustered by 7th grade school in parentheses. Results without clustering are similar and provided in the online appendix. Controls include indicators during 5th grade for race, gender, special education, LEP, at-risk status, gifted, whether the student was enrolled in a GT magnet, and a lagged dependent variable. Weighted regressions are weighted by the inverse of the estimated probability of remaining in the data. See text for details. In order to avoid slow convergence due to a very small portion of the sample being in special education or LEP, we drop those controls from the bounding analysis. Additionally, we do not cluster the standard errors on the bounding analysis due to inability for the estimator to converge. Finally, we do not provide bounds for attendance due to poor performance with censored data. See pape
Attendence Rate (%)
Engberg, Epple, Imbrogno, Sieg, Zimmer (2011) Bounds - Lower Bound
2SLS - Unweighted, Controls
2SLS - Weighted, No Controls
2SLS - Weighted, Controls
Engberg, Epple, Imbrogno, Sieg, Zimmer (2011) Bounds - Upper Bound
2SLS - Unweighted, No Controls
Model Stanford Achievement Test

Math in Math Class
Reading in English Class
Language in English Class
Social Studies in Soc Class
Science in Science Class
Math English/Reading
(1) (2) (3) (4) (5) (6) (7)
1.066*** 0.659*** 0.579*** 0.794*** 0.524*** 0.081*** 0.032**(0.145) (0.149) (0.120) (0.123) (0.122) (0.015) (0.013)
Observations 440 436 436 439 439 440 440
1.164*** 0.751*** 0.686*** 0.952*** 0.659*** 0.085*** 0.032***(0.179) (0.172) (0.143) (0.180) (0.166) (0.019) (0.011)
Observations 439 435 435 438 438 439 439
Social Studies
Science Math English Social Studies
Science
(8) (9) (10) (11) (12) (13)
0.031* 0.017 -8.283*** -4.096** -4.062** -6.988***(0.017) (0.014) (1.660) (1.561) (1.654) (1.309)
Observations 440 440 440 437 439 439
0.041** 0.016 -7.311*** -2.719 -4.733** -8.121***(0.019) (0.013) (1.847) (1.990) (1.733) (2.297)
Observations 439 439 439 436 438 438
Achievement measured in standard deviations of scale scores within grade and year. Teacher fixed effects are estimates from a student-level regression of achievement on lagged achievement, peer lagged achievement, race, gender, special education, LEP, at-risk status, teacher fixed-effects and school fixed-effects. Lotteries for two schools were conducted in 2007-08 hence all regresions include indicators for lottery fixed effects. Coefficients are for an indicator for whether the student is enrolled in a GT magnet program in 7th grade. Peers are defined by teacher-course id-grade cells. Robust standard errors clustered by 7th grade school in parentheses. Results without clustering are similar and provided in the online appendix. Weighted regressions are weighted by the inverse of the estimated probability of remaining in the data. See text for details. Controls include indicators during 5th grade for race, gender, special education, LEP, at-risk status, gifted, whether the student was enrolled in a GT magnet, and a lagged dependent variable.
Table 10 - Treatments from Attending a GT Magnet School Relative to a GT Neighborhood Program
2SLS - Unweighted, Controls
2SLS - Weighted, Controls
Model Mean Peer Achievement (Std Deviations)
Course Grades
Teacher Fixed Effects
Teacher Fixed Effects
2SLS - Unweighted, Controls
2SLS - Weighted, Controls

Math Reading Language Social Studies Science(1) (2) (3) (4) (5) (6)
-0.171 0.023 -0.186 0.033 0.183 -0.838**(0.154) (0.269) (0.151) (0.100) (0.138) (0.334)
Observations 229 229 229 229 229 231
-0.007 0.025 0.237 0.044 0.258 2.198(0.175) (0.156) (0.248) (0.172) (0.208) (2.752)
Observations 207 208 206 207 207 208
-0.182 -0.171 0.296* -0.013 0.347* -0.100(0.123) (0.128) (0.152) (0.205) (0.159) (0.449)
Observations 172 172 172 172 172 172
-0.032 0.103 -0.131 0.067 0.200 0.788(0.192) (0.165) (0.163) (0.095) (0.155) (2.016)
Observations 264 265 263 264 264 267
0.063 0.356 -0.327 0.072 -0.001 -0.634**(0.220) (0.210) (0.238) (0.136) (0.116) (0.245)
Observations 158 159 157 158 158 161
-0.152 -0.053 0.320** -0.034 0.291 -0.551(0.166) (0.137) (0.119) (0.189) (0.186) (0.442)
Observations 307 308 307 307 307 309
-0.041 0.124 -0.230 0.065 0.245 0.915(0.217) (0.233) (0.178) (0.093) (0.183) (2.027)
Observations 129 129 128 129 129 130
0.026 -0.217 -0.169 -0.123 0.237*** -(0.249) (0.279) (0.205) (0.155) (0.056) -
Observations 208 200 177 222 205 -
-0.049 0.062 0.290* -0.025 0.340 -(0.135) (0.178) (0.151) (0.194) (0.240) -
Observations 228 237 258 215 231 -
-0.042 -0.533** 0.085 -0.010 0.010 -(0.200) (0.209) (0.163) (0.207) (0.151) -
Observations 97 112 93 98 88 -
-0.204 0.306 0.477 0.183 0.614 -(0.176) (0.358) (0.282) (0.341) (0.436) -
Observations 111 135 141 111 89 -
Male
White
Minority
Table 11 - 2SLS Estimates of the Effect of Attending a GT Magnet School Relative to a GT Neighborhood Program, Subpopulations Weighted with Controls
Subpopulation Stanford Achievement Test Attendence Rate
Female
Minority - Excluding Asians
Achievement measured in standard deviations of scale scores within grade and year. Achievement percentiles are for fully baseline lottery sample using 5th grade achievment in same subject. Lotteries for two schools were conducted in 2007-08 hence all regresions include indicators for lottery fixed effects. Coefficients are for an indicator for whether the student is enrolled in a GT magnet program in 7th grade. Robust standard errors clustered by 7th grade school in parentheses. Results without clustering are similar and provided in the online appendix. Regressions are weighted by the inverse of the estimated probability of remaining in the data. See text for details. Controls include indicators during 5th grade for race, gender, special education, LEP, at-risk status, gifted, whether the student was enrolled in a GT magnet, and a lagged dependent variable.
Above Median Achievement of Lottery Participants
Below 25th Percentile of Achievement for Lottery Participants
Above 75th Percentile of Achievement for Lottery Participants
Not Economically Disadvantaged
Economically Disadvantaged
Below Median Achievement of Lottery Participants