is early learning really more productive? the effect of school - iza
TRANSCRIPT

IZA DP No. 1659
Is Early Learning Really More Productive?The Effect of School Starting Age on Schooland Labor Market Performance
Peter FredrikssonBjörn Öckert
DI
SC
US
SI
ON
P
AP
ER
S
ER
IE
S
Forschungsinstitut
zur Zukunft der Arbeit
Institute for the Study
of Labor
July 2005

Is Early Learning Really More Productive?
The Effect of School Starting Age on School and Labor Market Performance
Peter Fredriksson Uppsala University, IFAU
and IZA Bonn
Björn Öckert IFAU, Uppsala
Discussion Paper No. 1659 July 2005
IZA
P.O. Box 7240 53072 Bonn
Germany
Phone: +49-228-3894-0 Fax: +49-228-3894-180
Email: [email protected]
Any opinions expressed here are those of the author(s) and not those of the institute. Research disseminated by IZA may include views on policy, but the institute itself takes no institutional policy positions. The Institute for the Study of Labor (IZA) in Bonn is a local and virtual international research center and a place of communication between science, politics and business. IZA is an independent nonprofit company supported by Deutsche Post World Net. The center is associated with the University of Bonn and offers a stimulating research environment through its research networks, research support, and visitors and doctoral programs. IZA engages in (i) original and internationally competitive research in all fields of labor economics, (ii) development of policy concepts, and (iii) dissemination of research results and concepts to the interested public. IZA Discussion Papers often represent preliminary work and are circulated to encourage discussion. Citation of such a paper should account for its provisional character. A revised version may be available directly from the author.

IZA Discussion Paper No. 1659 July 2005
ABSTRACT
Is Early Learning Really More Productive? The Effect of School Starting Age on
School and Labor Market Performance∗
In Sweden, children typically start compulsory school the year they turn seven. Hence, individuals born just before or just after the new year, have about the same date of birth but start school at different ages. We exploit this source of exogenous variation, to identify the effects of age at school entry on test scores, grades, educational attainment and labor market performance. Using a rich data set for the entire Swedish population born 1935-84, we find that children who start school at an older age do better in school and go on to have more education than their younger peers. Children from families with weaker educational tradition have more to win from starting school later. The long-run earnings effects are positive but small. However, since starting school later entails the opportunity cost of entering the labor market later, the net earnings effect over the entire life-cycle is negative. Exploiting within-school variation in peer age composition, we find that the school starting age effect primarily is due to absolute maturity rather than to the relative age in the class. JEL Classification: J24, I21 Keywords: child education, school starting age, regression-discontinuity design Corresponding author: Peter Fredriksson Department of Economics Uppsala University P.O. Box 513 SE-751 20 Uppsala Sweden Email: [email protected]
∗ We gratefully acknowledge the helpful comments from Olof Åslund and Roope Uusitalo. We also thank seminar participants at the IUI (Stockholm), SOFI (Stockholm), IFAU, FIEF (Stockholm), NTNU (Trondheim) the Universities of Copenhagen, Helsinki, Montreal, and Växjö, as well as participants in the EALE/SOLE 2005 conference, the CEPR conference on “Education and Inequality” (Bergen, August 2004), and the first EEEPE work shop (Amsterdam, November 2004) for valuable comments. Öckert acknowledges the financial support from Jan Wallander’s Foundation.

Is Early Learning Really More Productive? 1
1 Introduction
Evidence from small-scale early childhood education experiments suggests sub-
stantial gains in both scholastic achievement and later outcomes for the partic-
ipating children (see Barnett, 1992; Currie, 2001 for two surveys). The relative
magnitudes of the returns involved have led some authors to propose a reallo-
cation of public spending from older to younger persons (for example Carneiro
and Heckman, 2003). However, the existing preschool evidence reflects the net
effects of multidimensional programs. These early interventions involve (i) more
schooling, (ii) formal learning at a young age and (iii) targeted training towards
disadvantaged children. Thus, the available preschool evidence is not very in-
formative about the virtues of early learning for the average individual.
Basic human capital theory suggests that children should start formal learn-
ing as soon as possible. First, individuals who start school earlier also enter
the labor market earlier, and can collect the returns from their human capital
investments over a longer time horizon. Second, the opportunity cost for go-
ing to school is lower if they enter the labor market earlier, since labor market
productivity can be assumed to increase with age.1 These arguments, however,
implicitly assumes that early learning is at least as productive as later learning.
There is, though, far from a consensus in the literature from different fields
on when children are most receptive to schooling. Evidence from developmen-
tal behavioral genetics and molecular genetics suggests that some age ranges of
child development (critical periods) are especially sensitive to the impact of spe-
cific types of experiences (Shonkoff et al., 2000). An extremist interpretation of
these results is that many important abilities are fairly set by the age of six, and,
hence, it is crucial that children start school early. Child developmentalists, on
the other hand, have traditionally stressed the importance of school readiness:
young children might not be mature enough to learn complicated things in a
school environment.
There are also alternative explanations of why age at school start should
matter. Children who start school early are also among the youngest in a class.
Educationalists and developmental psychologists typically see achievement dif-
ferences by month of birth within a class as relative age effects: children who
are young when they start school have the disadvantage of being youngest in
the class. On the other hand, economic theory predicts that older and more
able peers can generate positive peer group effects: being surrounded by older
children may generate benefits for younger children in school. Both these ex-
1In addition, they also have more work experience.

Is Early Learning Really More Productive? 2
planations suggest that changing the age at school start might not have that
big an effect as long as the peer group age composition is kept intact. All in all,
theory is inconclusive, and the age at which formal learning in a class room is
most productive is an empirical question.
The empirical educational literature on the relation between age at school
entry and (early) academic performance is extensive (see Stipek, 2002 for a
survey). One group of studies compares the outcomes of children who have
delayed entry with children who entered school when they were eligible. They
typically find that children who have been held back perform less well than
their same-age peers (Byrd et al., 1997; Graue and DiPerna, 2000; May et al.,
1995). These results are probably misleading, however, since the suspicion of low
academic performance is likely to be a source of delayed entry. Another group of
studies compares the outcomes of children who entered school when they were
eligible, but who differ in birth dates within the year. The evidence from this
literature suggests that the youngest children in a class score slightly below their
older peers, but that the differences tend to be small and transitory (Langer
et al., 1984; Jones and Mandeville, 1990; Mayer and Knutson, 1999; Cahan
and Cohen, 1989; Cahan and Davis, 1987). However, since low-performing
children born just before the school cut-off date (youngest in class) probably
are more likely to be held back than low-performing children born just after
the cut-off date (oldest in class), these studies tend to underestimate the effect
of school starting age.2 The common practice of retaining weaker children in
many countries, might also explain the declining school starting age effects with
grade level (Corman, 2003). Further, since age at test in compulsory school is
an exact linear function of age at school start and time spent in school, these
studies fail to separate the effect of age at school start from any general age
effect.
Economists have shown less interest in the effects of age at school start
on later performance. Angrist and Krueger (1992) use quarter of birth as an
instrument for age at school entry to estimate the effect of school starting age
on educational attainment. They find that children who start school at an older
age have less schooling than children who start school when they are younger.
However, since American compulsory schooling laws typically require students
to remain in school until their sixteenth or seventeenth birthday, individuals
who enter school at an older age reach the legal dropout age at an earlier point
in their educational careers than students who enter school later. Thus, the
2For this reason Cahan and Cohen (1989) exclude the months preceding and following the
school cut-off date.
Is Early Learning Really More Productive? 3
possible effects of school starting age are contaminated by the effects of school
leaving age legislations. For the same reason, estimates of quarter of birth
on education and earnings using American data are hard to interpret as the
(reduced form) effects of school starting age (e.g. Angrist and Krueger, 1991;
Bound et al., 1995; Mayer and Knutson, 1999).3
In this paper we estimate the effect of school starting age on performance in
school and on the labor market. We use rich administrative data for the entire
Swedish population born 1935-84, containing information on compulsory school
grades, educational attainment, employment and earnings. The endogeniety of
school starting age is accounted for by using expected age at school entry —
defined as the age when the child is supposed to start school according to her
month of birth and the school cut-off date — as an instrument for actual school
starting age. To break the exact linear dependence between age at school start,
age at test and time spent in school, we estimate the effects of school starting
age not only on compulsory school outcomes but also later in life. Individuals
born just before or just after the school cut-off date — and who have completed
compulsory school — then have about the same age and the same amount of
compulsory schooling, but differ in their expected school starting age by almost
a year. We also attempt to disentangle the effects of the absolute school starting
age from the effects of the relative age in the class, by exploiting within-school
variation in the peer group age composition.
The results show that children who start school when they are older do
better in all subjects in school. In particular, children with weaker educational
backgrounds have more to win from starting school later. Individuals who are
older when they start school also go on to have more schooling and are more
likely to graduate from college than other individuals. The earnings effects of
age at school start are negative for the youngest birth cohorts — since children
who start school later also enter the labor market later — but the long run effects
are positive (although small). The net effect over the entire life-cycle is negative.
The outline of this paper is as follows. The next section provides some basic
facts about child care and schooling in Sweden. Section 3 describes the data and
gives some descriptive statistics. In section 4 a graphical analysis is provided.
This is followed by empirical considerations in section 5 and the results in section
6. Section 7 concludes.
3Recently, a number of economists have shown interest in the effect of age at school start
and related questions; see, e.g., Plug (2001), Strøm (2003), Cascio and Lewis (2004), Del
Mondo and Galindo-Rueda (2004), Leuven et al. (2004), Bedard and Dhuey (2005), Datar
(2005), and Fertig and Kluve (2005).

Is Early Learning Really More Productive? 4
2 Child care and schooling in Sweden
Today, Sweden offers nine years of tuition-free compulsory education, generally
starting at age seven. Compulsory schooling provides comprehensive education,
so everyone follows basically the same curriculum; the curriculum is determined
by the central government.
Prior to entering school, all children participate in a Kindergarten-type of
preschool class starting at age six. However, there is also the possibility for
children to start regular schooling at age six. Most children below the age of
six are enrolled in child care. Child care is not free of charge, but is heavily
subsidized.
Upper-secondary school is voluntary and offers several programs, ranging
from vocational training to programs that prepare for further studies at the
university level. Today, practically all eligible students (meaning that they have
passed all courses at the compulsory level) go on to upper-secondary school.
University education is tuition free and anyone who has completed three
years of upper secondary education is generally eligible for university studies.
The total number of slots is determined by a central agency, so there is selection
into popular programs and universities. All university students are eligible for
student grants and subsidized student loans, provided that their income does
not exceed an income ceiling. The university enrollment rate appears to be
relatively high in Sweden: 42 percent of the population aged 20-24 participate
in education; the corresponding number for all OECD countries is 37 percent
(OECD, 2003).
On top of all this, there is also an extensive adult education program. The
typical adult education program consists of studies at the upper secondary level.
Adult education is subsidized to a greater extent than university studies.
For obvious reasons, we are mostly interested in the lower levels of schooling
in this paper. In the next subsection, therefore, we provide a description of
the evolution of compulsory education with particular emphasis on the school
starting age and child care.
2.1 The evolution of child care and schooling in Sweden
An important goal of Swedish education policy has been to equalize opportunity.
At least this is the impression you get from reading the policy documents. When
it comes to the concrete implementation of policies, the objective has been to
equalize educational outcomes per se and to reduce the importance of family
background in educational attainment. Indeed, the latter type of policies has

Is Early Learning Really More Productive? 5
also been motivated from an efficiency point of view.
Figure 1 presents a summary picture of educational attainment for successive
cohorts born between 1935 and 1975. The solid line depicts mean years of
schooling, while the dashed lines shows the mean ± one standard deviation of
the schooling distribution. As expected, mean years of schooling increases for
successive birth cohorts. What is perhaps most striking in this figure is the
substantial reduction in the spread of the schooling distribution. In fact, a
closer examination of the data reveals that the evolution of the mean, as well
as the standard deviation, is mostly driven by what goes on in the lower tail
of the schooling distribution. It thus seems that educational policies have been
primarily designed to lift the lower tail of the distribution during the 40 years
spanned by these birth cohorts.
6
8
10
12
14
16
Year
s of s
choo
ling
1935 1940 1945 1950 1955 1960 1965 1970 1975
Year of birthNote: The dashed lines show the mean ± 1 standard deviation.
Figure 1 Years of schooling, 1935-75 birth cohorts
Table 1 provides more details on the development of compulsory education
and the school starting age.4 Compulsory schools were formally introduced as
early as 1842. To start off with, the school starting age was varying between 5
and 9 years-of-age and the minimum school requirement was 4 years of educa-
tion. However, compulsory education was far from “compulsory”. It was not
until the late 1920s, that the vast majority (92 percent) fulfilled the minimum
school requirement of six years.
4We base this presentation on Gunnarsson et al. (1999).

6
Tabl
e 1
Dev
elopm
ent o
f Sw
edish
com
pulso
ry e
duca
tion
and
child
-car
e sy
stem
s
Y
ear
Des
crip
tion
Star
ting
age
Leng
th
Leav
ing
age
18
42
Intro
duct
ion
of b
asic
com
pulso
ry sc
hool
5-
9 4
9-13
1882
E
xten
sion
of b
asic
com
pulso
ry sc
hool
7
6 13
1905
In
trodu
ctio
n of
juni
or se
cond
ary
scho
ol (s
elect
ive)
13
3-
4 16
-17
1936
E
xten
sion
of b
asic
com
pulso
ry sc
hool
ing
7 7
14
1945
-52
Gra
dual
exte
nsio
n of
bas
ic co
mpu
lsory
scho
olin
g 7
8 15
1950
-67
Gra
dual
intro
duct
ion
of c
ompr
ehen
sive
com
pulso
ry sc
hool
7
9 16
1968
Co
mpr
ehen
sive
com
pulso
ry sc
hool
fully
intro
duce
d 7
9 16
1975
D
evel
opm
ent o
f chi
ld-c
are
1.5-
6 1-
4.5
6
In
trodu
ctio
n of
pre
scho
ol
6 1
7
1991
Le
gal r
ight
to c
hild
-car
e
1.5-
6 1-
4.5
6
Fl
exib
le sc
hool
star
t 6-
7 9
15-1
6
1998
In
trodu
ctio
n of
pre
scho
ol c
lass
6 1
7

Is Early Learning Really More Productive? 7
The school system during the first half of the 1900s was rather selective.
Moreover, compulsory schools were run locally and local authorities determined
the curriculum. However, this was changed by a parliamentary decision in
1950. A comprehensive school, with a nationally determined curriculum, was
introduced gradually across the country. The comprehensive school was fully
implemented all across the country in 1968.
The later reforms covered by Table 1 have concerned child care, pre-school,
and the school starting age. By international standards, public day-care has a
long history in Sweden: public allowances for day-care were introduced already
in 1944. The amounts were, however, small and day-care was primarily orga-
nized privately. In the 1970s, the public took a greater interest in day-care.
In 1976, the Swedish parliament decided on a massive increase in the number
of day-care slots. Despite the increase in the number of slots, the majority of
parents still had to organize day-care privately. In the mid 1980s, there was
yet another build-up of public day-care and in 1991 all children of working and
studying parents were given the legal right to a child care slot.
Figure 2 presents the share of 5 year-olds enrolled in child-care for the cohorts
born 1970-1996. The massive expansion of child-care is readily visible in the
data. The enrollment share is steadily increasing over time and roughly 80
percent of those born in 1996 is participating in child care.
0102030405060708090
1970 1972 1974 1976 1978 1980 1982 1984 1986 1988 1990 1992 1994 1996
Year of birth
Perc
ent
Figure 2 Share of 5 year-olds enrolled in child care, 1970-96 birth cohorts
Along with the initial build-up of child care, preschools were introduced in

Is Early Learning Really More Productive? 8
the mid 1970s. The preschools were given a greater class room training compo-
nent, when the so called preschool classes were introduced in 1998. Finally, a
flexible school start was introduced in 1991. From then on parents can enroll
their children in compulsory school at age 6 rather than at age 7; roughly three
percent of the cohorts born in 1991 and 1992 have used this possibility.
Given all these changes to child care, preschool, and the school starting age
it is legitimate to ask when formal schooling really starts in Sweden. If one
would argue that child care and pre-schools constitute formal schooling, then
the expected school starting age has declined from 4.9 years for the cohort born
in 1975 to 2.8 years for the cohort born in 1996.5 Let us make two observations
in this regard. First, our analyses of the long-run effects focus mostly on cohorts
born prior to 1975. For these cohorts, child care is only a minor issue. Second,
the regression-discontinuity design that we are utilizing (section 5 details our
empirical approach) only applies to the school year. Children eligible for child
care, at least in principle, have the right to a slot when they turn one whenever
this occurs during the year.
Nevertheless, the contents of “treatment” (starting school at a younger age)
and the “alternative” (starting at an older age) appear to be changing over
time. Changes in pedagogical techniques and the selectiveness of the entire
school system influence the treatment. Likewise, the alternative is changing for
successive birth cohorts. The alternative usually meant staying at home with
one parent for the cohorts born in the 1940s, 1950s, and most of the 1960s. But
for cohorts born in the 1970s it has increasingly become attending child care. To
deal with these concerns we will report separate estimates for successive birth
cohorts.
3 Data and descriptive statistics
The data have mainly been collected from administrative records but also from
some surveys. The administrative data originates from Statistics Sweden and
cover the entire population born in Sweden 1935-84. All in all, there are roughly
4.8 million observations.6 All individuals have been matched with different reg-
5Indeed this seems to be the view taken by policy makers in Sweden. What we are referring
to as child-care, is really called preschool in the policy documents. Moreover, Swedish child
care is considered early childhood education in international statistics.6We exclude all 900,000 immigrants (this may include native-born who have spent at least
a year abroad), since they lack reliable information on date of birth, school starting age and
years of schooling. Further, individuals who have deceased or emigrated by the year of 2000
are not covered by the data.

Is Early Learning Really More Productive? 9
isters using their unique identity number. Information on year and month of
birth originates from birth records, and should in principle not suffer from mea-
surement errors. Individuals born 1941-1982 have been linked to their biological
parents, and information on parental highest education have been obtained from
the censuses. The coverage of the parental information increases with year of
birth and is 80 per cent or higher for individuals born after 1960.
The school starting age is unfortunately not reported in Swedish adminis-
trative records. We will therefore use different data sources to construct such
a measure. For individuals born 1972-84 there is information on the year of
compulsory school completion (in ninth grade). Since grade retention or ad-
vancement rarely is practiced in Swedish schools, potential mis-classification is
a very minor issue.7 Therefore, we calculate the school starting age for these
cohorts as:
ASi = (Y OCi − Y OBi)− 9 +
µ8−MOBi
12
¶, (1)
where ASi is school starting age, Y OCi is the year of compulsory school comple-
tion, Y OBi is the year of birth (9 is the number of years in compulsory school),
and MOBi is the month of birth (ranging from 1 to 12, and 8 reflects the fact
that schools start in August). Thus, ASi is measured in yearly units but varies
by month of birth.
To obtain a measure of school starting age for earlier cohorts we make use
of the first and second surveys of the Individual Statistics (IS) project of the
Institute for Education and Educational Research at the University of Goteborg.
These two surveys cover all individuals born in Sweden on the 5th, 15th or 25th
of any month in 1948 or 1953, respectively. These data include intelligence test
scores and achievement test scores in sixth grade. For the 1948 cohort there
is information on the year the pupils entered grade one and in the 1953 cohort
there is data on the grade the individuals attended in the 1965/66 school year.
We use this information to calculate age at school entry (using equation (1)
with fewer years of compulsory schooling). The school starting age in the IS
samples is then regressed on month of birth to predict the school starting age
for the 1935-71 cohorts in the administrative data.
7Corman (2003) and Eide and Sholwater (2001) show that grade retention and advancement
is strongly related to season of birth in the U.S. In Sweden, however, children rarely repeat
or skip grades. Data for the 1960s suggest that half of those finishing late (only 3.6 % of the
population) were retended during compulsory school. As we show in Table 3, the first-stage
coefficient in the regression of the actual school staring age on the expected school starting
is 0.91. The data for the 1960s, then suggest that absent misclassification this reduced form
coefficient would be in the order of 0.96. Whether we construct the ”structural” estimate
using 0.91 or 0.96 is of no practical importance.

Is Early Learning Really More Productive? 10
Final grades from compulsory school is collected by Statistics Sweden for the
1988-2000 period. The normal graduation age is 16 years, so this information is
in principle available for the 1972-1984 cohorts. However, due to delayed entry
for some individuals, we have complete compulsory school grades for the 1975-83
cohorts only.8 The register contains information on grades for all subjects. In
most of the period studied, the grading system was relative. The grades ranged
from 1 to 5 (with 5 being the highest grade) and were set such that the national
average was 3 (with a unit standard deviation). With the implementation of a
new curriculum — which affected those graduating in 1998 — the relative grading
system was replaced with an absolute (or goal-oriented) system. There are four
levels of grades in the new system: fail, pass, pass with distinction and pass
with special distinction. To make these different grading systems comparable,
we attach a percentile rank to each grade for all subjects.9
To guide teachers in their grading, national achievement test have been un-
dertaken in both the old and the new grading system. These results are, how-
ever, only advisory, and teachers might deviate from them. As long as teachers
do not systematically overcompensate or punish some groups, this should not
be a problem. To assess the information value contained in the grades we use
data from the IS surveys, which, as already noted, contain information on, inter
alia, achievement test scores.
Statistics Sweden collects information on the highest level of education com-
pleted for all individuals. We convert the highest educational level attained into
years of education using the Swedish Level of Living Survey (SLLS) conducted
in 2000. The SLLS contains information on educational attainment and labor
market success for a representative sample of individuals between 18 and 75
years, in all about 5,000 observations. What is convenient for our purposes is
that it includes both register information on highest level of education and sur-
vey information on time spent in school. We predict years of education for the
entire population using the estimates from a regression of years of education in
the SLLS on the educational levels according to the register information. To
allow years of schooling associated with each level of education to vary smoothly
across cohorts, we estimate separate regressions for each birth cohort (± five
cohorts).
8To get complete data for a full birth cohort, compulsory school grades for individuals who
have an early (delayed) school start or who have been advanced (retained), are collected from
the preceeding (subsequent) school years.9Hence, we have ranked the grades in the old and the new system separately. In the
empirical analysis, we let year of birth fixed effects capture any cohort trends in the grades.

11
Tabl
e 2
Mon
th o
f birt
h an
d tim
ing
of sc
hool
star
t (pe
rcen
tage
poi
nts)
, 197
5-19
83 b
irth
coho
rts
Ja
nuar
y Fe
brua
ry
Mar
ch
Apr
il M
ay
June
Ear
lier s
choo
l sta
rt 2.
58
1.28
0.
81
0.61
0.
40
0.32
Nor
mal
scho
ol st
art
96.6
4 97
.87
98.2
2 98
.31
98.2
4 98
.06
Dela
yed
scho
ol st
art
0.79
0.
86
0.97
1.
08
1.36
1.
63
n 66
,361
65
,816
77
,092
75
,932
72
,516
66
,912
Ju
ly A
ugus
t Se
ptem
ber
Oct
ober
N
ovem
ber
Dec
embe
r
Ear
lier s
choo
l sta
rt 0.
25
0.15
0.
14
0.10
0.
06
0.02
Nor
mal
scho
ol st
art
97.9
4 97
.72
97.3
8 96
.88
95.4
1 91
.14
Dela
yed
scho
ol st
art
1.81
2.
13
2.49
3.
02
4.52
8.
84
n 67
,394
65
,036
64
,987
61
,507
56
,215
56
,560
N
ote:
Nor
mal
scho
ol st
artin
g ag
e is
betw
een
6.8
and
7.7
year
s dep
endi
ng o
n m
onth
of b
irth.

Is Early Learning Really More Productive? 12
Our earnings measure is based on register information. It is measured as of
2000 and defined as the sum of annual gross wage earnings and compensation
during temporary work absence (basically due to illness or parental leave) in
SEK.10
The average school starting age in our sample is 7.2 years.11 Children typi-
cally start school between the ages 6.8 and 7.7, but some children start school
already at the age of five and others not until they turn ten years old. Table
2 shows the share of children with an early, normal or delayed school start by
month of birth for the 1975-83 birth cohorts. Even though parents and school
administrators can affect the timing of the children’s school start to some ex-
tent, roughly 97 per cent of all children start school the year they turn seven.
The probability of a delayed or an early school start varies with month of birth.
About 2.6 per cent of the children born in January start school one year too early.
The probability of an early school start falls monotonically for later months of
birth, and is negligible for children born in December. The opposite pattern is
found for delayed school start, where as much as 8.8 per cent of children born
in December begin school one year late. The share of children with a delayed
school start falls monotonically for children born earlier in the year.
4 Graphical analysis
In Sweden, only three per cent of the children start school earlier or later than
the year when they turn seven. Such a small share might seem negligible,
but might still be enough to produce a misleading correlation between school
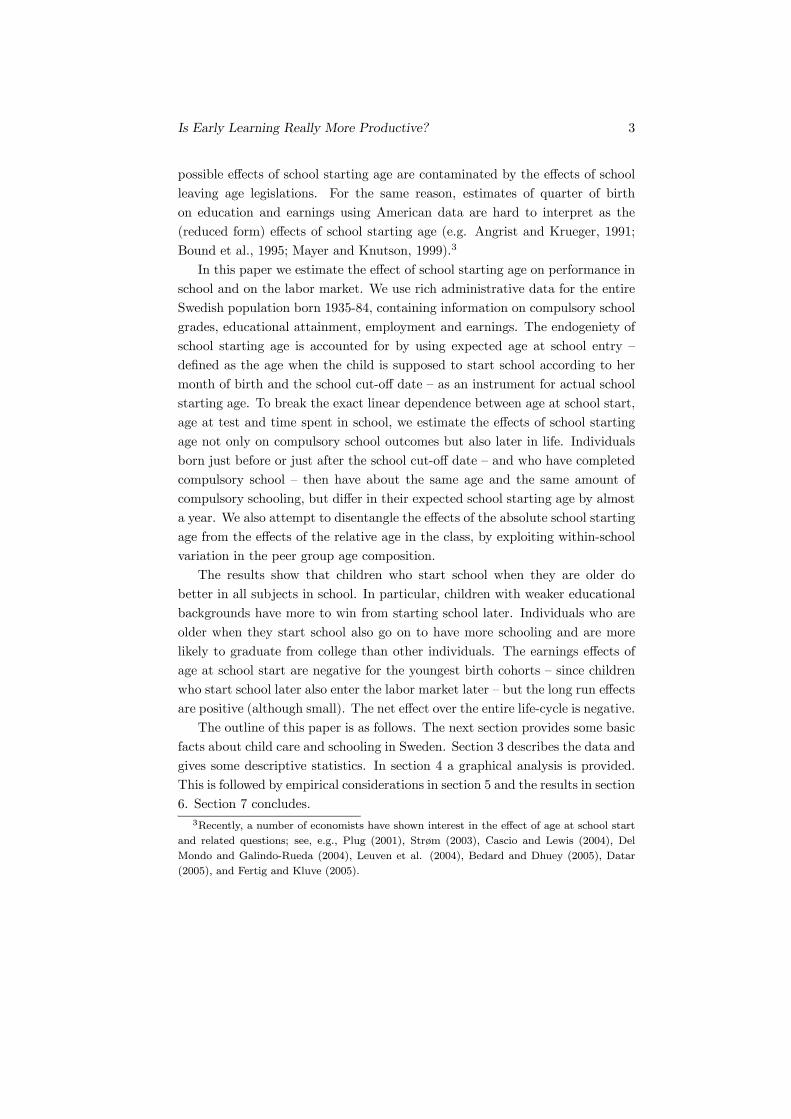
starting age and later performance. Figure 3 shows the relation between age
at school start and the ninth grade grade point average (GPA) for the 1975-83
birth cohorts. The performance in compulsory school by school starting age
exhibit a stepwise negative relationship. Taken at face value, this would suggest
that children who start school earlier do better than children who start school
later. Note, however, that the downward trend, is driven by sharp ”falls” in
the performance just at the minimum and maximum normal school starting age
(6.8 and 7.7 years, respectively). Within each segment of early, normal and
delayed school starters, there seems to be no or — in particular for the group
of normal school starters — a positive relation between the age at school entry
and ninth grade GPA. This highly irregular relation between age at school start
10The information comes from the tax assessment as well as the employers’ and authorities’
statements of income and allowances.11Table A1 in Appendix reports descriptive statistics for the 1935-84 birth cohorts.
Is Early Learning Really More Productive? 13
and compulsory school performance is, thus, likely to be due to the non-random
selection of children with early or delayed school start and cannot be given a
causal interpretation.
30
40
50
60
70
GPA
5.7 Early start 6.7 Normal start 7.7 Delayed start 8.7
School starting ageNote: Ninth grade GPA is in percentile ranks.
Figure 3 School starting age and GPA, 1975-83 birth cohorts
The empirical strategy in this paper is to exploit the exogenous variation
in school starting age caused by the children’s month of birth and the school
cut-off date. The school starting age legislations induces the following expected
school starting age function:
fAS
i = 7.7− MOBi − 112
, (2)
where fAS
i is the age child i is expected to start school. Children born in
January (MOBi = 1) typically start school at 7.7 years. For individuals born
later in the year, the expected school starting age function falls monotonically
to 6.8 years for children born in December. The function then makes a sharp
jump back to 7.7 years at January 1st, generating a saw-teeth shaped pattern
for age at school entry by month of birth.
Earlier studies of the effect of school starting age typically focus on the
performance in compulsory school. Usually, the data is collected for all pupils
born a specific year who are in the same grade. Although we use data on early
academic achievement for all individuals in a birth cohort (and not only those
who have a normal school start), our study of early outcomes is not an exception.
Is Early Learning Really More Productive? 14
There is, however, an exact linear dependence between age, age at school start
and time spent in school for children still enrolled in compulsory school:
Ait = ASi + SCit , (3)
where Ait is age at t (the time of data collection), ASi is school starting age
and SCit is compulsory schooling at t. Children who start school when they are
somewhat older, are, thus, somewhat older also when they do the test (or get
the grades) in a given grade. Again, using the school starting age legislations,
expressions (2) and (3) can be used to derive an expected age function at time
t for children in a given grade:
fAit = fAS
i + sCt = 7.7−MOBi − 1
12+ sCt , (4)
where fAit is the expected age function and sCt is a given grade in compulsory
school. The only difference between the expected school starting age and the
expected age functions is the constant grade level. It is, thus, not possible to
freely vary expected age and expected age at school entry for children enrolled
in the same grade of compulsory school. So differences in compulsory school
performance by month of birth may reflect not only school starting age effects
but also age effects.
Figure 4 illustrates the expected age and expected school starting age pro-
files induced by the school starting age legislations for different data collection
strategies. When the data are collected for all individuals in the same grade of
compulsory school, the saw-teeth shaped pattern for the expected school start-
ing age function is transmitted to the expected age function. This is illustrated
in Panel A of Figure 4. Children born just after the school cut-off date start
school one year later than children born just before the cut-off. Since the data
is collected in the same grade, the outcomes of children born in January are col-
lected one year later than for children born in December. Consequently, children
born just after the break-point are older when they start school and when they
do the test (or get the grade) than children born just before the break-point.

Is Early Learning Really More Productive? 15
Figure 4 Age and school starting age profiles induced by the school starting age legislation and different data collection strategies
Panel A Repeated cross-sectional data collected in the same grade of compulsory school at different points of time.
Expected schoolstarting age
CompulsorySchooling
Expected ageYear
s
January January January January January
Month of birth
Panel B Cross-sectional data collected after compulsory school at the same point of time.
Expected schoolstarting age
CompulsorySchooling
Expected ageYear
s
January January January January January
Month of birth
Note: The figure shows prototypical age and school starting age profiles induced by the school starting age legislations and different data collection strategies. Panel A shows the profiles for repeated cross-sectional data collected for all individuals in a given grade of compulsory school at different points of time. Panel B shows the profiles for cross-sectional data collected for all individuals after compulsory school at the same point of time, respectively.

Is Early Learning Really More Productive? 16
To break the exact linear dependence between age, age at school entry and
time spent in compulsory school, we use data collected at the same point in time
for individuals who have completed their compulsory schooling. The expected
age function then corresponds to the individuals’ actual age, and is not affected
by the age at school entry. This is illustrated in Panel B of Figure 4. In
particular, children who are born just before or just after January 1st have
approximately the same age at the time of observation, the same amount of
compulsory schooling but start school at different ages. For this population,
the only difference is their expected age at school entry. The timing of the
data collection is, thus, crucial for separately identifying the effect of the school
starting age; this point is also made by Hansen et al. (2004).
Figure 5a shows the ”first-stage” relation between expected and actual age
at school entry by year and month of birth. Clearly, the actual age at school
start follows closely the age when children are expeted to start school. Children
born early in the year on average start school at the age of 7.7 years. The
age at school entry then falls monotonically by month of birth to about 6.8
years for children born in December. It then jumps back to an average school
starting age of 7.7 years for children born the following January, generating a
saw-teeth pattern between age at school entry and date of birth. This suggests
that children born on different sides of the new year typically start school with
an age difference of almost a year.
6.8
7
7.2
7.4
7.6
Scho
ol st
artin
g ag
e
1975 1976 1977 1978 1979 1980 1981 1982 1983 1984
Date of birth
Expected school starting age Actual school starting age
Note: Expected school starting age is the age when an individual is expected to start school according tomonth of birth and the school cut-off date.
Figure 5a Expected and actual school starting age by date of birth, 1975-83 birth cohorts

Is Early Learning Really More Productive? 17
In addition to exhibiting a strong association with the actual school starting
age, the expected school starting age is also correlated with the average ninth
grade GPA. This is shown in Figure 5b. The average GPA follows closely the
saw-teeth pattern of the average school starting age, with sharp jumps in student
achievement just around the school cut-off date. Hence, children born in the
beginning of the year on average perform better in school than children born
later. The difference in average GPA between January and December births is
about 5 percentile points. Even though it is, in principle, possible for parents
to plan the date of birth for their children, it is hard to imagine that this can be
accomplished with greater accuracy. Hence, it is reasonable to believe that the
variation in age at school entry driven by month of birth and the school cut-off
date is exogenous, and that the better performance of children born early in the
year is caused by the differences in the school starting age.
47
48
49
50
51
52
53
54
GPA
6.8
7
7.2
7.4
7.6
Expe
cted
scho
ol st
artin
g ag
e
1975 1976 1977 1978 1979 1980 1981 1982 1983 1984
Date of birth
Expected school starting age GPA
Note: Expected school starting age is the age when an individual is expected to start school according tomonth of birth and the school cut-off date. Ninth grade GPA is in percentile ranks.
Figure 5b Expected school starting age and GPA by date of birth, 1975-83 birth cohorts
The observed relation between month of birth and ninth grade GPA might
reflect differences in school starting age and/or differences in age. To separate
the effect of age at school entry from any general age effect — and to study the
long-run effects of school starting age — we next present data on schooling and
earnings by month of birth. As noted in Figure 1, there is a strong positive
trend in educational attainment for cohorts born 1935-75. Also, we expect the
standard concave age-earnings profiles to produce a negative trend in earnings
by year of birth. To abstract from any general time trends, we detrend the data

Is Early Learning Really More Productive? 18
on schooling and earnings by month of birth by subtracting off the average for
each birth cohort.
Figures 6a-6d depict the relationship between average years of education in
2000 and season of birth for each ten-year birth cohort. The figures clearly show
that season of birth is related to educational attainment. Contrary to what An-
grist and Krueger (1991) find, however, individuals born in January have more
schooling on average than those born in December. Thus the sharp discontinu-
ity in the expected school starting age is translated into big jump in educational
attainment around the break-point. This pattern is strongest for those born in
the 1940s and the regularity holds for all birth cohorts born before 1975. For
those born in the late 1970, the relationship is reversed. This is because these
individuals have not yet finished their educational careers. Individuals born in
the beginning of the year start school one year later, and, thus, are more likely
to still be enrolled in school or college than individuals born at the end of the
year. The schooling figures indicate that the observed relation between season
of birth and ninth grade GPA cannot solely be explained by age differences.
Individuals born at the end of the year or in the beginning of the next have
about the same age but start school at different ages. There, thus, seems to be
a long-lasting positive effect of age at school start on educational attainment.
-.2
-.1
0
.1
.2Ye
ars o
f sch
oolin
g
6.8
7
7.2
7.4
7.6
Expe
cted
scho
ol st
artin
g ag
e
1940 1941 1942 1943 1944 1945 1946 1947 1948 1949 1950
Date of birth
Expected school starting age Years of schooling
Note: Expected school starting age is the age when an individual is expected to start school according tomonth of birth and the school cut-off date. The years of schooling variable has been detrended by subtractingoff the average years of schooling for each birth cohort.
Figure 6a Expected school starting age and years of schooling by date of birth,1940-49 birth cohorts

Is Early Learning Really More Productive? 19
-.1
0
.1
Year
s of s
choo
ling
6.8
7
7.2
7.4
7.6
Expe
cted
scho
ol st
artin
g ag
e
1950 1951 1952 1953 1954 1955 1956 1957 1958 1959 1960
Date of birth
Expected school starting age Years of schooling
Note: Expected school starting age is the age when an individual is expected to start school according tomonth of birth and the school cut-off date. The years of schooling variable has been detrended by subtractingoff the average years of schooling for each birth cohort.
Figure 6b Expected school starting age and years of schooling by date of birth,1950-59 birth cohorts
-.1
0
.1
Year
s of s
choo
ling
6.8
7
7.2
7.4
7.6
Expe
cted
scho
ol st
artin
g ag
e
1960 1961 1962 1963 1964 1965 1966 1967 1968 1969 1970
Date of birth
Expected school starting age Years of schooling
Note: Expected school starting age is the age when an individual is expected to start school according tomonth of birth and the school cut-off date. The years of schooling variable has been detrended by subtractingoff the average years of schooling for each birth cohort.
Figure 6c Expected school starting age and years of schooling by date of birth,1960-69 birth cohorts

Is Early Learning Really More Productive? 20
-.2
-.1
0
.1
.2
Year
s of s
choo
ling
6.8
7
7.2
7.4
7.6
Expe
cted
scho
ol st
artin
g ag
e
1970 1971 1972 1973 1974 1975 1976 1977 1978 1979 1980
Date of birth
Expected school starting age Years of schooling
Note: Expected school starting age is the age when an individual is expected to start school according tomonth of birth and the school cut-off date. The years of schooling variable has been detrended by subtractingoff the average years of schooling for each birth cohort.
Figure 6d Expected school starting age and years of schooling by date of birth,1970-79 birth cohorts
Figures 7a-7d show the expected school starting age and detrended median
log earnings in 2000 for each ten-year birth cohort between 1940 and 1980.12 The
pattern is considerably more erratic for earnings than for education. However,
the sharp increase for those born in January relative to those born in December
is still visible in the data for those born in the 1940s. In particular, the effect is
substantial for individuals born in the early 1940s (note the scale differences in
Figures 7a-7d), i.e. for those who are approaching their retirement age (typically
at their 65 birthday). This suggests that individuals who are more likely to start
school one year earlier are also more likely to leave the labor market earlier.
Hence, the argument that children should enrol in school earlier, so that they can
collect the returns from their human capital investments for a longer time, might
not be so obvious. That starting school later entail a substantial opportunity
cost is shown by the data for those born in the second half of the 1970s. The
pattern between date of birth and log earnings is reversed for these individuals.
Thus those who begin school at an older age enter the labor market later. Also,
there is a higher probability for individuals born in the beginning of the year
to still be enrolled in school or college. Finally, they typically have one year of
labor market experience less.
12Notice that individuals with no earnings are included in the sample and assigned the
lowest value of log earnings.

Is Early Learning Really More Productive? 21
-.1
-.05
0
.05
.1
.15
Log
earn
ings
6.8
7
7.2
7.4
7.6
Expe
cted
scho
ol st
artin
g ag
e
1940 1941 1942 1943 1944 1945 1946 1947 1948 1949 1950
Date of birth
Expected school starting age Log earnings
Note: Expected school starting age is the age when an individual is expected to start school according tomonth of birth and the school cut-off date. The median log earnings has been detrended by subtractingoff the median log earnings for each birth cohort.
Figure 7a Expected school starting age and log earnings by date of birth,1940-49 birth cohorts
-.01
-.005
0
.005
.01
Log
earn
ings
6.8
7
7.2
7.4
7.6
Expe
cted
scho
ol st
artin
g ag
e
1950 1951 1952 1953 1954 1955 1956 1957 1958 1959 1960
Date of birth
Expected school starting age Log earnings
Note: Expected school starting age is the age when an individual is expected to start school according tomonth of birth and the school cut-off date. The median log earnings has been detrended by subtractingoff the median log earnings for each birth cohort.
Figure 7b Expected school starting age and log earnings by date of birth,1950-59 birth cohorts

Is Early Learning Really More Productive? 22
-.02
-.01
0
.01
.02
Log
earn
ings
6.8
7
7.2
7.4
7.6
Expe
cted
scho
ol st
artin
g ag
e
1960 1961 1962 1963 1964 1965 1966 1967 1968 1969 1970
Date of birth
Expected school starting age Log earnings
Note: Expected school starting age is the age when an individual is expected to start school according tomonth of birth and the school cut-off date. The median log earnings has been detrended by subtractingoff the median log earnings for each birth cohort.
Figure 7c Expected school starting age and log earnings by date of birth,1960-69 birth cohorts
-.2
-.1
0
.1
.2
Log
earn
ings
6.8
7
7.2
7.4
7.6
Expe
cted
scho
ol st
artin
g ag
e
1970 1971 1972 1973 1974 1975 1976 1977 1978 1979 1980
Date of birth
Expected school starting age Log earnings
Note: Expected school starting age is the age when an individual is expected to start school according tomonth of birth and the school cut-off date. The median log earnings has been detrended by subtractingoff the median log earnings for each birth cohort.
Figure 7d Expected school starting age and log earnings by date of birth,1970-79 birth cohorts
All in all, date of birth and the school cut-off date generate exogenous vari-
ation in age at school entry. Actual school starting age by month of birth
follows a saw-teeth shaped pattern, with those being born in the beginning of
the year being more likely to be older when they start school. The relationship
between ninth grade GPA and month of birth follows closely the pattern found

Is Early Learning Really More Productive? 23
for the school starting age, suggesting that children who start school when they
are somewhat older do better than children who start school when they are
younger. Using data on later outcomes, we find that individuals born just be-
fore the school cut-of date not only do better in school, they also go on to have
more education and somewhat higher earnings. Assuming that parents can not
plan births in detail, this can plausibly be attributed to differences in the school
starting age.
5 Empirical considerations
Figures 4 to 7 suggest a clear link between the variation in age at school entry
induced by the school starting age legislations and the performance in school
and later in life. However, to be able draw some inference there is need for a
more formal analysis. Assume that the outcome (e.g. test scores, grades, years
of schooling or earnings) for individual i at time t (the time of data collection)
can be written as:
Yit = β0 +Aitβ1 + SCitβ2 +ASi β3 +Xitβ4 + εit, (5)
where Ait denotes age, SCit compulsory schooling, A
Si the school starting age,
Xit a vector of individual characteristics, and εit an individual specific error
component. The school starting age coefficient β3 is the parameter of primary
interest.
There are two main empirical problems with estimating (5) using OLS. First,
since parents and school administrators can affect the age when the children
start school, age at school entry is endogenous (E£ASi εit
¤ 6= 0). Hence, OLS
estimates of β3 might suffer from bias.13 Second, for individuals still enrolled
in compulsory school, there is an exact linear dependence between age, age at
school start and time spent in school (Ait = ASi + SCit ). It is, thus, not possible
to separately identify β1, β2 and β3 for this population.
The empirical strategy taken in this paper is to exploit the exogenous vari-
ation in age at school entry driven by the children’s month of birth and the
school cut-off date. In particular, children born on each side of the new year,
are born at about the same time but differ in their school starting age. This is
an application of Thistlethwaite and Cambell’s (1960) regression-discontinutiy
design, where the regressor of interest (school starting age) can be expressed as
13In accordance with the Swedish compulsory schooling laws, we assume that individuals
cannot affect the length of their compulsory schooling. Hence, we do not treat compulsory
schooling as an endogenous variable.

Is Early Learning Really More Productive? 24
a known discontinuous function of an underlying variable (date of birth). To
exploit the exogenous variation induced by the school starting age legislations,
we will use the expected school starting age function (fAS
i ) as an instrument
for actual age at school entry (ASi ). The ”first-stage” relation can, thus, be
expressed as:
ASi = π0 +Aitπ1 + SCitπ2 + fA
S
i π3 +Xitπ4 + ηit. (6)
Since fAS
i is a deterministic discontinuous function of date of birth, and since
age (date of birth) is related both to earnings and educational attainment, it
is crucial to account for any direct effect of age on the outcome. Our main
approach is to add flexible specifications of date of birth to the model. In
particular, we specify birth cohort fixed effects together with a linear month
of birth trend to capture (possibly) nonlinear effects of date of birth. Note,
however, that adding year-of-birth dummy variables would divide time into
calendar years, which is exactly what the school starting age legislation does.
To be able to exploit the variation in the school starting age around the new
year, we therefore shift the year-of-birth variables six months. Hence, time
is divided into one-year-long intervals ranging from July 1st to June 30th the
following year (as opposed to January 1st and December 31st the same year).
The identifying assumption in this model is, thus, that the shifted year of birth
dummies and the linear month of birth trend can remove any direct effect of
date of birth on the outcome. For the long-run outcomes (collected at the
same point in time), including these controls removes any direct effect of age on
the outcomes. As a specification test, we will, however, restrict the sample to
individuals born close to the school cut-off date, i.e. those born in December or
in January.
All outcome measures are collected at a given amount of compulsory school-
ing; either in the same grade of compulsory school or when compulsory school
is completed. Hence, our data implicitly hold time spent in compulsory school
constant and we can drop SCit from the model. As noted above, the timing of the
data collection is crucial for what the estimates reflect. For outcomes collected
in the same grade of compulsory school, there is no independent variation in age
and age at school start. These estimates may, thus, reflect the combined effect of
age and age at school entry. For outcomes collected after compulsory schooling,
the exact linear dependence between age, age at school start and compulsory
schooling is no longer binding. These estimates will, thus, separately identify
the effect of school starting age.
Is Early Learning Really More Productive? 25
6 Regression results
The purpose of this section is to present a collection of evidence pertaining to the
importance of age at school start for schooling and labor market outcomes. We
begin in section 6.1 with compulsory school outcomes and in section 6.3 we look
at labor market outcomes. Outcomes in school is the natural place to start,
although it is then generally not possible to separate the effect of the school
starting age from the effect of age differences when the outcome is measured.
However, the compulsory school outcomes are interesting, in particular since
the descriptive analysis in section 4 showed that there are long-run effects of
differences in the school starting age.
In section 6.2 we address a question of great policy significance. Is the school
starting age effect due to the fact that it is more productive to start class room
training (earlier or) later or is it due to the fact that those starting school at
an older age are relatively older within class? If it is primarily a relative age
effect, then our estimates may have little to say about the fundamental policy
question: Should formal learning start at an earlier or a later age? To address
these issues, we make use of the arguably stochastic variation across cohorts
within school in the age composition of the individuals’ peers. This strategy
enables us to obtain a measure of the individuals’ relative position in the age
distribution. To precede the results, we show in section 6.2 that the relative age
of the kids matters but that the effect is minor.
Section 6.3 addresses the long-run effects of differences in the school starting
age. We focus on two outcomes: education attainment and earnings. As hinted
at earlier, the effects of the school starting age persist into adulthood.
6.1 Compulsory school outcomes
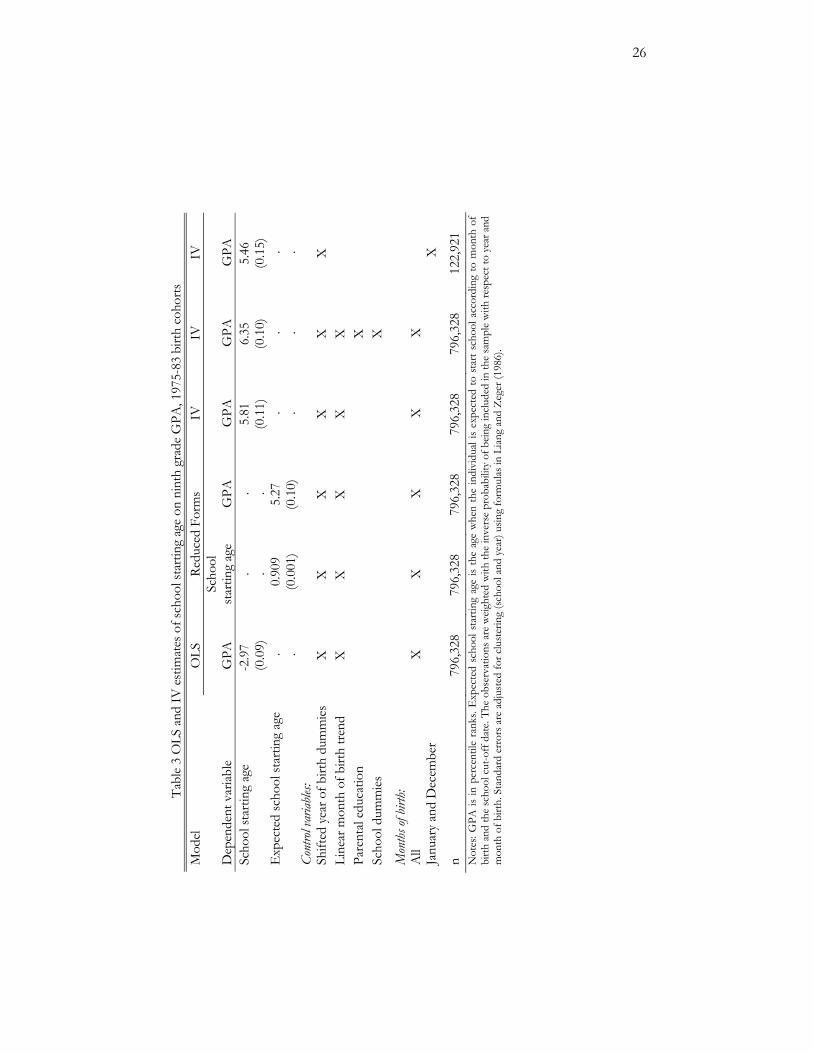
In Table 3 we examine the relationship between the school starting age and the
grade point average. The grade point average pertains to the ninth grade and
we base the estimates on the 1975-83 birth cohorts.
The first column presents the simple OLS estimates. The association be-
tween the actual school starting age and student performance is negative. How-
ever, this should clearly not be interpreted as the causal effect of the school
starting age. Instead, it is driven by the fact that early starters is selected from
the pool of well-performing pupils while those with a delayed school start is
selected from the pool of under-achievers (see Figure 3).
26
Tabl
e 3
OLS
and
IV e
stim
ates
of s
choo
l sta
rting
age
on
nint
h gr
ade
GPA
, 197
5-83
birt
h co
horts
M
odel
OLS
Re
duce
d Fo
rms
IV
IV
IV
Dep
ende
nt v
ariab
le
GPA
Sc
hool
st
artin
g ag
e
GPA
GPA
GPA
GPA
Scho
ol st
artin
g ag
e -2
.97
.
. 5
.81
6.35
5.
46
(0
.09)
.
. (0
.11)
(0
.10)
(0
.15)
E
xpec
ted
scho
ol st
artin
g ag
e .
0.9
09
5.
27
. .
.
. (0
.001
) (0
.10)
.
. .
Cont
rol va
riable
s:
Sh
ifted
yea
r of b
irth
dum
mies
X
X
X
X
X
X
Li
near
mon
th o
f birt
h tre
nd
X
X
X
X
X
Pa
rent
al ed
ucat
ion
X
Sc
hool
dum
mies
X
Mon
ths o
f birt
h:
A
ll X
X
X
X
X
Janu
ary
and
Dec
embe
r
X
n 79
6,32
8 79
6,32
8 79
6,32
8 79
6,32
8 79
6,32
8 12
2,92
1 N
otes
: GPA
is in
per
cent
ile r
anks
. Exp
ecte
d sc
hool
sta
rting
age
is th
e ag
e w
hen
the
indi
vidu
al is
expe
cted
to s
tart
scho
ol a
ccor
ding
to m
onth
of
birth
and
the
scho
ol c
ut-o
ff da
te. T
he o
bser
vatio
ns a
re w
eight
ed w
ith th
e in
vers
e pr
obab
ility
of b
eing
inclu
ded
in th
e sa
mpl
e w
ith re
spec
t to
year
and
m
onth
of b
irth.
Sta
ndar
d er
rors
are
adj
uste
d fo
r clu
ster
ing
(sch
ool a
nd y
ear)
usin
g fo
rmul
as in
Lian
g an
d Z
eger
(198
6).

Is Early Learning Really More Productive? 27
That selection biases the OLS estimate is illustrated by the two reduced
form relationships presented in columns 2 and 3. It comes as no surprise that
the relationship between the actual school starting age and the expected school
starting age is very strong (and positive). Moreover, the relationship between
the GPA and the expected school starting age is positive. These two reduced
forms imply our preferred IV estimate presented in column 4. Relative to the
OLS estimate, the IV approach reverses the relationship between the school
starting age and student performance. The causal effect of starting school at an
older age is thus positive. The result of increasing the school starting age by a
year is that the GPA increases by almost 6 percentile points (which corresponds
to 0.2 standard deviations of the transformed GPA distribution).
As illustrated in section 4, our identifying variation comes from the sharp
school starting age difference between January and December kids. Whether
children are born in December or January would appear to be largely random
and therefore, our baseline specification includes a very limited set of controls;
the baseline specification only includes a linear age variable and cohort dummies.
A priori, we could see little reason for such factors as family background, gender,
and school take-up area to bias our estimates. However, if we include such
characteristics, the estimate increases by approximately 10 percent as shown
by column 5. A closer look at the data, reveals that it is family background
that produces the increase in the estimate. Children of highly educated parents
tend to be born in December to a greater extent than children of less skilled
parents. Despite this finding, we proceed with the limited set of covariates in
column 4. The reason is that we have no information on parental education
for the older cohorts that we examine in section 6.3. The reader is advised to
remember that the estimates are probably biased downwards because we fail to
control for family background.1415
The sharp discontinuity in the school starting age for children born in De-
cember and January also implies that we can control for any smooth function
of date of birth and still be able to identify the parameter of interest. We have
tried adding higher order polynomials in date of birth, but this does not affect
14It is reassuring that the bias because of failing to control adequately for family background
goes the ”right” way. The result we have is that student performance is positively affected by
the school starting age. Our baseline estimates are thus biased against this conclusion.15In fact, there is an additional source of downward bias in our estimates. Roughly 2
percent of the cohorts born 1975-83, living in Sweden in 2000, have no grades whatsoever.
These individuals are not in our data on grades and, hence, we miss some key information.
However, the probability of not being included in the data on grades is decreasing in the
school starting age. So, if we think that missing grades data is an indication of poor school
achievement, there is a slight downward bias in our estimates.

Is Early Learning Really More Productive? 28
the estimate and the coefficients on the higher order polynomials are not sig-
nificant. We have also limited the sample to January and December kids; see
column 6. This has only a minor effect on the estimate. Moreover, the difference
between the two estimates is not significant at the 5 % level
Having subjected the baseline specification to a number of specification tests
we proceed to Table 4. In Table 4, we report separate estimates by subject, gen-
der, and family background using the baseline specification. Column 1 contains
the estimates by subject for the entire sample. Prior to the introduction of
the new grading system, students could opt for general and advanced classes in
English and Math. The grades from a general and an advanced class are not
comparable. Therefore, for the cohorts born 1975-1980, we regress the proba-
bility of attending an advanced class for these two subjects.16
Overall, the estimates of the key parameter of interest are remarkably stable
across subjects. When student performance is measured by grades, the effect of
starting a year later hovers around 6 percentile points. The exception from this
rule is sports. To some extent this comes as no surprise. Physical development
is of course a key ingredient in sports. Sporting activities are also conducted
outside the school to a greater extent than for the academic subjects. Therefore,
one would think that early advantages tend to persist in sports because sporting
activities outside schools tend to be more selective. There is also a substantial
literature documenting the importance of season of birth for success in sports;
see Musch and Grondin (2001) for a survey.
Turning to the gender differences presented in columns 2 and 3 of Table 4,
the school starting age effects do not appear to vary across gender. Again, there
is one exception — sports. The starting age is more important for boys. This
may be due to the fact that they participate in sporting activities outside the
school to a greater extent than girls, and as argued above, the total amount of
selection in sports is greater than in any other subject.
Finally, columns 4 and 5 report separate estimates by parental education.
Kids having at least one parent with at least three years of upper secondary
education are defined as having ”Academic parents”. As shown by these two
columns, this is the point where there is some coefficient heterogeneity. The
starting age has a bigger positive effect for those who have parents that are
relatively less skilled. The most striking difference across the two groups per-
16At face value, it is somewhat hard to compare the magnitudes of the estimates across the
two defintions of the outcome variables in Table 4. Note, though, that the estimate pertaining
to the probability of attending an advanced class in Math corresponds (again) to an effect
size of 0.2 standard deviations.

Is Early Learning Really More Productive? 29
tains the probability of attending advanced classes in Math and English. For
instance, in English the effect for kids with relatively less skilled parents is twice
the size of the effect for kids with more skilled parents. We think it makes sense
to see the greatest differences when it comes to these two outcomes. The choice
of attending an advanced class probably reflects family background to a greater
extent than grades. Having an initial advantage due to a later school start ap-
pears to be more important for outcomes that tend to be more ”constrained”
by family background.
Table 4 IV estimates of school starting age on ninth grade outcomes, 1975-83 birth cohorts
All
Females
Males Academic parents
Non-academic parents
Grades GPA 5.81 5.89 5.85 5.20a 5.87a (0.11) (0.15) (0.15) (0.15) (0.15) Swedish 6.11 6.52b 5.97b 5.45a 6.18a (0.14) (0.19) (0.20) (0.20) (0.20) Science 5.52 5.78 5.36 4.70a 5.771 (0.14) (0.18) (0.20) (0.19) (0.19) Social science 5.98 6.43a 5.68a 5.17a 6.17a (0.14) (0.18) (0.19) (0.19) (0.19) Sports 9.18 6.57a 11.65a 9.14 8.90 (0.14) (0.20) (0.20) (0.20) (0.21) Advanced class English 0.070 0.066 0.075 0.043a 0.088a (0.003) (0.004) (0.005) (0.004) (0.005) Mathematics 0.096 0.097 0.096 0.077a 0.105a (0.003) (0.005) (0.005) (0.004) (0.005)
n 796,328 386,463 409,865 377,268 361,141 Notes: All grades are in percentile ranks. School starting age is instrumented with expected school starting age. All models also include an intercept, shifted year of birth dummy variables and a linear month of birth trend. The observations are weighted with the inverse probability of being included in the sample with respect to year and month of birth. Academic parents means that at least one parent have a long high school degree or higher. The probability of attending an advanced class is estimated using a linear probability model, and restricted to the 1975-80 birth cohorts. Standard errors are adjusted for clustering (school and year) using formulas in Liang and Zeger (1986). a/b/c=the estimates are significantly different from zero at the 1/5/10 per cent level of confidence using a two-sided t-test for females/males and academic/non-academic parents, respectively.
It is difficult to determine whether one should be surprised by the general
pattern of the estimates by parental education in Table 4. On the one hand, the
pattern is consistent with findings from other educational interventions. For
instance, according to the evidence from STAR, class size interventions have
greater effects for kids from disadvantaged backgrounds; see Krueger (1999) for
example. On the other hand, proponents of early intervention argue that such
policies will have particularly beneficial effects for children from disadvantaged

Is Early Learning Really More Productive? 30
backgrounds.17 However, it is not clear that the argument in favor of early
intervention is so pertinent in this context. The alternative to starting school
early (in part staying at home with their less skilled parents but also proceeding
in child care) may (or may not) be less advantageous for kids from disadvantaged
background. But presumably they are not ready for the treatment (formal
classroom training) to the same extent as kids from advantaged backgrounds.
Some indication that this is what is going on can be obtained by looking at the
estimate for sports. Clearly sports does not have a class-room component and,
accordingly, we do not find any differences by family background in sports. All
in all, then, we think the pattern of the estimates in columns 4 and 5 make
sense.
Above we raised some concerns about the informational value of grades.
However, these concerns turn out to be unwarranted as shown by Table 5.
In Table 5 we present school starting age effects for the 1948 and 1953 birth
cohorts, using the IS data The virtue of these data is that there is information
on achievement test scores along with grades for Swedish, English, and Math.
The table shows that it does not make much difference whether we measure
outcomes in terms of grades or scores on achievement tests. Notice also that
there are school starting age effects in the IQ test scores, which is consistent
with the view that IQ is “malleable”.
As a final sensitivity check we have estimated the effects of the school starting
age separately by birth cohort. We do not report these estimates here, since it
turns out that the effects vary across birth cohorts only to a limited extent.
6.2 Is it a relative age effect?
The question that we are framing this paper with (Is it more productive to start
school earlier?) is a question about the effect of the absolute school starting age.
But the effects may also be due to the relative age of kids, since, e.g., those born
in December are also the youngest in the class. The estimates on the school
starting age in, e.g., Table 4 capture both of these effects.
But for policy purposes one would most often like to free the estimates of
relative age effects. A key policy question is what would happen to school per-
formance if the school start is pushed forward by, say, one year for all children.
17Some qualifications are probably due here. Proponents of early intervention presumably
have other treatments in mind when presenting their case. Early childhood programs may
involve learning social skills and behavior to a greater extent than formal class room training.
Moreover, while the family background characteristic we consider is a sensible measure of
family skills, it is not a direct indicator of troubled families.

Is Early Learning Really More Productive? 31
Clearly, such a policy change will not change the relative age distribution of
kids.
Table 5 IV estimates of school starting age on different outcomes in 6th grade, 1948 and 1953 birth cohorts
1948 1953 birth cohort birth cohort IQ-test scores: Verbal 8.37 8.30 (1.05) (1.22) Spatial 6.96 4.59 (1.06) (1.22) Number series 4.84 5.51 (1.05) (1.21) Achievement test scores: Swedish 6.52 8.23 (1.00) (1.21) English 4.33 5.95 (1.04) (1.21) Mathematics 6.42 8.02 (1.03) (1.21) Grades: Swedish 6.15 6.96 (0.99) (1.16) English 4.31 5.77 (1.00) (1.17) Mathematics 7.01 8.15 (1.02) (1.17)
n 11,950 9,927 Notes: All outcome measures are in percentile ranks. School starting age is instrumented with expected school starting age. Missing values have been imputed by regressing the outcome measure on all other test scores and grades.
To estimate the relative age effect we exploit the within school variation in
the age composition across cohorts.18 The individuals’ position in the age dis-
tribution is simply the percentile rank in the age distribution in the school. We
18Here, the school refers to the school in ninth grade. This might yield a bias in the unlikely
event that across school mobility is driven by variations in the age distribution across schools.
Ideally we would have liked to rank the individuals within class and then used the within
school variation in the expected school starting age distribution as an instrument. However,
the class information is unavailable to us. Notice, that this preferred strategy would have
no effect on the precision of the estimates but may affect the relative size of the estimates.
We have also performed some sensitivity checks restricting the analysis to pupils from small
schools. The idea is that that the within school variation will be a better representation of
the within class variation in small schools. As it turned out, the relative age effect were never
significant in the sample restricted to small schools.

Is Early Learning Really More Productive? 32
instrument that with the percentile rank according to the individuals’ expected
school starting age within the expected school starting age distribution. Thus,
this strategy implies that we are instrumenting the actual school starting age as
well as the actual relative ranking within school. We choose units such that the
percentile rank is defined on the unit interval. This implies that there will be
roughly a full year difference between the top ranked individual (assigned a rank
of 1 and born in January) and the lowest ranked individual (assigned a rank of
0 and born in December). The magnitudes of the estimates on the absolute age
effect and the relative age effect should thus be approximately comparable.
Table 6 presents the estimates. The general outline is identical to Table 4,
i.e., we present separate estimates by subject, gender and family background.
Each cell, however, presents two sets of estimates. The top one is the absolute
age effect while the bottom one in italics is the relative age effect. The overall
message conveyed by these results is that the absolute age effect is much more
important than the relative age effect. It is relevant to ask whether this is due
to the relative age effect being poorly identified. However, this is not case.
The standard errors of the relative age effects are small. Indeed, the relative
age effects are always significantly smaller than the absolute ones. That the
identification strategy makes sense is also illustrated by the row for sports.
When it comes to sports the relative age effect is significant and accounts for
roughly a quarter of the total effect. The importance of the relative age is
well documented in the literature, particularly for team sports; see Musch and
Grondin (2001).
6.3 Educational attainment and earnings
Let us turn to the longer term effects of variations in the school starting age.
In this case, the age when measuring outcomes and the school starting age
varies independently when comparing January and December kids; see Figure
4. Therefore, these estimates can be thought of as giving the pure (long-run)
effect of variations in the school starting age.

Is Early Learning Really More Productive? 33
Table 6 IV estimates of absolute and relative school starting age on ninth grade outcomes, 1975-83 birth cohorts
All
Females
Males
Academic parents
Non-academic parents
Grades GPA 5.41 5.44 6.05 4.30 5.49 (0.62) (0.91) (0.88) (0.87) (0.84) 0.38 0.41 -0.22 0.92 0.35 (0.63) (0.92) (0.89) (0.88) (0.85) Swedish 6.07 5.54 7.71 4.95 5.77 (0.85) (1.20) (1.15) (1.21) (1.14) 0.00 0.92 -1.82 0.48 0.37 (0.86) (1.21) (1.16) (1.22) (1.16) Science 4.36 4.32 5.01 2.73 4.78 (0.79) (1.15) (1.15) (1.10) (1.07) 1.18 1.45 0.36 2.00 1.00 (0.80) (1.16) (1.16) (1.11) (1.08) Social science 5.83 6.09 6.26 5.08 6.04 (0.81) (1.16) (1.14) (1.11) (1.08) 0.11 0.27 -0.62 0.06 0.08 (0.81) (1.17) (1.15) (1.12) (1.09) Sports 6.80 4.94b 8.75b 5.53 7.17 (0.91) (1.21) (1.23) (1.22) (1.25) 2.48 1.70 3.00 3.79 1.81 (0.92) (1.23) (1.24) (1.23) (1.27) Advanced class English 0.047 0.039 0.061 0.004a 0.080a (0.025) (0.030) (0.031) (0.029) (0.030) 0.023 0.026 0.014 0.039 0.010 (0.025) (0.030) (0.031) (0.030) (0.031) Mathematics 0.100 0.101 0.104 0.084 0.101 (0.023) (0.030) (0.029) (0.027) (0.029) -0.005 -0.006 -0.008 -0.008 0.004 (0.023) (0.030) (0.029) (0.028) (0.029)
n 796,328 386,463 409,865 377,268 361,141 Notes: All grades are in percentile ranks. The effect of (absolute) age at school start is in normal fonts; the effect of relative age in class is in italics. School starting age is instrumented with expected school starting age. Relative school starting age is the percentile rank (divided by 100) of the individual’s school starting age in the school and year, and is instrumented with the expected school starting age percentile rank. All models also include an intercept, shifted year of birth dummy variables, a linear month of birth trend and school fixed effects. The observations are weighted with the inverse probability of being included in the sample with respect to year and month of birth. Academic parents means that at least one parent have a long high school degree or higher. The probability of attending an advanced class is estimated using a linear probability model, and restricted to the 1975-80 birth cohorts. Robust standard errors are in parentheses. a/b/c=the estimates are significantly different from zero at the 1/5/10 per cent level of confidence using a two-sided t-test for females/males and academic/non-academic parents, respectively.

Is Early Learning Really More Productive? 34
Table 7 IV estimates of school starting age on various educational outcomes
All
Females
Males
Academic parents
Non-academic parents
1940-49 Birth cohorts Schooling 0.2722 0.2738 0.2704 . . (0.0146) (0.0202) (0.0209) . . P(College) 0.0326 0.0355 0.0298 . . (0.0021) (0.0030) (0.0029) . . n 1,029,797 508,005 521,792 1950-59 Birth cohorts Schooling 0.1254 0.1558b 0.0963b . . (0.0129) (0.0180) (0.0184) . . P(College) 0.0204 0.0248c 0.0163c . . (0.0023) (0.0034) (0.0031) . . n 965,514 472,370 493,144 1960-69 Birth cohorts Schooling 0.1296 0.1281 0.1314 0.1231 0.1111 (0.0109) (0.0154) (0.0154) (0.0199) (0.0123) P(College) 0.0243 0.0198b 0.0286b 0.0258 0.0198 (0.0022) (0.0032) (0.0030) (0.0040) (0.0025) n 1,021,780 496,919 524,861 334,851 619,301 1970-79 Birth cohorts Schooling -0.0143 -0.0330b 0.0085b -0.0969a 0.0314a (0.0101) (0.0145) (0.0140) (0.0143) (0.0131) P(College) -0.0077 -0.0095 -0.0051 -0.0268a 0.0030a (0.0022) (0.0032) (0.0030) (0.0033) (0.0026) n 954,477 461,668 492,809 454,348 484,618
All birth cohorts (1935-84) Schooling 0.0620 0.0575 0.0672 . . (0.0055) (0.0077) (0.0079) . . P(College) 0.0138 0.0133 0.0145 . . (0.0009) (0.0014) (0.0013) . . n 4,778,333 2,337,313 2,441,020
Notes: School starting age is instrumented with expected school starting age. All models also include an intercept, shifted year of birth dummy variables and a linear month of birth trend. Academic parents means that at least one parent have a long high school degree or higher. The observations are weighted with the inverse probability of being included in the sample with respect to year and month of birth. Only individuals born after 1960 have sufficiently high share of non-missing information on parental education to be used in the analysis. The probability of having attended college is estimated using a linear probability model. Robust standard errors are in parenthesis. a/b/c=the estimates are significantly different from zero at the 1/5/10 per cent level of confidence using a two-sided t-test for females/males and academic/non-academic parents, respectively.
Table 7 starts by looking at educational attainment. The educational out-
comes are represented by (imputed) years of schooling and the probability of
attending college. The probability of attending college is, in turn, defined as
having a degree from university education which is at least two years long. From

Is Early Learning Really More Productive? 35
top to bottom we present separate estimates for individuals born in the 1940s,
1950s, and so on. The bottom panel contains results for all birth cohorts — born
1935-84 — pooled together.
The school starting age effects for all cohorts are consistent with the esti-
mates presented in section 6.1. Except for the cohorts born in the 1970s all
individuals benefit from starting school at an older age. The reason for the
negative effect for those born in the 1970s is that a substantial portion of these
individuals have not yet finished their schooling careers. For the remaining
cohorts, the effect of starting school one year later varies from 0.13 years of
schooling (1950s and 1960s) to 0.27 years of schooling (1940s). The effect for
those born in the 1940s is thus substantially bigger than the effect for those born
in the 1950s or the 1960s. To a limited extent, this is driven by the evolution of
the standard deviation of the schooling distribution (see Figure 1). But even if
we convert the effects into standard deviation units — 0.09 SD (1940s) and 0.05
SD (1950s and 1960s) — the difference across cohorts remains. This difference
is interesting and therefore we probe deeper into this issue.
0
.1
.2
.3
.4
Year
s of s
choo
ling
1940 1945 1950 1955 1960 1965 1970
Year of birthNote: The dashed lines show the point estimates ± 1.96 standard errors.
Figure 8 The effect of school starting age on years of schooling, 1940-70 birth cohorts
In Figure 8 we report separate estimates by birth cohort. There is a large
downward jump in the effect of the school starting age on education attain-
ment occurring around 1950. A somewhat speculative interpretation is that
this downward jump has to do with the more selective nature of the school-
ing system prior to the introduction of the compulsory school. Although the
implementation of the compulsory school was gradual it seems to have been

Is Early Learning Really More Productive? 36
introduced rather rapidly: a third of students born in 1948 went to school ac-
cording to the new compulsory school system; among students born in 1953 the
share attending a compulsory school had increased to 80 %.
The school starting age effect seems to be smaller when it comes to the long-
run schooling outcomes considered here (0.05 SD for those born in the 1960s) in
comparison with the compulsory school outcomes considered in section 6.1 (0.2
SD). That the long-run effects are smaller seems sensible given depreciation.
Moreover, achievement gains are presumably not translated fully into increases
in years of schooling. But it also seems likely that it reflects the fact that we
cannot distinguish between the school starting age and the age effect for the
compulsory school outcomes.
Table 7 also shows that the parameter of interest varies somewhat by gender,
but there is no consistent pattern across cohorts. The coefficient of interest does
not vary by family background, as evidenced by the estimates for the 1960s
cohorts. Thus, unlike the compulsory school outcomes, the school starting age
effects do not seem to vary by groups for these long-run schooling outcomes.
Table 8 reports the estimated school starting age effects for earnings. The
table has an identical outline as the previous one. The estimates by birth
cohort have a similar flavor as the estimates for educational attainment. There
is a positive earnings effect of starting school at an older age and this effect
is largest for those born in the 1940s. For the cohorts born in the 1950s and
1960s, however, the effects are no longer significant. Notice that the earnings
estimates reflect to opposing forces. On the one hand, starting school later will
raise educational attainment. On the other hand, starting school later implies
forgone labor market experience; the forgone experience effect operates both
directly — individuals that start school later also enter the labor market later
— and indirectly — those who start later have more schooling and hence less
experience. This forgone experience effect should be most important for the
youngest cohorts when the experience profile is most steep.
The bottom panel presents earnings estimates for all individuals in our sam-
ple. This estimate is interesting since it can be interpreted as the individual
net earnings effect over the life-cycle of starting school a year later19.As can
be seen, this overall effect appears to be negative. The opportunity cost of
having kids start school later outweighs the earnings gain accruing later on in
life. Appropriate discounting of the gains and losses would only strengthen this
conclusion.
19This is of course based on the assumption that the cross-section estimate is a fair approx-
imation of individual life-cycle earnings.

Is Early Learning Really More Productive? 37
Table 8 IV estimates of school starting age on earnings in 2000
All
Females
Males
Academic parents
Non-academic parents
1940-49 Birth cohorts Earnings 3150 3331 3198 . . (797) (778) (1342) . . Log(Earnings) 0.0054 0.0081 0.0042 . . (0.0023) (0.0027) (0.0033) . . n 1,029,797 508,005 521,792 . . 1950-59 Birth cohorts Earnings 611 471 737 . . (844) (797) (1426) . . Log(Earnings) 0.0009 -0.0003 0.0012 . . (0.0022) (0.0027) (0.0031) . . n 965,514 472,370 493,144 . . 1960-69 Birth cohorts Earnings 396 113 584 2536b -1081b (740) (724) (1204) (1572) (784) Log(Earnings) 0.0029 0.0021 0.0018 0.0047 -0.0011 (0.0021) (0.0028) (0.0027) (0.0040) (0.0025) n 1,021,780 496,919 524,861 334,851 619,301 1970-79 Birth cohorts Earnings -7319 -5782a -9363a -10464a -4097a (465) (561) (699) (696) (621) Log(Earnings) -0.0278 -0.0208a -0.0359a -0.0357a -0.0211a (0.0019) (0.0027) (0.0025) (0.0030) (0.0025) n 954,477 461,668 492,809 454,348 484,618 All birth cohorts (1935-84) Earnings -1350 -952 -1828 . . (312) (307) (521) . . Log(Earnings) -0.0064 -0.0173c -0.0014c . . (0.0048) (0.0051) (0.0066) . . n 4,778,333 2,337,313 2,441,020 . . Notes: School starting age is instrumented with expected school starting age. All models also include an intercept, shifted year of birth dummy variables and a linear month of birth trend. Academic parents means that at least one parent have a long high school degree or better. The observations are weighted with the inverse probability of being included in the sample with respect to year and month of birth. Only individuals born after 1960 have sufficiently high share of non-missing information on parental education to be used in the analysis. The log earnings are restricted to individuals earning more than 100,000 SEK, which reduces the samples with roughly 30 per cent. Robust standard errors are in parenthesis. a/b/c=the estimates are significantly different from zero at the 1/5/10 per cent level of confidence using a two-sided t-test for females/males and academic/non-academic parents, respectively.

Is Early Learning Really More Productive? 38
7 Concluding remarks
In this paper we have presented a collection of evidence suggesting that starting
school at an older age is beneficial for scholastic achievement. Starting school
one year later increases compulsory school performance by roughly 0.2 stan-
dard deviations (SD). Moreover, the effects persist into adulthood. Late school
starters go on to have more schooling and they have a slight long-run earnings
advantage in comparison to early starters. The effect sizes are much smaller for
earnings (0—0.02 SD) than for educational attainment (0.05—0.09 SD).
Our evidence also suggests that the effects we measure are due to absolute
maturity rather than to the relative age in the class. Taken at face value, this
implies that pushing the start of classroom training, e.g., one year earlier will
be detrimental for children, at least for their scholastic achievement.
Although school performance seems to improved by the school starting age,
having kids start school one year later clearly entails an opportunity cost. Late
school starters have less labor market experience and fewer years on the labor
market (given the retirement age). Indeed, taken seriously, our estimates suggest
that starting school one year later implies a negative (but small) net earnings
return over the life cycle.
Thus, there appears to be a trade-off: if one is concerned with the scholastic
achivement of children, our estimates suggest a slightly higher school starting
age; while if one is concerned with their life-time earnings the conclusion appears
to be the opposite. Are there any ways to mitigate this apparent trade-off? To
reduce the detrimental effects on school performance of an early school start,
some adaption of pedagogical techniques is presumably required. As argued by
Stipek (2002): The appropriate question is not whether kids are ready for school
— it is whether schools are ready for children. Older kids appear to be better
prepared for classroom training. Younger kids may well be more receptive to
other forms of learning.

Is Early Learning Really More Productive? 39
ReferencesAngrist, J and A Krueger (1991), Does Compulsory School Attendance Affect
Schooling and Earnings? Quarterly Journal of Economics, 106, 979-1014.
Angrist, J and A Krueger (1992), The Effect of Age at School Entry on Ed-
ucational Attainment: An Application of Instrumental Variables with
Moments from Two Samples, Journal of American Statistical Associa-
tion, 87, 328-336
Barnett, S (1992), Benefits of Compensatory Preschool Education, Journal of
Human Resources, 27, 279-311.
Bedard, K and E Dhuey (2005), The Persistence of Early Childhood Maturity:
International Evidence of Long-Run Age Effects, mimeo, Department of
Economics, University of California, Santa Barbara.
Bound, J, D Jaeger, and R Baker (1995), Problems with Instrumental Variables
Estimation when the Correlation between the Instrument and the En-
dogenous Explanatory Variable is Weak, Journal of American Statistical
Association, 90, 443-50.
Byrd, R, M Weitzman, and P Auinger (1997), Increased Behavior Problems
Associated with Delayed School Entry and Delayed School Progress, Pe-
diatrics, 100, 664-61.
Cahan, S and N Cohen (1989), Age Versus Schooling Effects on Intelligence
Development, Child Development, 60, 1239-49.
Cahan, S and D Davis (1987), A Between-Grade-Levels Approach to the Inves-
tigation of the Absolute Effects of Schooling on Achievement, American
Educational Research Journal, 24, 1-13.
Carneiro, P and J Heckman (2003), Human Capital Policy, in B. Friedman
(ed), Inequality in America: What Role for Human Capital Policies, MIT
Press, Cambridge.
Casio, E and E Lewis (2004), Schooling and the AFQT: Evidence from School
Entry Laws, University of California, Davis Working Paper.
Corman, H (2003) The Effects of State Policies, Individual Characteristics, Fam-
ily Characteristics, and Neighbourhood Characteristics on Grade Repe-
tition in the United States, Economics of Education Review, 22, 409-20.
Graue, E and J DiPerna (2000), Redshirting and Early Retention: Who Gets
the ”Gift of Time” and What are its Outcomes?, American Education
Review Journal, 37, 509-34.
Currie, J (2001), Early Childhood Education Programs, Journal of Economic
Perspectives, 15, 213-38.
Datar, A (2005), Does Delaying Kindergarten Entrance Give Children a Head

Is Early Learning Really More Productive? 40
Start?, Economics of Education Review, forthcoming.
Del Mondo, E and F Galindo-Rueda (2004), Do a Few Months of Compulsory
Schooling Matter? The Education and Labour Market Impact of School
Leaving Rules, IZA Discussion Paper 1233.
Eide, E and M Sholwater (2001), The Effect of Grade Retention on Educational
and Labor Market Outcomes, Economics of Education Review, 20, 563-
576.
Fertig, M and J Kluve (2005), The Effect of Age at School Entry on Educational
Attainment in Germany, IZA Discussion Paper 1507.
Gunnarsson, L, B Martin Korpi and U Nordenstam (1999), Early Childhood
Education and Care Policy in Sweden: Background report prepared for
the OECD Thematic Review, Ministry of Education and Science.
Hansen, K, J Heckman and KMullen (2004), The Effect of Schooling and Ability
on Achievement Test Scores, Journal of Econometrics, 121, 39-98.
Jones, M and K Mandeville (1990), The Effect of Age at School Entry on Read-
ing Achievement Scores among South Carolina Students, Remedial and
Special Education, 11, 56-62.
Krueger, A (1999), Experimental Estimates of Education Production Functions,
Quarterly Journal of Economics, 114, 497-532.
Langer, P, J Kalk, and D Searls (1984), Age of Admission and Trends in Achieve-
ment: A Comparison of Blacks and Caucasians, American Educational
Research Journal, 21, 61-78.
Leuven, E, M Lindahl, H Oosterbeek, and D Webbink (2004), New Evidence on
the Effect of Time in School on Early Achievement, manuscript, SOFI,
University of Stockholm.
Liang, K-Y and S Zeger (1986), Longitudinal Data Analysis Using Linearized
General Models, Biometrika, 73, 13-22.
May, D, D Kundert, and D Brent (1995), Does Delayed School Entry Reduce
Later Grade Retentions and Use of Special Education Services?, Reme-
dial and Special Education, 16, 288-94.
Mayer, S and D Knutson (1999), Does the Timing of School Affect How Much
Children Learn?, in S Mayer and P Peterson (eds), Earning and Learning:
How Schools Matter, Brookings Institution Press, Washington DC.
Morrison, F, E Griffith, and D Alberts (1997), Nature-Nurture in the Classroom:
Entrance Age, School Readiness and Learning in Children, Developmen-
tal Psychology, 33, 254-62.
Musch, J and S Grondin (2001), Unequal Competition as an Impediment to
Personal Development: A Review of the Relative Age Effect in Sport,
Is Early Learning Really More Productive? 41
Developmental Review, 21, 147-67.
OECD (2003), Education at a Glance, Organization for Economic Cooperation
and Development, Paris.
Plug, E (2001), Season of Birth, Schooling and Earnings, Journal of Economic
Psychology, 22, 641-60.
Shonkoff, J and D Phillips, eds (2000), From Neurons to Neighborhoods: The
Science of Early Childhood Development, National Academy Press, Wash-
ington DC.
Stipek, D (2002), At What Age Should Children Enter Kindergarten? A Ques-
tion for Policy Makers and Parents, Social Policy Report, 16, 3-16.
Strøm, B (2003), Student Achievement and Birthday Effects, mimeo, Depart-
ment of Economics, Norwegian University of Science and Technology.
Thistlethwaite, D, and D Campbell (1960), Regression-Discontinuity Analysis:
An Alternative to the Ex Post Facto Experiment, Journal of Educational
Psychology, 51, 309-17

Is Early Learning Really More Productive? 42
Appendix
Table A1 Descriptive statistics, 1935-84 birth cohorts Variable Mean S.D. Min Max
Age in 2000 40.70 13.91 16.00 65.92
Woman 0.49 0.50 0.00 1.00
Mother’s years of education 9.46 2.35 6.60 22.00
Father’s years of education 9.51 2.43 6.60 22.00
School starting age 7.21 0.26 4.96 10.30
Expected school starting age 7.22 0.28 6.75 7.67
Years of schooling in 2000 12.11 2.76 3.00 20.40
P(College in 2000) 0.27 0.45 0.00 1.00
Earnings in 2000 157,918 159,420 0 28,928,800
Log(Earnings in 2000) 12.32 0.39 11.51 17.18 Notes: Expected school starting age is the age when the individual is expected to start school according to month of birth and the school cut-off date. The log earnings in 2000 is restricted to individuals earning more than SEK 100,000. For all other variables the number of observations is 4,778,333.