is cycling a safe mode of transport?
TRANSCRIPT

University of Leeds, ITS Seminar
IS CYCLING A SAFE MODE? COMPARING
APPLES WITH APPLES
Dr Glen KooreySenior Lecturer in Transportation
Dept of Civil and Natural Resources EngineeringUniversity of CanterburyChristchurch, New Zealand

Presentation Outline
Background / New Zealand Context Comparison of Travel Modes Safety Metric Used Age Distributions Road Environments Safety in Numbers
Ben Wong
Koorey G.F., Wong W.K. (2013), “Is Cycling a Safe Mode?
Comparing Apples with Apples”, 16th International “Road Safety
on Four Continents” Conference, Beijing, China, 15-17 May 2013.

So you're from Australia, right?

The great New Zealand Image...

The great New Zealand Reality...

New Zealand
4.5 million people Low population
density Very urbanised
Typical Western Development Automobiles
~1.4% of Trips by Bike ~3% commuting
Wellington
Auckland
Christchurch

Cycling Safety in New Zealand
~10 Cycling Fatalities/yr ~1000 Reported Injuries/yr
Widespread perception about "danger" of cycling
Sporadic cycling facilities

Isn't Cycling Unsafe?
"Peak hour urban traffic is dangerous for
cyclists… The best protection for cyclists
is prohibition from peak hour urban
roads"
"Really, you must have a screw loose to want
to ride a bike on today's roads, you just don't know what nutteris behind the wheel."

Risk of Cycle Crashes
Perceived Risk influenced by: Regular Negative Media Lack of Familiarity with Cycling by many Can't Control Behaviour of Other Road Users Immediacy of Injury/Death
Actual Calculated Risks in NZ: 1 Cycling Death per 2.5 million hrs cycled 1 Serious Injury for every 20,000 hrs cycled Health benefits of cycling outweigh risks 20:1

NZ Cycling Safety Panel (2014), Safer Journeys for people who
cycle: Cycling Safety Panel Final Report and Recommendations, NZ
Transport Agency & Ministry of Transport, Wellington, Dec 2014.

Comparisons with Other Modes
In many countries, one of the barriers to acceptance and encouragement of cycling is the perceived danger of the mode By politicians, policymakers, and the public
Not helped by "official" comparisons of different travel modes Typically show cycling as having a far greater
crash rate than other modes (driving, walking)
Not really "comparing apples with apples"...

Safety of Travel Modesfrom 2007-11 NZ Travel Survey
Cycling ~9x "riskier" than Driving245
27
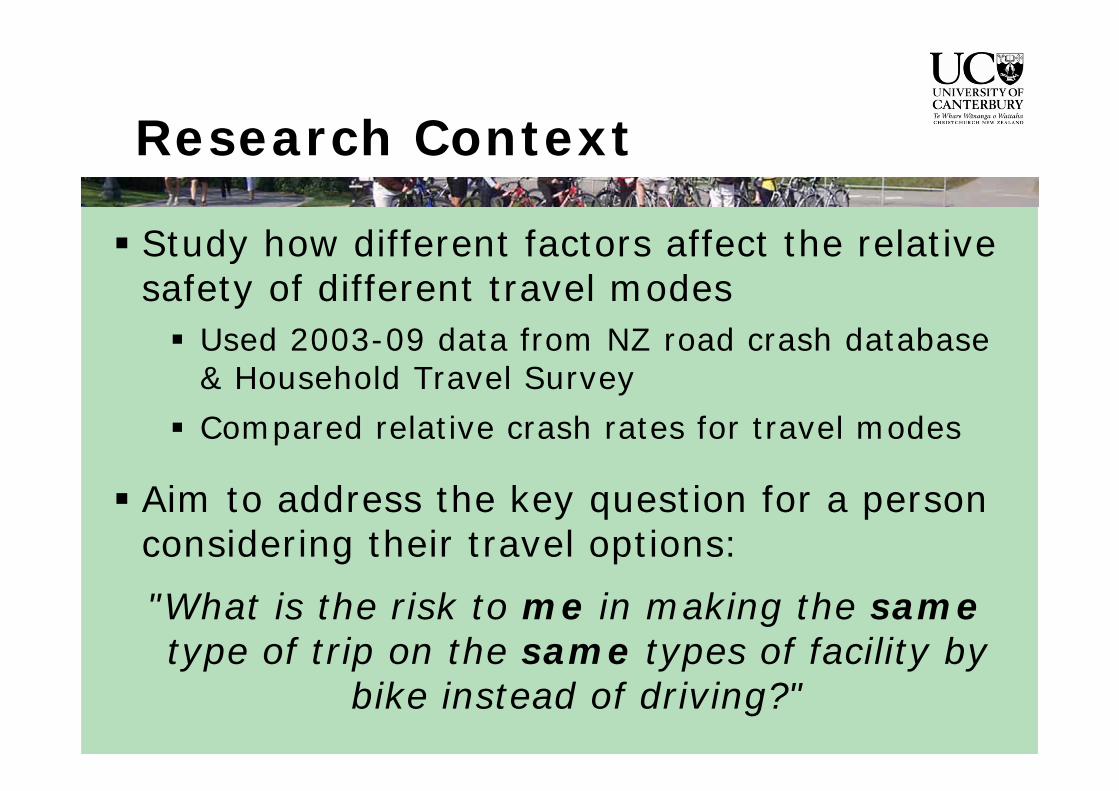
Research Context
Study how different factors affect the relative safety of different travel modes Used 2003-09 data from NZ road crash database
& Household Travel Survey Compared relative crash rates for travel modes
Aim to address the key question for a person considering their travel options: "What is the risk to me in making the sametype of trip on the same types of facility by
bike instead of driving?"

Safety per Hour Travelled
Cycling ~3x "riskier" than Driving
2910

The Same Trip Made?
0%
5%
10%
15%
20%
25%
30%
35%
<1km 1-2km 2-5km 5-10km >10km
Pro
porti
on o
f Trip
s
Car (Ave Trip Distance 9km)Cyclist (Ave Trip Distance 3km)

Age Distribution of Travellers

Travel Mode Risk by Age

Where are we Driving?Crash Risk:
39.3 Ax/MVKT
Crash Risk:23.2 Ax/MVKT
Crash Risk:11.8 Ax/MVKT
Crash Risk:35.6 Ax/MVKT
Crash Risk:41.3 Ax/MVKT

Where are we Biking?
But where are the “cycle motorways”?

"Safe", Segregated Cycle Facilities...
But off-road trips and crashes aren't recorded!

Urban State Highway Risk

Minor Urban Road Risk

Other Rural Road Risk
On a per-hour basis, crash rates are very similar

Safety in Numbers!
LTNZ Research Report #289, 2006
Example: signalised crossroads

Safety in Numbers?
People cycling would strongly benefit by
protection from traffic in busy road environments, e.g. segregated facilities

To Put Things in Perspective...
~10 cyclist deaths on roads per year in NZ Average of ~360 motor vehicle occupants
killed / year in NZ ~300-500 premature deaths / year in NZ
due to motor vehicle emissions ~2500 deaths / year due to physical
inactivity in NZ20:1 benefit of life-years gained from cycling vs
life-years lost (BMA, 1992)

Conclusions
Safety comparisons may not always be “comparing apples with apples” Relative amount of time taken by each mode Average distance travelled by different modes Age distributions / "road experience" of travellers Types of road environments/facilities travelled Different crash reporting rates by mode Cumulative "safety in numbers" effect Relative health costs other than road crashes
Sometimes cycling not really more dangerous
