is buy-and-hold dead? - richard bernstein · is buy-and-hold dead? past performance is no guarantee...
TRANSCRIPT
Richard
Bernstein
July 2012
Is buy-and-hold dead?
PAST PERFORMANCE IS NO GUARANTEE OF FUTURE RESULTS
Richard Bernstein Advisors LLC 520 Madison Avenue 28th Floor New York, NY 10022 212-692-4000 www.rbadvisors.com
Is buy-and-hold dead?
If one searches in Google for “Does buy-and-hold work?”, more than 191 million results
will appear. If one searches for “Is buy-and-hold dead?”, more than 81 million results will
appear. However, if one searches for “Successful buy-and-hold strategies”, only about 9
million results will appear. It’s pretty clear that the investing world believes that buy-and-
hold strategies are basically dead and gone.
Is the consensus correct, and are buy-and-hold strategies truly dead? The answer, if you
ask us, is a definitive no. Buy-and-hold is very much alive and well.
Navigate the Noise
In Navigate the Noise – Investing in the New Age of Media and Hype (Wiley: 2001), I
pointed out that investment returns can be significantly hurt by strategies based on short-
term, noise-driven strategies. The data clearly and consistently showed that extending
one’s investment time horizon was a simple method for improving investment returns.
Eleven years later, those conclusions remain very much intact.
There are sound economic reasons why extending one’s time horizon can benefit
investment returns. Changes within the economy tend to be very gradual, and significant
adjustments rarely happen within a short period of time. Certainly, there is plenty of daily
news, but how much of that news is actually important and worth acting on? The data
suggest very little of that information is meaningful and valuable. Most of it is simply
noise.
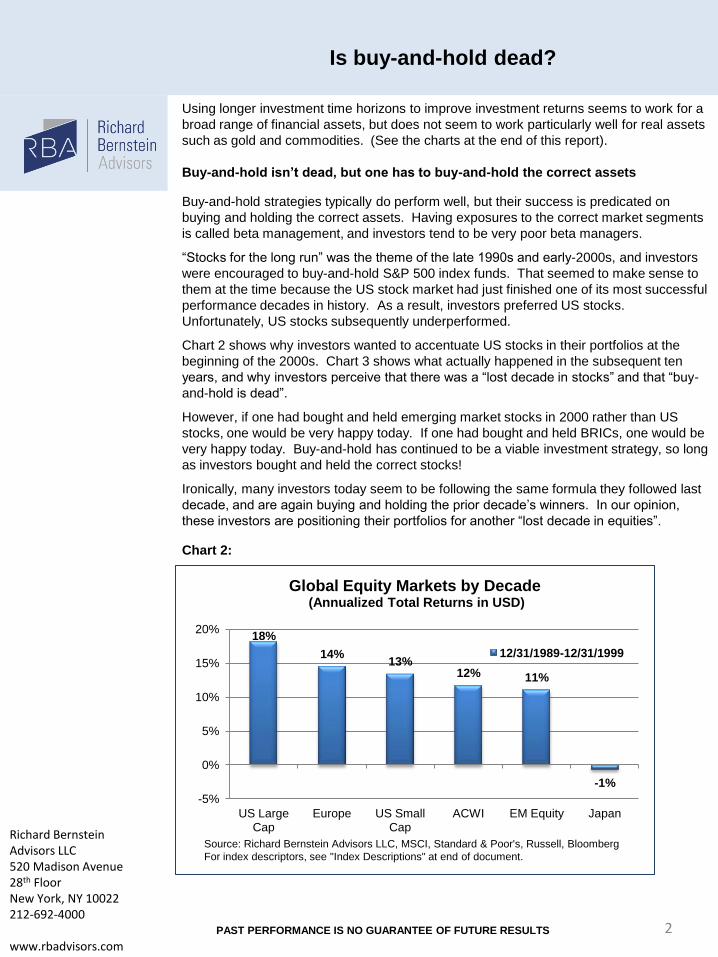
Chart 1 shows the probability of losing money in the S&P 500 based on varying time
horizons. As one extends one’s investment time horizon, and increasingly focuses on the
fundamentals of the slow-moving economy, the probability of losing money decreases. In
fact, short-term trading is like flipping a coin; it is virtually a 50/50 proposition.
Chart 1:
47%
44%
42%
39%
33%
23%
21%
11%
0% 10% 20% 30% 40% 50%
1 Day
1 Week
1 Month
3 Mos
12 Mos
3 Yrs
5 Yrs
10 Yrs
Probability of a Loss for the S&P 500® (Rolling Price Returns, January 1930 thru June 2012)
Source: Richard Bernstein Advisors LLC, Standard and Poor's, Bloomberg
For index descriptors, see "Index Descriptions" at end of document.
2 PAST PERFORMANCE IS NO GUARANTEE OF FUTURE RESULTS
Is buy-and-hold dead?
Richard Bernstein Advisors LLC 520 Madison Avenue 28th Floor New York, NY 10022 212-692-4000 www.rbadvisors.com
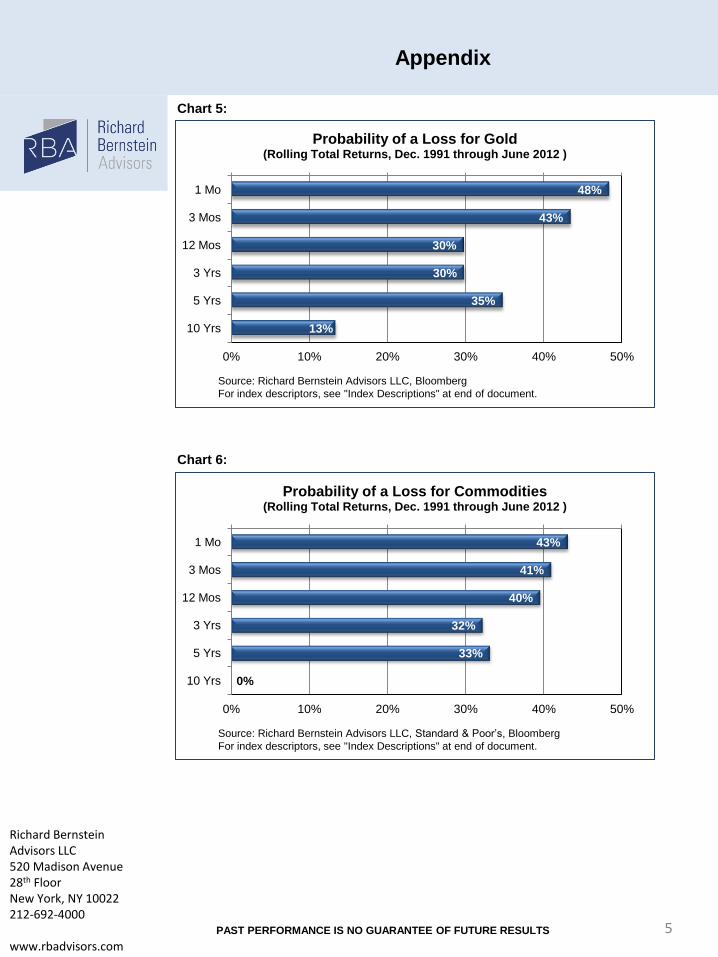
Using longer investment time horizons to improve investment returns seems to work for a
broad range of financial assets, but does not seem to work particularly well for real assets
such as gold and commodities. (See the charts at the end of this report).
Buy-and-hold isn’t dead, but one has to buy-and-hold the correct assets
Buy-and-hold strategies typically do perform well, but their success is predicated on
buying and holding the correct assets. Having exposures to the correct market segments
is called beta management, and investors tend to be very poor beta managers.
“Stocks for the long run” was the theme of the late 1990s and early-2000s, and investors
were encouraged to buy-and-hold S&P 500 index funds. That seemed to make sense to
them at the time because the US stock market had just finished one of its most successful
performance decades in history. As a result, investors preferred US stocks.
Unfortunately, US stocks subsequently underperformed.
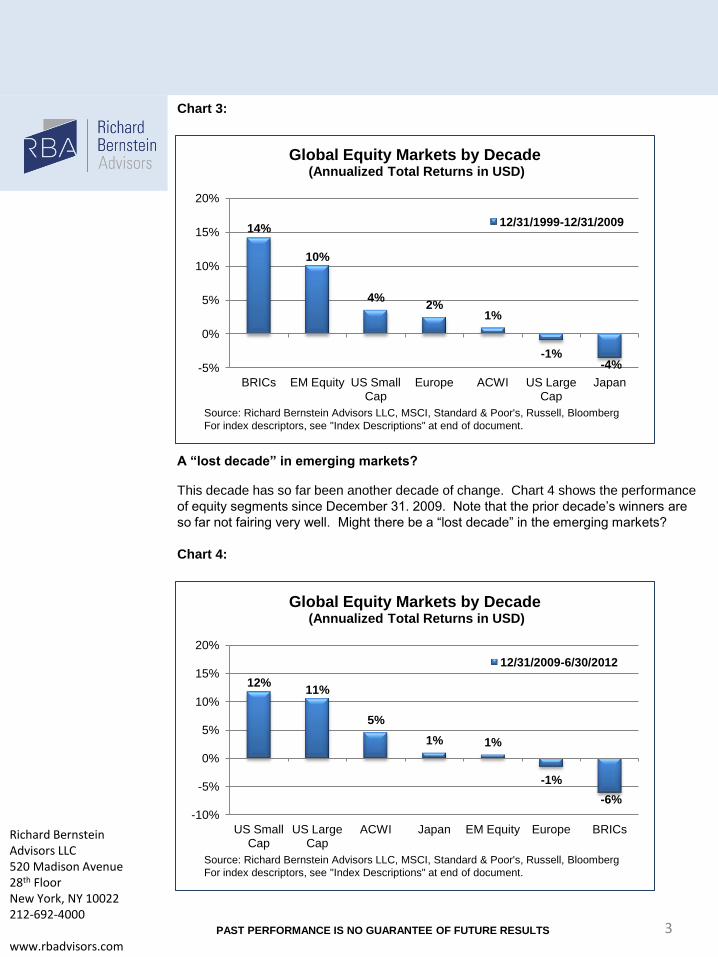
Chart 2 shows why investors wanted to accentuate US stocks in their portfolios at the
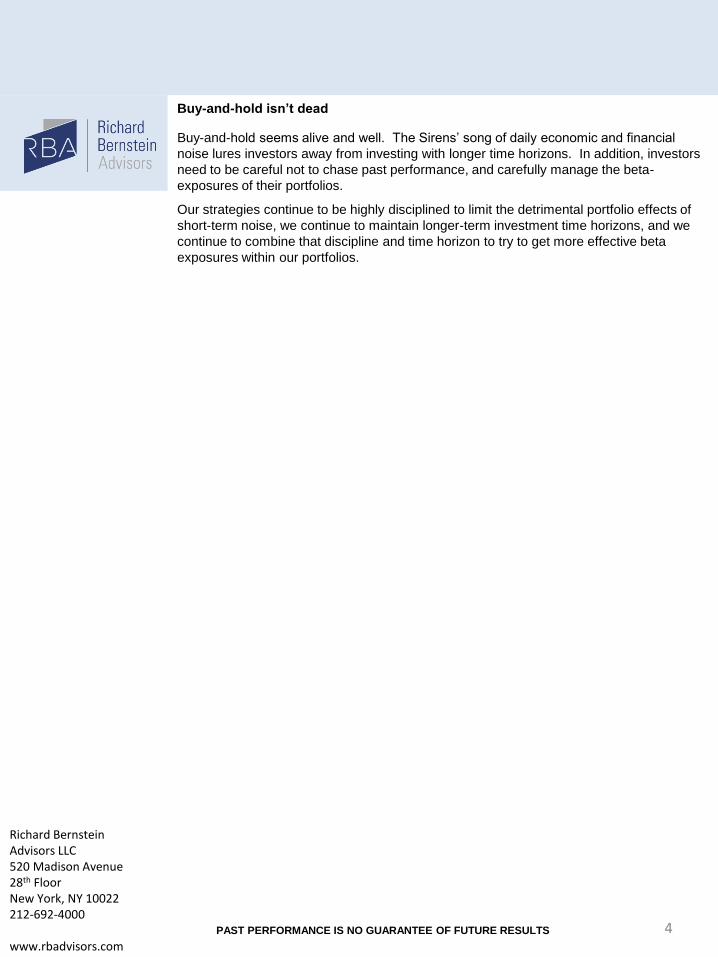
beginning of the 2000s. Chart 3 shows what actually happened in the subsequent ten
years, and why investors perceive that there was a “lost decade in stocks” and that “buy-
and-hold is dead”.
However, if one had bought and held emerging market stocks in 2000 rather than US
stocks, one would be very happy today. If one had bought and held BRICs, one would be
very happy today. Buy-and-hold has continued to be a viable investment strategy, so long
as investors bought and held the correct stocks!
Ironically, many investors today seem to be following the same formula they followed last
decade, and are again buying and holding the prior decade’s winners. In our opinion,
these investors are positioning their portfolios for another “lost decade in equities”.
Chart 2:
18%
14% 13%
12% 11%
-1%
-5%
0%
5%
10%
15%
20%
US Large Cap
Europe US Small Cap
ACWI EM Equity Japan
Global Equity Markets by Decade (Annualized Total Returns in USD)
12/31/1989-12/31/1999
Source: Richard Bernstein Advisors LLC, MSCI, Standard & Poor's, Russell, Bloomberg
For index descriptors, see "Index Descriptions" at end of document.
3 PAST PERFORMANCE IS NO GUARANTEE OF FUTURE RESULTS
Richard Bernstein Advisors LLC 520 Madison Avenue 28th Floor New York, NY 10022 212-692-4000 www.rbadvisors.com
Chart 3:
A “lost decade” in emerging markets?
This decade has so far been another decade of change. Chart 4 shows the performance
of equity segments since December 31. 2009. Note that the prior decade’s winners are
so far not fairing very well. Might there be a “lost decade” in the emerging markets?
Chart 4:
14%
10%
4% 2%
1%
-1% -4% -5%
0%
5%
10%
15%
20%
BRICs EM Equity US Small Cap
Europe ACWI US Large Cap
Japan
Global Equity Markets by Decade (Annualized Total Returns in USD)
12/31/1999-12/31/2009
Source: Richard Bernstein Advisors LLC, MSCI, Standard & Poor's, Russell, Bloomberg
For index descriptors, see "Index Descriptions" at end of document.
12% 11%
5%
1% 1%
-1%
-6%
-10%
-5%
0%
5%
10%
15%
20%
US Small Cap
US Large Cap
ACWI Japan EM Equity Europe BRICs
Global Equity Markets by Decade (Annualized Total Returns in USD)
12/31/2009-6/30/2012
Source: Richard Bernstein Advisors LLC, MSCI, Standard & Poor's, Russell, Bloomberg
For index descriptors, see "Index Descriptions" at end of document.
4
Buy-and-hold isn’t dead
Buy-and-hold seems alive and well. The Sirens’ song of daily economic and financial
noise lures investors away from investing with longer time horizons. In addition, investors
need to be careful not to chase past performance, and carefully manage the beta-
exposures of their portfolios.
Our strategies continue to be highly disciplined to limit the detrimental portfolio effects of
short-term noise, we continue to maintain longer-term investment time horizons, and we
continue to combine that discipline and time horizon to try to get more effective beta
exposures within our portfolios.
PAST PERFORMANCE IS NO GUARANTEE OF FUTURE RESULTS
Richard Bernstein Advisors LLC 520 Madison Avenue 28th Floor New York, NY 10022 212-692-4000 www.rbadvisors.com
5
Chart 5:
Chart 6:
PAST PERFORMANCE IS NO GUARANTEE OF FUTURE RESULTS
Richard Bernstein Advisors LLC 520 Madison Avenue 28th Floor New York, NY 10022 212-692-4000 www.rbadvisors.com
Appendix
48%
43%
30%
30%
35%
13%
0% 10% 20% 30% 40% 50%
1 Mo
3 Mos
12 Mos
3 Yrs
5 Yrs
10 Yrs
Probability of a Loss for Gold (Rolling Total Returns, Dec. 1991 through June 2012 )
Source: Richard Bernstein Advisors LLC, Bloomberg
For index descriptors, see "Index Descriptions" at end of document.
43%
41%
40%
32%
33%
0%
0% 10% 20% 30% 40% 50%
1 Mo
3 Mos
12 Mos
3 Yrs
5 Yrs
10 Yrs
Probability of a Loss for Commodities (Rolling Total Returns, Dec. 1991 through June 2012 )
Source: Richard Bernstein Advisors LLC, Standard & Poor’s, Bloomberg
For index descriptors, see "Index Descriptions" at end of document.
6
Chart 7:
Chart 8:
PAST PERFORMANCE IS NO GUARANTEE OF FUTURE RESULTS
Richard Bernstein Advisors LLC 520 Madison Avenue 28th Floor New York, NY 10022 212-692-4000 www.rbadvisors.com
Appendix
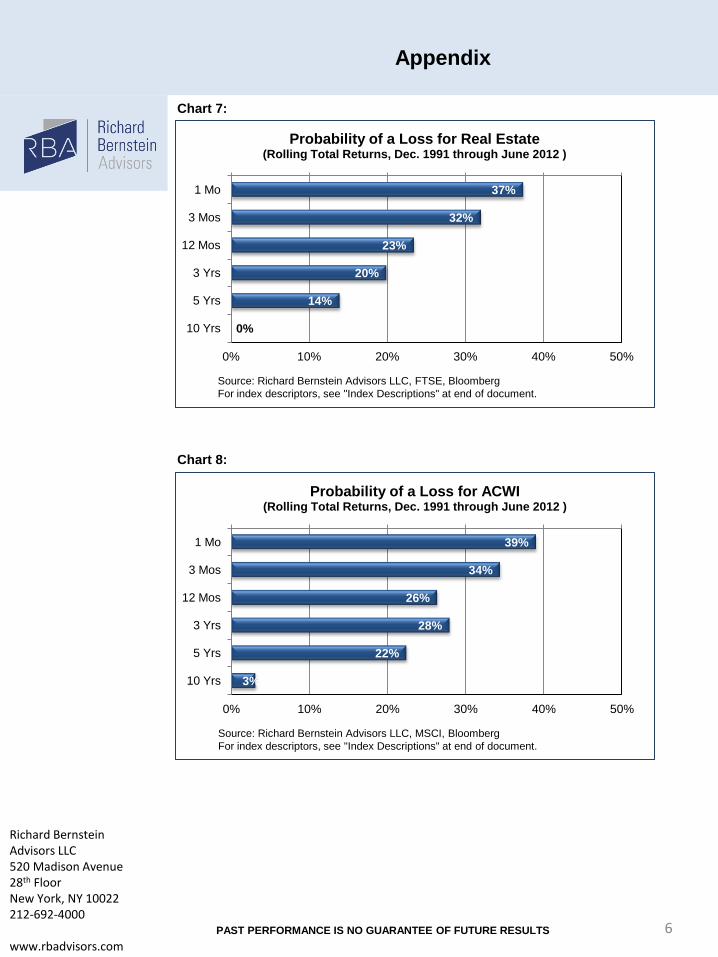
37%
32%
23%
20%
14%
0%
0% 10% 20% 30% 40% 50%
1 Mo
3 Mos
12 Mos
3 Yrs
5 Yrs
10 Yrs
Probability of a Loss for Real Estate (Rolling Total Returns, Dec. 1991 through June 2012 )
Source: Richard Bernstein Advisors LLC, FTSE, Bloomberg
For index descriptors, see "Index Descriptions" at end of document.
39%
34%
26%
28%
22%
3%
0% 10% 20% 30% 40% 50%
1 Mo
3 Mos
12 Mos
3 Yrs
5 Yrs
10 Yrs
Probability of a Loss for ACWI (Rolling Total Returns, Dec. 1991 through June 2012 )
Source: Richard Bernstein Advisors LLC, MSCI, Bloomberg
For index descriptors, see "Index Descriptions" at end of document.
7
Chart 9:
Chart 10:
PAST PERFORMANCE IS NO GUARANTEE OF FUTURE RESULTS
Richard Bernstein Advisors LLC 520 Madison Avenue 28th Floor New York, NY 10022 212-692-4000 www.rbadvisors.com
Appendix
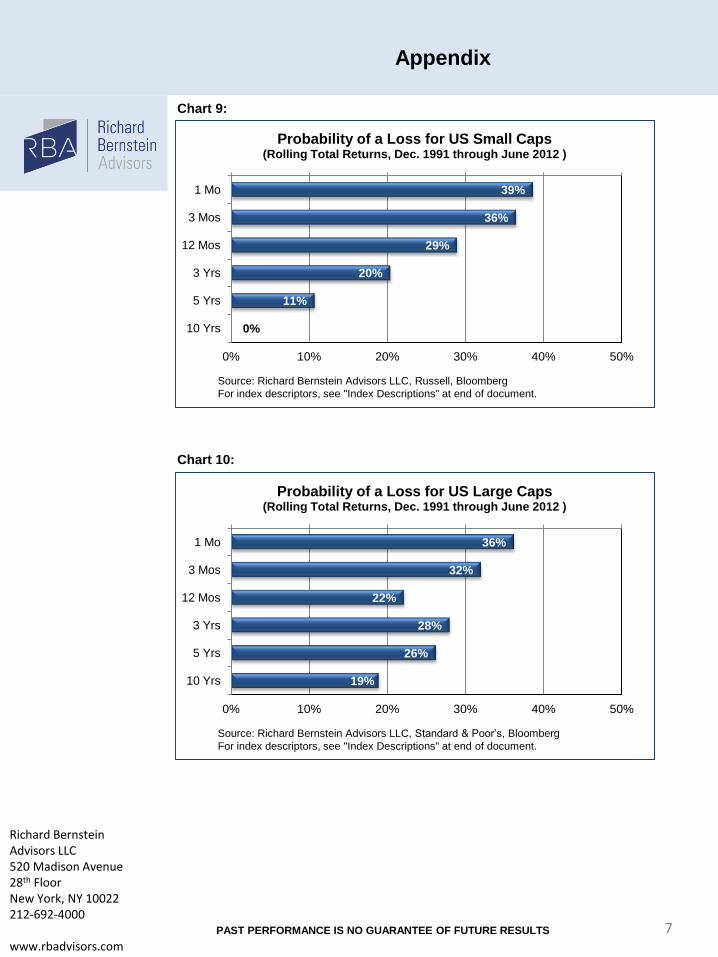
36%
32%
22%
28%
26%
19%
0% 10% 20% 30% 40% 50%
1 Mo
3 Mos
12 Mos
3 Yrs
5 Yrs
10 Yrs
Probability of a Loss for US Large Caps (Rolling Total Returns, Dec. 1991 through June 2012 )
Source: Richard Bernstein Advisors LLC, Standard & Poor’s, Bloomberg
For index descriptors, see "Index Descriptions" at end of document.
39%
36%
29%
20%
11%
0%
0% 10% 20% 30% 40% 50%
1 Mo
3 Mos
12 Mos
3 Yrs
5 Yrs
10 Yrs
Probability of a Loss for US Small Caps (Rolling Total Returns, Dec. 1991 through June 2012 )
Source: Richard Bernstein Advisors LLC, Russell, Bloomberg
For index descriptors, see "Index Descriptions" at end of document.
8
Chart 11:
Chart 12:
PAST PERFORMANCE IS NO GUARANTEE OF FUTURE RESULTS
Richard Bernstein Advisors LLC 520 Madison Avenue 28th Floor New York, NY 10022 212-692-4000 www.rbadvisors.com
Appendix
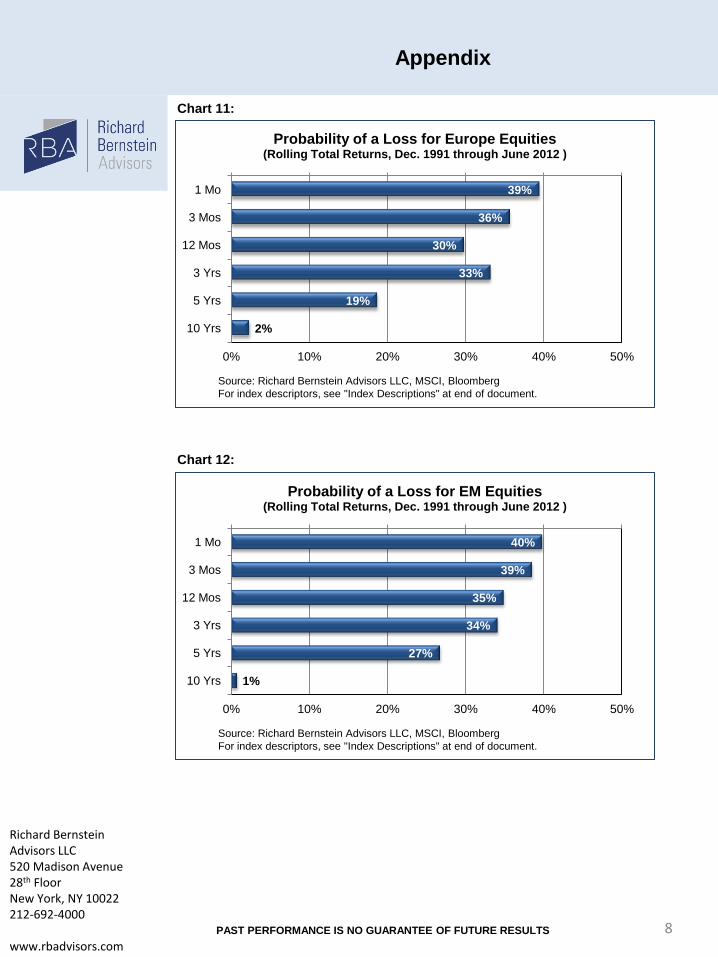
39%
36%
30%
33%
19%
2%
0% 10% 20% 30% 40% 50%
1 Mo
3 Mos
12 Mos
3 Yrs
5 Yrs
10 Yrs
Probability of a Loss for Europe Equities (Rolling Total Returns, Dec. 1991 through June 2012 )
Source: Richard Bernstein Advisors LLC, MSCI, Bloomberg
For index descriptors, see "Index Descriptions" at end of document.
40%
39%
35%
34%
27%
1%
0% 10% 20% 30% 40% 50%
1 Mo
3 Mos
12 Mos
3 Yrs
5 Yrs
10 Yrs
Probability of a Loss for EM Equities (Rolling Total Returns, Dec. 1991 through June 2012 )
Source: Richard Bernstein Advisors LLC, MSCI, Bloomberg
For index descriptors, see "Index Descriptions" at end of document.
9
Chart 13:
Chart 14:
PAST PERFORMANCE IS NO GUARANTEE OF FUTURE RESULTS
Richard Bernstein Advisors LLC 520 Madison Avenue 28th Floor New York, NY 10022 212-692-4000 www.rbadvisors.com
Appendix
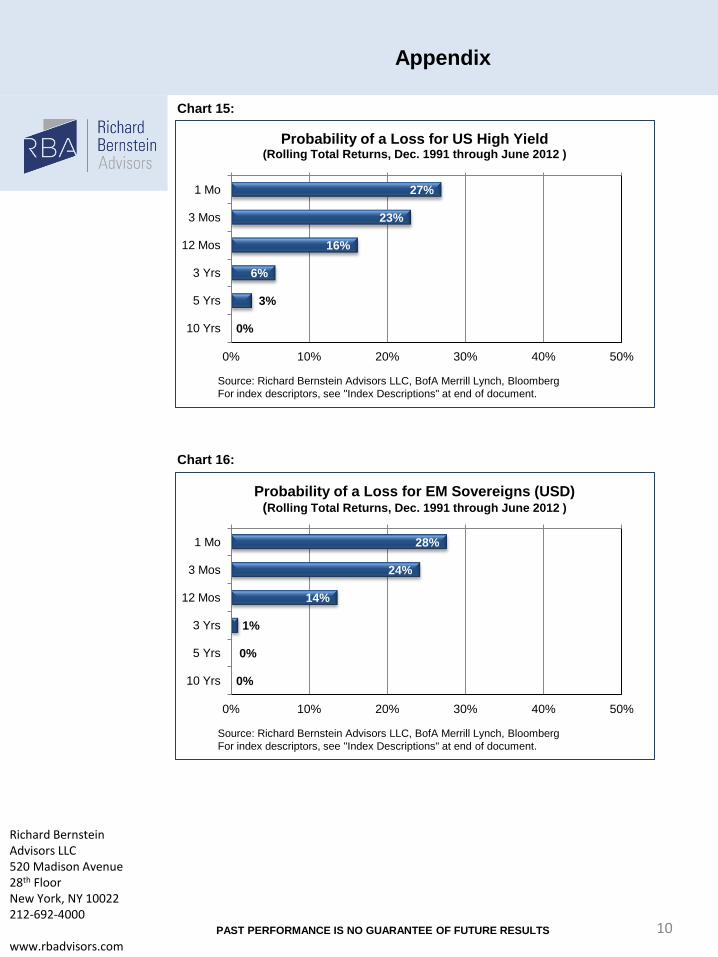
30%
23%
16%
2%
0%
0%
0% 10% 20% 30% 40% 50%
1 Mo
3 Mos
12 Mos
3 Yrs
5 Yrs
10 Yrs
Probability of a Loss for Hedge Funds (Rolling Total Returns, Dec. 1991 through May 2012 )
Source: Richard Bernstein Advisors LLC, HFRI, Bloomberg
For index descriptors, see "Index Descriptions" at end of document.
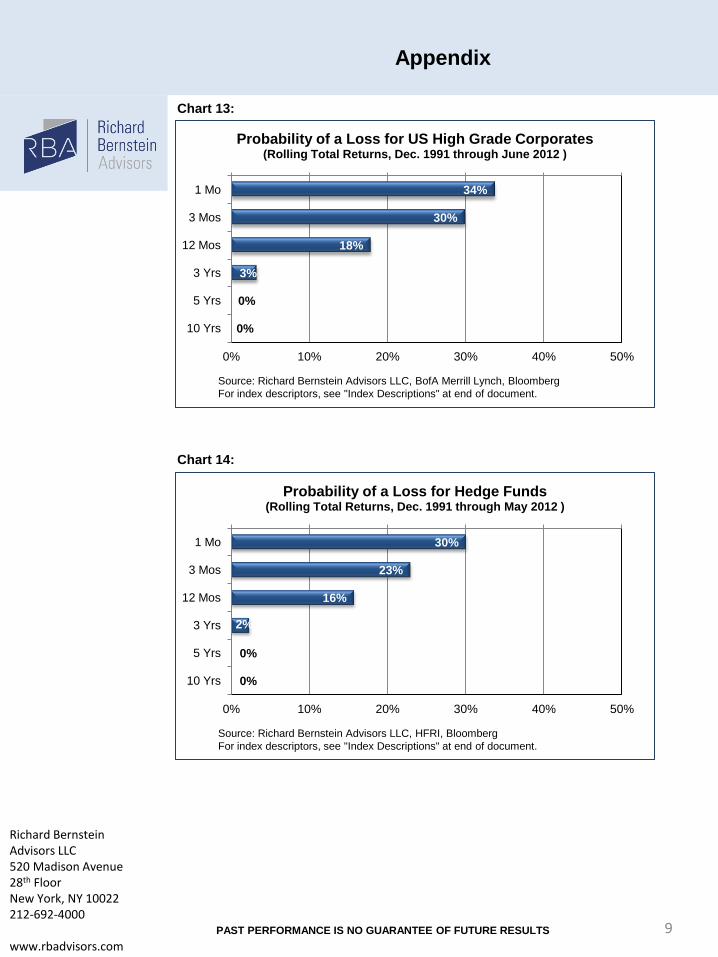
34%
30%
18%
3%
0%
0%
0% 10% 20% 30% 40% 50%
1 Mo
3 Mos
12 Mos
3 Yrs
5 Yrs
10 Yrs
Probability of a Loss for US High Grade Corporates (Rolling Total Returns, Dec. 1991 through June 2012 )
Source: Richard Bernstein Advisors LLC, BofA Merrill Lynch, Bloomberg
For index descriptors, see "Index Descriptions" at end of document.
10
Chart 15:
Chart 16:
PAST PERFORMANCE IS NO GUARANTEE OF FUTURE RESULTS
Richard Bernstein Advisors LLC 520 Madison Avenue 28th Floor New York, NY 10022 212-692-4000 www.rbadvisors.com
Appendix
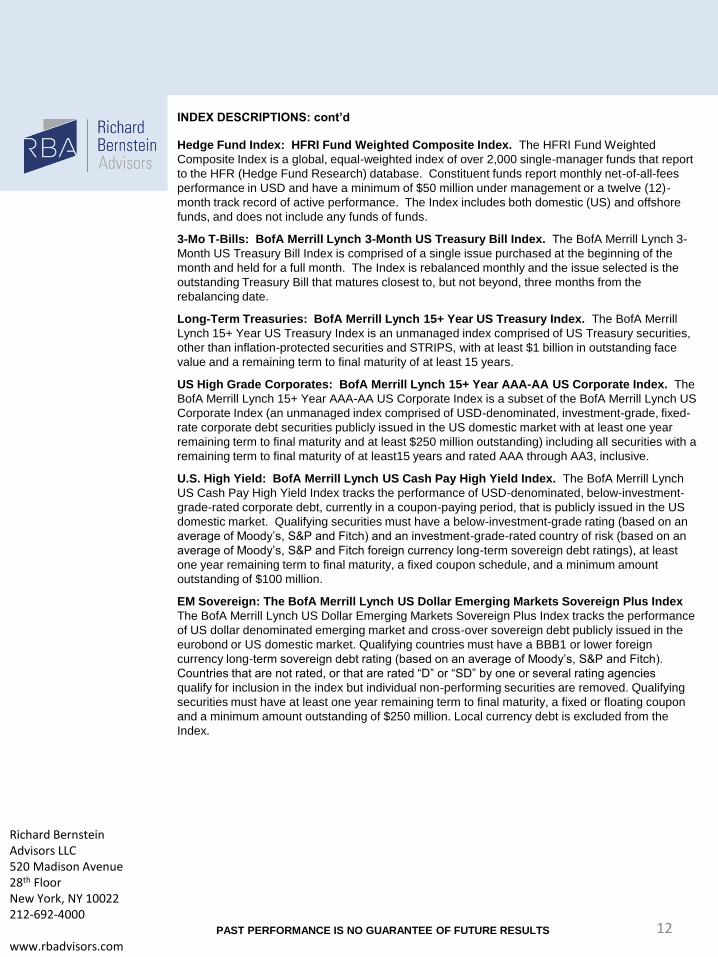
28%
24%
14%
1%
0%
0%
0% 10% 20% 30% 40% 50%
1 Mo
3 Mos
12 Mos
3 Yrs
5 Yrs
10 Yrs
Probability of a Loss for EM Sovereigns (USD) (Rolling Total Returns, Dec. 1991 through June 2012 )
Source: Richard Bernstein Advisors LLC, BofA Merrill Lynch, Bloomberg
For index descriptors, see "Index Descriptions" at end of document.
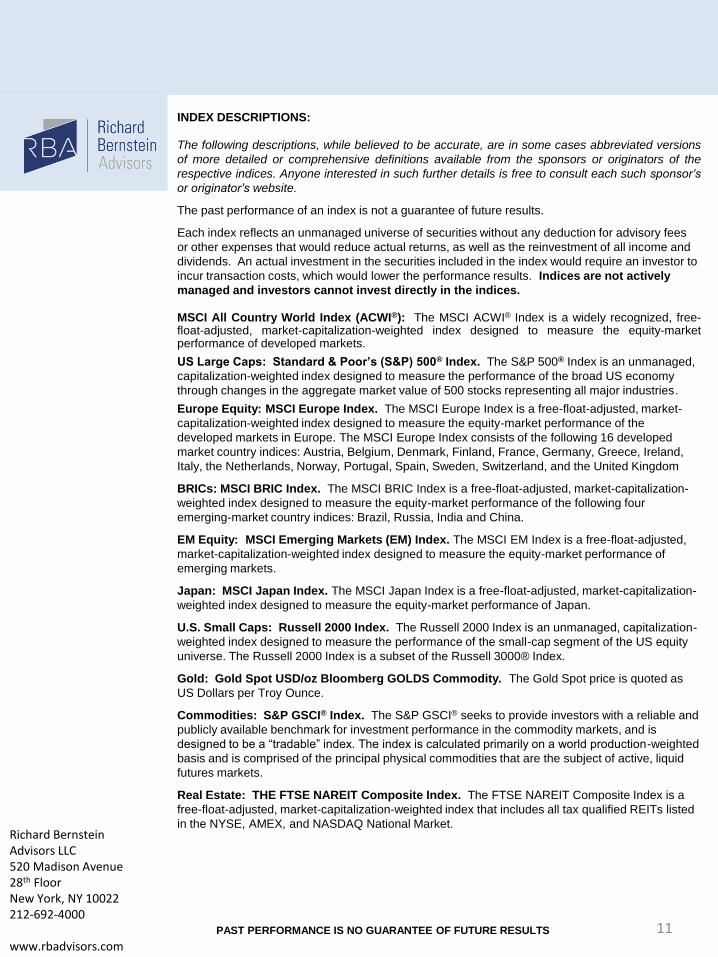
27%
23%
16%
6%
3%
0%
0% 10% 20% 30% 40% 50%
1 Mo
3 Mos
12 Mos
3 Yrs
5 Yrs
10 Yrs
Probability of a Loss for US High Yield (Rolling Total Returns, Dec. 1991 through June 2012 )
Source: Richard Bernstein Advisors LLC, BofA Merrill Lynch, Bloomberg
For index descriptors, see "Index Descriptions" at end of document.
11
PAST PERFORMANCE IS NO GUARANTEE OF FUTURE RESULTS
INDEX DESCRIPTIONS:
The following descriptions, while believed to be accurate, are in some cases abbreviated versions
of more detailed or comprehensive definitions available from the sponsors or originators of the
respective indices. Anyone interested in such further details is free to consult each such sponsor’s
or originator’s website.
The past performance of an index is not a guarantee of future results.
Each index reflects an unmanaged universe of securities without any deduction for advisory fees
or other expenses that would reduce actual returns, as well as the reinvestment of all income and
dividends. An actual investment in the securities included in the index would require an investor to
incur transaction costs, which would lower the performance results. Indices are not actively
managed and investors cannot invest directly in the indices.
MSCI All Country World Index (ACWI®): The MSCI ACWI® Index is a widely recognized, free-float-adjusted, market-capitalization-weighted index designed to measure the equity-market performance of developed markets.
US Large Caps: Standard & Poor’s (S&P) 500® Index. The S&P 500® Index is an unmanaged,
capitalization-weighted index designed to measure the performance of the broad US economy
through changes in the aggregate market value of 500 stocks representing all major industries.
Europe Equity: MSCI Europe Index. The MSCI Europe Index is a free-float-adjusted, market-
capitalization-weighted index designed to measure the equity-market performance of the
developed markets in Europe. The MSCI Europe Index consists of the following 16 developed
market country indices: Austria, Belgium, Denmark, Finland, France, Germany, Greece, Ireland,
Italy, the Netherlands, Norway, Portugal, Spain, Sweden, Switzerland, and the United Kingdom
BRICs: MSCI BRIC Index. The MSCI BRIC Index is a free-float-adjusted, market-capitalization-
weighted index designed to measure the equity-market performance of the following four
emerging-market country indices: Brazil, Russia, India and China.
EM Equity: MSCI Emerging Markets (EM) Index. The MSCI EM Index is a free-float-adjusted,
market-capitalization-weighted index designed to measure the equity-market performance of
emerging markets.
Japan: MSCI Japan Index. The MSCI Japan Index is a free-float-adjusted, market-capitalization-
weighted index designed to measure the equity-market performance of Japan.
U.S. Small Caps: Russell 2000 Index. The Russell 2000 Index is an unmanaged, capitalization-
weighted index designed to measure the performance of the small-cap segment of the US equity
universe. The Russell 2000 Index is a subset of the Russell 3000® Index.
Gold: Gold Spot USD/oz Bloomberg GOLDS Commodity. The Gold Spot price is quoted as
US Dollars per Troy Ounce.
Commodities: S&P GSCI® Index. The S&P GSCI® seeks to provide investors with a reliable and
publicly available benchmark for investment performance in the commodity markets, and is
designed to be a “tradable” index. The index is calculated primarily on a world production-weighted
basis and is comprised of the principal physical commodities that are the subject of active, liquid
futures markets.
Real Estate: THE FTSE NAREIT Composite Index. The FTSE NAREIT Composite Index is a
free-float-adjusted, market-capitalization-weighted index that includes all tax qualified REITs listed
in the NYSE, AMEX, and NASDAQ National Market.
Richard Bernstein Advisors LLC 520 Madison Avenue 28th Floor New York, NY 10022 212-692-4000 www.rbadvisors.com
12
PAST PERFORMANCE IS NO GUARANTEE OF FUTURE RESULTS
Richard Bernstein Advisors LLC 520 Madison Avenue 28th Floor New York, NY 10022 212-692-4000 www.rbadvisors.com
INDEX DESCRIPTIONS: cont’d
Hedge Fund Index: HFRI Fund Weighted Composite Index. The HFRI Fund Weighted
Composite Index is a global, equal-weighted index of over 2,000 single-manager funds that report
to the HFR (Hedge Fund Research) database. Constituent funds report monthly net-of-all-fees
performance in USD and have a minimum of $50 million under management or a twelve (12)-
month track record of active performance. The Index includes both domestic (US) and offshore
funds, and does not include any funds of funds.
3-Mo T-Bills: BofA Merrill Lynch 3-Month US Treasury Bill Index. The BofA Merrill Lynch 3-
Month US Treasury Bill Index is comprised of a single issue purchased at the beginning of the
month and held for a full month. The Index is rebalanced monthly and the issue selected is the
outstanding Treasury Bill that matures closest to, but not beyond, three months from the
rebalancing date.
Long-Term Treasuries: BofA Merrill Lynch 15+ Year US Treasury Index. The BofA Merrill
Lynch 15+ Year US Treasury Index is an unmanaged index comprised of US Treasury securities,
other than inflation-protected securities and STRIPS, with at least $1 billion in outstanding face
value and a remaining term to final maturity of at least 15 years.
US High Grade Corporates: BofA Merrill Lynch 15+ Year AAA-AA US Corporate Index. The
BofA Merrill Lynch 15+ Year AAA-AA US Corporate Index is a subset of the BofA Merrill Lynch US
Corporate Index (an unmanaged index comprised of USD-denominated, investment-grade, fixed-
rate corporate debt securities publicly issued in the US domestic market with at least one year
remaining term to final maturity and at least $250 million outstanding) including all securities with a
remaining term to final maturity of at least15 years and rated AAA through AA3, inclusive.
U.S. High Yield: BofA Merrill Lynch US Cash Pay High Yield Index. The BofA Merrill Lynch
US Cash Pay High Yield Index tracks the performance of USD-denominated, below-investment-
grade-rated corporate debt, currently in a coupon-paying period, that is publicly issued in the US
domestic market. Qualifying securities must have a below-investment-grade rating (based on an
average of Moody’s, S&P and Fitch) and an investment-grade-rated country of risk (based on an
average of Moody’s, S&P and Fitch foreign currency long-term sovereign debt ratings), at least
one year remaining term to final maturity, a fixed coupon schedule, and a minimum amount
outstanding of $100 million.
EM Sovereign: The BofA Merrill Lynch US Dollar Emerging Markets Sovereign Plus Index
The BofA Merrill Lynch US Dollar Emerging Markets Sovereign Plus Index tracks the performance
of US dollar denominated emerging market and cross-over sovereign debt publicly issued in the
eurobond or US domestic market. Qualifying countries must have a BBB1 or lower foreign
currency long-term sovereign debt rating (based on an average of Moody’s, S&P and Fitch).
Countries that are not rated, or that are rated “D” or “SD” by one or several rating agencies
qualify for inclusion in the index but individual non-performing securities are removed. Qualifying
securities must have at least one year remaining term to final maturity, a fixed or floating coupon
and a minimum amount outstanding of $250 million. Local currency debt is excluded from the
Index.
13
PAST PERFORMANCE IS NO GUARANTEE OF FUTURE RESULTS
© Copyright 2012 Richard Bernstein Advisors LLC. All rights reserved.
Nothing contained herein constitutes tax, legal, insurance or investment advice, or the
recommendation of or an offer to sell, or the solicitation of an offer to buy or invest in, any
investment product, vehicle, service or instrument. Such an offer or solicitation may only
be made by delivery to a prospective investor of formal offering materials, including
subscription or account documents or forms, which include detailed discussions of the
terms of the respective product, vehicle, service or instrument, including the principal risk
factors that might impact such a purchase or investment, and which should be reviewed
carefully by any such investor before making the decision to invest. Specifically, and
without limiting the generality of the foregoing, before acquiring the shares of any mutual
fund, it is your responsibility to read the fund’s prospectus. Links to appearances and
articles by Richard Bernstein, whether in the press, on television or otherwise, are provided
for informational purposes only and in no way should be considered a recommendation of
any particular investment product, vehicle, service or instrument or the rendering of
investment advice, which must always be evaluated by a prospective investor in
consultation with his or her own financial adviser and in light of his or her own
circumstances, including the investor's investment horizon, appetite for risk, and ability to
withstand a potential loss of some or all of an investment's value. Investing is an inherently
risky activity, and investors must always be prepared to potentially lose some or all of an
investment's value. Past performance is, of course, no guarantee of future results.
Richard Bernstein Advisors LLC 520 Madison Avenue 28th Floor New York, NY 10022 212-692-4000 www.rbadvisors.com