is 15188 (2012): water quality – general guidance on the
TRANSCRIPT

Disclosure to Promote the Right To Information
Whereas the Parliament of India has set out to provide a practical regime of right to information for citizens to secure access to information under the control of public authorities, in order to promote transparency and accountability in the working of every public authority, and whereas the attached publication of the Bureau of Indian Standards is of particular interest to the public, particularly disadvantaged communities and those engaged in the pursuit of education and knowledge, the attached public safety standard is made available to promote the timely dissemination of this information in an accurate manner to the public.
इंटरनेट मानक
“!ान $ एक न' भारत का +नम-ण”Satyanarayan Gangaram Pitroda
“Invent a New India Using Knowledge”
“प0रा1 को छोड न' 5 तरफ”Jawaharlal Nehru
“Step Out From the Old to the New”
“जान1 का अ+धकार, जी1 का अ+धकार”Mazdoor Kisan Shakti Sangathan
“The Right to Information, The Right to Live”
“!ान एक ऐसा खजाना > जो कभी च0राया नहB जा सकता है”Bhartṛhari—Nītiśatakam
“Knowledge is such a treasure which cannot be stolen”
“Invent a New India Using Knowledge”
है”ह”ह
IS 15188 (2012): Water Quality – General Guidance on theEnumeration of Micro-Organisms by Culture [FAD 14: Drinksand Carbonated Beverages]


Hkkjrh; ekud
ikuh dh xq.krk — laoèkZu }kjk lw{ethoksadh x.kuk gsrq lkekU; ekxZn'kZu
(igyk iqujh{k.k)
Indian StandardWATER QUALITY — GENERAL GUIDANCE
ON THE ENUMERATION OF MICRO-ORGANISMSBY CULTURE
( First Revision )
ICS 07.100.20
© BIS 2012
August 2012 Price Group 12
B U R E A U O F I N D I A N S T A N D A R D SMANAK BHAVAN, 9 BAHADUR SHAH ZAFAR MARG
NEW DELHI 110002
IS 15188 : 2012ISO 8199 : 2005

Drinks and Carbonated Beverages Sectional Committee, FAD 14
NATIONAL FOREWORD
This Indian Standard (First Revision) which is identical with ISO 8199 : 2005 ‘Water quality — Generalguidance on the enumeration of micro-organisms by culture’ issued by the International Organizationfor Standardization (ISO) was adopted by the Bureau of Indian Standards on the recommendation ofthe Drinks and Carbonated Beverages Sectional Committee and approval of the Food and AgricultureDivision Council.
This standard was first published in 2002 under dual numbering identical with ISO 8199 : 1988. Thefirst revision of this standard has been undertaken to align it with the latest version of ISO Standardwhich has been technically revised.
The text of ISO Standard has been approved as suitable for publication as an Indian Standard withoutdeviations. Certain conventions are, however, not identical to those used in Indian Standards. Attentionis particularly drawn to the following:
a) Wherever the words ‘International Standard’ appear referring to this standard, they shouldbe read as ‘Indian Standard’.
b) Comma (,) has been used as a decimal marker while in Indian Standards, the currentpractice is to use a point (.) as the decimal marker.
In this adopted standard, reference appear to the following International Standard for which IndianStandard also exists. The corresponding Indian Standard which is to be substituted in its place islisted below along with its degree of equivalence for the edition indicated:
International Standard Corresponding Indian Standard Degree of Equivalence
ISO 3696 : 1987 Water for analyticallaboratory use — Specification andtest methods
IS 1070 : 1992 Reagent grade water— Specification (third revision)
Technically Equivalent
The technical committee has reviewed the provision of the following International Standard referredin this adopted standard and has decided that it is acceptable for use in conjunction with this standard:
International Standard Title
ISO 19458 Water quality — Sampling for microbiological analysis
For the purpose of deciding whether a particular requirement of this standard is complied with, thefinal value, observed or calculated, expressing the result of a test or analysis, shall be rounded off inaccordance with IS 2 : 1960 ‘Rules for rounding off numerical values (revised)’. The number ofsignificant places retained in the rounded off value should be the same as that of the specified valuein this standard.

WARNING — Persons using this International Standard should be familiar with normal laboratory practice. This standard does not purport to address all of the safety problems, if any, associated with its use. It is the responsibility of the user to establish appropriate safety and health practices and to ensure compliance with any national regulatory conditions.
IMPORTANT — It is absolutely essential that tests conducted in accordance with this International Standard be carried out by suitably trained staff.
1 Scope
This International Standard presents guidance for carrying out manipulations which are common to each technique for the microbiological examination of water, particularly the preparation of samples, culture media and apparatus. It also describes the various enumeration techniques available and the criteria for the choice of a particular technique. This International Standard is mainly intended for bacteria, yeasts and moulds. Some aspects are also applicable to viruses and parasites.
2 Normative references
The following referenced documents are indispensable for the application of this document. For dated references, only the edition cited applies. For undated references, the latest edition of the referenced document (including any amendments) applies.
ISO 3696:1987, Water for analytical laboratory use — Specification and test methods
ISO 19458, Water quality — Sampling for microbiological analysis
3 Principle
The general principle of these techniques consists of inoculating a known volume of a water sample on or into a culture medium (solid or liquid). It is assumed that after incubation each micro-organism present multiplies, giving either a colony visible directly on the solid medium, or changes in observable properties of the liquid medium. The choice of a particular method depends not only on the nature of the micro-organisms sought, but also on the nature of the water and the reasons for the examination.
4 General
Uniformity of temperatures and (incubation) times: The following accepted ranges of temperatures and times during incubation or storage are applied, when appropriate for the intended target organism, and unless otherwise stated in the specific standard.
IS 15188 : 2012ISO 8199 : 2005
1
Indian StandardWATER QUALITY — GENERAL GUIDANCE
ON THE ENUMERATION OF MICRO-ORGANISMSBY CULTURE
( First Revision )

Storage temperatures: (− 70 ± 10) °C; (− 20 ± 5) °C; (5 ± 3) °C;
Incubation temperatures: (22 ± 2) °C; (36 ± 2) °C;
Sterilization temperatures: (115 ± 3) °C; (121 ± 3) °C; (170 ± 10) °C;
Incubation times: (21 ± 3) h; (44 ± 4) h; (68 ± 4) h.
Other times and temperatures may be specified for specific methods when necessary.
The upper incubation temperature limits are very strict (they can have large influences on the growth). The lower temperature limits may be exceeded for short periods, e.g. due to opening the door of an incubator, but recovery shall be rapid.
Tolerances on volumes and masses: Unless otherwise stated, the accepted range of any measured value is: stated value ± 5 %.
5 Diluents and culture media
5.1 General
5.1.1 Quality requirements
Use constituents of uniform quality and analytical-grade chemicals for the preparation of media. Other grades of chemical may be used provided they can be shown to produce the same results. Alternatively, dehydrated complete media or diluents may be used. Follow the manufacturer's instructions strictly.
Use glass-distilled or demineralized water which is free from substances that might affect growth of micro-organisms under the test conditions. The water shall comply with the requirements of ISO 3696:1987, grade 3.
Unless otherwise stated, the ingredients are added to the volume of water instead of making up to a certain volume, as is normal in the preparation of microbiological culture media.
Before use, check the quality of the media, diluents and filters, e.g. by following the procedures described in ISO 7704, ISO/TS 11133-1 or ISO/TS 11133-2.
5.1.2 Sterilization
Dispense diluents and culture media in containers suitable for sterilization by autoclaving. For most purposes, a temperature of (121 ± 3) °C for 15 min is adequate. However, a different time and temperature may sometimes be required and details are given in each individual standard.
Alternatively, with thermolabile substances, removal of micro-organisms may be effected by filtration through a filter with a pore size of 0,2 µm, specified by the manufacturer as being suitable for “sterilization”.
5.2 Diluents
The diluents given in this subclause are commonly used in water microbiology. However, the list is not exhaustive and other appropriate diluents may be used.
After preparation, distribute each solution into bottles and sterilize, e.g. by autoclaving at (121 ± 3) °C for 15 min. Alternatively, the diluent can be aseptically distributed after sterilization. Store at room temperature or in a refrigerator at (5 ± 3) °C for a maximum of 6 months. If a diluent shows any change from its normal appearance, discard it.
IS 15188 : 2012ISO 8199 : 2005
2

5.2.1 Saline solution
Composition
Sodium chloride (NaCl) 8,5 g
Water (see 5.1.1) 1 000 ml
Preparation
Dissolve the ingredients in the water, if necessary by heating. Adjust the pH by adding sodium hydroxide solution [c(NaOH) = 1 mol/l] or hydrochloric acid [c(HCI) = 1 mol/l] so that, after sterilization (see 5.1.2), it will correspond to 7,0 ± 0,5 at 25 °C.
5.2.2 Peptone diluent
Composition
Enzymatic digest of casein (peptone) 1,0 g
Water (see 5.1.1) 1 000 ml
Preparation
Dissolve the ingredients in the water, if necessary by heating. Adjust the pH by adding sodium hydroxide solution [c(NaOH) = 1 mol/l] or hydrochloric acid [c(HCl) = 1 mol/l] so that, after sterilization (see 5.1.2), it will correspond to 7,0 ± 0,5 at 25 °C.
5.2.3 Peptone saline solution
Composition
Enzymatic digest of casein (peptone) 1,0 g
Sodium chloride (NaCl) 8,5 g
Water (see 5.1.1) 1 000 ml
Preparation
Dissolve the ingredients in the water, if necessary by heating. Adjust the pH by adding sodium hydroxide solution [c(NaOH) = 1 mol/l] or hydrochloric acid [c(HCI) = 1 mol/l] so that, after sterilization (see 5.1.2), it will correspond to 7,0 ± 0,5 at 25 °C.
5.2.4 Ringer's solution, quarter-strength
Composition
Sodium chloride (NaCl) 2,25 g
Potassium chloride (KCl) 0,105 g
Calcium chloride (anhydrous) (CaCl2) 0,12 g
Sodium hydrogen carbonate (NaHCO3) 0,05 g
Water (see 5.1.1) 1 000 ml
IS 15188 : 2012ISO 8199 : 2005
3

Preparation
Dissolve the ingredients in the water, if necessary by heating. Adjust the pH by adding sodium hydroxide solution [c(NaOH) = 1 mol/l] or hydrochloric acid [c(HCI) = 1 mol/l] so that, after sterilization (see 5.1.2), it will correspond to 7,0 ± 0,2 at 25 °C.
5.2.5 Phosphate buffer solution
a) Phosphate solution
Composition
Potassium dihydrogen orthophosphate (KH2PO4) 34 g
Water (see 5.1.1) to 1 000 ml
Preparation
Dissolve the potassium dihydrogen orthophosphate in 500 ml of the water. Adjust the pH to a value of 7,2 ± 0,2 by adding sodium hydroxide solution [c(NaOH) = 1 mol/l] or hydrochloric acid [c(HCI) = 1 mol/l]. Add more water up to 1 000 ml. If the solution needs to be stored, sterilize it (see 5.1.2) before storage.
b) Magnesium chloride solution
Composition
Magnesium chloride (MgCI2) 38 g
Water (see 5.1.1) 1 000 ml
Alternatively, an equivalent mass (99 g) of magnesium sulfate (MgSO4.7H2O) may be used.
Preparation
Dissolve the magnesium chloride in the water. If the solution needs to be stored, sterilize it (see 5.1.2) before storage.
c) Final solution
Composition
Phosphate solution (a) 1,25 ml
Magnesium chloride solution (b) 5,0 ml
Water (see 5.1.1) 1 000 ml
Preparation
Add the phosphate solution (a) and the magnesium chloride solution (b) to the water, dispense in convenient volumes and sterilize (see 5.1.2). The final pH should correspond to 7,0 ± 0,2 at 25 °C.
5.3 Culture media
Once a bottle of dehydrated medium (chemical) is opened, date the container and indicate a maximum storage time.
IS 15188 : 2012ISO 8199 : 2005
4
In general, most media after sterilization in sealed containers may be stored satisfactorily for several months at room temperature provided they are kept in the dark and remain sealed. Media dispensed aseptically may be stored at (5 ± 3) °C for up to 1 month, or longer if approved. Before use, inspect them carefully for contamination, excessive evaporation, or other evidence of deterioration. Most reagents are best kept at (5 ± 3) °C. Use culture media supplied pre-poured in accordance with the manufacturer's instructions.
Pre-cool the medium to 45 °C to 50 °C if heat-sensitive supplements need to be added after autoclaving.
6 Sterilization of apparatus and glassware
Sterilize apparatus and glassware which are not supplied sterile by one of the following methods:
a) in an oven, at (170 ± 10) °C for at least 1 h (excluding pre-heating time);
b) in an autoclave, at (121 ± 3) °C for at least 15 min.
If membrane filters are not obtained sterile, sterilize them before use in accordance with the manufacturer's instructions.
7 Samples
7.1 Sampling
Take samples in accordance with ISO 19458.
7.2 Preparation of test sample
Before examination, mix the sample thoroughly by vigorous agitation to achieve uniform distribution of micro-organisms and, depending on the nature of the water and the microbial content anticipated, make any dilutions necessary at this stage.
In the case of plate counts, decimal dilutions can be used. For membrane filtration (with a smaller surface area), smaller dilution steps are recommended.
For ten-fold dilutions, measure 90 ml or 9 ml of the diluent into sterile dilution bottles or tubes. Alternatively, volumes of diluent, pre-sterilized in screwcapped bottles, can be used. One or more ten-fold dilutions are made by transferring one volume of water sample to nine volumes of diluent. Mix the solution thoroughly (with a fresh pipette or by mechanical means) and transfer one volume of this dilution to another nine volumes of diluent. These steps are repeated as many times as required. Prepare sufficient volumes of each dilution for all the tests to be carried out on the sample.
For dilutions other than ten-fold, the volume of diluent to volume of sample shall be adjusted accordingly. Various approaches can be taken, i.e. 3- or 4-fold dilution series, or decimal dilution series of which both 10 ml and 30 ml volumes are filtered. Four-fold dilutions can be made as described above for ten-fold dilutions, except that, in this case, one volume of water sample is mixed with three volumes of diluent.
If the concentration of the target organism is expected to be high, hundred-fold dilution steps can be used.
For general guidance on the preparation of ten-fold dilutions, see ISO 6887-1.
IS 15188 : 2012ISO 8199 : 2005
5
8 Enumeration after inoculation of test portions of the sample in (or on) solid media
8.1 Principle
A test portion of the water sample, or a dilution, is inoculated either directly or concentrated on a membrane on the surface of a specified solid culture medium or in a molten medium so that, on incubation, micro-organisms form colonies either on or in the medium.
For practical purposes, each colony is considered to have originated from a single micro-organism or a clump of micro-organisms present in the test portion at the moment of inoculation. Taking into account the volume of the test portion and the number of colonies formed, the result can therefore be expressed as a number of colony-forming units (cfu) or colony-forming particles (cfp) in a given volume of the sample, e.g. 1 ml or 100 ml.
8.2 Procedures
8.2.1 General
Three main procedures may be used for the inoculation of solid media.
a) Pour plate technique.
The test portion is mixed with the medium, which has previously been melted and cooled to a temperature close to that of solidification; after incubation, the colonies that develop within and on the surface of the medium are counted.
b) Spread plate technique.
The test portion is spread over the dry surface of an agar medium and, after incubation, colonies that develop on its surface are counted.
c) Membrane filtration technique.
The test portion is passed through a membrane filter, which retains the micro-organisms sought; the membrane is then placed on an agar medium or on an absorbent pad impregnated with liquid or rehydrated medium. On incubation, colonies form on the surface of the membrane. Alternatively, for certain organisms, such as anaerobes, the membrane may be placed face downwards in a Petri dish and overlaid with molten agar medium.
8.2.2 Choice of technique
The choice of technique depends on several factors, including the physical and chemical characteristics of the water as well as the nature of the micro-organisms sought (see Annex A, Clause A.3), their probable concentration, the effective recovery of stressed or (sub-lethally) injured micro-organisms, the test precision and the sensitivity required. Indications are given in 8.2.3.1, 8.2.4.1 and 8.2.5.1 of the volumes of water samples that can be used for each technique and the limits of detection are discussed in Clause A.2. The accuracy of the techniques is also discussed in Clause A.2. The requirements of regulations may also influence the choice of technique to be used by indicating, for example, the precision desired or whether the presence or absence of an organism in a specified test volume will be sufficient.
8.2.3 Pour plate technique
8.2.3.1 Test portion
The volume of the test portion of the sample, or of a dilution of the sample, can vary between 0,1 ml and 5 ml, depending on the size of the Petri dish and the volume of culture medium used. The dilution should be chosen so that the expected number of typical colonies formed on plates of diameter 90 mm to 100 mm is between about 10 and 150. The total number of colonies on the plate (typical and non-typical) should be less than 300
IS 15188 : 2012ISO 8199 : 2005
6
(see ISO 7218). Note, however, that the total number of countable colonies depends on the size of the colonies and the number may have to be reduced for large colonies.
8.2.3.2 Inoculation
Melt the medium required in boiling water or by any other suitable process (e.g. an appropriate air incubator, a steam flow-through autoclave or a microwave oven, if the heating time/temperature combination has been validated for the medium preparation). Avoid over-heating and remove the medium as soon as it has been melted. Place the molten medium in a water bath at (45 ± 1) °C for sufficient time so that the medium will equilibrate to this temperature. It is preferable not to keep a medium molten for more than 4 h. Do not melt agar media more than once.
Prepare and mark the Petri dishes required. Make any dilutions necessary in accordance with 7.2. Distribute, after thorough mixing, the test portions into the dishes.
Remove each tube or flask of molten medium in turn from the water bath, dry the outside of the tube or flask and flame the neck. Add the medium to each Petri dish without delay, avoiding the test portion to minimize heat shock, and mix carefully so as to obtain a uniform distribution of micro-organisms. Generally, 15 ml of medium is used for a test portion of 1 ml or 2 ml; for larger test portions, adjust the concentration of the medium accordingly. Leave the plates to cool on a horizontal surface in order to allow the agar to solidify. As soon as the agar has solidified, incubate the plates in accordance with 8.2.6.
NOTE Agar preparator pourer-stacker systems can be useful in laboratories analysing large numbers of samples.
8.2.4 Spread plate technique
8.2.4.1 Test portion
For a Petri dish of between 90 mm and 100 mm diameter, the volume of the test portion of the sample, or of a dilution of the sample, should be 0,1 ml to 0,5 ml. Choose the dilution so that the expected number of typical colonies formed lies between about 10 and 150. The total number of colonies on the plate (typical and non-typical) should be less than 200. Note, however, that the total number of countable colonies depends on the size of the colonies and the number may have to be reduced for large colonies.
8.2.4.2 Inoculation
Prepare and mark plates, each containing about 15 ml of culture medium. Dry the surface of the medium before use (if necessary). Pipette the test portion on to the surface of the medium and spread over the surface with a sterile rod or mechanical device. After absorption of the inoculum, incubate the plates in accordance with 8.2.6.
For the drying of the plates the following points are of importance:
The degree of humidity in culture media is important because optimum growth of bacteria will depend on the humidity conditions in and on the medium. Extensive humidity loss may lead, for example, to an increase in the concentrations of inhibitors in selective culture media and a reduction in the water activity at the surface of the medium.
When bacteria that do not spread rapidly are cultured, and the plates look dry after acclimatization, the circumstances are such that drying is not always necessary. In that case, drying can be omitted, as it only increases the likelihood of contamination and unnecessary humidity loss.
Select the temperature and drying time so that the likelihood of contamination is kept as low as possible and heating will not negatively affect the quality of the culture medium. The drying time will depend on the degree to which condensation is present in the Petri dish, but shall be kept as short as possible.
In order to avoid contamination, and if the plates are not dried in a laminar-flow cabinet, plates shall always be dried with the surface of the culture medium to be inoculated turned downwards.
IS 15188 : 2012ISO 8199 : 2005
7

In practice, the plates will be dried by placing them with the agar surfaces downwards and with half-open lids in an incubator set at a temperature between 25 °C and 50 °C. Dry the plates until the droplets have disappeared from the surface of the lids. Do not dry any further. The agar plates can also be dried (in the same way as described above) in a laminar-flow safety cabinet (at room temperature) for 30 min to 60 min, or overnight at room temperature with the lids in place.
8.2.5 Membrane filtration technique
8.2.5.1 Test portion
The maximum volume of the test portion depends on the filterability of the water sample and on the membranes used. This technique is suitable for waters that contain little particulate or colloidal (e.g. iron) matter in suspension, for example drinking water. With membranes of mean pore size 0,45 µm, it may be possible to filter several litres of such water through a single membrane, and so achieve a high level of test sensitivity. For some organisms (like Legionella), however, filtration through a membrane with a mean pore size of 0,2 µm may be necessary.
A test volume of the sample or a dilution of it should be chosen so that the expected number of typical colonies formed on a membrane of 47 mm to 50 mm in diameter is between about 10 and 100. The total number of colonies on the filter (typical and non-typical) should be less than about 200. Note, however, that the total number of countable colonies depends on the size of the colonies and the number may have to be reduced for large colonies.
8.2.5.2 Filtration
Connect the sterile filtration apparatus to a source of vacuum. Place a sterile membrane filter, grid-side upwards, on the porous disc of the filter base, with only the outer part of the membrane filter being grasped by flat-ended sterile forceps. Position the sterile funnel securely on the filter base. Pipette or pour one of the following into the funnel (with the vacuum stopcock turned off):
a) a known volume of the sample, or dilution of it, carefully mixed (at least 10 ml);
b) the contents of a flask or bottle containing the test portion and sufficient diluent to bring the total volume to at least 10 ml;
c) at least 10 ml of diluent, to which the test portion, measured with a pipette, is added directly and mixed with the pipette.
Open the stopcock and apply sufficient vacuum (about 70 kPa) to filter the water through the membrane. Close the stopcock as soon as the sample has been filtered. It may be advisable to rinse the funnel by filtering one to three 10 ml to 30 ml portions of sterile diluent while the filter is still in place.
8.2.5.3 Transfer of membrane
Remove the funnel (make sure the stopcock is closed before doing this) and transfer the membrane with sterile forceps to one of the following, ensuring that no air bubbles are trapped between the membrane and the medium:
a) an agar medium in a Petri dish;
b) a sterile absorbent pad previously saturated with a liquid medium, or a dehydrated medium pad reconstituted with sterile water, in a Petri dish (to avoid any confluent growth, pour off any excess medium, preferably before placing the membrane on the pad);
c) a Petri dish, or on to a little agar medium in a Petri dish, subsequently overlaying the membrane with molten agar medium at (45 ± 1) °C.
IS 15188 : 2012ISO 8199 : 2005
8

For different volumes of the same sample, the funnel may be re-used without disinfection provided that the smallest volumes and/or the most diluted sample are filtered first. To filter another sample, either use a separate sterile apparatus or disinfect the funnel, for example by flaming. Alternatively, follow the manufacturer's instructions for disinfection.
8.2.6 Incubation
Invert the inoculated plates and place them either in an incubator or in a water-tight container in a water bath. If necessary, pack the plates in plastic (bags) to prevent desiccation of the medium (e.g. when a fan-assisted incubator is used). Plates containing membranes on absorbent pads should be placed (not inverted) in an air- or water-tight container to prevent desiccation of the medium, if necessary. Do not make higher stacks than 6 Petri dishes to ensure that all plates reach incubation temperature rapidly.
Choose the duration and temperature of incubation by consulting a standard method, as they depend on the micro-organism, or groups of micro-organisms, sought.
Incubation may be carried out in two stages, as follows:
Pre-incubation of variable duration, for example 2 h to 4 h at a lower temperature (e.g. 25 °C to 30 °C), can be used to permit resuscitation of stressed organisms, followed by a longer period of incubation at the usual temperature for the organism sought. The change may be effected either by transfer to another incubator or water bath, or by using apparatus in which the temperature is automatically changed after a given time. Ideally, place all the plates in the incubator or water bath at the same time.
Alternatively, the membranes may be incubated for a limited period (e.g. 2 h or 4 h) on a resuscitation medium and then transferred to another medium, which is usually selective, for further incubation.
8.3 Enumeration
8.3.1 General
Examine the plates or membranes immediately after incubation. If this is not possible, they may be kept at (5 ± 3) °C for short periods (e.g. a few days) provided that this does not affect the numbers, appearance or subsequent confirmation of the colonies. If the plates or membranes are stored, validate the storage period as being acceptable for the method and sample type.
8.3.2 Colonies to be counted and confirmed
For “total” counts on a non-selective medium, all the colonies are counted. With selective and differential media, only those colonies that show the characteristic appearance of the organism sought are counted. Magnification may be used (unless otherwise stated) when colony size is small and/or when it is otherwise difficult to differentiate colonies from other particles. In general, it is unusual for such counts to indicate the organisms belonging only to one taxonomic group, but in practice this discrepancy may be accepted and the results can be expressed as presumptive. For more precise characterization, confirmatory tests are necessary.
It may be impracticable, however, if there are numerous colonies, to confirm the identity of all of them. In such instances, examine all typical colonies from a sub-area of the plate or membrane (see also 8.4.3).
8.4 Calculation of results
8.4.1 Principle
A large part of this subclause has been taken from ISO 7218:1996/Amd 1:2001.
The methods of calculation defined below take account of the cases that occur most frequently when tests are carried out in accordance with the methods of good practice of a laboratory. Rare, special cases may occur (for example, significant discrepancy between the number of colonies on two plates with the same dilution, or
IS 15188 : 2012ISO 8199 : 2005
9

a very different ratio to that of the dilution factor between the plates of two successive dilutions), and it is therefore necessary that results obtained from counting be examined, interpreted or even refused by a qualified microbiologist.
8.4.2 General case
The calculation of results given in this subclause can be used in cases when the total number of colonies on the plates is between 10 and 200 (spread plate and membrane filtration techniques) or between 10 and 300 (pour plate technique), and where the number of typical colonies is between 10 and 150 (spread plate and pour plate techniques) or between 10 and 100 (membrane filtration technique).
Since each colony is assumed to have arisen from one micro-organism or from a single aggregate of micro-organisms, the result is expressed as the number of colony-forming units (cfu) or colony-forming particles (cfp) in a specified reference volume of the sample (generally 100 ml or 1 ml) by Equation (1):
s stot
ZC VV
= × (1)
where
Cs is the estimate of the number of cfu or cfp in the reference volume Vs of the sample;
Z is the sum of colonies counted on plates or on membranes derived from dilutions d1, d2, ..., di, or derived from separate volumes of the test portion (sample or dilution);
Vs is the reference volume chosen to express the concentration of the micro-organisms in the sample;
Vtot is the calculated total volume of original sample included in the plates enumerated. Vtot is either the sum of the separate volumes from the test portion (sample or dilution) or calculated by Equation (2):
Vtot = (n1V1d1) + (n2V2d2) + ...... + (niVidi) (2)
where
Vtot is the calculated total volume of original sample included in the plates enumerated;
n1, n2, ..., ni is the number of plates counted for dilution d1, d2, ..., di;
V1, V2, ..., Vi is the test volume used with dilution d1, d2, ..., di;
d1, d2, ..., di is the dilution used for the test volume V1, V2, ..., Vi (d = 1 for an undiluted sample, d = 0,1 for a ten-fold dilution, etc.).
NOTE 1 The final result thus obtained is a function of the weighted average of the counts from each plate.
Unless otherwise stated, round off the calculated results to two significant figures, when reporting final results. In order to do this, if the third figure is less than 5 do not modify the preceding figure; if the third figure is greater than or equal to 5, increase the preceding figure by one unit.
Express the result as a number preferably between 1,0 and 9,9 multiplied by the appropriate power of 10, or a whole number with two significant figures.
IS 15188 : 2012ISO 8199 : 2005
10

An example of the calculation for the pour or spread plate technique (enumerated in duplicate) is as follows:
EXAMPLE 1
If the volume of the test solution used (Vi) is 1 ml, and the following counts are obtained at the respective dilutions:
Dilution Counts
10−2 81 colonies and 97 colonies
10−3 9 colonies and 15 colonies
then:
Z = 81 + 97 + 9 + 15 = 202
Vtot = (2 × 1 × 0,01) + (2 × 1 × 0,001) = 0,022
and if Vs is 1 ml:
s202
1 9 1820,022
C = × =
then, after rounding off: Cs = 9,2 × 10³ cfu/ml (or cfp/ml).
An example of the calculation for the membrane filtration technique (enumerated in singular) is as follows:
EXAMPLE 2
Test volume (Vi) Counts
100 ml 82 colonies
10 ml 11 colonies
then:
Z = 82 + 11 = 93
Vtot = (1 × 100 × 1) + (1 × 10 × 1) = 110
and if Vs is 100 ml:
s93
100 84110
C = × = cfu/100 ml (or cfp/100 ml).
It is desirable to report the results of such colony counts together with the 95 % confidence limits, which may be derived by application of the following equations (see Reference [5]):
1) When Z W 20, the final result with 95 % confidence interval (CI) is given by Equation (3):
s s stot tot tot
2 295 % CI Z Z Z ZC V VV V V
±± = × = ± ×
(3)
where the symbols are as defined above.
IS 15188 : 2012ISO 8199 : 2005
11
2) When Z < 20, the effect of the increasing skew (asymmetry) of the Poisson distribution on the confidence limits is approximately taken into account by adding the small corrections included in Equation (4):
stot
2 2 1Upper and lower 95 % CI Z Z VV
+ ± += ×
(4)
NOTE 2 The last equation gives a mean and 95 % CI even for Z = 0, which may be misleading.
NOTE 3 The number “2” (before the square root) in the equations is a rounding-off of 1,96 (≅ 2).
NOTE 4 The 95 % CI calculations assume a Poisson distribution in all cases.
8.4.3 Case after identification or confirmation
When the method used requires identification or confirmation, all presumed suspect colonies should be inoculated from each of the plates retained for the counting of colonies. When this is impracticable, all typical colonies (n) should be examined from a sub-area of the plate or membrane (n may vary from plate to plate). The main reason for recommending the confirmation of all presumptive colonies from a certain area instead of a random selection is that laboratories may not be able to isolate an objective random subset of the suspect colonies. If a reliable random sample is obtainable, then the minimum and at the same time sufficient average number for routine monitoring is to confirm about n = 5 colonies per plate. The recommended practice is to isolate all colonies when the number is between 1 and 5. Thereafter, an average of n = 5 is appropriate. (If the number of presumptive colonies is 6 or 7, it does not make much sense to select only a subset of n = 5.) After identification or confirmation, calculate for each of the plates the confirmed result as the proportion of presumptive colonies complying with the identification or confirmation criteria, using Equation (5):
kx zn
= × (5)
where
x is the estimated number of confirmed colonies per plate;
k is the number of colonies complying with identification or confirmation criteria among the inoculated colonies n;
n is the number of presumptive positive colonies inoculated from a plate for confirmation;
z is the total number of presumptive positive colonies counted on the plate.
Do not round off the intermediate confirmed test results x.
Calculate the number Cs of identified or confirmed micro-organisms present in the test sample by replacing Z by X (the sum of x), using Equation (1) given in 8.4.2. Round off and express the result as recommended in 8.4.2.
EXAMPLE
Counting has produced the following result:
Dilution Counts
10−3 66 colonies and 80 colonies
10−4 4 colonies and 7 colonies
IS 15188 : 2012ISO 8199 : 2005
12

Confirmation of selected colonies was carried out:
of the 66 colonies, 8 colonies were tested, 6 of which complied with the criteria; hence 16
66 49,5;8
x × ==
of the 80 colonies, 9 colonies were tested, 6 of which complied with the criteria; hence x2 = 53,3;
of the 7 colonies, 5 colonies were tested, 4 of which complied with the criteria; hence x3 = 5,6;
of the 4 colonies, all 4 colonies were tested and all 4 complied with the criteria; hence x4 = z4 = 4,0.
X = 49,5 + 53,3 + 5,6 + 4,0 = 112,4
and if Vs is 1 ml:
s s stot
112,4 112,41 51 091
(2 1 0,001) (2 1 0,000 1) 0,002 2X
C V VV
= × = × = × =× × + × ×
After rounding off: Cs = 5,1 × 10⁴ cfu/ml (or cfp/ml).
When partial (fractional) confirmation, like in the example above, is employed, the resulting confirmed results do not follow the Poisson distribution. The equations for the 95 % CI as in 8.4.2 are not valid [5].
8.4.4 Special cases
8.4.4.1 All plates of the test sample containing less than 10 colonies
Counts from 20 up to the (practical) upper limit of each method are in the optimal precision range. Precision is still acceptable for counts between 10 and 20. Precision decreases rapidly as colony numbers decrease below 10. Depending on the purpose of the test, a lower limit of determination can be defined at a count lower than 10.
According to ISO/TR 13843, the definition of limit of determination is the “lowest average particle concentration x per analytical portion where the expected relative standard uncertainty equals a specified value (RSD)”. RSD is the relative standard deviation, which is calculated by dividing the estimate of the standard deviation s of a population from a sample by the mean x of that sample. Instead of RSD, the symbol w is used for the relative standard deviation. Thus, w = s / x .
In the case of a Poisson distribution, x is calculated by Equation (6):
21xw
= (6)
If w is set at 0,50 (50 %) as the limit of acceptable relative precision (which seems to be reasonable in microbiology), the lower limit of determination will be at the colony number given by
21 4
0,50x = =
Thus results based on counts of less than four should be treated as mere detection of the presence of the organism.
Summarizing:
If all plates contain less than 10 colonies, but the total number of colonies in all available plates together is 4 or more, the result is calculated as given in the general case (8.4.2), but given as an estimated number. If the total is from 3 to 1, the precision of the result is so low that it is advisable to report the result as
organism present in the volume studied.
IS 15188 : 2012ISO 8199 : 2005
13

8.4.4.2 No plates containing any colonies
If the plates from the test sample do not contain any colonies, express the result as follows:
less than 1/Vtot cfu (or cfp) per volume of sample
where Vtot is the calculated total volume of original sample included in the plates enumerated (see 8.4.2).
If preferred, it is also possible to report the result as “zero” or “organism non-detectable”. If this is done, also indicate the volume of sample analysed.
8.4.4.3 More than 200 or 300 colonies with visible typical or confirmed colonies
If the number of all typical and non-typical colonies for all plates containing a first dilution d1 is greater than 200 (in the case of spread plates and membrane filtration) or greater than 300 (in the case of pour plates) with visible typical colonies or confirmed colonies and, if, for all plates of the subsequent dilution d2 containing less than 200 colonies or less than 300 colonies respectively, no typical or confirmed colony can be counted, express the result as follows:
less than 1/d2 cfu (or cfp) per volume of sample and more than 1/d1 cfu (or cfp) per volume of sample
where 1/d1 and 1/d2 are the dilution factors corresponding to dilutions d1 and d2.
EXAMPLE
at the first dilution (10−2): more than 300 colonies on each of the plates, with typical or confirmed colonies present;
at the second dilution (10−3): 33 colonies and 35 colonies, with no typical or confirmed colonies present.
The result is: less than 1 000 cfu (or cfp) per volume of sample and more than 100 cfu (or cfp) per volume of sample.
8.4.4.4 More than 200 or 300 colonies without visible typical or confirmed colonies
If the number of all typical and non-typical colonies for all plates containing a first dilution d1 is greater than 200 (in the case of spread plates and membrane filtration) or greater than 300 (in the case of pour plates) without visible typical colonies or confirmed colonies and, if, for all plates of the subsequent dilution d2 containing less than 200 colonies or less than 300 colonies respectively, no typical or confirmed colony can be counted, express the result as follows:
less than 1/d2 cfu (or cfp) per volume of sample
where 1/d2 is the dilution factor corresponding to dilution d2.
EXAMPLE
at the first dilution (10−2): more than 300 colonies on each of the plates, with no typical or confirmed colonies present;
at the second dilution (10−3): 33 colonies and 35 colonies, with no typical or confirmed colonies present.
The result is: less than 1 000 cfu (or cfp) per volume of sample.
NOTE Where there are many non-typical colonies, the typical colonies may be masked by overgrowth. It may be informative to record this fact.
8.4.4.5 More than 200 or 300 colonies with visible typical or suspect colonies at all dilutions
If the counting of the total number of colonies for each one of the plates for all inoculated dilutions produces a number greater than 200 (in the case of spread plates and membrane filtration) or greater than 300 (in the case of pour plates), and if the number of typical colonies or suspect colonies is greater than 150 (in the case of spread plate and pour plate techniques) or greater than 100 (in the case of membrane filtration), express the results as follows:
IS 15188 : 2012ISO 8199 : 2005
14
Membrane filtration: total number of colonies more than 200/d cfu (or cfp) per volume of sample and number of typical colonies more than 100 × k/n × 1/d cfu (or cfp) per volume of sample
Pour plates: total number of colonies more than 300/d cfu (or cfp) per volume of sample and number of typical colonies more than 150 × k/n × 1/d cfu (or cfp) per volume of sample
Spread plates: total number of colonies more than 200/d cfu (or cfp) per volume of sample and number of typical colonies more than 150 × k/n × 1/d cfu (or cfp) per volume of sample
where
1/d is the dilution factor of the last inoculated dilution;
k is the number of colonies complying with identification or confirmation criteria among the inoculated presumed suspect colonies n.
9 Enumeration by inoculation in liquid media
9.1 Principle
Test portions of the water sample are inoculated into liquid medium to ensure the growth of a particular micro-organism or a group of micro-organisms. The most probable number (MPN) of micro-organisms present in the original sample, and the precision of the estimate, can be calculated by statistical procedures on the basis of the numbers of positive and negative test portions observed after incubation.
9.2 Applications
9.2.1 Test for presence or absence of a micro-organism
After inoculation and incubation of a single test portion of the sample in a tube of liquid medium and the demonstration of the growth of a given micro-organism in it, the only conclusion that can be drawn is the presence, or absence, of the micro-organism in this test volume.
This method can be used as a spot-check of conformity with regulations expressed in terms such as: “absence of … [designation of the micro-organism] in … ml”. It neither predicts the presence or absence of micro-organisms in any other test portions nor permits the concentration of the micro-organism to be quantified.
9.2.2 Estimation of the most probable number (MPN)
The principle of the MPN technique, in most applications, is to inoculate multiple test portions of the same sample and/or dilutions of it into tubes of liquid culture medium.
It is assumed that, on incubation, each tube that received one or more organism(s) in the inoculum will show growth, with or without a characteristic change produced in the medium. Provided some of the tubes give positive and some give negative results, the most probable number (MPN) of organisms in a specified volume of the sample can be estimated from the number and distribution of tubes showing a positive reaction.
Make a choice from among the various MPN configurations (see 9.3.3) available according to the expected number of organisms in the sample under investigation, regulatory requirements, the precision needed and any other practical considerations. The precision depends on the number of positive test portions observed in a roughly similar way as the precision of a colony count depends on the number of colonies. Precision increases as a function of the square root of the number of tubes used. The number of tubes has to be quadrupled to double the precision. With systems which use only few replicate tubes, the precision is low. On the other hand, with these systems, sensitivity, which depends on the total volume examined, is generally sufficient for practical purposes. Easy interpretation of positive results is a distinctive advantage of most MPN techniques.
IS 15188 : 2012ISO 8199 : 2005
15

9.3 Procedure
9.3.1 General
The choice of the actual MPN enumeration procedure depends on factors similar to those mentioned in 8.2.2 and the following guidance is given on the procedure most applicable.
9.3.2 Test portion
Addition of the test portion should not change the composition of the medium such that significant interference occurs to the growth of the micro-organisms sought. Test portion volumes of less than, or equal to, 1 ml are normally added to five or more times the volume of single-strength media. Test portions between 1 ml and 100 ml are normally added to equal volumes of double-strength media, provided that the sample does not contain an excessive amount of inorganic salts, nutrients or toxic substances that could affect bacterial growth. Liquid culture methods generally tolerate a high amount of suspended solids.
For volumes greater than 100 ml, more concentrated media can be used. For special purposes, sterile dehydrated media can be dissolved in the cold (or prewarmed at 30 °C) sample to be analysed.
The disadvantages of the presence of high concentrations of minerals or toxic substances can be overcome by separating the micro-organisms from the water sample. This may be carried out by membrane filtration as described in 8.2.5 or, if the water is turbid, by addition to the sample of a filter-aid such as diatomaceous earth or a suspension of aluminium oxide. These filter aids settle out, carrying micro-organisms with them; separation is then completed by centrifugation or filtration. The membranes, diatomaceous earth or aluminium oxide are then placed in the liquid culture medium.
9.3.3 Choice of inoculation system
When the expected concentration of micro-organisms is small or expected to vary only moderately, the most appropriate inoculation system is a single series of equal test portions. Where the expected ratio between the maximum and minimum number of micro-organisms is less than about twenty-five, ten parallel test portions is the smallest number expected to function; with fifty parallel tubes, a ratio of two hundred is the limit. Examples of single-dilution MPNs are given in Annex B, Tables B.1 to B.4.
When the sample is unknown or if great variation is anticipated, it may be necessary to inoculate series of tubes from several dilutions. Inoculate a sufficient number of dilutions to ensure a system with both positive and negative results. The number of dilutions depends also on the method available for estimating the MPN value. If tables need to be used, then results from three dilutions must be available and the configurations of the systems are restricted to those available in tables. With computer programmes, the numbers of dilutions and parallel tubes are unrestricted.
The most commonly applied MPN system uses only three or five parallel tubes per dilution. The systems, especially the 3-tube design, are of such low precision that their results are hardly more than indications of the order of magnitude of the concentration. The use of five or more parallel tubes is recommended. Examples of a 3-tube MPN and a 5-tube MPN are given in Annex B, Tables B.5 and B.6, respectively.
In “non-symmetrical” systems, the different dilution levels do not have the same number of tubes. These systems are used only to estimate numbers of micro-organisms within a well-defined range. Examples are shown in Annex B, Tables B.7, B.8 and B.9.
As an alternative to the inoculation of tubes, a multiwell plate (or anything comparable) can be used where the “wells” represent the tubes. The advantage of using a multiwell plate is the fact that a large number of wells can easily be inoculated (e.g. three successive dilutions, each inoculated into 32 wells). The precision of the outcome of a multiwell MPN approximates to the precision of a plate count or a membrane filtration count. The disadvantage of the use of a multiwell plate is the fact that only small volumes can be inoculated (typically 0,2 ml per well). However, this also depends on the size of the multiwell plates and the size of the wells. Multiwell plates with 12 × 5 ml wells, 24 × 3 ml wells and 48 × 1 ml wells are available. An increase in the size of the wells will in general result in a decrease in the number of wells and thus a decrease in precision of the
IS 15188 : 2012ISO 8199 : 2005
16
final result. For the calculation of the MPN from multiwell plates, special MPN tables and/or computer programmes are available. Examples can be found in ISO 7899-1 and ISO 9308-3.
9.3.4 Inoculation in liquid medium
Using an aseptic procedure, place a measured volume of the water sample in a bottle or flask and/or place dilutions of it in corresponding sets of tubes of liquid medium for the dilution system chosen (see 9.3.3). Alternatively, if preliminary filtration or sedimentation has been necessary, transfer the membrane, diatomaceous earth or sediment, or portions thereof, to the flask and/or corresponding sets of tubes of medium.
9.3.5 Incubation
Place the inoculated tubes in either an incubator or a water bath. Choose the duration and the temperature of incubation after consulting a standard method, as they depend on the micro-organism or group of micro-organisms sought.
For some micro-organisms, a two-stage incubation procedure may be specified as indicated in 8.2.6.
9.4 Interpretation of results
After incubation, count and record the number of positive results in each set of tubes.
The characteristics which distinguish positive from negative reactions vary with each micro-organism or group of micro-organisms and with the culture medium used.
The occurrence of positive results does not always permit the conclusion that the micro-organism sought is actually present. Confirmatory tests may therefore be necessary using one of the following methods:
a) subculture to a selective isolation medium, followed by biochemical, serological or other tests to identify suspect colonies;
b) subculture to another liquid medium, subsequent direct examination of which can sometimes provide confirmation with an acceptable degree of probability, or from which organisms can be isolated and subsequently identified;
c) subculture to a non-selective agar medium for purity and to obtain single colonies, which can be further identified.
These confirmatory procedures enable true positive results to be identified and used for determination of the MPN values. To conclude on the confirmation results, it is necessary to be able to trace the confirmation test result to the presumptive positive tube (at least to the dilution level).
9.5 Determination of MPN values
9.5.1 Principle
There are three basic ways of determining the MPN value:
a) mathematical equations;
b) tables;
c) computer programmes.
IS 15188 : 2012ISO 8199 : 2005
17

9.5.2 Mathematical equations
9.5.2.1 Approximate equation for all cases
Approximate MPN values for any number of dilutions and parallel tubes may be derived by application of the following equation adapted from Thomas [7]:
pos s
neg totMPN
n V
V V
×=
× (7)
where
npos is the number of tubes with a positive reaction;
Vs is the sample reference volume in the original sample, in ml;
Vneg is the total volume, in ml, of sample in all tubes with a negative reaction;
Vtot is the total volume, in ml, of sample in all tubes.
The MPN value is expressed per sample reference volume, in ml.
9.5.2.2 “Exact” solution for one series of tubes
The MPN value for a single series of tubes may be derived from Equation (8):
s
tube posMPN lnV n
V n n
= −
(8)
where
Vs is the sample reference volume in the original sample, in ml;
Vtube is the volume, in ml, of sample in each tube of the series;
ln is the natural logarithm;
n is the number of tubes in the series;
npos is the number of tubes with a positive reaction.
9.5.3 MPN tables
9.5.3.1 General
In Annex B, some examples are given of MPN tables for single-dilution MPNs (Tables B.1 to B.4), symmetrical series of multiple tubes (Tables B.5 and B.6) and non-symmetrical series of multiple tubes (Tables B.7, B.8 and B.9).
9.5.3.2 Tables for one set of single-dilution parallel test portions
Tables B.1 to B.4 in Annex B give the MPN values and the 95 % confidence intervals per test portion for 10, 15, 20, and 25 parallel tubes [each tube is inoculated with the same (single) dilution]. To express the outcome per sample reference volume, the MPN and the 95 % limit values are multiplied by the ratio: (reference volume)/(test portion volume). The logarithmic standard uncertainty shall not be multiplied. The reference
IS 15188 : 2012ISO 8199 : 2005
18

volume in water microbiology is usually 100 ml. The test portion volume is e.g. 1 ml or whatever volume is transferred into the tube.
EXAMPLE (from Reference [4])
Twenty tubes of double-strength broth have been inoculated with 5 ml aliquots of a liquid sample. After incubation, 16 of the tubes show visible growth. What was the most probable bacterial density (organisms per 100 ml) of the sample? Table B.3 gives 1,61 as the most probable number of organisms per tube. As each tube received 5 ml of the sample, the most probable density of organisms in 100 ml of sample was: (1,61/5 ml) × 100 ml = 32 per 100 ml.
9.5.3.3 Tables for several dilutions
A limited supply of tables is available in the literature. A selection is reproduced in Annex B.
With symmetrical systems, the most common approach is to choose three successive sets of tubes with some positive and some negative results (see below). Record the number of positive results for each set of tubes and, from the MPN table for the inoculation system used, read the most probable number of organisms present in the reference volume of the sample. Tables B.5 and B.6 represent the symmetrical systems of, respectively, (3 or 5) × 10 ml + (3 or 5) × 1 ml + (3 or 5) × 0,1 ml and has been constructed assuming the reference volume to be 100 ml. This is the MPN system traditionally employed in water (and food) analysis.
With non-symmetrical systems, however, all tubes have to be taken into account. Tables B.7, B.8 and B.9 in Annex B represent the “non-symmetrical” systems: 1 × 50 ml + 5 × 10 ml, 5 × 100 ml + 1 × 10 ml + 1 × 1 ml, and 1 × 50 ml + 5 × 10 ml + 5 × 1 ml, respectively.
With several volumes or dilutions of the sample, apply the following rules, mainly based on the rules by Taylor [6], when looking up results in Table B.6 or in other tables of symmetrical MPN systems:
a) if a series of more than three dilutions has been used, select the largest sample volume giving all negative results and the smallest sample volume giving all positive results, and all dilutions in between;
b) if application of rule a) leaves only three dilutions, the corresponding MPN value is sought in Table B.6 [see b) in Table 1];
c) if application of rule a) leaves four dilutions, the MPN estimate is sought for both sets of three dilutions and, taking the difference in dilution levels into account, the geometric mean of the two estimates is given as the MPN value [see c) in Table 1];
d) if application of rule a) leaves only two dilutions, choose the sets of three dilutions to contain an additional full set of positive results, if available [see d) in Table 1];
e) if application of rule a) leaves more than four dilutions, the statistical assumptions underlying the MPN estimate are not fulfilled and no result shall be given (this rule does not apply with dilution factors smaller than 10);
f) if only one set of tubes gives one or two positive results, use this dilution together with the one higher dilution and one lower dilution [see f) in Table 1].
IS 15188 : 2012ISO 8199 : 2005
19

Table 1 — Examples of the derivation of MPN from the numbers of positive results in sets of five tubes using Table B.6
Volume of sample in test portion, ml Example in text
10 1 0,1 0,01 0,001 MPN per 100 ml
b) 5 5a 2a 0a 0 490
b) 3a 1a 0a 0 11
c) 5 5a 3a 2a 0a
c)1 5 3 3 180
c)2 3 3 0 170
Geometric mean of c)1 and c)2
175
d) 5a 5a 0a 0 0 240
f) 0a 1a 0a 0 2
a Result that should be used to determine the MPN values.
Table B.6 shows results for those combinations of positive and negative tubes that are most likely to be encountered. If the observed combination of positive and negative tubes does not appear in Table B.6, reject the result. Even though the approximate equation in 9.5.2.1 and the computer programmes (see 9.5.4) permit determination of the MPN for sets not included in Table B.6, they are too unlikely and should not be reported.
9.5.4 Computer programmes
The most versatile computer programmes pose no restrictions regarding numbers of dilutions and parallel tubes or symmetry of the MPN system. For instance, Hurley and Roscoe [2] give the MPN estimate, the standard uncertainty (standard error) of lg MPN (lg means log10), the 95 % confidence interval and an evaluation of the statistical reliability of the set of numbers.
9.6 Precision estimates
9.6.1 General
The published tables give the precision in the form of 95 % confidence limits. Computer programmes may additionally provide the standard uncertainty of lg MPN.
9.6.2 Single-dilution assays
When tables or a computer programme are unavailable, the 95 % confidence limits of the MPN estimate can be estimated approximately using Equation (9):
s
tube neg negneg
ln( )
2
V nxV n n n
nn
= − ±
(9)
where
x is the upper or lower 95 % confidence limit;
Vs is the sample reference volume in the original sample, in ml;
IS 15188 : 2012ISO 8199 : 2005
20

Vtube is the volume, in ml, of sample in each tube of the series;
ln is the natural logarithm;
n is the number of tubes in the series;
nneg is the number of tubes with a negative reaction.
The plus sign is connected with the lower limit and the minus sign with the upper limit. The approximation is not very good when most of the tubes are negative (sterile) but improves as the proportion of positive tubes increases.
9.6.3 Symmetrical multiple-dilution assays
In cases where computer solutions or tables are unavailable, the logarithmic standard uncertainty of a symmetrical multiple-dilution MPN system can be obtained from Cochran's [1] approximate equation given below:
lg (lg MPN) 0,58xfsn
= (10)
where
xs is the standard error;
lg is the common (decimal) logarithm (log10);
f is the dilution factor between consecutive dilutions;
n is the number of tubes per dilution.
The 95 % confidence limits can be approximated by multiplying and dividing the MPN estimate by the antilogarithm of 2 xs× (lg MPN). This procedure tends to exaggerate the upper confidence limit.
IS 15188 : 2012ISO 8199 : 2005
21

Annex A (informative)
Criteria for the choice of enumeration technique
A.1 Introduction
Most culturable micro-organisms in water can be enumerated by any of the four main procedures described in Clauses 8 and 9. The factors affecting the choice of procedure may be classified as follows:
a) those concerned with the quality of the results (see A.2);
b) those concerned with the nature of the sample (see A.3);
c) those concerned with the cost of the analyses (see A.4).
This Annex will give a general overview. More detailed information can be found elsewhere, e.g. in ISO/TR 13843.
A.2 Factors concerning the quality of the result
A.2.1 General
The quality of results obtained from any test can be defined in terms of the following characteristics: uncertainty of measurement, accuracy (including trueness and precision) and limit of detection.
A.2.2 Uncertainty of measurement
No measurement is perfect. It has an associated uncertainty arising from many factors including errors and imperfect reproducibility. Ideally each measurement should be quoted with an indication of the uncertainty, often as a ± figure, so that decisions based on the measurement are fully informed.
ISO/TR 13843 gives the following information on uncertainty:
Definition: uncertainty (of counting) is the relative standard deviation of results of repeated counting of the colonies or particles of the same plate(s) or field(s) under stipulated conditions.
EXAMPLE Stipulated conditions may be e.g. the same person or different persons in one laboratory, or different laboratories.
A.2.3 Accuracy
A.2.3.1 Principle
According to ISO/TR 13843, the accuracy of measurement is defined as the closeness of the agreement between a test result and the accepted reference value. According to Lightfoot and Maier [3], the accuracy is inversely related to the overall uncertainty of measurement, i.e. the difference between the measurement and the true value. The overall uncertainty of a single measurement is thought to consist of two types of component: systematic (i.e. bias) and random (imprecision), as follows:
Uncertainty = Bias + Imprecision
IS 15188 : 2012ISO 8199 : 2005
22
This is a simplification of the situation. In microbiology, there are usually also contributions to uncertainty that do not fit this classification — unexpected fluctuations that cannot be modelled mathematically. The inverse of bias is the trueness of the method. It is a characteristic of the method used for the analysis and also depends on the nature of the sample. Trueness is not related to errors in applying the method in individual laboratories. These are included in the random error of the measurement, introduced by variations between laboratories or within a single laboratory. The inverse of random error is the precision. Hence, the same relation as above is more commonly expressed as:
Accuracy = Trueness + Precision
A.2.3.2 Trueness
A.2.3.2.1 General
According to ISO 3534-1, the definition of trueness is: the closeness of agreement between the average value obtained from a large series of test results and an accepted value. ISO 3534-1 also indicates that the measure of trueness is usually expressed in terms of bias, where the definition of bias is: the difference between the expectation of the test results and an accepted reference value.
In general for microbiological analyses, the true concentration of a component is not known and can only be used as a hypothetical aim. The systematic error can therefore not be established in an absolute manner. It can theoretically be approached by studying the same sample repeatedly, using different methods. Because microbiological methods are destructive in nature (i.e. the sample is lost during analysis) this requires well mixed test materials with randomly distributed bacteria and/or a large group of laboratories (see Reference [3]).
Errors can be quantitative or qualitative. Quantitative errors occur, for example, when the micro-organisms enumerated do indeed belong to the group sought, but the result of the final enumeration underestimates the true number. Qualitative errors occur, for example, when a number of micro-organisms not belonging to the group sought are considered and counted as such, so that the final value is greater than the true value. Both types of error can occur simultaneously.
A.2.3.2.2 Quantitative errors
Some errors are independent of the enumeration procedure. In the presence of suspended particles, the micro-organisms may be adsorbed and become inseparable despite vigorous agitation; this invalidates the assumption that the formation of one colony or turbidity in broth inoculated with a small volume of the sample derives from a single micro-organism.
The action of a selective medium may be excessively inhibitory and thus interfere with the growth of not only the accompanying micro-organisms, but also the micro-organisms to be enumerated.
Other errors are attributable to the nature of the water sample. Physico-chemical constituents such as toxic substances or high concentrations of salts can affect the culture medium and thus inhibit growth. The effect is particularly important when the volumes of test portion used are large compared with the volume of the medium (e.g. MPN procedures in which double- or multiple-strength media are used, or a dehydrated medium dissolved in the sample to be analysed). Membrane filtration, which separates the micro-organisms from the sample, may overcome this problem, provided inhibiting substances are not retained on the membrane.
Biological constituents, such as the accompanying micro-flora, can, through biological competition, interfere with the development of the micro-organisms sought. This effect occurs especially in liquid media. In other procedures where the micro-organisms form colonies separate from each other, this biological competition is limited, provided there is no spreading or overcrowding.
A.2.3.2.3 Qualitative errors
Qualitative errors occur when there are differences between the definition of the micro-organisms sought and the identity of those isolated. When the definition is precise, as with the individual members of a genus or
IS 15188 : 2012ISO 8199 : 2005
23

species, it is exceptional for a single observation to give accurate final results, and it is often impracticable to carry out all the further tests required for identification.
It is therefore important that the inoculation procedures and the media used should yield as much diagnostic information as possible.
A.2.3.3 Precision
According to ISO 3534-1 and ISO/TR 13843, the definition of precision is: the closeness of agreement between independent test results obtained under stipulated conditions. ISO 3534-1 also indicates that the measure of precision is usually expressed in terms of imprecision and computed as a standard deviation of the test results. Less precision is reflected by a larger standard deviation.
General principles for the characterization of the precision of test methods have been described in ISO 5725-1 and in ISO 16140. Two measures of precision are described: repeatability and reproducibility. The definitions are as follows:
Repeatability (r): the closeness of agreement between mutually independent test results obtained with the same method on identical test material in the same laboratory by the same operator using the same equipment within short intervals of time.
Reproducibility (R): the closeness of agreement between test results obtained with the same method on identical test material in different laboratories with different operators using different equipment.
In microbiology, truly identical test material cannot be supplied. A random distribution of the micro-organisms is the best possible objective, and the degree to which this is reached is critical for establishing r and R. Any over-dispersion in the test materials will add to the variability of the test results.
Numerous factors affect precision but only those connected with the random distribution of micro-organisms in the samples are discussed in this International Standard.
Random distribution of the micro-organisms in a sample causes imprecision in the results; this can be reduced by the use of a suitable inoculation system.
With the MPN procedure, the precision is increased by increasing the number of replicate tubes inoculated with each series of test portion volumes. The relative precision depends on the pattern of positive results obtained.
With the colony-count procedure, precision depends on the total number of colonies and therefore increases as the number of plates or membranes cultured increases. Precision also increases as the number of colonies increases up to a maximum of about 150 (typical) colonies per plate for plate count and about 100 (typical) colonies per plate for membrane filtration.
A.2.4 Limit of detection
A.2.4.1 Principle
In contrast to chemical analyses where limit of detection is related to the true value, in microbiology the limit of detection is dependent on the method.
The limit of detection of a procedure can be considered either as the volume in which a single micro-organism sought can be detected, or the smallest detectable number of micro-organisms contained in a given volume of water, generally 1 ml or 100 ml. According to ISO/TR 13843, the limit of detection is defined as the particle number x (per analytical portion) for which the probability p0 of a negative result equals 5 %.
IS 15188 : 2012ISO 8199 : 2005
24

A.2.4.2 Limit of detection of colony-count procedures
The limit of detection corresponds to the development of one colony in the test portion. It therefore depends on the volume of sample inoculated.
There is, however, a limitation imposed by other accompanying micro-organisms in the sample which are able to grow in the same test conditions as the micro-organism to be enumerated. If they are numerous, they can overgrow the cultures. For example, on a membrane where no more than about 100 colonies can be accepted, the limit of detection will be reduced if the number of accompanying colonies is more than 100 times greater than the number of colonies sought. In such cases, and in the absence of satisfactory selective media, the MPN procedure may be preferable.
In practice, the limits of detection are as follows:
a) with membrane filtration, it is possible in the case of clean water to filter large volumes of the sample without difficulty, thus giving a limit of detection of one organism in the volume filtered;
b) with the pour plate procedure, a volume of 5 ml is about the maximum volume that can be inoculated, giving a limit of detection of one micro-organism in 5 ml (the limit of detection can be improved by increasing the number of test portions used, but in practice inoculation of more than 5 plates is impractical and the limit of detection is therefore one micro-organism in 25 ml);
c) with the spread plate procedure, the maximum volume of sample usually used is 0,2 ml for each plate, and thus the limit of detection with 5 plates inoculated is one micro-organism per ml. With dry medium (but see 8.2.4.2 on the effects of over-drying agar plates), test portions of 0,5 ml may be used for each plate, thus giving a limit of detection of one micro-organism in 2,5 ml when 5 plates are inoculated.
A.2.4.3 Limit of detection with the MPN procedure
The limit of detection depends on the volume of the sample actually examined. Increasing the total volume examined will therefore improve the limit of detection. With the MPN procedure, this may be achieved either by increasing the number of tubes used for each dilution, or by increasing the test portion volumes for each tube, or by using concentration by filtration.
A.3 Requirements concerning the nature of the sample
A.3.1 Nature of the micro-organisms
In addition to the micro-organisms to be detected, growth of other micro-organisms in the same culture may also influence the choice of method.
For example, certain micro-organisms are strict aerobes and their detection may be carried out by the surface spread or membrane filtration technique. Other micro-organisms tolerate, and sometimes prefer, a certain degree of anaerobiosis and the pour plate technique (see 8.2.3) is preferable. If greater anaerobiosis is required to eliminate strict aerobes, deep tubes of medium may be used.
Certain micro-organisms cannot withstand the thermal shock resulting when the sample is mixed with melted agar at (45 ± 1) °C, and the pour plate procedure should therefore be avoided for their enumeration; this applies to numerous bacteria in lakes and other surface waters. However, to detect in such waters micro-organisms which normally live at a higher temperature and have greater resistance to thermal shock, the pour plate technique has some selective advantage.
A.3.2 Constituents of water
Suspended matter causes interference, particularly in the membrane filtration procedure; clogging of the membrane limits filtration and, for this reason, the sensitivity of the method. Partial clogging, sometimes unsuspected, can reduce nutrient exchange and prevent organisms on the membrane from forming colonies.
IS 15188 : 2012ISO 8199 : 2005
25
This blockage may often be caused by living organisms, including micro-plankton or even bacteria that multiply in the pores.
Sometimes large particles can be confused with colonies in the pour plate procedure.
For very turbid waters, the MPN procedure may sometimes be the only one that can be used, if, as is often the case, the spread plate technique does not provide sufficient sensitivity.
Soluble substances may interfere with the growth of micro-organisms either by modifying the composition of the selected culture medium, or because of their toxicity. This interference occurs in particular when the volume of the sample is relatively large in relation to that of the medium to be used (see 9.3.2). Sometimes substances in the sample can react with constituents of the culture medium and adversely affect the characteristic reactions of the micro-organisms sought, without interfering with their growth, through the formation of a fermentable sugar not present in the original medium, followed by a change in pH value due to fermentation of this sugar. Membrane filtration can overcome such disadvantages.
A.4 Financial requirements
Comparison of the cost of these different procedures is fairly difficult, and often dependent on local conditions. Nevertheless, knowledge of such cost factors may facilitate the choice of the method to be adopted.
IS 15188 : 2012ISO 8199 : 2005
26

Annex B (informative)
MPN tables
Table B.1 — MPN values per test portion and 95 % confidence limits for a series of 10 tubes calculated according to Hurley and Roscoe [2]
Series of 10 tubes
95 % limits Number of positive tubes MPN Standard uncertainty of lg MPN
lower upper
1 0,11 0,435 0,02 0,75
2 0,22 0,308 0,06 0,89
3 0,36 0,252 0,11 1,11
4 0,51 0,220 0,19 1,38
5 0,69 0,198 0,28 1,69
6 0,92 0,184 0,40 2,10
7 1,20 0,174 0,55 2,64
8 1,61 0,171 0,75 3,48
9 2,30 0,179 1,03 5,16
Table B.2 — MPN values per test portion and 95 % confidence limits for a series of 15 tubes calculated according to Hurley and Roscoe [2]
Series of 15 tubes
95 % limits Number of positive tubes MPN Standard uncertainty of lg MPN
lower upper
1 0,07 0,434 0,01 0,49
2 0,14 0,307 0,04 0,57
3 0,22 0,251 0,07 0,69
4 0,31 0,218 0,12 0,83
5 0,41 0,196 0,17 0,98
6 0,51 0,179 0,23 1,15
7 0,63 0,167 0,30 1,33
8 0,76 0,157 0,37 1,55
9 0,92 0,150 0,47 1,80
10 1,10 0,144 0,57 2,11
11 1,32 0,141 0,70 2,49
12 1,61 0,139 0,86 3,02
13 2,01 0,142 1,06 3,82
14 2,71 0,155 1,35 5,45
IS 15188 : 2012ISO 8199 : 2005
27

Table B.3 — MPN values per test portion and 95 % confidence limits for a series of 20 tubes calculated according to Hurley and Roscoe [2]
Series of 20 tubes
95 % limits Number of positive tubes MPN Standard uncertainty of lg MPN
lower upper
1 0,05 0,434 0,01 0,36
2 0,11 0,307 0,03 0,42
3 0,16 0,251 0,05 0,50
4 0,22 0,218 0,08 0,60
5 0,29 0,195 0,12 0,69
6 0,36 0,178 0,16 0,80
7 0,43 0,165 0,20 0,91
8 0,51 0,155 0,25 1,03
9 0,59 0,147 0,31 1,16
10 0,69 0,140 0,37 1,30
11 0,80 0,134 0,44 1,46
12 0,92 0,130 0,51 1,65
13 1,05 0,126 0,59 1,85
14 1,20 0,123 0,69 2,10
15 1,39 0,121 0,80 2,40
16 1,61 0,121 0,93 2,77
17 1,90 0,122 1,09 3,29
18 2,30 0,127 1,30 4,08
19 3,00 0,141 1,58 5,67
IS 15188 : 2012ISO 8199 : 2005
28

Table B.4 — MPN values per test portion and 95 % confidence limits for a series of 25 tubes calculated according to Hurley and Roscoe [2]
Series of 25 tubes
95 % limits Number of positive tubes MPN Standard uncertainty of lg MPN
lower upper
1 0,04 0,434 0,01 0,29
2 0,08 0,307 0,02 0,33
3 0,13 0,251 0,04 0,40
4 0,17 0,217 0,07 0,47
5 0,22 0,195 0,09 0,54
6 0,27 0,178 0,12 0,61
7 0,33 0,165 0,16 0,69
8 0,39 0,154 0,19 0,77
9 0,45 0,146 0,23 0,86
10 0,51 0,139 0,27 0,96
11 0,58 0,133 0,32 1,06
12 0,65 0,128 0,37 1,16
13 0,73 0,123 0,42 1,28
14 0,82 0,119 0,48 1,41
15 0,92 0,116 0,54 1,55
16 1,02 0,113 0,61 1,70
17 1,14 0,111 0,69 1,88
18 1,27 0,109 0,78 2,09
19 1,43 0,108 0,88 2,33
20 1,61 0,108 0,99 2,62
21 1,83 0,109 1,12 2,99
22 2,12 0,111 1,29 3,50
23 2,53 0,117 1,49 4,28
24 3,22 0,123 1,77 5,85
IS 15188 : 2012ISO 8199 : 2005
29
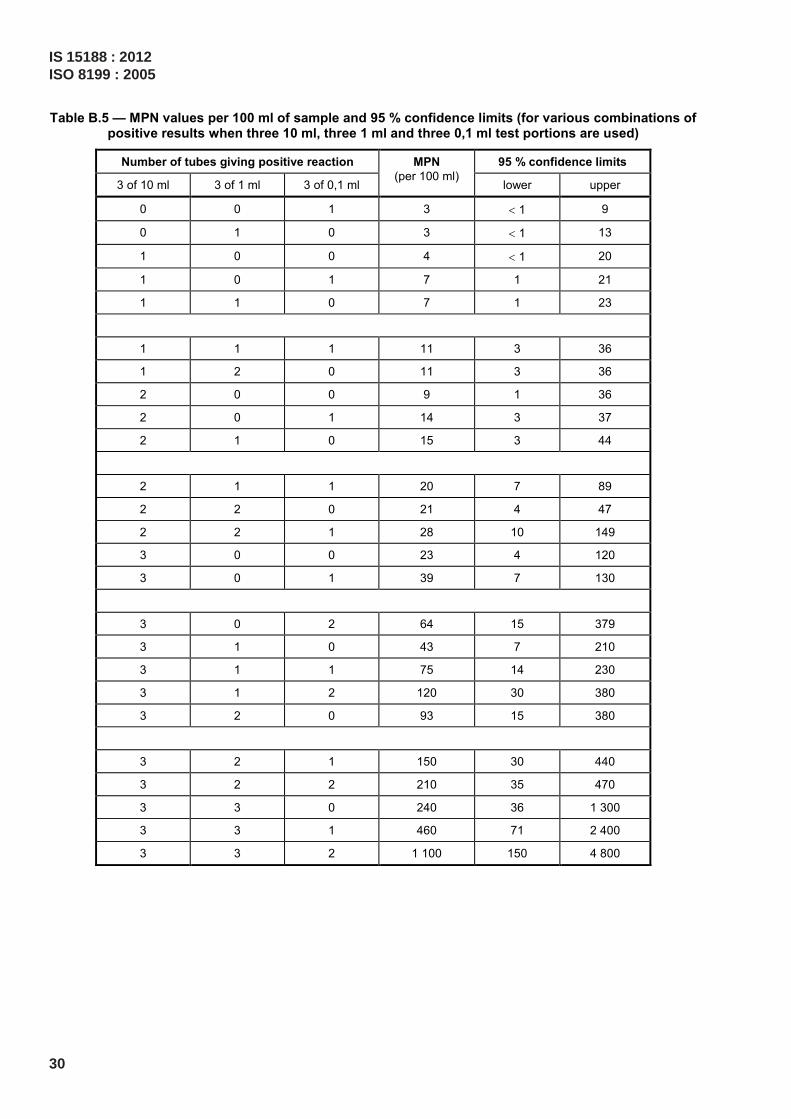
Table B.5 — MPN values per 100 ml of sample and 95 % confidence limits (for various combinations of positive results when three 10 ml, three 1 ml and three 0,1 ml test portions are used)
Number of tubes giving positive reaction 95 % confidence limits
3 of 10 ml 3 of 1 ml 3 of 0,1 ml
MPN (per 100 ml)
lower upper
0 0 1 3 < 1 9
0 1 0 3 < 1 13
1 0 0 4 < 1 20
1 0 1 7 1 21
1 1 0 7 1 23
1 1 1 11 3 36
1 2 0 11 3 36
2 0 0 9 1 36
2 0 1 14 3 37
2 1 0 15 3 44
2 1 1 20 7 89
2 2 0 21 4 47
2 2 1 28 10 149
3 0 0 23 4 120
3 0 1 39 7 130
3 0 2 64 15 379
3 1 0 43 7 210
3 1 1 75 14 230
3 1 2 120 30 380
3 2 0 93 15 380
3 2 1 150 30 440
3 2 2 210 35 470
3 3 0 240 36 1 300
3 3 1 460 71 2 400
3 3 2 1 100 150 4 800
IS 15188 : 2012ISO 8199 : 2005
30
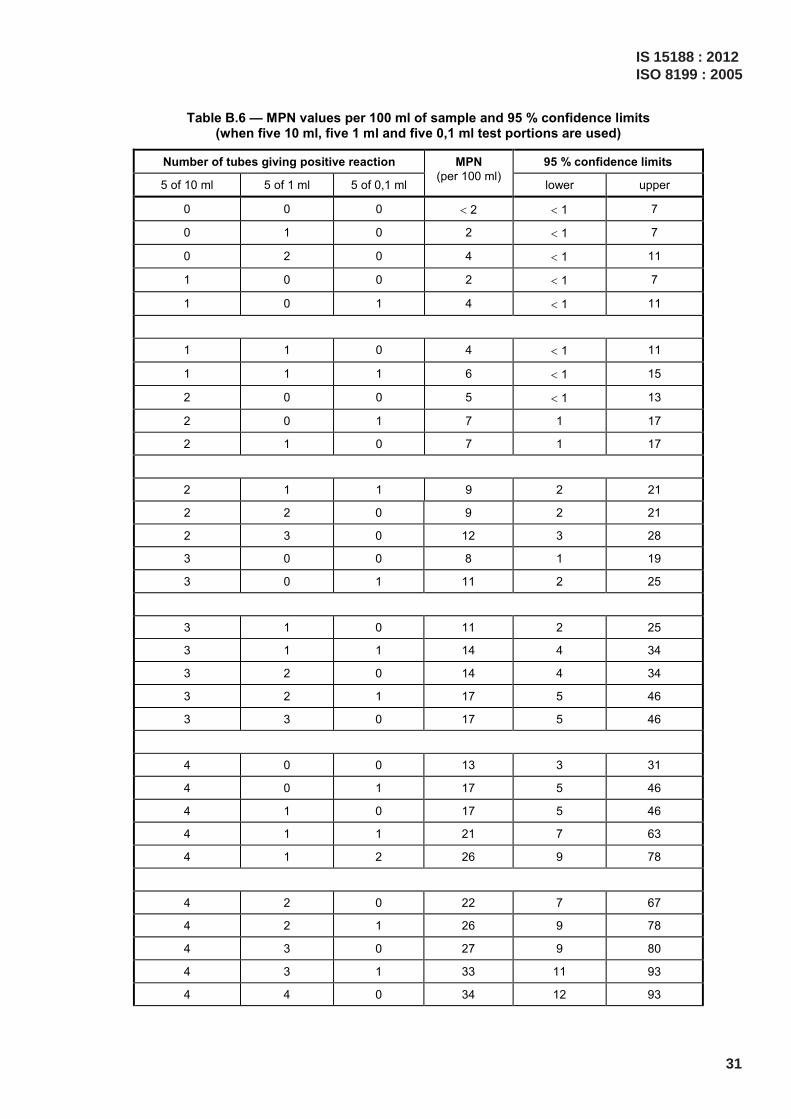
Table B.6 — MPN values per 100 ml of sample and 95 % confidence limits (when five 10 ml, five 1 ml and five 0,1 ml test portions are used)
Number of tubes giving positive reaction 95 % confidence limits
5 of 10 ml 5 of 1 ml 5 of 0,1 ml
MPN (per 100 ml)
lower upper
0 0 0 < 2 < 1 7
0 1 0 2 < 1 7
0 2 0 4 < 1 11
1 0 0 2 < 1 7
1 0 1 4 < 1 11
1 1 0 4 < 1 11
1 1 1 6 < 1 15
2 0 0 5 < 1 13
2 0 1 7 1 17
2 1 0 7 1 17
2 1 1 9 2 21
2 2 0 9 2 21
2 3 0 12 3 28
3 0 0 8 1 19
3 0 1 11 2 25
3 1 0 11 2 25
3 1 1 14 4 34
3 2 0 14 4 34
3 2 1 17 5 46
3 3 0 17 5 46
4 0 0 13 3 31
4 0 1 17 5 46
4 1 0 17 5 46
4 1 1 21 7 63
4 1 2 26 9 78
4 2 0 22 7 67
4 2 1 26 9 78
4 3 0 27 9 80
4 3 1 33 11 93
4 4 0 34 12 93
IS 15188 : 2012ISO 8199 : 2005
31

Table B.6 (continued)
Number of tubes giving positive reaction 95 % confidence limits
5 of 10 ml 5 of 1 ml 5 of 0,1 ml
MPN (per 100 ml)
lower upper
5 0 0 23 7 70
5 0 1 31 11 89
5 0 2 43 15 110
5 1 0 33 11 93
5 1 1 46 16 120
5 1 2 63 21 150
5 2 0 49 17 130
5 2 1 70 23 170
5 2 2 94 28 220
5 3 0 79 25 190
5 3 1 110 31 250
5 3 2 140 37 340
5 3 3 180 44 500
5 4 0 130 35 300
5 4 1 170 43 490
5 4 2 220 57 700
5 4 3 280 90 850
5 4 4 350 120 1 000
5 5 0 240 68 750
5 5 1 350 120 1 000
5 5 2 540 180 1 400
5 5 3 920 300 3 200
5 5 4 1 600 640 5 800
5 5 5 > 1 800 — —
IS 15188 : 2012ISO 8199 : 2005
32

Table B.7 — MPN values per 100 ml of sample and 95 % confidence limits (when one 50 ml and five 10 ml test portions are used)
Number of tubes giving positive reaction 95 % confidence limits
1 of 50 ml 5 of 10 ml
MPN (per 100 ml)
lower upper
0 0 < 1
0 1 1 < 1 4
0 2 2 < 1 6
0 3 4 < 1 11
0 4 5 1 13
0 5 7 2 17
1 0 2 < 1 6
1 1 3 < 1 9
1 2 6 1 15
1 3 9 2 21
1 4 16 4 40
1 5 > 18
IS 15188 : 2012ISO 8199 : 2005
33

Table B.8 — MPN values per 100 ml of sample and 95 % confidence limits (when five 100 ml, one 10 ml and one 1 ml test portions are used)
Number of tubes giving positive reaction 95 % confidence limits
5 of 100 ml 1 of 10 ml 1 of 1 ml
MPN (per 100 ml)
lower upper
1a < 1 < 1 1
0 1 0 < 1 < 1 1
1 0 0 < 1 < 1 1
1 1 0 < 1 < 1 2
2a < 1 < 1 2
2 0 0 < 1 < 1 2
2 1 0 < 1 < 1 2
3a < 1 < 1 3
3 0 0 < 1 < 1 3
3 0 1 1 < 1 3
3 1 0 1 < 1 4
4a 2 < 1 5
4 0 0 2 < 1 5
4 0 1 2 < 1 6
4 1 0 2 < 1 6
5 0 0 4 2 36
5 0 1 10 3 54
5 1 0 20 10 380
a These results are expressed for the case where only one level with 5 tubes is used.
IS 15188 : 2012ISO 8199 : 2005
34

Table B.9 — MPN values per 100 ml of sample and 95 % confidence limits (when one 50 ml, five 10 ml and five 1 ml test portions are used)
Number of tubes giving positive reaction 95 % confidence limits
1 of 50 ml 5 of 10 ml 5 of 1 ml
MPN (per 100 ml)
lower upper
0 0 0 < 1
0 0 1 1 < 1 4
0 0 2 2 < 1 6
0 1 0 1 < 1 4
0 1 1 2 < 1 6
0 1 2 3 < 1 8
0 2 0 2 < 1 6
0 2 1 3 < 1 8
0 2 2 4 < 1 11
0 3 0 3 < 1 8
0 3 1 5 < 1 13
0 4 0 5 < 1 13
1 0 0 1 < 1 4
1 0 1 3 < 1 8
1 0 2 4 < 1 11
1 0 3 6 < 1 15
1 1 0 3 < 1 8
1 1 1 5 < 1 13
1 1 2 7 1 17
1 1 3 9 2 21
1 2 0 5 < 1 13
1 2 1 7 1 17
1 2 2 10 3 23
1 2 3 12 3 28
1 3 0 8 2 19
IS 15188 : 2012ISO 8199 : 2005
35
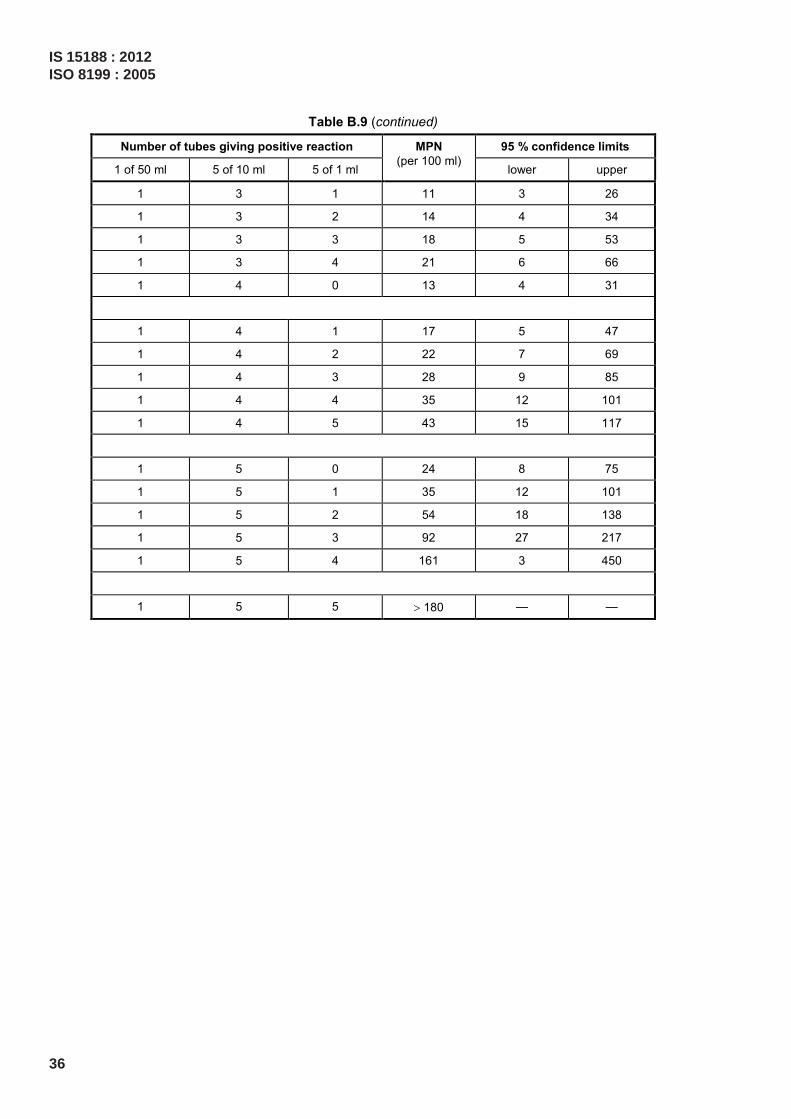
Table B.9 (continued)
Number of tubes giving positive reaction 95 % confidence limits
1 of 50 ml 5 of 10 ml 5 of 1 ml
MPN (per 100 ml)
lower upper
1 3 1 11 3 26
1 3 2 14 4 34
1 3 3 18 5 53
1 3 4 21 6 66
1 4 0 13 4 31
1 4 1 17 5 47
1 4 2 22 7 69
1 4 3 28 9 85
1 4 4 35 12 101
1 4 5 43 15 117
1 5 0 24 8 75
1 5 1 35 12 101
1 5 2 54 18 138
1 5 3 92 27 217
1 5 4 161 3 450
1 5 5 > 180 — —
IS 15188 : 2012ISO 8199 : 2005
36
Bibliography
[1] COCHRAN W.G. 1950. Estimation of bacterial densities by means of the “Most Probable Number”. Biometrics, 6, pp. 105-116
[2] HURLEY M.A. and ROSCOE M.E. 1983. Automated statistical analysis of microbial enumeration by dilution series. J. Appl. Bacteriol., 55, pp. 159-64
[3] LIGHTFOOT N.F. and MAIER E.A. 1998. Microbiological Analysis of Food and Water: Guidelines for Quality Assurance. Elsevier, Amsterdam, etc.
[4] NIEMELÄ S. 1983. Statistical evaluation of results from quantitative microbiological examinations. Nordic Committee on Food Analysis. NMKL, Report No. 1, 2nd edition
[5] NIEMELÄ S. 2003. Uncertainty of quantitative determinations derived by cultivation of microorganisms. Centre for Metrology and Accreditation. Publication J4/2003, 82 pp. Helsinki, Finland (www.mikes.fi)
[6] TAYLOR J. 1962. The estimation of numbers of bacteria by tenfold dilution series. J. Appl. Bacteriol., 25, pp. 54-61
[7] THOMAS H.A., Jr. 1942. Bacterial densities from fermentation tube tests. J. Am. Wat. Wks Ass., 34, pp. 572-76.
[8] ISO 3534-1:1993, Statistics — Vocabulary and symbols — Part 1: Probability and general statistical terms
[9] ISO 5667-2:1991, Water quality — Sampling — Part 2: Guidance on sampling techniques
[10] ISO 5667-3:2003, Water quality — Sampling — Part 3: Guidance on the preservation and handling of water samples
[11] ISO 5725-1:1994, Accuracy (trueness and precision) of measurement methods and results — Part 1: General principles and definitions
[12] ISO 6107-8:1993, Water quality — Vocabulary — Part 8
[13] ISO 6887-1:1999, Microbiology of food and animal feeding stuffs — Preparation of test samples, initial suspension and decimal dilutions for microbiological examination — Part 1: General rules for the preparation of the initial suspension and decimal dilutions
[14] ISO 7218:1996, Microbiology of food and animal feeding stuffs — General rules for microbiological examination; including Amendment 1:2001 to ISO 7218:1996
[15] ISO 7704:1985, Water quality — Evaluation of membrane filters used for microbiological analyses
[16] ISO 7899-1:1998, Water quality — Detection and enumeration of intestinal enterococci — Part 1: Miniaturized method (Most Probable Number) for surface and waste water; including Technical Corrigendum 1:2000 to ISO 7899-1:1998
[17] ISO 9308-3:1998, Water quality — Detection and enumeration of Escherichia coli and coliform bacteria — Part 3: Miniaturized method (Most Probable Number) for the detection and enumeration of E. coli in surface and waste water; including Technical Corrigendum 1:2000 to ISO 9308-3:1998
[18] ISO/TS 11133-1:2000, Microbiology of food and animal feeding stuffs — Guidelines on preparation and production of culture media — Part 1: General guidelines on quality assurance for the preparation of culture media in the laboratory
IS 15188 : 2012ISO 8199 : 2005
37

[19] ISO/TS 11133-2:2003, Microbiology of food and animal feeding stuffs — Guidelines on preparation and production of culture media — Part 2: Practical guidelines on performance testing of culture media
[20] ISO/TR 13843:2000, Water quality — Guidance on validation of microbiological methods
[21] ISO 16140:2003, Microbiology of food and animal feeding stuffs — Protocol for the validation of alternative methods
IS 15188 : 2012ISO 8199 : 2005
38

Bureau of Indian Standards
BIS is a statutory institution established under the Bureau of Indian Standards Act, 1986 to promoteharmonious development of the activities of standardization, marking and quality certification of goodsand attending to connected matters in the country.
Copyright
BIS has the copyright of all its publications. No part of these publications may be reproduced in any formwithout the prior permission in writing of BIS. This does not preclude the free use, in course of imple-menting the standard, of necessary details, such as symbols and sizes, type or grade designations.Enquiries relating to copyright be addressed to the Director (Publications), BIS.
Review of Indian Standards
Amendments are issued to standards as the need arises on the basis of comments. Standards are alsoreviewed periodically; a standard along with amendments is reaffirmed when such review indicates thatno changes are needed; if the review indicates that changes are needed, it is taken up for revision. Usersof Indian Standards should ascertain that they are in possession of the latest amendments or edition byreferring to the latest issue of ‘BIS Catalogue’ and ‘Standards: Monthly Additions’.
This Indian Standard has been developed from Doc No.: FAD 14 (2122).
Amendments Issued Since Publication______________________________________________________________________________________
Amendment No. Date of Issue Text Affected______________________________________________________________________________________
______________________________________________________________________________________
______________________________________________________________________________________
______________________________________________________________________________________
______________________________________________________________________________________
BUREAU OF INDIAN STANDARDSHeadquarters:
Manak Bhavan, 9 Bahadur Shah Zafar Marg, New Delhi 110002Telephones: 2323 0131, 2323 3375, 2323 9402 Website: www.bis.org.in
Regional Offices: Telephones
Central : Manak Bhavan, 9 Bahadur Shah Zafar Marg 2323 7617NEW DELHI 110002 2323 3841
Eastern : 1/14, C.I.T. Scheme VII M, V.I.P. Road, Kankurgachi 2337 8499, 2337 8561KOLKATA 700054 2337 8626, 2337 9120
Northern : SCO 335-336, Sector 34-A, CHANDIGARH 160022 260 3843260 9285
Southern : C.I.T. Campus, IV Cross Road, CHENNAI 600113 2254 1216, 2254 14422254 2519, 2254 2315
Western : Manakalaya, E9 MIDC, Marol, Andheri (East) 2832 9295, 2832 7858MUMBAI 400093 2832 7891, 2832 7892
Branches: AHMEDABAD. BANGALORE. BHOPAL. BHUBANESHWAR. COIMBATORE. DEHRADUN.FARIDABAD. GHAZIABAD. GUWAHATI. HYDERABAD. JAIPUR. KANPUR. LUCKNOW.NAGPUR. PARWANOO. PATNA. PUNE. RAJKOT. THIRUVANATHAPURAM. VISAKHAPATNAM.
Published by BIS, New Delhi
{{
{{{