irwin/mcgraw-hill 1 tn7: basic forms of statistical sampling for quality control acceptance...
Post on 22-Dec-2015
214 views
TRANSCRIPT

Irwin/McGraw-Hill1
TN7: Basic Forms of Statistical Sampling for Quality Control
Acceptance Sampling: Sampling to accept or reject the immediate lot of product at hand.
Statistical Process Control (SPC): Sampling to determine if the process is within acceptable limits.

Irwin/McGraw-Hill2
Acceptance Sampling Purposes
Determine quality level Ensure quality is within predetermined level
Lot received for inspection
Sample selected and analyzed
Results compared with acceptance criteria
Accept the lot
Send to production or to customer
Reject the lot
Decide on disposition
Irwin/McGraw-Hill3
Basic Forms of Variation - SPC
Assignable variation is caused by factors that can be clearly identified and possibly managed.
Common variation is inherent in the production process.

Irwin/McGraw-Hill4
Control Limits are based on the Normal Curve
x
0 1 2 3-3 -2 -1z
Standard deviation units or “z” units.
Irwin/McGraw-Hill5
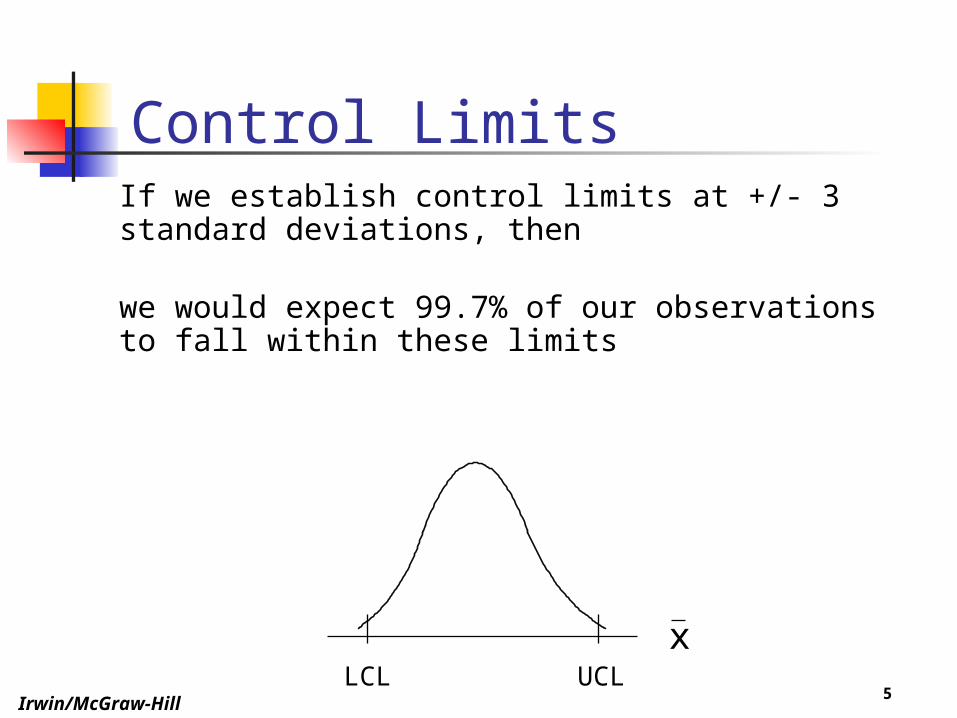
Control LimitsIf we establish control limits at +/- 3 standard deviations, then
we would expect 99.7% of our observations to fall within these limits
xLCL UCL

See Exhibit S6.3 for other evidence prompting investigation
StatisticalProcessControl
UCL
LCL
UCL
LCL
UCL
LCL

UCL
LCL
Samples over time
1 2 3 4 5 6
UCL
LCL
Samples over time
1 2 3 4 5 6
UCL
LCL
Samples over time
1 2 3 4 5 6
Normal Behavior
Possible problem, investigate
Possible problem, investigate
Statistical Process Control (SPC) Charts

Irwin/McGraw-Hill8
Statistical Sampling--Data
Attribute (Go no-go information) Defectives Defects Typically use sample size of 50-100
Variable (Continuous) Usually measured by the mean and the
standard deviation Typically use sample size of 2 to 10

Irwin/McGraw-Hill9
Statistical Process Control:Attribute Measurements (P-Charts)
p =Total Number of Defectives
Total Number of Observations
nS
)p-(1 p = p
UCL = p + Z
LCL = p - Z p
p
s
s
Where Z is equal to the number of Standard Deviations

1. Calculate the sample proportion, p, for each sample.
Sample Sample Size Defectives p
1 100 4 0.042 100 2 0.023 100 5 0.054 100 3 0.035 100 6 0.066 100 4 0.047 100 3 0.038 100 7 0.079 100 1 0.0110 100 2 0.0211 100 3 0.0312 100 2 0.0213 100 2 0.0214 100 8 0.0815 100 3 0.03

2. Calculate the average of the sample proportions.
0.0367=1500
55 = p
3. Calculate the sample standard deviation.
.0188= 100
.0367)-.0367(1=
)p-(1 p = p n
s
4. Calculate the control limits (where Z=3).
0 0.0197- = 3(.0188) - .0367 = Z- p = LCL
.0931 = 3(.0188) .0367 = Z+ p = UCL
p
p
s
s

Irwin/McGraw-Hill12
p-Chart (Continued)5. Plot the individual sample proportions, the average
of the proportions, and the control limits
0
0.02
0.04
0.06
0.08
0.1
1 2 3 4 5 6 7 8 9 10 11 12 13 14 15Observation
p
UCL
LCL
CL

An Example: Calculate sample means, sample ranges, mean of means, and mean of ranges.
Sample SampleSample 1 2 3 4 5 Mean Range
1 10.682 10.689 10.776 10.798 10.714 10.732 0.1162 10.787 10.860 10.601 10.746 10.779 10.755 0.2593 10.780 10.667 10.838 10.785 10.723 10.759 0.1714 10.591 10.727 10.812 10.775 10.730 10.727 0.2215 10.693 10.708 10.790 10.758 10.671 10.724 0.1196 10.749 10.714 10.738 10.719 10.606 10.705 0.1437 10.791 10.713 10.689 10.877 10.603 10.735 0.2748 10.744 10.779 10.110 10.737 10.750 10.624 0.6699 10.769 10.773 10.641 10.644 10.725 10.710 0.13210 10.718 10.671 10.708 10.850 10.712 10.732 0.17911 10.787 10.821 10.764 10.658 10.708 10.748 0.16312 10.622 10.802 10.818 10.872 10.727 10.768 0.25013 10.657 10.822 10.893 10.544 10.750 10.733 0.34914 10.806 10.749 10.859 10.801 10.701 10.783 0.15815 10.660 10.681 10.644 10.747 10.728 10.692 0.103
10.728 0.220
Observation
Overall Averages

Control Limit Formulas
x Chart Control Limits
UCL = x + A R
LCL = x - A R
2
2
R Chart Control Limits
UCL = D R
LCL = D R
4
3
Exhibit TN7.6Exhibit TN7.6
n A2 D3 D42 1.88 0 3.273 1.02 0 2.574 0.73 0 2.285 0.58 0 2.116 0.48 0 2.007 0.42 0.08 1.928 0.37 0.14 1.869 0.34 0.18 1.82
10 0.31 0.22 1.7811 0.29 0.26 1.74

Irwin/McGraw-Hill15
x-Bar Chart
10.600
10.856
=.58(0.220)-10.728RA - x = LCL
=.58(0.220)10.728RA + x = UCL
2
2
10.5
10.6
10.7
10.8
10.9
1 2 3 4 5 6 7 8 9 10 11 12 13 14 15Sample number
Sa
mp
le M
ea
n
LCL
UCL
CL

Irwin/McGraw-Hill16
R-Chart
0
0.464
)220.0)(0(RD = LCL
)220.0)(11.2(RD = UCL
3
4
0.0
0.1
0.2
0.3
0.4
0.5
0.6
0.7
0.8
1 2 3 4 5 6 7 8 9 10 11 12 13 14 15Sample number
Sa
mp
le R
an
ge
LCL
UCL
CL

Irwin/McGraw-Hill17
If you treat special causes like common causes, you lose an opportunity to track down and eliminate something specific that is increasing variation in your process.If you treat common causes like special causes, you will most likely end up increasing variation (called “tampering”).Taking the wrong action not only doesn’t improve the situation, it usually makes it worse.
Matching Action to the Type of Variation

Irwin/McGraw-Hill18
Quarterly Audit Scores
1 2 3 4 5
···
··
Score
Quarter

Irwin/McGraw-Hill19
Quarterly Audit Scores
1 2 3 4 5
···
··
Score
Quarter

Irwin/McGraw-Hill20
Quarterly Audit Scores
1 2 3 4 5
···
·Score
··
··
···· ·· ·
· · ·
·O
O
O
O
O · ·····
···
·
·
···

Irwin/McGraw-Hill21
Process Capability Process limits (The “Voice of the Process” or The
“Voice of the Data”) - based on natural (common cause) variation
Tolerance limits (The “Voice of the Customer”) – customer requirements
Process Capability – A measure of how “capable” the process is to meet customer requirements; compares process limits to tolerance limits

Irwin/McGraw-Hill22
Process Capability
natural variation
specification
(a)
specification
natural variation
(b)
specification
natural variation
(c)
specification
natural variation
(d)
Evans and Lindsay The Management and Control of Quality, Southwestern Books.

Irwin/McGraw-Hill23
Process Capability Index, Cpk
3
X-UTLor
3
LTLXmin=Cpk
Capability Index - shows how well parts being produced fit into design limit specifications.

Irwin/McGraw-Hill24
Interpreting the Cpk
Cpk < 1 Not Capable
Cpk = 1 Capable at 3
Cpk = 1.33 Capable at 4
Cpk = 1.67 Capable at 5
Cpk = 2 Capable at 6

Irwin/McGraw-Hill25
Process Capability Index, Cpk
Find the Cpk for the following:
A process has a mean of 50.50 and a variance of 2.25. The product has a specification of 50.00 ± 4.00.

Irwin/McGraw-Hill26
Is 99% Good Enough?
22,000 checks will be deducted from the wrong bank accounts in the next 60 minutes.
20,000 incorrect drug prescriptions will be written in the next 12 months.
12 babies will be given to the wrong parents each day.

Irwin/McGraw-Hill27
Motorola’s Initial Six SigmaMeasurement Process
Cycle time; e.g., 81 minutes 27 minutes 9 minutes 3 minutes 1 minute 20 seconds
Defects; e.g., 81 defects 27 defects 9 defects 3 defects 1 defect 0.3 defects
REDUCE BOTH SIMULTANEOUSLY!

Irwin/McGraw-Hill28
Six Sigma Quality
The objective of Six Sigma quality is 3.4 defects per million opportunities!
(Number of Standard Deviations) 3 Sigma 4 Sigma 5 Sigma 6 Sigma
0.0 2700 63 0.57 0.002
0.5 6440 236 3.4 0.019
1.0 22832 1350 32 0.019
1.5 66803 6200 233 3.4
2.0 158,700 22800 1300 32

Irwin/McGraw-Hill29
But is Six Sigma Realistic?
·
1
11
21
31
41
3 4 5 6 7
10
1
100
1K
10K
100K
765432
(66810 ppm)· IRS – Tax Advice (phone-in)
Best in Class
(3.4 ppm)
Domestic AirlineFlight Fatality Rate
(0.43 ppm)
·(233 ppm)
AverageCompany
Purchased MaterialLot Reject Rate
Air Line Baggage Handling
Wire Transfers
Journal VouchersOrder Write-up
Payroll Processing
Doctor Prescription WritingRestaurant Bills
·······
Defe
cts
Per
Million
Op
port
un
itie
s (
DP
MO
)
SIGMA

Irwin/McGraw-Hill30
A Partial List of Organizations in Atlanta Implementing Six Sigma
Coca-Cola Home Depot SunTrust Banks Bank of America Delta Airlines Atlantic Envelope Company GE Capital Lithonia Lighting