irvine ranch water district biosolids & energy recovery ... · pdf fileabout irvine ranch...
TRANSCRIPT

Irvine Ranch Water DistrictBiosolids & Energy Recovery Project
A Practical Solution for a Sustainable Future
2012 NWRI Clarke Prize ConferenceNovember 2, 2012

1
1. IRWD Background and Services
2. Project Objectives
3. Project Alternatives and Analyses
4. Project Description
5. Odor Control Systems
6. Biogas Utilization
7. Pellet Marketing
8. Project Schedule
9. Research Opportunities
Presentation Overview:
Biosolids & Energy Recovery Project

2
Water, Wastewater, Water Recycling, and Urban Runoff
California Special District governed by a publicly-elected Board
IRWD customer base:• Residential population: 340,000• Daytime population: over 500,000• Service connections: 101,600
IRWD service area:• 181 square miles (20% of Orange County)• All or part of six cities and unincorporated county:
About the Irvine Ranch Water District
IrvineTustin
Orange
Lake ForestNewport Beach
Costa Mesa

3
IRWD services and system statistics:
Potable Water: Three treatment plant, 25 wells, 1,500 miles of pipelines
Wastewater: Nearly 1,000 miles of sewage collection pipelines
Recycled Water: Two water recycling facilities (28 MGD + 5.5 MGD) and approximately 500 miles of recycled water pipelines
Urban Runoff Treatment: The San Joaquin Marsh and 31 built and planned man-made wetland treatment sites
About Irvine Ranch Water District

Project Objectives
4

5
Should IRWD get back into the biosolids handling business?
• The Michelson Water Recycling Plant (MWRP) processed biosolids from 1967 until 1988 using aerobic digestion and belt presses for dewatering.
• Since 1988, IRWD piped biosolids to Orange County Sanitation District for processing in Fountain Valley and Huntington Beach.
• In 2005 Orange County Sanitation District announced plans to expand their processing facilities for IRWD biosolids by 2016.
• In 2005 IRWD started investigating options to process biosolids at the MWRP.
Project Objectives
IRWD’s Solids Handling Past

6
Project Objectives
• Maximize IRWD’s ability efficiently and sustainably use of its renewable resources.
• To make beneficial use of biosolids and biogases produced during the treatment process.
• Provide for greater control of residual (biosolids) management at reduced costs.
• Minimize environmental impacts associated with residuals management.
• Construct a biosolids handling and energy recovery facility that will address IRWD’s future biosolids handling needs.
Biosolids & Energy Recovery Project

Project Alternatives
7

8
Class B Class A
Primary Sludge
Waste Activated Sludge
Thickening Anaerobic Digestion
Digested Sludge
Dewatering
Digester Gas Treatment
Composting Partner
Land Applic. Partner
Drying Partner
Landfill
E‐Fuel Conversion
Incineration Partner
Drying & Pelletizing
OCSD
Local Fertilizer
Fertilizer Partner
E‐Fuel Conversion
Incineration Partner
Raw Sludge Dewatering
Composting Partner
Incineration Partner
Internal Combustion Engines
Microturbines
Energy Partner
Dryer Fuel
Fuel Cells
E‐Fuel Conversion
Project Alternatives

9
1. Baseline Alternative• Continue sending all residuals to OCSD
2. Digest All Sludge• Send liquid digested sludge to OCSD
3. Digest Only Primary Sludge• Send digested primary sludge & secondary sludge to OCSD
4. Digest & Dewater; Private Hauler• No residuals sent to OCSD
5. Digest & Dewater On-Site; Off-Site Incineration• No residuals sent to OCSD
6. Digest & Dewater; On-Site Drying• Produce Class A pelletized product (90% solids)• No residuals sent to OCSD
7. Digest & Dewater; Off-Site Drying• No residuals sent to OCSD
Summary of Project Alternatives

Alternatives Analyses
10

11
Economic Analysis Methodology
Capital Costs
Operating Costs
Life CycleCumulative Costs
Payback
Biosolids & Energy Recovery Project

12
OCSD Total Annual Cost to IRWD, $ millions
Biosolids & Energy Recovery Project
13
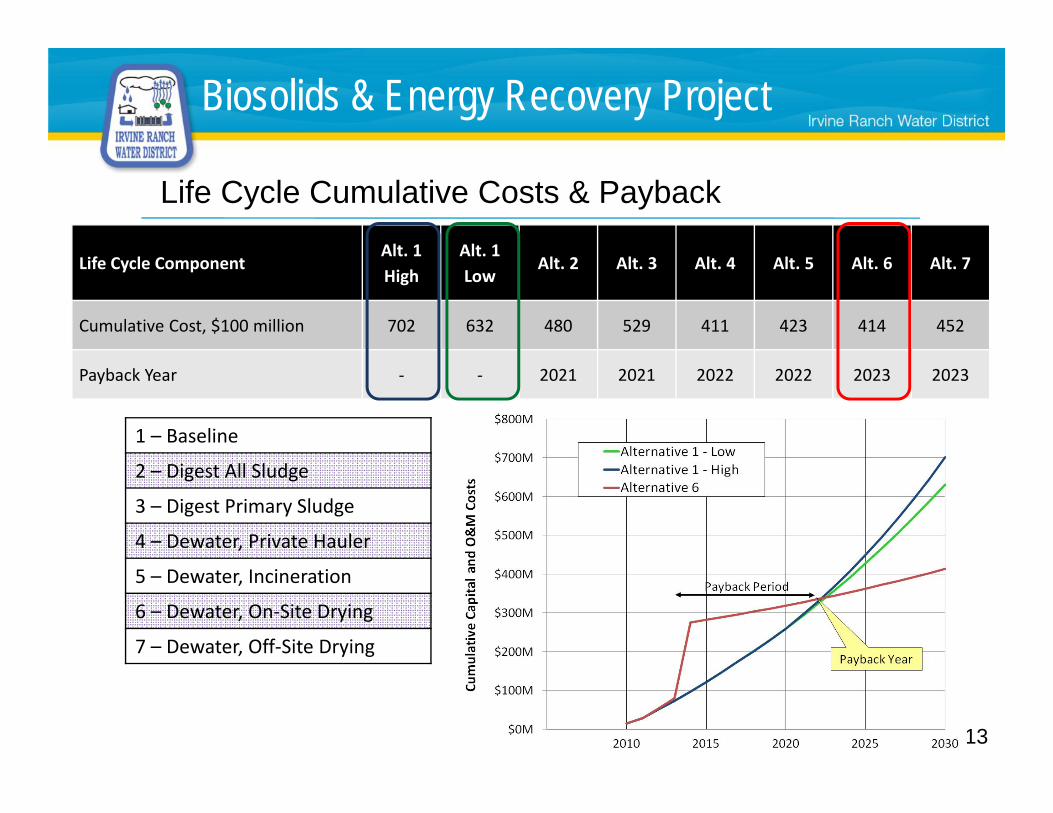
Life Cycle Cumulative Costs & Payback
Life Cycle ComponentAlt. 1High
Alt. 1Low
Alt. 2 Alt. 3 Alt. 4 Alt. 5 Alt. 6 Alt. 7
Cumulative Cost, $100 million 702 632 480 529 411 423 414 452
Payback Year ‐ ‐ 2021 2021 2022 2022 2023 2023
1 – Baseline
2 – Digest All Sludge
3 – Digest Primary Sludge
4 – Dewater, Private Hauler
5 – Dewater, Incineration
6 – Dewater, On‐Site Drying
7 – Dewater, Off‐Site Drying
Biosolids & Energy Recovery Project

14
Non-Economic Evaluation Criteria• IRWD Autonomy:
Independent biosolids management decision making.
• Implementability:Able to obtain permits within required time frame.
• Community Impacts:Noise, traffic, odors, aesthetics, public health.
• Environmental Stewardship:Biosolids reuse & reduce carbon footprint.
• Technology:Proven and reliable.
• Long-term Viability:Can remain cost-effective; responsive to regulations.
Biosolids & Energy Recovery Project

15
Weighted Benefit Scores
Biosolids & Energy Recovery Project
+ Easy to implement
- Little autonomy
+ IRWD can implement
+ More autonomy

16
Benefit Scores vs. Life Cycle Costs
1 – Baseline
2 – Digest All Sludge
3 – Digest Primary Sludge
4 – Dewater, Private Hauler
5 – Dewater, Incineration
6 – Dewater, On‐Site Drying
7 – Dewater, Off‐Site Drying
Biosolids & Energy Recovery Project

17
Selected Project:
• Anaerobic digestion of biosolids.
• Electrical energy generation by feeding biogas to microturbines.
• On-site drying to produce a reusable pelletized product.
• Started design of MWRP Biosolids & Energy Recovery Facilities in 2009.
• Project operational by 2016.
Biosolids & Energy Recovery Project

18
Summary of Project Benefits:
• Reduces greenhouse gas effects by using pellets locally.
• Drying and pelletizing reduces export truck loads by factor of four.
• Beneficially reuse as a local fertilizer or e-fuel.
• Greater environmental stewardship and reduced carbon footprint.
• Lower overall cost to community.
• Project positions IRWD and the City of Irvine as a proponents of sustainability.
Biosolids & Energy Recovery Project

Project Description
19

20
Project Description
• IRWD to construct facilities at MWRP for:• Biosolids dewatering;• Biogas management and energy recovery; and• Odor control systems.
• IRWD would no longer export solids to Orange County Sanitation District (OCSD).
• Project would also dry solids trucked in from IRWD’s Los Alisos Water Recycling Plant (LAWRP).
• Project to be constructed on disturbed vacant land within the current boundary of the MWRP.
Biosolids & Energy Recovery Project

21
Project Location

22
IRWD Biosolids Facilities Site Location
MWRP
Biosolids and Energy
Recovery Facilities

23
EXISTING PRIMARY CLARIFIER
THICKENINGCENTRIFUGE
EXISTING SECONDARY CLARIFIER
ACID‐METHANE PHASE ANAEROBICDIGESTION
DEWATERINGCENTRIFUGE
THICKENINGCENTRIFUGE
DIGESTED SLUDGE STORAGE
MICROTURBINES
BIOGAS ELECTRICITY
CAKESTORAGE & LOADOUT
CLASS BCAKE HAUL(BACKUP)
ROTARYDRUMDRYER
PELLET STORAGE & LOADOUT
CLASS A PELLET HAUL
FATS, OILS & GREASE
CENTRATETREATMENT
TO LIQUID TREATMENT
RECYCLED WATER
PS
WAS
DIGESTER GAS CLEANING
Simplified Process Schematic

24
Conventional vs. Egg-Shaped Digesters
Advantages of Egg-Shaped Digesters:• Best design for treatment process• More efficient mixing• Better foaming control• Easier grit removal• Less frequent cleaning = less chance for odors escaping• IRWD’s design will have piping and equipment hidden in basement
and inside walkway• Clean dome appearance

25
Egg-Shaped Digester Characteristics
Portion of Digester
Below Grade
Approx 73 Ft
Mesa, AZ

26
IRWD Biosolids Facilities Site Plan

27
Biosolids Handling Building Interior
Cake Receiving & StorageHeat Dryer
Centrifuges & Cake HandlingPellet & Cake Truck Loading
Cake Bins

28
Digestion Facilities
28
Acid Phase Digesters
Egg-Shaped Digesters

29
Biosolids Handling BuildingDryer and Odor Control
Wet Scrubber Discharge Stacks

3030
Biosolids Handling Building

3131
Centrifuge Room

3232
Dryer System – Lower Level

3333
Dryer System – Upper Level

Odor Control Systems
34

35
Components of Odor Control Process
• Odor control ducting to be placed directly on relevant equipment
• Regenerative Thermal Oxidizer (RTO) for off-gas from dryer.
• Biogas conditioning prior to use in microturbines
Ventilation Systems
• People areas – positive air pressure
• Equipment areas – negative air pressure
Odor Control Systems
Biosolids & Energy Recovery Project
36
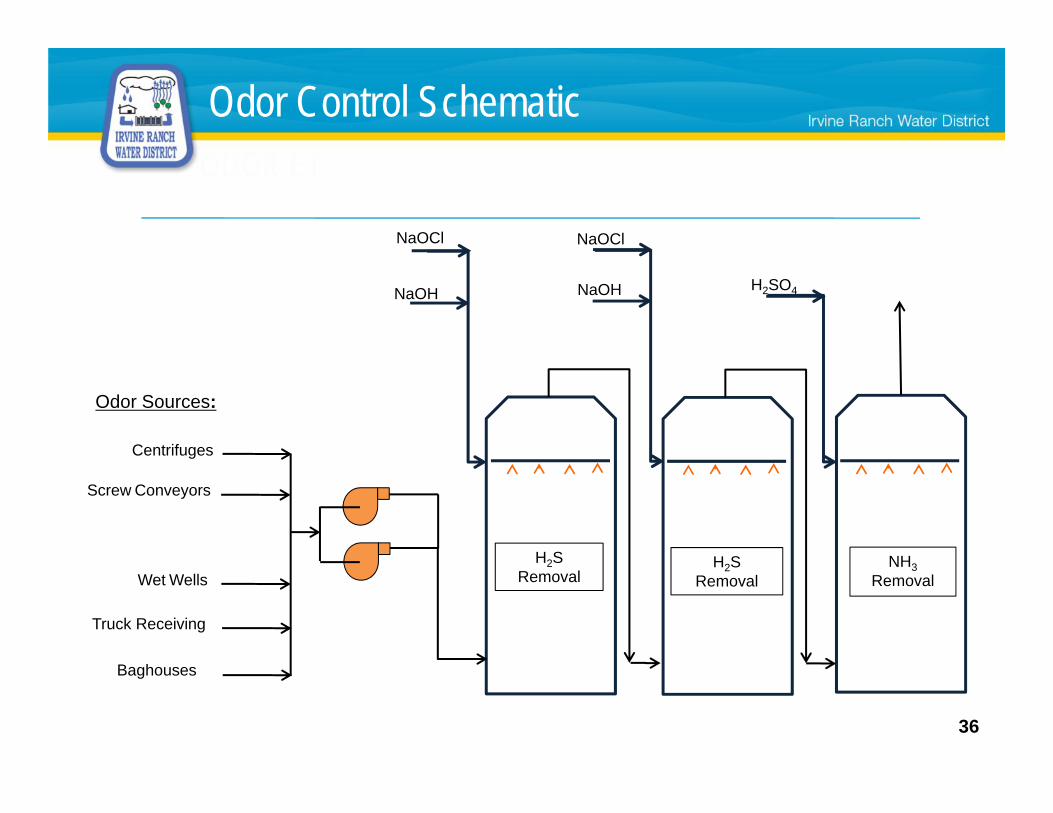
Odor Control SchematicODOR ET
36
Centrifuges
Screw Conveyors
Wet Wells
Truck Receiving
Baghouses
NaOCl NaOCl
NaOH NaOH H2SO4
H2SRemoval
NH3Removal
H2SRemoval
Odor Sources:

37
Odor Control at City of Mesa

Biogas Utilization
38

39
Alt. 1 – Base Case
Biogas Priorities:
1. Use in the dryer; recycle waste heat to digesters.
2. When dryer is off, use in boilers to heat digesters, if needed (cold day).
3. Excess gas diverted to enclosed gas burner.

40
Alt. 2 – Fuel Cell
Biogas Priorities:
1. Use in the fuel cell
2. Use any excess biogas in the dryer
3. When dryer and fuel cell are off, use in boilers to heat digesters, if needed
4. Excess biogas diverted to enclosed gas burner

41
Alt. 3 – Microturbines
Biogas Priorities:
1. Use in the micro-turbines to get SCE incentives.
2. When dryer and micro-turbines are off, use in boilers to heat digesters, if needed.
3. Excess biogas (very little) diverted to enclosed gas burner.
4. Use natural gas in the dryer.

42
Electrical Power Summary
MWRP RecycledWater
Production(MGD)
Recycled Water
Treatment Electrical Demand(MW)
BiosolidsHandling Electrical Demand(MW)
Total MWRP ElectricalDemand(MW)
Micro‐Turbine Power
Generated(MW)
Percent of Power Self‐Generated
23 5.1 1.8 6.9 1.0 15%
28 6.1 2.4 8.5 1.5 18%
Biogas Production (Digestion)
Power Generation
(Microturbines)
Power Use (Aeration Blowers)
• Continuous biogas production and power generation.
• All power used on MWRP site.

43
Biogas and Microturbines
Odor Control Wet Scrubber

Pellet Marketing
44

45
IRWD Pellet Marketing PlanGoal:
Maximize local reuse opportunities
Priorities:1. Local reuse as fertilizer2. E-fuel in cement kiln3. Agricultural land application4. Landfill cover (last resort)
Competitive Advantage:IRWD’s relationship with recycled water users on Irvine’s many greenbelts & parks
Strategy:Public/private partnerships
Biosolids & Energy Recovery Project
Project Schedule
46

47
Project Schedule
DATE ACTIVITYOctober 2012 Supplemental EIR certified by the IRWD
Board of Directors; Project approvedNovember 2012 City of Irvine action on
Conditional Use PermitEarly 2013 IRWD to award Biosolids Facilities
construction contract2013-2016 Construction
Early 2016 Start-up of digestion facilities (Class B biosolids)
Late 2016 Start -up of facilities (Class A biosolids)
Engineer’s Estimate for Construction: $150.8 million

Research Opportunities
48

49
OpenCEL:• A cell lysis technology that treats waste activated sludge with high
voltage DC current to sludge cells to make sludge more biodegradable.
• May result in digester producing less biosolids.• May allow more production of biogas.• May offset methanol use in denitrification process.
Ostara:• Recovers phosphorus from sludge for use as a fertilizer.
Foodwaste:• May allow more production of biogas without producing more solids.
Future Research Opportunities

50
Project Delivered by Dr. McCarty’s Students!
