irrigation water resources and climate change in new...
TRANSCRIPT

Irrigation and climate change in New Mexico
New Mexico Sustainable Agriculture Conference: Building Climate Resilient Agriculture in New Mexico
November 30, 2016
Emile Elias, USDA – Agricultural Research Service and Southwest Climate Hub

Overview
• Current agricultural water use in NM
• Observed and predicted changes in temperature and precipitation
• Adaptation and planning options• Regional water plans
• Irrigation options
• Drought planning and drought reporting
• CoCoRaHS
• Climate Hub Tool Shed

Hydrologic Context in New Mexico
• Depleted surface water and shifting storage.
• Declining aquifer levels, less certain groundwater resources and increased energy needed to access water.
• Litigation (i.e. Texas and New Mexico) .
• Water rights system.
• Increasing urban population.
• Water quality/salinity.
Climate change represents one of many pressures facing New Mexico water resources


Source: National Water Information System,USGS 2010 Water Use Data

Agricultural groundwater fraction
National Water Information System,USGS, Water Use Data, 1985 - 2010

Source: Southwest Climate Outlook November 2016


Long-term Groundwater depletion in the United States• Increased reliance on groundwater, but
how reliable is that source in NM?
• Estimated groundwater depletion from 1900 to 2008
• Maximum depletion rates from 2000 to 2008
• Groundwater depletion leads to: • Reduced water supply, land subsidence,
reduced surface water flows and spring discharges, and loss of wetlands.
Konikow, L.F., 2013, Groundwater depletion in the United States (1900−2008): U.S. Geological Survey Scientific Investigations Report 2013−5079, 63 p., http://pubs.usgs.gov/sir/2013/5079.

Diminished crop yields from irrigation interruption, 2013

NOAA National Centers for Environmental information, Climate at a Glance: U.S. Time Series, Average Temperature, published November 2016, retrieved on November 27, 2016 from http://www.ncdc.noaa.gov/cag/
Observed Temperature Anomalies
Mean: 58.9 F (1900 to 2000)

Temperatures in the future
• Since 1950, the Southwest has been hotter than in any comparably long period in at least 600 years
• If emissions of CO2 and other greenhouse gases continue to rise then NM annual average temperatures are estimated to rise by 5.5°F to 6.2°F by 2041-2070 and by 8.8°F to 9.8°F by 2070-2099
• If emissions of CO2 and other greenhouse gases are greatly reduced then NM annual average temperatures are estimated to rise by 4.1°F to 4.5°F by 2041-2070, and 4.8°F to 5.5°F by 2070-2099.

Mountain snowpack decline 1955 to 2015
• Mountain snowpack is a key part of the hydrologic cycle because it acts as a natural reservoir, releasing stored precipitation in the Spring and early Summer, in time to meet high water demands
• Trends in April snowpack 1955 –2015 (measured as snow water equivalent [SWE]). The majority of URG sites indicate declining snowpack in the most productive sub-basins (Mote et al., 2005; Mote and Sharp, 2015)

Rio Grande snowpack in the future• Temperature-index modeling approach (snowmelt
runoff model) to simulate streamflow for 24 basins under historical conditions (e.g., 1999) and using measured data (temperature, precipitation, snow cover and streamflow).
• Ascertained basin-specific model parameters (runoff coefficients for rain and snow, lapse rate, critical temperature threshold determining precipitation falling as rain or snow, recession coefficient and lag time )
• Determined representative hotter-dryer (HD), warmer-dryer (WD), hotter-wetter (HW) and warmer-wetter (WW) conditions from CMIP5 model projections.
• Applied the temperature difference and % change in precipitation in the SRM climate change module

Simulating snowmelt runoff under a changed climate: impacts on flow magnitude and timing
Elias et al., 2015

Simulating snowmelt runoff under a changed climate: impacts on flow magnitude and timing
Elias et al., 2015

Alamosa BasinObserved and simulated streamflow
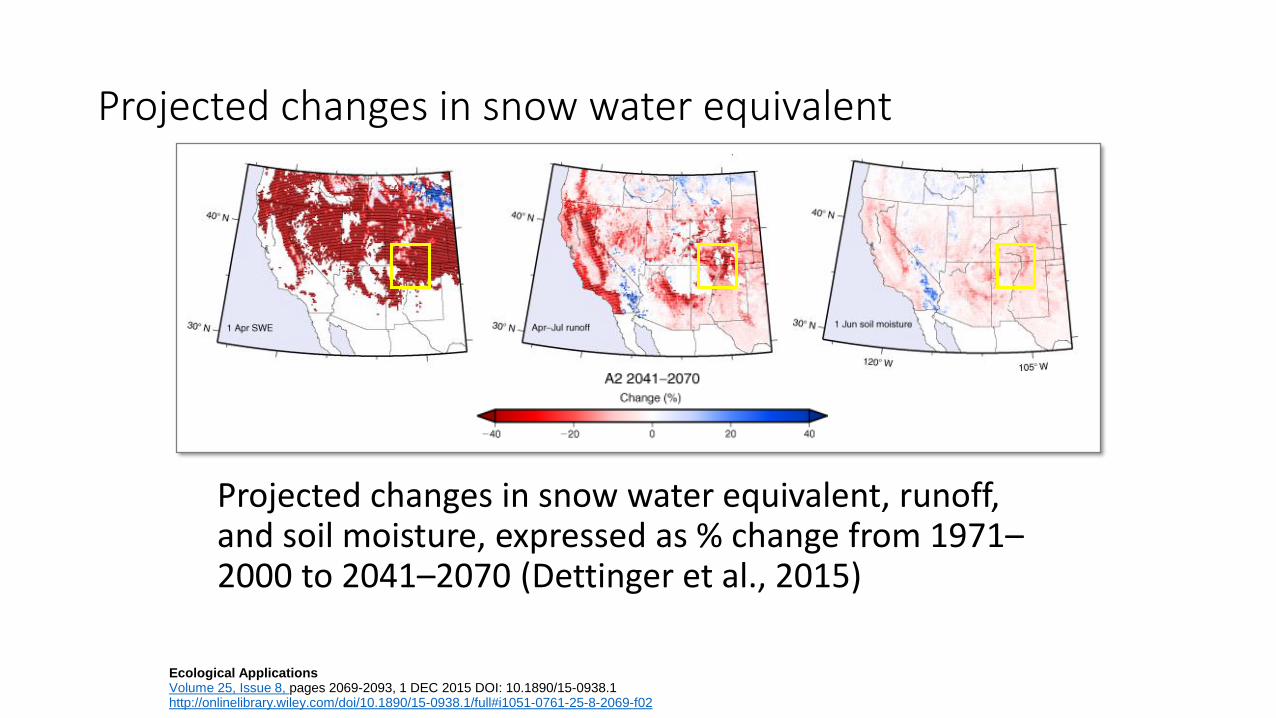
Projected changes in snow water equivalent
Projected changes in snow water equivalent, runoff, and soil moisture, expressed as % change from 1971–2000 to 2041–2070 (Dettinger et al., 2015)
Ecological ApplicationsVolume 25, Issue 8, pages 2069-2093, 1 DEC 2015 DOI: 10.1890/15-0938.1http://onlinelibrary.wiley.com/doi/10.1890/15-0938.1/full#i1051-0761-25-8-2069-f02
North American Monsoon
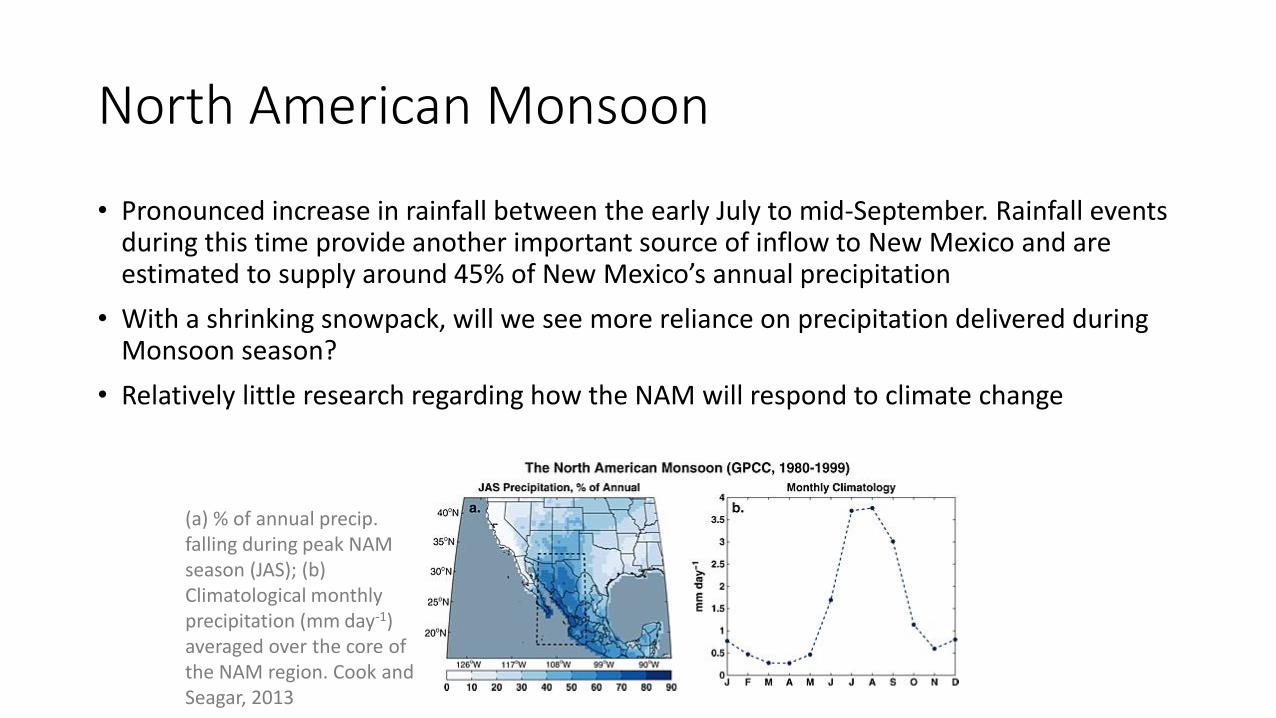
• Pronounced increase in rainfall between the early July to mid-September. Rainfall events during this time provide another important source of inflow to New Mexico and are estimated to supply around 45% of New Mexico’s annual precipitation
• With a shrinking snowpack, will we see more reliance on precipitation delivered during Monsoon season?
• Relatively little research regarding how the NAM will respond to climate change
(a) % of annual precip. falling during peak NAM season (JAS); (b) Climatological monthly precipitation (mm day-1) averaged over the core of the NAM region. Cook and Seagar, 2013

North American Monsoon• Precipitation seasonality of
the NAM may shift with increased GHG forcing. • Delayed onset
• Reduced precipitation in early monsoon season
• Changes in multi-model mean daily precip. over the core region. 1980-2005 (historical) and 2006-2099 (RCP 8.5)• June/July ~ 15% decline
• September ~ 14% increase
• October ~ 6% increase
Cook and Seagar, 2013: Journal of Geophysical Research: AtmospheresVolume 118, Issue 4, pages 1690-1699, 27 FEB 2013 DOI: 10.1002/jgrd.50111http://onlinelibrary.wiley.com/doi/10.1002/jgrd.50111/full#jgrd50111-fig-0005

Precipitation projections: 2040-2069 (RCP 8.5)
Source: AgClimate Atlas: http://climate.nkn.uidaho.edu/HUB/
WINTER (DEC JAN FEB) SPRING (MAR APR MAY) SUMMER (JUN JUL AUG) FALL (SEP OCT NOV)
Projected Changes

Precipitation in the future
• Climate models show that in the long-term over the next century, we can expect precipitation to decline in NM in the spring.
• Some researchers predict megadroughts of 35+ years in length
• We don’t know how the monsoon will change in the future but it is thought that• Monsoon will start later
• Less precipitation in June and July
• More precipitation in September and October

Impacts of Climate Change on NM Water Supply
• Temperatures have already risen in NM and are projected to continue to increase• Summer heat waves projected to become longer and hotter
• Changes in snowpack elevations and decreases in water equivalency• Changes in available water and timing of water availability• Precipitation as rain rather than snow• Earlier spring runoff that will affect water availability• Milder winters and hotter summers causing longer growing seasons• Increased evaporation from surface water and soils• Increased evapotranspiration• Increase in extreme events, including droughts and floods

Increase adaptive capacity
“Adaptive capacity is the ability or potential of a system to respond successfully to climate variability and change, and includes adjustments in both behavior and in resources and technologies”
• Proactive vs. Reactive

1. Regional Water Plans
• 16 regional water plans
• First plans (1987 to 2008)• Meet regional water needs for the next 40 years
• Updated with common technical approach
• Components: Legal issues, supply, demand, gaps between supply and demand, strategies to meet future demand

2. Irrigation options and tools
• Consider different irrigation technologies, such as drip irrigation, where appropriate• Water rights issues• Where surface water is used for irrigation, a consequence of applying less
water is that groundwater recharge is diminished because of a reduction in deep percolation of excess water.
• Climate Hub Tool Shed (http://tools.serch.us/tbl_tools_list.php)
• Deficit irrigation or limiting water applications to drought-sensitive growth stages. This practice aims to maximize water productivity and to stabilize – rather than maximize – yields.• Requires precise knowledge of crop response to drought stress.

3. Management adaptation options• Ranch adaptation options
• Conservative stocking rates and flexible stocking strategies• Herd size and composition• Identification of reserve forage• Water availability and distribution
• Farm adaptation options• Alternate crop• Modify planting/harvest dates
• Agency adaptation options• Increased coordination between private and federal
partners on drought planning• Increased decision-making flexibility

4. Drought planning and reporting• Managing drought risk on the ranch – planning guide
http://drought.unl.edu/ranchplan/Overview/Resources/TrackingDroughtImpacts.aspx
• Drought Impact Reporter, Submit a Report Formhttp://droughtreporter.unl.edu/submitreport/
• Community Collaborative Rain, Hail & Snow Networkhttp://cocorahs.org• Used in making the drought monitor maps.

5. Lessons from acequia communities• Acequia – literal definition is a system of canal irrigation for
distributing water
• Acequia systems are shared water governance institutions with social, political, hydrological and ecological roles. Rivera (1998) predicts broader impacts to the entire region if acequia communities “dry up”. Traditional farming and irrigation practices of acequia communities may hold the key to future sustainability (e.g., Fernald et al., 2012).
Figures from left to right: Lower Manuel Andres Trujillo ditch near Taos (lasacequias.org), Acequias at Valdez, NM (lasacequias.org), Acequias at Valdez, NM (wrri.nmsu.edu)

6. Lessons from other regions
• Greenhouses near Almeria, Spain
• Supply half of Europe's fresh fruit and vegetables
• 26,000 hectares
• Annual average precipitation: 20 cm of rain

Summary
• Water is limited
• It is hot and it is getting hotter
• Precipitation is a wildcard
• Significant declines in runoff are likely
• Climate adaptation and mitigation are both part of the solution
• Climate needs to be considered in planning
• Assuming the drought will end and that supply/demand problems will fade away is naïve and dangerous
• Planning, creativity and flexibility in proactive adaptation is vital
• There are new tools, resources and examples to utilize
Adapted from Climate Change and the Colorado River: What we already know by the Colorado River Research Group