irrigation management by means of soil moisture sensor...
TRANSCRIPT
JOURNAL OF WATER DOI: 10.2478/v10025-000-0007-0 AND LAND DEVELOPMENT J. Water Land Dev. No. 11, 2007: 79–90
Irrigation management by means of soil moisture sensor technologies
Peter CEPUDER, Reinhard NOLZ
Institute of Hydraulics and Rural Water Management, Department of Water, Atmosphere and Envi-ronment, University of Natural Resources and Applied Life Sciences, Muthgasse 18, A-1190 Vienna; [email protected]
Abstract: Water is a sensitive and limited resource, mainly in intensively used agricultural areas in Austria, where groundwater is used as drinking water as well as for irrigation purposes. In order to guarantee a sustainable use of irrigation water, soil water measurement devices can be used to opti-mise irrigation, which means that controlling the soil water content in the entire root system may prevent water stress due to water deficiency on the one hand, and over wetting on the other hand. Furthermore, losses of nutrients due to leaching can be avoided. Several research studies on that topic were initiated during the last few years. The soil water status on selected fields planted with different crops (onions, carrots, sugar beets, sweet maize, zucchini) was monitored continuously by FDR (Fre-quency Domain Reflectometry) soil water measurement devices. Sensors in different depths measure the plant water uptake in the root zone under standard irrigation practices on different sites and dif-ferent soils, respectively. The deepest sensor is installed to avoid deep percolation caused by over irrigation. By means of these data, irrigation could be regulated based on the actual plant water re-quirements to keep the soil water content within an ideal range for crop development.
Key words: FDR capacitance sensors, irrigation management
INTRODUCTION
In Austria irrigation is used predominantly to guarantee proper yields and high qualities. Approximately 7% (95,000 hectares) of the agricultural cropland (1.4 million hectares) can be irrigated. Due to climatic conditions 93% of the irrigated areas lie in the east of the country. The average amount of rainfall per year in these regions is less than 600 mm with an average temperature of 9.5°C. This situation leads to a negative water balance during the vegetation period for nearly all kinds of crops. Even short-term water stress can cause limited growth. In order not to overload the existing water resources, the efficiency of irrigation should be im-proved gradually. This can take place via water-saving technologies and/or im-provement of the irrigation management (CEPUDER, 2004).
80 P. CEPUDER, R. NOLZ
Increased demand of quality, economic development, and change of climatic conditions advance the application of irrigation management. For the optimization of irrigation management the knowledge of soil conditions is particularly important apart from the observation of the soil water distribution. A sufficient quantity of water has to be available for the plant at the correct time, whereby the kind of crop plays an important role. Too much water would mean leaching of nutrients towards groundwater, which causes contamination of groundwater on the one hand and de-creased plant-available nutrients in the root zone on the other hand. Therefore, con-trolled irrigation by soil water monitoring as close as possible to the plant water uptake rate may improve irrigation efficiency (BATCHELOR et al., 1996).
OBJECTIVES
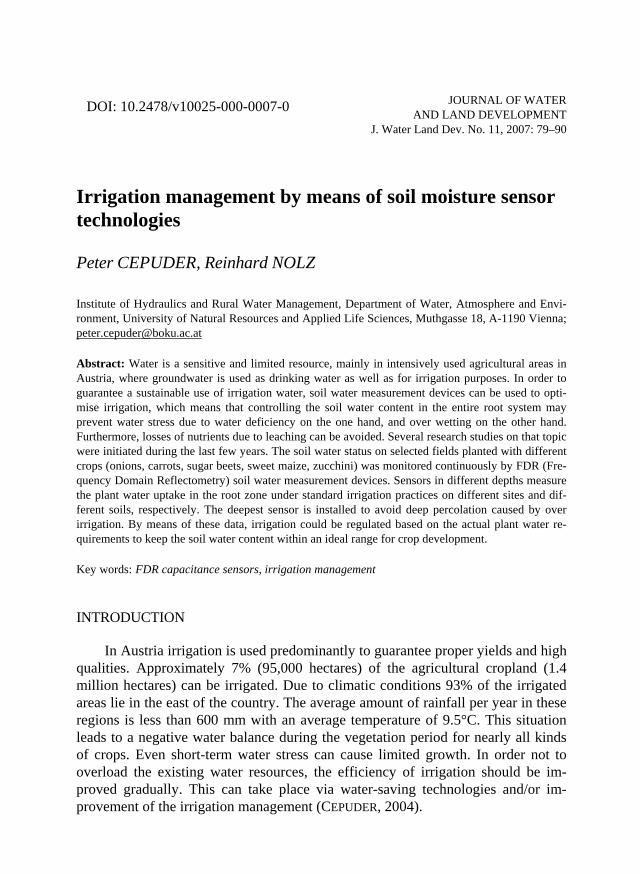
During the last few years (2001–2006) several research projects were initiated in the intensively used agricultural irrigation areas in the east of Austria; for exam-ple, irrigation of onions, carrots and sugar beets in the Marchfeld area (Fig. 1). The main objective of these projects was minimization of water losses by continuous multi-depth soil moisture monitoring.
Fig. 1. Irrigation areas in Austria
Irrigation management by means of soil moisture sensor technologies 81
MATERIALS AND METHODS
In the Marchfeld area a trial as preparatory work with automatic irrigation control systems based on measurements of soil water content was started at a large scale to optimize irrigation water amounts. With local partners two different sys-tems were installed to monitor and manage irrigation:
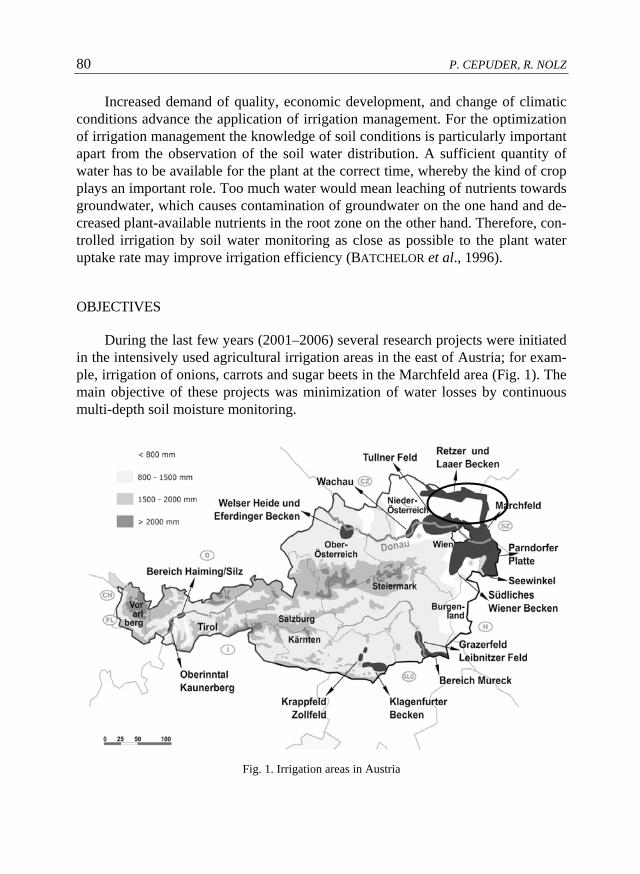
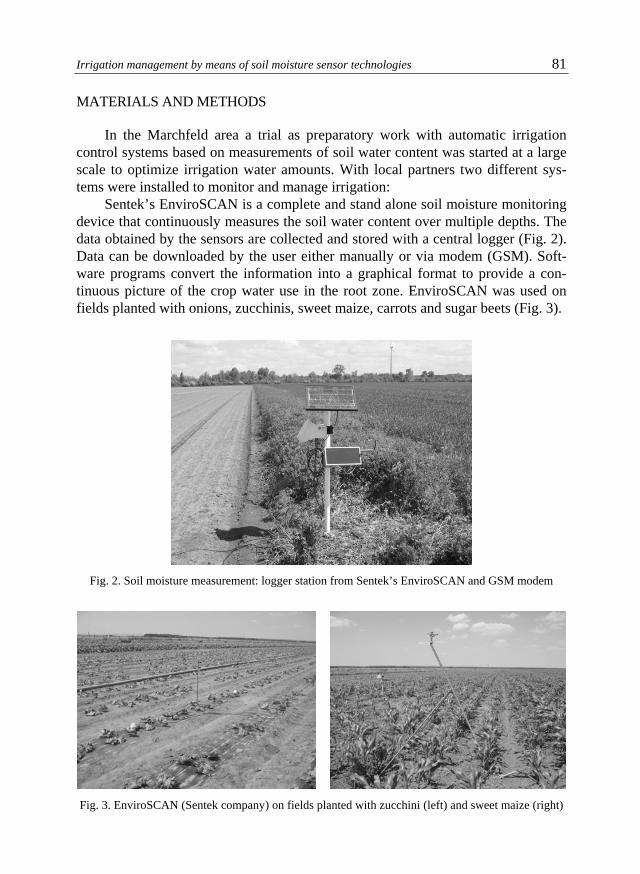
Sentek’s EnviroSCAN is a complete and stand alone soil moisture monitoring device that continuously measures the soil water content over multiple depths. The data obtained by the sensors are collected and stored with a central logger (Fig. 2). Data can be downloaded by the user either manually or via modem (GSM). Soft-ware programs convert the information into a graphical format to provide a con-tinuous picture of the crop water use in the root zone. EnviroSCAN was used on fields planted with onions, zucchinis, sweet maize, carrots and sugar beets (Fig. 3).
Fig. 2. Soil moisture measurement: logger station from Sentek’s EnviroSCAN and GSM modem
Fig. 3. EnviroSCAN (Sentek company) on fields planted with zucchini (left) and sweet maize (right)
82 P. CEPUDER, R. NOLZ
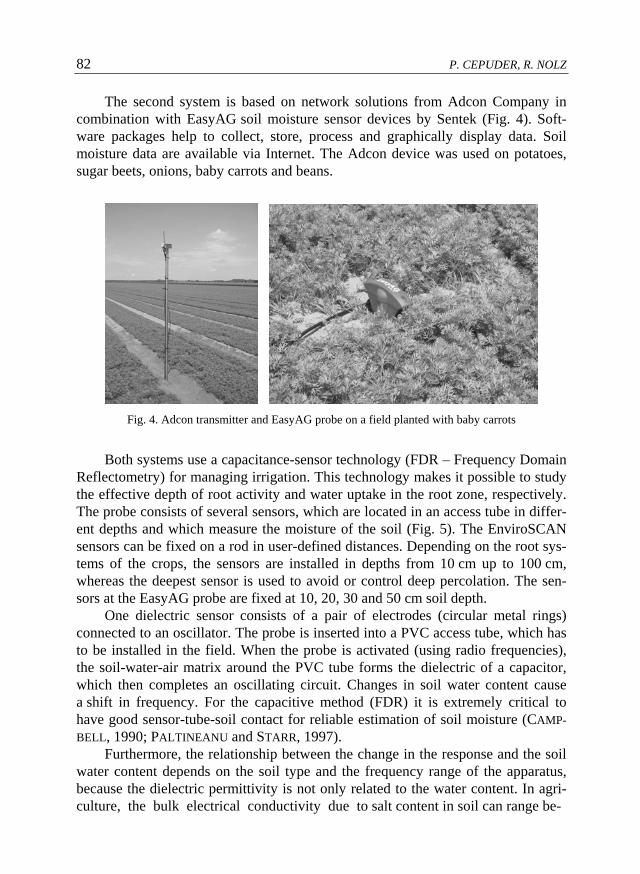
The second system is based on network solutions from Adcon Company in combination with EasyAG soil moisture sensor devices by Sentek (Fig. 4). Soft-ware packages help to collect, store, process and graphically display data. Soil moisture data are available via Internet. The Adcon device was used on potatoes, sugar beets, onions, baby carrots and beans.
Fig. 4. Adcon transmitter and EasyAG probe on a field planted with baby carrots
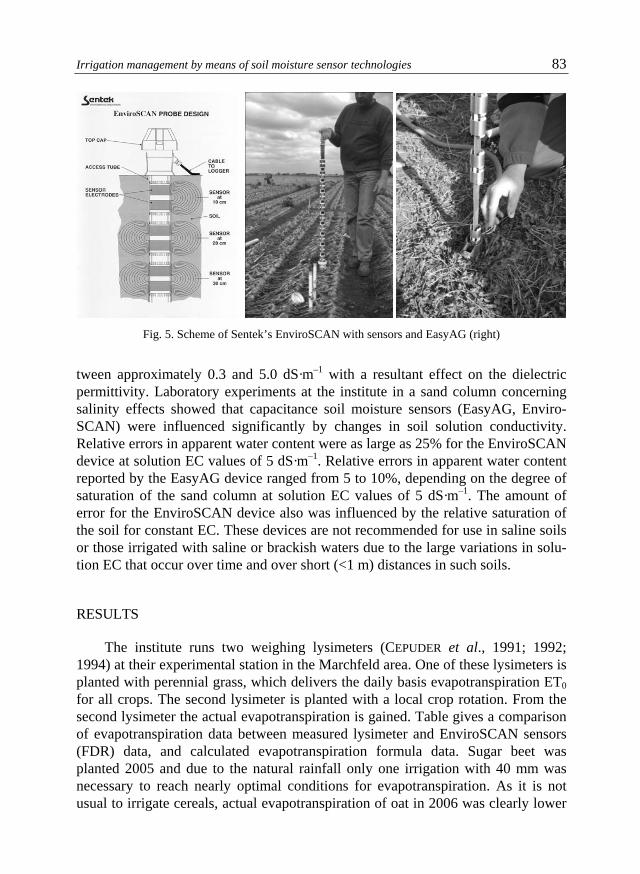
Both systems use a capacitance-sensor technology (FDR – Frequency Domain Reflectometry) for managing irrigation. This technology makes it possible to study the effective depth of root activity and water uptake in the root zone, respectively. The probe consists of several sensors, which are located in an access tube in differ-ent depths and which measure the moisture of the soil (Fig. 5). The EnviroSCAN sensors can be fixed on a rod in user-defined distances. Depending on the root sys-tems of the crops, the sensors are installed in depths from 10 cm up to 100 cm, whereas the deepest sensor is used to avoid or control deep percolation. The sen-sors at the EasyAG probe are fixed at 10, 20, 30 and 50 cm soil depth.
One dielectric sensor consists of a pair of electrodes (circular metal rings) connected to an oscillator. The probe is inserted into a PVC access tube, which has to be installed in the field. When the probe is activated (using radio frequencies), the soil-water-air matrix around the PVC tube forms the dielectric of a capacitor, which then completes an oscillating circuit. Changes in soil water content cause a shift in frequency. For the capacitive method (FDR) it is extremely critical to have good sensor-tube-soil contact for reliable estimation of soil moisture (CAMP-BELL, 1990; PALTINEANU and STARR, 1997).
Furthermore, the relationship between the change in the response and the soil water content depends on the soil type and the frequency range of the apparatus, because the dielectric permittivity is not only related to the water content. In agri-culture, the bulk electrical conductivity due to salt content in soil can range be-
Irrigation management by means of soil moisture sensor technologies 83
Fig. 5. Scheme of Sentek’s EnviroSCAN with sensors and EasyAG (right)
tween approximately 0.3 and 5.0 dS·m–1 with a resultant effect on the dielectric permittivity. Laboratory experiments at the institute in a sand column concerning salinity effects showed that capacitance soil moisture sensors (EasyAG, Enviro-SCAN) were influenced significantly by changes in soil solution conductivity. Relative errors in apparent water content were as large as 25% for the EnviroSCAN device at solution EC values of 5 dS·m–1. Relative errors in apparent water content reported by the EasyAG device ranged from 5 to 10%, depending on the degree of saturation of the sand column at solution EC values of 5 dS·m–1. The amount of error for the EnviroSCAN device also was influenced by the relative saturation of the soil for constant EC. These devices are not recommended for use in saline soils or those irrigated with saline or brackish waters due to the large variations in solu-tion EC that occur over time and over short (<1 m) distances in such soils.
RESULTS
The institute runs two weighing lysimeters (CEPUDER et al., 1991; 1992; 1994) at their experimental station in the Marchfeld area. One of these lysimeters is planted with perennial grass, which delivers the daily basis evapotranspiration ET0 for all crops. The second lysimeter is planted with a local crop rotation. From the second lysimeter the actual evapotranspiration is gained. Table gives a comparison of evapotranspiration data between measured lysimeter and EnviroSCAN sensors (FDR) data, and calculated evapotranspiration formula data. Sugar beet was planted 2005 and due to the natural rainfall only one irrigation with 40 mm was necessary to reach nearly optimal conditions for evapotranspiration. As it is not usual to irrigate cereals, actual evapotranspiration of oat in 2006 was clearly lower
84 P. CEPUDER, R. NOLZ
than grass evapotranspiration. Calculation of evapotranspiration by enviroSCAN sensors (FDR) installed in the two weighing lysimeters showed little lower results compared with the lysimeter data. The calculation of potential evapotranspiration with the Blaney-Criddle-formula (B&C) showed viable results, whereas Penman-Monteith (PenMon) overestimated evapotranspiration for the research area. Out of this it can be concluded that the measured evapotranspiration data gained by Envi-roSCAN sensors (FDR) deliver good data for irrigation management.
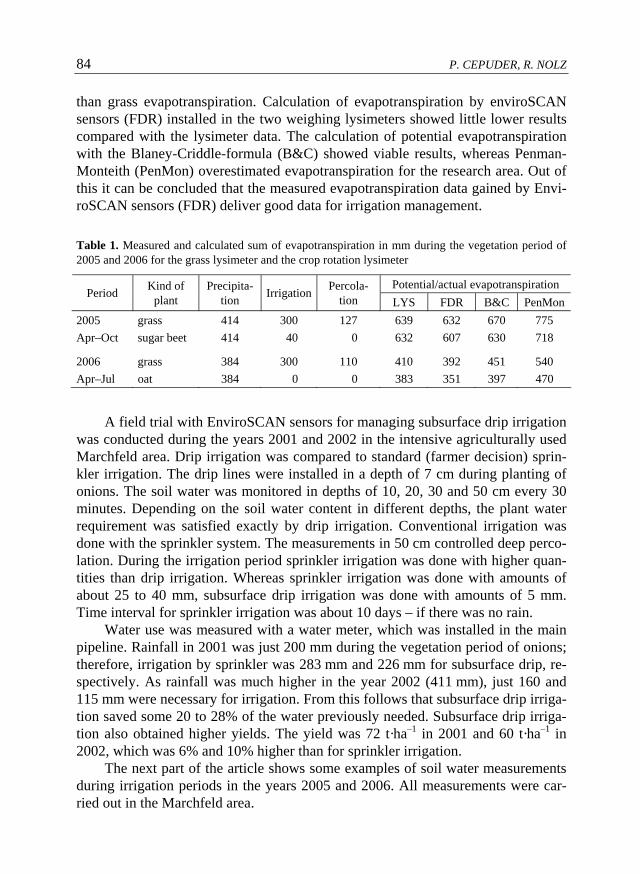
Table 1. Measured and calculated sum of evapotranspiration in mm during the vegetation period of 2005 and 2006 for the grass lysimeter and the crop rotation lysimeter
Potential/actual evapotranspiration Period Kind of
plant Precipita-
tion Irrigation Percola-tion LYS FDR B&C PenMon
2005 grass 414 300 127 639 632 670 775 Apr–Oct sugar beet 414 40 0 632 607 630 718
2006 grass 384 300 110 410 392 451 540 Apr–Jul oat 384 0 0 383 351 397 470
A field trial with EnviroSCAN sensors for managing subsurface drip irrigation was conducted during the years 2001 and 2002 in the intensive agriculturally used Marchfeld area. Drip irrigation was compared to standard (farmer decision) sprin-kler irrigation. The drip lines were installed in a depth of 7 cm during planting of onions. The soil water was monitored in depths of 10, 20, 30 and 50 cm every 30 minutes. Depending on the soil water content in different depths, the plant water requirement was satisfied exactly by drip irrigation. Conventional irrigation was done with the sprinkler system. The measurements in 50 cm controlled deep perco-lation. During the irrigation period sprinkler irrigation was done with higher quan-tities than drip irrigation. Whereas sprinkler irrigation was done with amounts of about 25 to 40 mm, subsurface drip irrigation was done with amounts of 5 mm. Time interval for sprinkler irrigation was about 10 days – if there was no rain.
Water use was measured with a water meter, which was installed in the main pipeline. Rainfall in 2001 was just 200 mm during the vegetation period of onions; therefore, irrigation by sprinkler was 283 mm and 226 mm for subsurface drip, re-spectively. As rainfall was much higher in the year 2002 (411 mm), just 160 and 115 mm were necessary for irrigation. From this follows that subsurface drip irriga-tion saved some 20 to 28% of the water previously needed. Subsurface drip irriga-tion also obtained higher yields. The yield was 72 t·ha–1 in 2001 and 60 t·ha–1 in 2002, which was 6% and 10% higher than for sprinkler irrigation.
The next part of the article shows some examples of soil water measurements during irrigation periods in the years 2005 and 2006. All measurements were car-ried out in the Marchfeld area.
Irrigation management by means of soil moisture sensor technologies 85
During 2005 two experiments were done on fields planted with sugar beets and baby carrots. In each field two rods with sensors down to 80 cm soil depth were installed. The climate of the area is temperate, continental; cold winters with frequent rain; cool summers with occasional showers. Precipitation and irrigation was measured and soil water data were stored every hour. Soil type is a deep Cher-nozem. According to USDA classification, soil was loamy silt or sandy loam down to 60 cm depth and sandy silt from 60 to 100 cm depth.
For the irrigation management field capacity for main root soil depth was cal-culated from texture with pedotransfer functions and onset of stress (start of irriga-tion) was estimated. For the sugar beet soil, field capacity is 160 mm and onset of stress is 100 mm. Regarding a buffer of 20% for rainfall, maximum storage capac-ity for irrigation was set at approximately 45 mm. Field capacity in the soil for baby carrots is 109 mm for a main root depth of 40 cm, and start for irrigation was set at 70 mm. Maximum allowed irrigation amount was 35 mm.
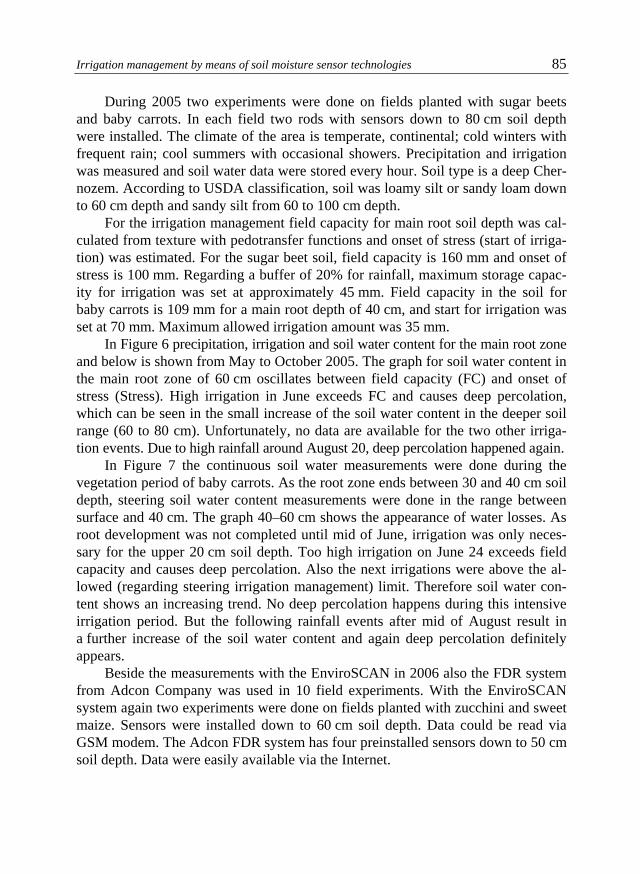
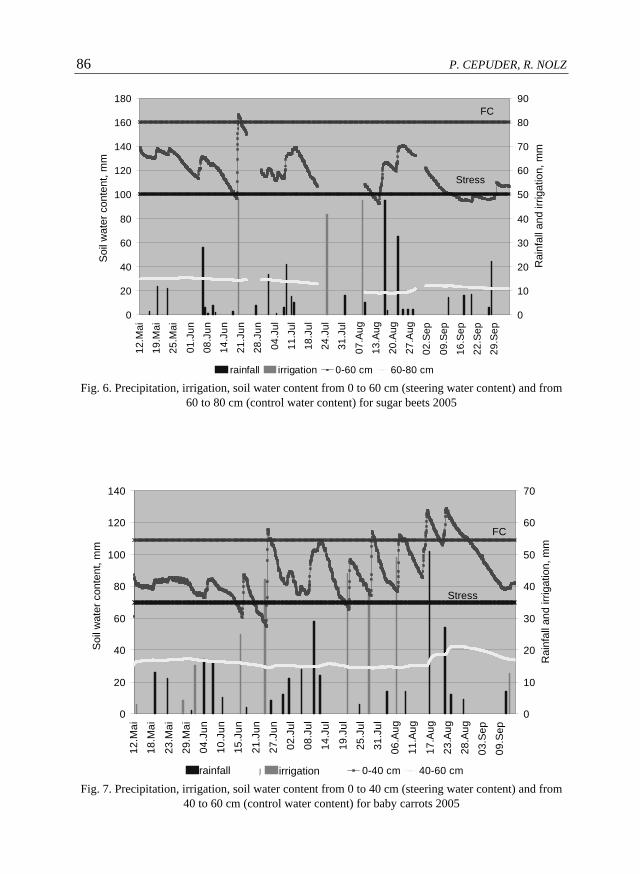
In Figure 6 precipitation, irrigation and soil water content for the main root zone and below is shown from May to October 2005. The graph for soil water content in the main root zone of 60 cm oscillates between field capacity (FC) and onset of stress (Stress). High irrigation in June exceeds FC and causes deep percolation, which can be seen in the small increase of the soil water content in the deeper soil range (60 to 80 cm). Unfortunately, no data are available for the two other irriga-tion events. Due to high rainfall around August 20, deep percolation happened again.
In Figure 7 the continuous soil water measurements were done during the vegetation period of baby carrots. As the root zone ends between 30 and 40 cm soil depth, steering soil water content measurements were done in the range between surface and 40 cm. The graph 40–60 cm shows the appearance of water losses. As root development was not completed until mid of June, irrigation was only neces-sary for the upper 20 cm soil depth. Too high irrigation on June 24 exceeds field capacity and causes deep percolation. Also the next irrigations were above the al-lowed (regarding steering irrigation management) limit. Therefore soil water con-tent shows an increasing trend. No deep percolation happens during this intensive irrigation period. But the following rainfall events after mid of August result in a further increase of the soil water content and again deep percolation definitely appears.
Beside the measurements with the EnviroSCAN in 2006 also the FDR system from Adcon Company was used in 10 field experiments. With the EnviroSCAN system again two experiments were done on fields planted with zucchini and sweet maize. Sensors were installed down to 60 cm soil depth. Data could be read via GSM modem. The Adcon FDR system has four preinstalled sensors down to 50 cm soil depth. Data were easily available via the Internet.
86 P. CEPUDER, R. NOLZ
0
20
40
60
80
100
120
140
160
180
12.M
ai
19.M
ai25
.Mai
01.J
un08
.Jun
14.J
un
21.J
un28
.Jun
04.J
ul11
.Jul
18.J
ul24
.Jul
31.J
ul
07.A
ug13
.Aug
20.A
ug27
.Aug
02.S
ep
09.S
ep16
.Sep
22.S
ep29
.Sep
soil
wat
er c
onte
nt m
m
0
10
20
30
40
50
60
70
80
90
rain
fall
and
irrig
atio
n m
m
60-80 cm
FC
Stress
Rai
nfal
l and
irrig
atio
n, m
m
Soi
l wat
er c
onte
nt, m
m
rainfall irrigation 0-60 cm Fig. 6. Precipitation, irrigation, soil water content from 0 to 60 cm (steering water content) and from
60 to 80 cm (control water content) for sugar beets 2005
0
20
40
60
80
100
120
140
12.M
ai
18.M
ai
23.M
ai
29.M
ai
04.J
un
10.J
un
15.J
un
21.J
un
27.J
un
02.J
ul
08.J
ul
14.J
ul
19.J
ul
25.J
ul
31.J
ul
06.A
ug
11.A
ug
17.A
ug
23.A
ug
28.A
ug
03.S
ep
09.S
ep
0
10
20
30
40
50
60
70
rain
fall
and
irrig
atio
n m
soil
wat
er c
onte
nt m
m
m
40-60 cm
FC
Stress
Soi
l wat
er c
onte
nt, m
m
Rai
nfal
l and
irrig
atio
n, m
m
Niederschlagrainfall Bewässerung 0-40 cmirrigation Fig. 7. Precipitation, irrigation, soil water content from 0 to 40 cm (steering water content) and from
40 to 60 cm (control water content) for baby carrots 2005
Irrigation management by means of soil moisture sensor technologies 87
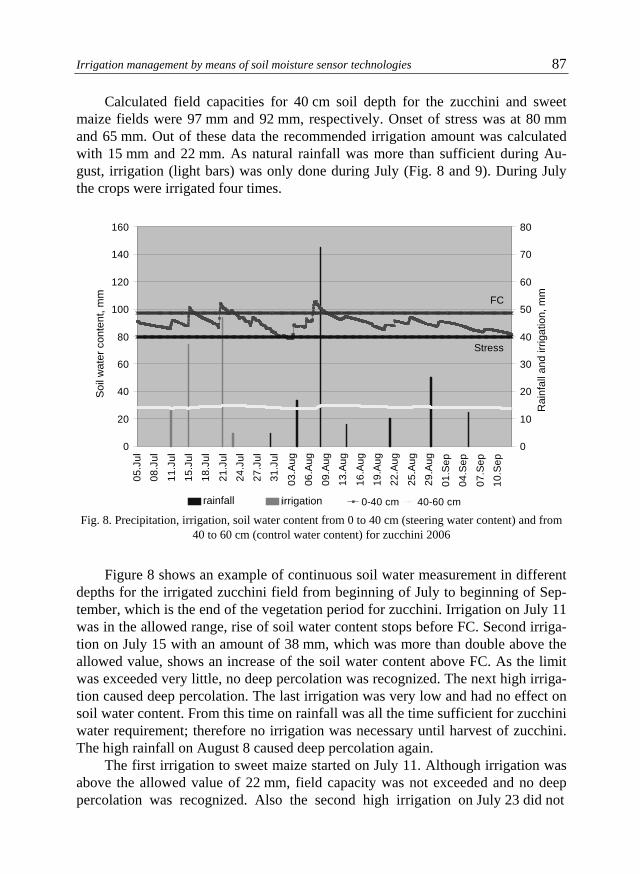
Calculated field capacities for 40 cm soil depth for the zucchini and sweet maize fields were 97 mm and 92 mm, respectively. Onset of stress was at 80 mm and 65 mm. Out of these data the recommended irrigation amount was calculated with 15 mm and 22 mm. As natural rainfall was more than sufficient during Au-gust, irrigation (light bars) was only done during July (Fig. 8 and 9). During July the crops were irrigated four times.
0
20
40
60
80
100
120
140
160
05.J
ul
08.J
ul
11.J
ul
15.J
ul
18.J
ul
21.J
ul
24.J
ul
27.J
ul
31.J
ul
03.A
ug
06.A
ug
09.A
ug
13.A
ug
16.A
ug
19.A
ug
22.A
ug
25.A
ug
29.A
ug
01.S
ep
04.S
ep
07.S
ep
10.S
ep
0
10
20
30
40
50
60
70
80
Rai
nfal
l and
irrig
atio
n m
Soi
l wat
er c
onte
nt m
mS
oil w
ater
con
tent
, mm
mR
ainf
all a
nd ir
rigat
ion,
mm
40-60 cm
FC
Stress
Niederschlagrainfall Bewässerungirrigation 0-40 cm Fig. 8. Precipitation, irrigation, soil water content from 0 to 40 cm (steering water content) and from
40 to 60 cm (control water content) for zucchini 2006
Figure 8 shows an example of continuous soil water measurement in different depths for the irrigated zucchini field from beginning of July to beginning of Sep-tember, which is the end of the vegetation period for zucchini. Irrigation on July 11 was in the allowed range, rise of soil water content stops before FC. Second irriga-tion on July 15 with an amount of 38 mm, which was more than double above the allowed value, shows an increase of the soil water content above FC. As the limit was exceeded very little, no deep percolation was recognized. The next high irriga-tion caused deep percolation. The last irrigation was very low and had no effect on soil water content. From this time on rainfall was all the time sufficient for zucchini water requirement; therefore no irrigation was necessary until harvest of zucchini. The high rainfall on August 8 caused deep percolation again.
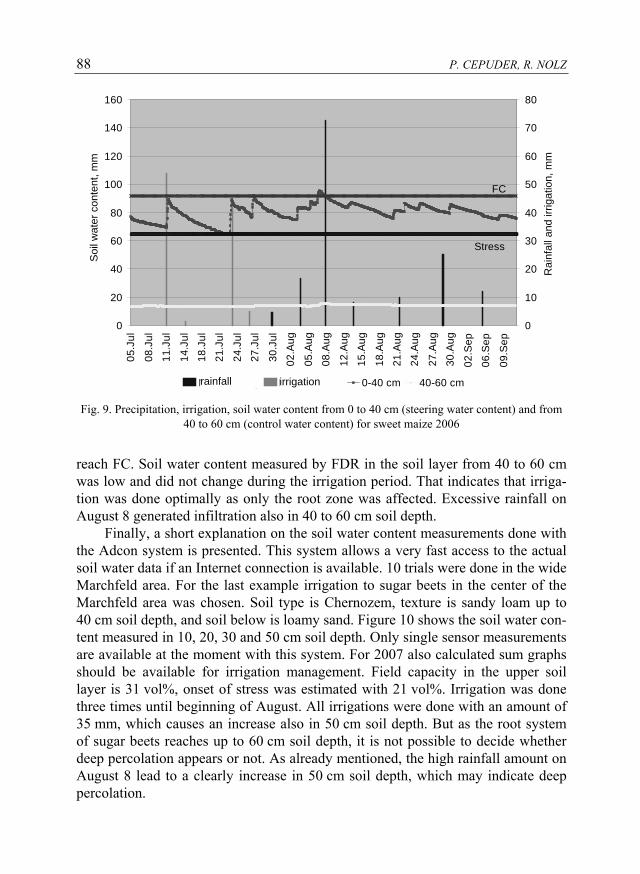
The first irrigation to sweet maize started on July 11. Although irrigation was above the allowed value of 22 mm, field capacity was not exceeded and no deep percolation was recognized. Also the second high irrigation on July 23 did not
88 P. CEPUDER, R. NOLZ
0
20
40
60
80
100
120
140
160
05.J
ul
08.J
ul
11.J
ul
14.J
ul18
.Jul
21.J
ul
24.J
ul27
.Jul
30.J
ul
02.A
ug
05.A
ug08
.Aug
12.A
ug
15.A
ug
18.A
ug21
.Aug
24.A
ug
27.A
ug
30.A
ug
02.S
ep
06.S
ep
09.S
ep
Soi
l wat
er c
onte
nt m
m
0
10
20
30
40
50
60
70
80
Rai
nfal
l and
irrig
atio
n m
m
Niederschlag Bewässerung 0-40 cm 40-60 cm
FC
Stress
Soi
l wat
er c
onte
nt, m
m
Rai
nfal
l and
irrig
atio
n, m
m
rainfall irrigation
Fig. 9. Precipitation, irrigation, soil water content from 0 to 40 cm (steering water content) and from 40 to 60 cm (control water content) for sweet maize 2006
reach FC. Soil water content measured by FDR in the soil layer from 40 to 60 cm was low and did not change during the irrigation period. That indicates that irriga-tion was done optimally as only the root zone was affected. Excessive rainfall on August 8 generated infiltration also in 40 to 60 cm soil depth.
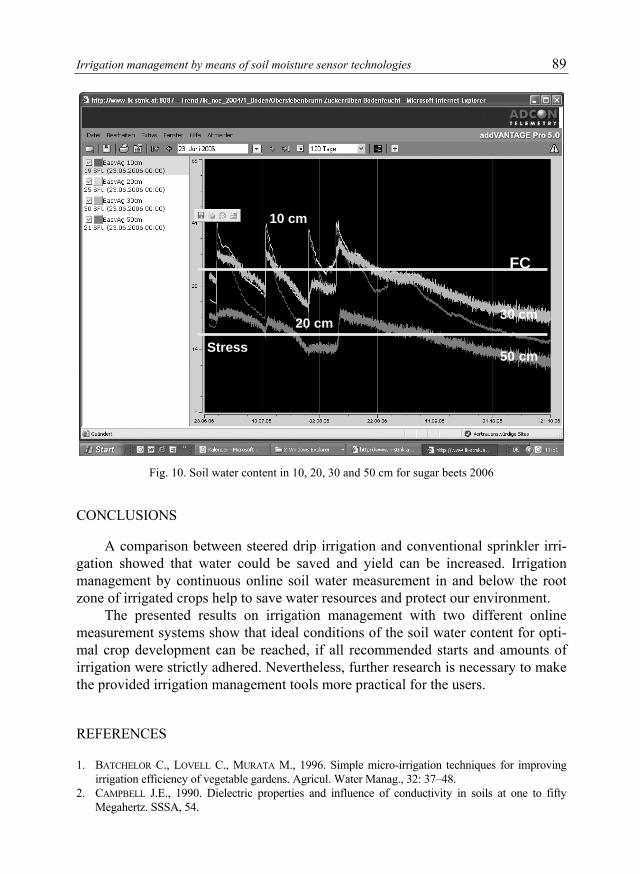
Finally, a short explanation on the soil water content measurements done with the Adcon system is presented. This system allows a very fast access to the actual soil water data if an Internet connection is available. 10 trials were done in the wide Marchfeld area. For the last example irrigation to sugar beets in the center of the Marchfeld area was chosen. Soil type is Chernozem, texture is sandy loam up to 40 cm soil depth, and soil below is loamy sand. Figure 10 shows the soil water con-tent measured in 10, 20, 30 and 50 cm soil depth. Only single sensor measurements are available at the moment with this system. For 2007 also calculated sum graphs should be available for irrigation management. Field capacity in the upper soil layer is 31 vol%, onset of stress was estimated with 21 vol%. Irrigation was done three times until beginning of August. All irrigations were done with an amount of 35 mm, which causes an increase also in 50 cm soil depth. But as the root system of sugar beets reaches up to 60 cm soil depth, it is not possible to decide whether deep percolation appears or not. As already mentioned, the high rainfall amount on August 8 lead to a clearly increase in 50 cm soil depth, which may indicate deep percolation.
Irrigation management by means of soil moisture sensor technologies 89
10 cm
FC
Stress 50 cm
30 cm 20 cm
Fig. 10. Soil water content in 10, 20, 30 and 50 cm for sugar beets 2006
CONCLUSIONS
A comparison between steered drip irrigation and conventional sprinkler irri-gation showed that water could be saved and yield can be increased. Irrigation management by continuous online soil water measurement in and below the root zone of irrigated crops help to save water resources and protect our environment.
The presented results on irrigation management with two different online measurement systems show that ideal conditions of the soil water content for opti-mal crop development can be reached, if all recommended starts and amounts of irrigation were strictly adhered. Nevertheless, further research is necessary to make the provided irrigation management tools more practical for the users.
REFERENCES
1. BATCHELOR C., LOVELL C., MURATA M., 1996. Simple micro-irrigation techniques for improving irrigation efficiency of vegetable gardens. Agricul. Water Manag., 32: 37–48.
2. CAMPBELL J.E., 1990. Dielectric properties and influence of conductivity in soils at one to fifty Megahertz. SSSA, 54.
90 P. CEPUDER, R. NOLZ
3. CEPUDER P., SUPERSBERG H., 1991. Erfahrungen mit der Lysimeteranlage Groß-Enzersdorf. Bundes-anstalt für alpenländische Landwirtschaft, BAL – Bericht.
4. CEPUDER P., 1992. Lysimeteranlage Groß-Enzersdorf, Ergebnisse 1990 und 1991. Bundesanstalt für alpenländische Landwirtschaft, BAL – Bericht.
5. CEPUDER P., 1994. Lysimeter in Österreich. Bundesanstalt für alpenländische Landwirtschaft, BAL – Bericht.
6. CEPUDER P., 2004. Soil water content monitoring for irrigation. Forstliche Schriftenreihe, 18. Uni-versität für Bodenkultur, Wien: 46–52.
7. PALINEANU I.C., STARR J.L., 1997. Real-time soil water dynamics using mulitsensor capacitance probes: Laboratory calibration. Soil Sci. Soc. Am. J., 61: 1576–1585.
STRESZCZENIE
Sterowanie nawodnieniami za pomocą technologii czujników wilgotności gleby
Słowa kluczowe: czujniki FDR, sterowanie nawodnieniami
W pracy omówiono tematykę ciągłego pomiaru uwilgotnienia gleby z wyko-rzystaniem najnowszej technologii informatycznej. Podano zarówno podstawy teo-retyczne, jak też zagadnienia praktyczne. Opisana technologia polega na zastoso-waniu reflektometrów w domenie częstotliwości FDR – wilgotnościomierzy wyko-rzystujących pomiar pojemności elektrycznej. Urządzenie to umożliwia sterowanie nawodnieniami oraz ciągłe monitorowanie ilości wody magazynowanej w danym czasie w profilu glebowym na określonej głębokości (zasięg 0–80 cm).
Przedstawiono wieloletnie wyniki doświadczeń polowych w Austrii, uzyskane na obiektach, na których stosowano metodę sterowania nawodnieniami upraw po-lowych oraz warzyw w latach 2001–2006. Omówiono dwa różne systemy monito-rowania wilgotności gleby w celu sterowania nawodnieniami: – Sentek EnviroScan: dane mogą być ładowane w trybie odbioru (do własnego
komputera) lub przez modem GSM – ten system wykorzystano w uprawie cebu-li, cukinii, kukurydzy pastewnej, marchwi oraz buraków cukrowych;
– Przekaźnik typu Adcon – zastosowany w uprawie ziemniaków, buraków cukro-wych, cebuli, marchwi drobnej oraz fasoli, z czujnikami EasyAG-Sentek umieszczonymi na głębokości 10, 20, 30 i 50 cm.
Badania udowodniły, że można zmniejszyć straty wody w nawodnieniach rol-niczych dzięki ciągłemu monitorowaniu uwilgotnienia gleby na kilku głęboko-ściach.
Received 05.10.2007
Reviewers: Dr. Antoni Kuźniar Prof. Waldemar Treder