irreducible water saturation from capillary pressure and
TRANSCRIPT

Oil & Gas Science and Technology – Rev. IFP, Vol. 63 (2008), No. 2, pp. 203-217Copyright © 2007, Institut français du pétroleDOI: 10.2516/ogst:2007066
Irreducible Water Saturation from Capillary Pressure
and Electrical Resistivity MeasurementsA.M. Attia1, D. Fratta2 and Z. Bassiouni3
1 Suez Canal University, Petroleum Engineering, Suez 43721 - Egypt2 University of Wisconsin-Madison, Geological Engineering Program, Madison, WI 53706 - USA
3 Louisiana State University, Petroleum Engineering, Baton Rouge, LA 70803 - USAe-mail: [email protected] - [email protected] - [email protected]
Résumé — Estimation de la saturation irréductible en eau à partir de la pression capillaire et des mesures de la résistivité électrique — Cet article présente les résultats de mesures de la pressioncapillaire et de la résistance électrique de trois types de roches : le sable argileux (Berea), le quartz et lecalcaire. Nous rapportons également des données expérimentales pour l’indice de résistivité, le facteur deformation, la tortuosité, la pression capillaire et les exposants de saturation en eau de ces roches dans lesystème air/saumure. Les données de résistivité électrique sont évaluées par la loi d’Archie modifiée. Les résultats des mesures de la pression capillaire et de la résistivité électrique en fonction de la saturation ensaumure montrent l’existence de deux saturations irréductibles en eau correspondant à deux phénomènesphysiques différents. Les deux valeurs des saturations irréductibles forment des limites hautes et bassesqui peuvent être utilisées pour estimer la capacité de la production d’un milieu poreux. L’analysedétaillée des données a aussi montré un changement de valeur de l’exposant de saturation. Ce change-ment pourrait également être observé à la saturation irréductible en saumure obtenu lors des mesures depression capillaire.
Abstract — Irreducible Water Saturation from Capillary Pressure and Electrical ResistivityMeasurements — This paper presents the results of capillary pressure and electrical resistivity measure-ments for three kinds of core specimens: Berea sandstone, Quartz and Limestone. Experimental data ofresistivity index, formation resistivity factor, tortuosity, capillary pressure, and water saturation exponent in the air/brine system for these cores are reported. The electrical resistivities data are evaluated using the modified Archie’s law. Capillary pressure and electrical resistivity versus brine satu-ration results show the existence of two irreducible water saturations corresponding to two differentphysical phenomena. The two values of irreducible brine saturations yield upper and lower limits thatcan be used to estimate the production capacity of porous media. The detailed analysis of the data hasalso shown a change in the value of the saturation exponent. This change would be also be observed atthe irreducible brine saturation as obtained with capillary pressure data.

Oil & Gas Science and Technology – Rev. IFP, Vol. 63 (2008), No. 2
INTRODUCTION
Capillary pressure is an important property used in the evalua-tion of pore fluid distributions, particularly in the transitionzone between wetting and non-wetting phases (water to oil orgas in reservoir formations). This property is important in theevaluation of oil recovery processes. Also it can be used eitherto calculate oil reserves or to simulate reservoir behavior usingcomputer modeling techniques. The capillary pressure curvesalso provide data on the irreducible water saturation of a reser-voir rock and the entry pressure of the reservoir rock.
Capillary pressure curves are difficult to measure in thefield. However, some of the parameters controlling the devel-opment of capillary pressure curves may be evaluated fromelectrical resistivity measurements. Therefore geophysicaltechniques can be used to estimate the electrical resistivityand the needed petrophysical properties related to wettability,interfacial tension, fluid saturation history, pore size distribu-tion and pore geometry.
This paper presents experimental results obtained fromporous plate and two electrode resistivity measurements. Theelectrical resistivities versus brine saturation data for all coresare evaluated using the modified Archie’s law. The results ofcementation factor, saturation exponent and tortuosity arerelated to the capillary pressure and electrical resistivity measurements.
1 PETROPHYSICAL PARAMETERS
Petrophysical parameters relate different types of flows:hydraulic, electrical, thermal, chemical, etc. As all types offlows follow similar laws, the parameter that may control oneusually controls another (Wang and Anderson, 1992; Mitchell,1993; Santamarina and Fratta, 2003). For these reasons, geo-physical techniques that measure properties related to electricalflow are successfully used to evaluate hydraulic flow parame-ters. However, the interpretation of the results may be mislead-ing as there are inherent physical differences on the differenttypes of flows and these discrepancies cannot be ignored.
Conduction of electricity through porous media occurs bymainly two mechanisms: movement of ions through the bulksaturating electrolyte and by surface conduction of clay miner-als. In the case of porous media with coarse grains, tube-likeporous and percolating phases, the electrical resistivity of a formation ρf can be modeled as:
(1)
where ρmineral is the resistivity of the rock mineral, ρpore liquid
is the electrical resistivity of the pore fluid, ρpore gas is theresistivity of the pore gas, φ is the porosity. Sr is the degree ofpore liquid saturation. In most oil-bearing formation rocks,the rock mineral and pore gas are insulators.
One of the drawbacks of this formulation is that Equation 1fails to model the surface conduction in a formation. The effect of surface conductance in a formation can be esti-mated by adding a surface conduction term to Equation 1(Klein and Santamarina, 2003; Santamarina et al., 2001).Then, the resistivity of the formation becomes:
(2)
where Θ is the surface conduction, γmin is the mineral unitweight, g is the acceleration of gravity, and Ss is the specificsurface of the formation mineral.
Figure 1 shows the effect of porosity and surface conduc-tion on different saturated rock formations. This figure isbased in Equation 2, which in spite of its limitations yieldsboundaries to the evaluation of the different parameters. Theproper interpretation of this figure provides a solid base forthe analysis of geophysical studies. Furthermore, the electri-cal resistivity of a porous medium is also related to themicro-structural properties, including porosity, pore geome-try and surface morphology of the mineral grains lining thepores. Archie (1942) proposes the following semi-empiricalrelationship:
(3)
where a, m, and n are experimental determined factors.The factor a varies between 0.5 and 2.5. The factor m is
also known as the cementation factor and it varies between1.3 and 2.5 for most rocks. The cementation factor is 1.3 forunconsolidated, clean glass beads, 2 for sandstone formation,and around 5 for carbonates (Telford et al., 1990; Mavko etal., 1998).
Figure 1
Typical electrical resistivity trends for non-conductive andsaturated mineral rocks as modeled with Equation 2 (surfaceconduction Θ = 1.4⋅10-9 S).
φ = 0.1φ = 0.3φ = 0.5
106
105
104
103
102
101
100
106105104103102101100
sea water fresh water de-ionized water
Pore fluid electrical resistivity ρpore liquid (Ωm)
Por
ous
med
ia e
lect
rical
res
istiv
ity ρ
f (Ω
m)
Controlled by porefluid resistivity
Clays and shales
ρf = ρpore fluid
Sands andsandstones
Controlled bysurface conduction
Ss = 1 m2/gr
Ss = 20 m2/gr
Ss = 1000 m2/g
ρ φ ρ= − −a Smr
nf
ρρ
φ φγ
ρf
pore liquid
r s pore gasSg
S=
+ −( )1 Θ min
1 1 1
ρφ
ρφ
ρ
φ
ρf mineral
r
pore liquid
r
pore
S S=
−+ +
−( )ggas
204
AM Attia et al. / Irreducible Water Saturation from Capillary Pressure and Electrical Resistivity Measurements
The factor n is known as the water saturation exponentand it has been related to several petrophysical parameters.Typically, its value is around 2 in water-wet formations andit is assumed constant for clean, sandy like formations(Archie, 1942; Mavko et al., 1998). Lewis et al. (1988),Longeron et al. (1989a, b), Donaldson and Siddiqui (1989),and Moss et al. (2000) found that the saturation exponent nincreases to values as high as ten in oil wet formations.Furthermore, Diederix (1982), Anderson (1986), Longeron etal. (1989a, b), and Worthington and Pallat (1992) found thatthe saturation exponent is not always constant over the wholesaturation range in disagreement with the early work byArchie (1942).
The formation resistivity factor FR, is the ratio betweenthe resistivity, ρo, of the rock at 100% saturated with con-ducting brine to the resistivity ρpore liquid of this brine. Thisratio depends on the lithological characteristics of the rockformation and the effective porosity. The formation resistiv-ity factor is sometimes expressed as function of the percola-tion porosity φo that is the minimum porosity that connectsthe pores in a rock formation:
(4)
The resistivity index IR is expressed by Archie (1942) as:
(5)
Swanson (1985) found that the resistivity-saturation plotshows a change in the slope at a saturation point where thecorresponding capillary pressure curve indicate a transitionfrom macroporosity to microporosity.
Finally, tortuosity is defined as the ratio of the ionic pathLi over the distance between the electrodes LR. alternatively,according to Tiab and Donaldson (1996), tortuosity isdefined as:
(6)
where φtrapped and φchannel are porosities that correspond to theporosity of the trapped fluid that does not contribute to electrical conduction and to the porosity of the fluid that contributes to the conduction. In addition, Attia (2005) foundthat the tortuosity factor is affected by porosity, cementationfactor and degree of brine saturation.
2 EXPERIMENTAL TESTS
This paper presents petrophysical properties of eight Bereasandstone, twelve Quartz and ten Limestone rock specimens.The experimental results were obtained using 5% NaCl brinesolutions. The petrophysical properties of the specimens aretabulated in Tables 1 through 4. During the experimental test-ing program the following petrophysical parameters weredetermined for each specimen: pore size distribution, satura-tion versus capillary pressure curves, and electrical resistivityversus saturation curves. These data are obtained using twomeasurement techniques:– porous plate– impedance measurement methods
These two methodologies permit the evaluation of processof de-saturation of rock cores and the behavior of the watersaturation exponent n. The description of testing procedure isas follows.
2.1 Porous Plate Method
The porous plate method was used to measure the capillarypressure-saturation curves for different types of core specimens(Berea sandstone, Quartz and Limestone) with 5% NaCl brinesolution. The procedure has several steps, including:– Porous plate saturation: the procedure indicated in the
manual “Soil Moisture Capillary Pressure Cell” manual(Core Lab Instruments, 2000) is used to fully saturate theporous stone saturation.
– Core specimen preparation: the core specimens aremeasured, cleaned, dried, weighed, and saturated with theNaCl brine solution. After the saturation process is
τφ
φφ φ
φ= + = +
−1 1trapped
channel
m
m
ρ
ρf
R rnI S
0
= = −
FR om= −( )−φ φ
205
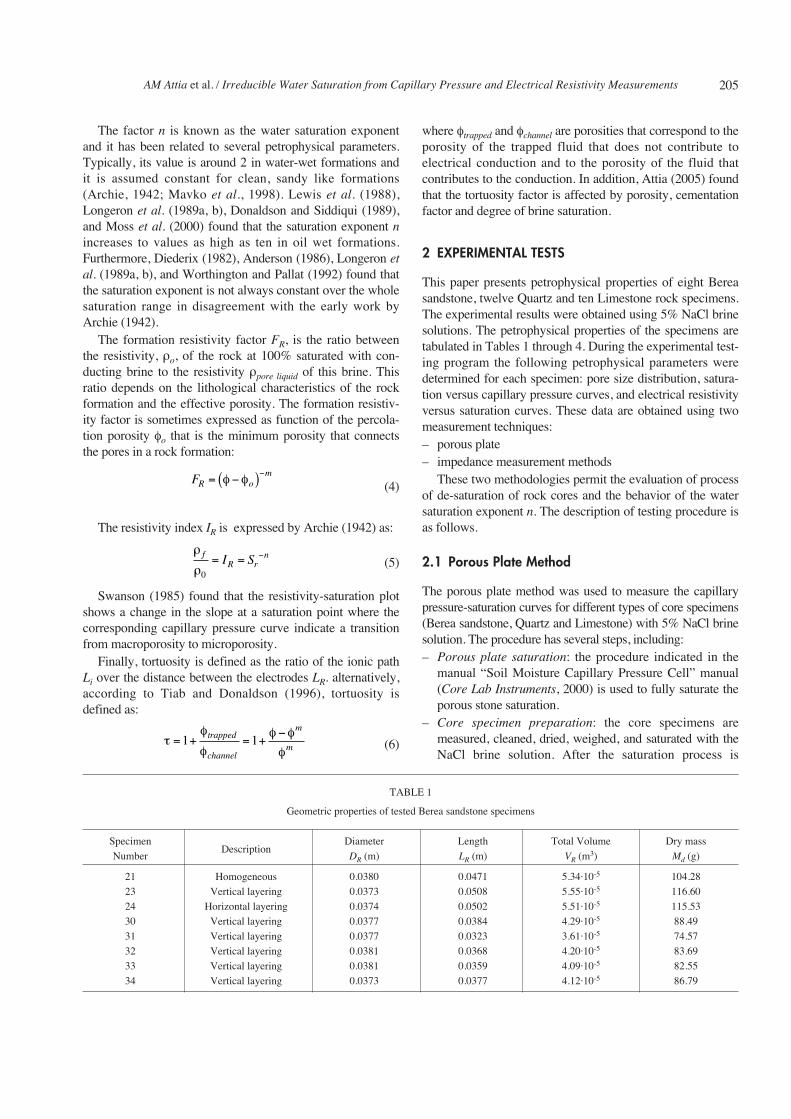
TABLE 1
Geometric properties of tested Berea sandstone specimens
SpecimenDescription
Diameter Length Total Volume Dry mass
Number DR (m) LR (m) VR (m3) Md (g)
21 Homogeneous 0.0380 0.0471 5.34⋅10-5 104.28
23 Vertical layering 0.0373 0.0508 5.55⋅10-5 116.60
24 Horizontal layering 0.0374 0.0502 5.51⋅10-5 115.53
30 Vertical layering 0.0377 0.0384 4.29⋅10-5 88.49
31 Vertical layering 0.0377 0.0323 3.61⋅10-5 74.57
32 Vertical layering 0.0381 0.0368 4.20⋅10-5 83.69
33 Vertical layering 0.0381 0.0359 4.09⋅10-5 82.55
34 Vertical layering 0.0373 0.0377 4.12⋅10-5 86.79

Oil & Gas Science and Technology – Rev. IFP, Vol. 63 (2008), No. 2206
completed the core specimens are re-weighed to determinethe porosity φ (Table 1).
– Testing procedure: with the core specimen placed on top ofthe porous plate, the air-brine capillary pressure procedureis ready to begin (Fig. 2). A certain air pressure pa isapplied to the top of the core specimen and the waterwithin the core specimen is allowed to drain through theporous stone. The capillary pressure pc is equal to the dif-ference between the air pressure and the water pressure.When equilibrium is achieved, the air pressure and the topof the cell are removed. Then the core specimen is weighedand the degree saturation is calculated at the applied capil-lary pressure pc. The specimen is returned to the cell andthe procedure is repeated for higher values of the capillarypressure pc. The capillary pressure versus saturation curve is obtained
and then used to estimate the pore size distribution.
Figure 2
Schematic of the capillary versus saturation cell (after CoreLab Instruments, 2000).
2.2 Impedance Measurements Method
An impedance analyzer Hewlett Packard 4279A LCZ meteris used to measure the electrical resistivity of the Berea sand-stone (Berea as example) core specimens under varyingdegrees of brine saturation. The LCZ meter is capable ofmeasuring inductance, capacitance, dissipation, quality fac-tor, impedance magnitude, and phase angle in equivalent par-allel and series circuits (Hewlett Packard, 1984). These mea-surements cover a frequency range from 100 Hz to 20 kHz.The HP 4297A model is controlled by a personal computervia an HP-IB card and the Agilent VEE Pro software. The
card and the software allow the digitalization of the data forthe analysis and interpretation of the measurement results.
Figure 3 presents a sketch of the testing setup, measurementsystem, and data collection system. The measurements includeimpedance magnitude and phase angle from 100 Hz to 20 kHzin steps of 100 Hz. The impedance analyzer is equipped withfour coaxial BNC connectors and with an HP 16047A TestFeature. This feature combines the high and low voltage andcurrent terminals and permits two terminal measurements ofthe electrical properties of the specimens. The two-terminalmeasurement method is a simple procedure to implement,however it has some drawbacks over competitive methods(i.e., four-electrode method – see for example Santamarina et al., 2001). One of the biggest drawbacks is the problem ofelectrode polarization. This phenomenon is explained next.
The measurement of the electrical resistivity of rock specimens involves the analysis of an equivalent electricalcircuit where the rock core specimen is in series with theelectrodes and the required peripheral electronics. The rockelectrode interface feels the movement of ions on the rockspecimen, and the movement of electrons on the electroniccircuit. At the interface, where the use blocking electrodes iscommon (i.e., electrodes that do not experience oxidation-reduction), ions accumulate at the interface causing electrodepolarization.
The phenomenon of electrode polarization may be modeled by adding a thin air-gap Lgap at the interfacebetween the electrode and the rock (Klein and Santamarina,1997). Consider a parallel plate capacitor with a specimen ofthickness LR and cross sectional area A (Fig. 4). The rock canbe represented as a resistor and a capacitor in parallel, witheffective electric resistivity ρR (Ωm) and dielectric permittivity εR (F/m). Then, the electrical impedance for theequivalent circuit Zeq is:
(7)
where Cgap = εoA/Lgap is the capacitance at the blocking electrodes, RR = ρRLR/A and CR = εRA/LR are the resistanceand capacitance of the core specimen, and A is the cross sec-tional area of the capacitor.
The results presented in Figure 5 show that the effects of electrode polarization become negligible with smaller separa-tion gap Lgap (Fig. 5a) and that the transition frequency issmaller with the greater rock resistivity ρR (Fig. 5a –Santamarina et al., 2001). Therefore, electrode polarizationeffects are not expected in high-frequency laboratory
Zj f C
Rj f C
A
L
j f
eqgap
RR
gap
= ++
=
1
2
11
2
1
2
π π
π
εερ
π εo
R
RR
L
j f+
+
⎡
⎣
⎢⎢⎢⎢
⎤
⎦
⎥⎥⎥⎥
12
Airpressure pa
Pressure cell
Drainage
Saturatedporous stone
Corespecimen
Seal
Fine powderor tissue

to HP-IP card
Rock corespecimen
Low current andvoltage terminals
Impedance Analyzer
HP 4297A
High curpent andvoltage terminals
Personal computer
A
Test Setup Equivalent Circuit
CoreSpecimen
Lgap
LR
LP
LC
HP
HC
CR RR
Cgap
Impe
danc
e an
alyz
er
10
100
1.108
1.107
1.106
1.105
1.104
1.103
100 1.1061.1051.1041.103
Frequency f (Hz)
Impe
danc
e Z
(Ω
)
Lgap = 10-9 mLgap = 10-6 mLgap = 10-3 m
a)
10
100
1.108
1.107
1.106
1.105
1.104
1.103
100 1.1061.1051.1041.103
Frequency f (Hz)
Impe
danc
e Z
(Ω
)
b)
ρR = 0.1 ΩmρR = 1 ΩmρR = 10 Ωm
Figure 5
Effect of electrode polarization on impedance measurement. a) Varying electrode Lgap for constant rock resistivity ρR = 1 Ωm; b) Varying rock resistivity for constant electrode gap Lgap = 10-6 m (LR = 0.0285 m, A = 6.4⋅10-4 m, εo = 8.85⋅10-12 F/m and εR = 20 εo).
Figure 4
Equivalent two-electrode circuit and the effect of blocking electrodes.
Figure 3
Sketch of the electrical resistivity measurement setup.
AM Attia et al. / Irreducible Water Saturation from Capillary Pressure and Electrical Resistivity Measurements 207

Oil & Gas Science and Technology – Rev. IFP, Vol. 63 (2008), No. 2208
measurements. However, due to specifications of the HPImpedance Analyzer, the range of measurement extend thelow frequency range, where electrode polarization dominatesthe impedance measurement unless the deportation gap Lgap isvery small or the resistivity of the measured material is high.
Two different types of electrodes are used in these measurements: Al foil and silver-based paint. The Al foilmay act as a blocking electrode if low rate of chemical reac-tion occurs. However the problem with the Al foil electrodesis that separation gap Lgap is about the same order of magni-tude as the sandstone grain size (D50 ≈ 0.1 mm) and this sepa-ration gap may change for different specimen and the appliednormal pressure. The silver paint electrodes have been usedin the past (see for example Longeron et al., 1989a). Theadvantage of this type of electrodes is that they reduce theseparation gap. Furthermore, the gap remains constantthroughout the testing series and it does not depend on thenormal pressure.
Figure 6 shows the measured impedance on Berea sand-stone core specimen 22 using the Al foil electrodes and sil-ver-based paint for different saturation Sr. It is clear that theAl foil electrode measurements are controlled by the effect ofelectrode polarization (Fig. 6a) while the silver-based paintelectrode measurement removes most of the effect of elec-trode polarization in the impedance response (Fig. 6b).Furthermore, the transition frequency is smaller when theresistivity of the specimen is greater, as observed by compar-ing side-by-side the two set of results. In light of these obser-vations the silver-based paint electrodes are selected for theelectrical resistivity measurements.
2.3 Description of Electrical Resistivity MeasurementMethodology
The core specimens are cleaned, dried in the oven, painted oneach side, evacuated, and then saturated with 5% NaCl brinesolution (ρpore liquid = 0.161 Ωm) by applying vacuum for 12hours to the submerged specimens. The specimens are thenremoved and their surfaces are dried with tissue paper. Thisaction renders the specimen saturated-surface dry. Then thespecimens are weighed to determine the degree of saturationand placed in the cell to measure the impedance. After eachmeasurement, the specimen is placed in a covered containerto stabilize its moisture content till the next set of measure-ment. This technique reduces the instability of the capillarypressure when the measurements are taken.
3 TESTS RESULTS
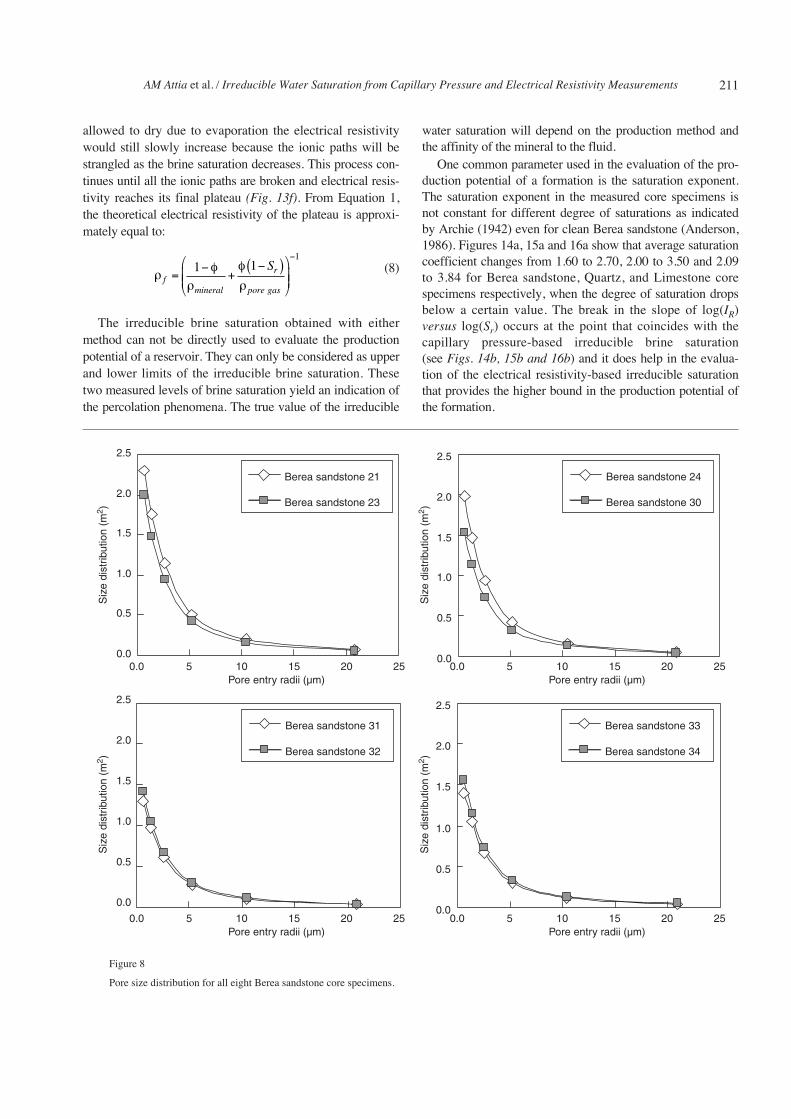
A set of different petrophysical properties are collected includ-ing capillary pressure curves (Fig. 7), pore size distribution(Fig. 8), and electrical resistivity versus degree of saturation(Fig. 9) for eight Berea sandstone core specimens. Figure 7shows that all specimens have similar capillary pressure satura-tion curves except for the Berea sandstone core specimen 21.All the other core specimens show that the irreducible watersaturation is nearly 0.33, while specimen 21 shows it to be0.23. This specimen is also the only one that shows no layering(Table 1). Furthermore, the pore size distribution also shows amarked difference in the characteristics of specimen 21 (Fig. 8). The average parameters for the Berea sandstone,Quartz (very fine grained) and Limestone specimens are summarized in Tables 2, 3 and 4 respectively.
Sr = 0.23Sr = 0.32
Sr = 0.54
Sr = 1.00
100000100001000100
Impe
danc
e Z
(Ω
)
102
103
104
105
a) Frequency f (Hz)
100000100001000100
Impe
danc
e Z
(Ω
)
102
103
104
105
b) Frequency f (Hz)
Sr = 0.15
Sr = 0.33
Sr = 0.35
Sr = 0.74
Sr = 0.78Sr = 1.00
Figure 6
Effect of type of electrode on the measurement of the impedance on Berea sandstone core specimen 22.a) Al foil electrodes; b) Silver-based paint electrodes. Electrode polarization controls the impedance measurement with the Al foil electrodes.

AM Attia et al. / Irreducible Water Saturation from Capillary Pressure and Electrical Resistivity Measurements 209
TABLE 2
Summary of porosity, tortuosity, ionic length, formation resistivity factor, cementation factor, and water saturation exponent for all tested Berea sandstone core specimens (Attia, 2005)
Specimen Porosity Tortuosity Ionic length Formation Cementation Water saturation
Number φ τ Li = LR√τ (m) resistivity factor FR factor exponent n
21 0.207 3.84 0.092 18.6 1.85 2.12
23 0.191 4.35 0.106 22.8 1.89 1.80
24 0.192 4.26 0.104 22.2 1.88 2.42
30 0.186 3.78 0.075 20.3 1.79 1.93
31 0.187 4.71 0.070 25.2 1.92 1.98
32 0.181 4.04 0.074 22.3 1.82 1.62
33 0.182 3.82 0.070 21.0 1.79 2.02
34 0.192 4.48 0.080 23.3 1.91 1.96
TABLE 3
Summary of porosity, quartz flour content, formation resistivity factor, and water saturation exponents for all tested Quartz sandstone core specimens(after Attia, 2005)
Specimen Porosity QuartzFormation Water saturation Water saturation
Number φ Flour (%)resistivity factor exponent n exponent n
FR (for Sr < 0.32) (for Sr > 0.32)
2 0.258 100 1.31 1.95 1.67
6 0.293 100 1.44 2.48 1.76
14 0.292 100 1.48 3.08 1.86
18 0.224 80 1.38 2.56 1.73
22 0.265 80 1.61 2.62 1.86
28 0.253 80 1.61 3.18 1.93
32 0.194 60 1.64 3.60 1.94
38 0.239 60 1.81 2.94 1.79
42 0.222 60 1.83 2.65 1.75
48 0.201 40 1.71 N/A 1.98
54 0.201 40 2.06 3.60 1.61
58 0.187 40 1.86 3.73 1.77
TABLE 4
Summary of porosity, tortuosity factor, formation resistivity factor, and water saturation exponents for all tested Limestone core specimens
Specimen Porosity Tortuosity Formation Water saturation Water saturation
Number φ τ resistivity factor FRexponent n exponent n
(for Sr < 0.68) (for Sr > 0.68)
1L 0.14 1.44 30.3 N/A N/A
2L 0.145 1.44 29.7 N/A N/A
3L 0.142 1.43 29.6 3.67 2.20
4L 0.143 1.44 30.1 3.36 1.97
5L 0.087 1.27 29.7 3.67 1.86
6L 0.143 1.43 29.4 3.70 2.14
18L 0.142 1.43 29.2 4.36 2.23
19L 0.143 1.45 31.2 4.55 2.29
20L 0.142 1.46 32.0 3.88 2.16
21L 0.158 1.49 31.2 1.41 3.01

Oil & Gas Science and Technology – Rev. IFP, Vol. 63 (2008), No. 2
4 DISCUSSION
The electrical resistivity and capillary pressure curves for theBerea sandstone, Quartz, and Limestone cores show similarbehavior: as the brine saturation decreases, the values of thepetrophysical parameters increase.
However, the point of irreducible brine saturation in thecapillary pressure curve differs from the point where there isa break in the electrical conductivity path (see Figs. 10-12).This difference is due to the different nature of the twoprocesses. The capillary pressure versus saturation curve isobtained by applying gas pressure to the brine phase until theair percolates through the porous matrix. This percolationpoint is the irreducible brine saturation. It is “irreducible”only in the sense that the air pressure cannot “push” the brineout beyond this point. Nevertheless, at the irreducible brinesaturation point, the electrolyte paths are still active and there
are no sudden changes in the electrical conduction behavior.The change in the electrical conduction only occurs at alower degree of saturation, when the conduction paths arebroken and the resistivity rapidly increases.
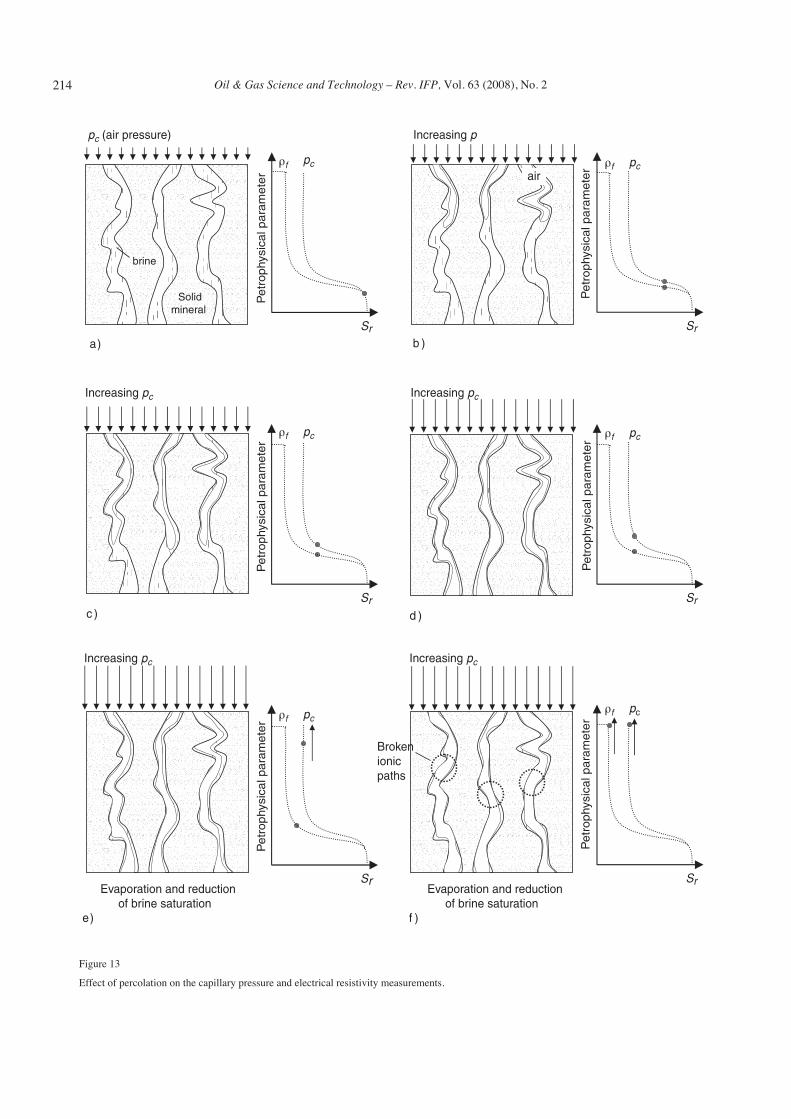
The observations presented in Figures 10 through 12 canbe clearly explained with the help of Figure 13. This figureshows the process of evacuation (drying) using the porousstone method. As the capillary pressure (air pressure)increases, it pushes the brine out of the porous mediumdecreasing the saturation and increasing the electrical resis-tivity of the medium (Figs. 13a-c). This process continuesuntil the air paths between the top and bottom of the specimen are continuous (Fig. 13d). At this point, the irreducible water saturation in the “capillary pressure sense”is reached. A further increase in the capillary pressure cannotremove anymore brine and the electrical resistivity shouldremain constant (Fig. 13e). However, if the medium is
210
0
50
100
150
200
250
300
0.0 0.2 0.4 0.6 0.8 1.0
Cap
illar
y pr
essu
re P
c (k
Pa)
Cap
illar
y pr
essu
re P
c (k
Pa)
Cap
illar
y pr
essu
re P
c (k
Pa)
Cap
illar
y pr
essu
re P
c (k
Pa)
0
50
100
150
200
250
300
0.0 0.2 0.4 0.6 0.8 1.0
0
50
100
150
200
250
300
0.0 0.2 0.4 0.6 0.8 1.0
Brine saturation Sr Brine saturation Sr
Brine saturation Sr Brine saturation Sr
0
50
100
150
200
250
300
0.0 0.2 0.4 0.6 0.8 1.0
Berea sandstone 21
Berea sandstone 23
Berea sandstone 31
Berea sandstone 32
Berea sandstone 24
Berea sandstone 30
Berea sandstone 33
Berea sandstone 34
Figure 7
Capillary pressure-brine saturation curves for all eight Berea sandstone core specimens.
AM Attia et al. / Irreducible Water Saturation from Capillary Pressure and Electrical Resistivity Measurements
allowed to dry due to evaporation the electrical resistivitywould still slowly increase because the ionic paths will bestrangled as the brine saturation decreases. This process con-tinues until all the ionic paths are broken and electrical resis-tivity reaches its final plateau (Fig. 13f). From Equation 1,the theoretical electrical resistivity of the plateau is approxi-mately equal to:
(8)
The irreducible brine saturation obtained with eithermethod can not be directly used to evaluate the productionpotential of a reservoir. They can only be considered as upperand lower limits of the irreducible brine saturation. Thesetwo measured levels of brine saturation yield an indication ofthe percolation phenomena. The true value of the irreducible
water saturation will depend on the production method andthe affinity of the mineral to the fluid.
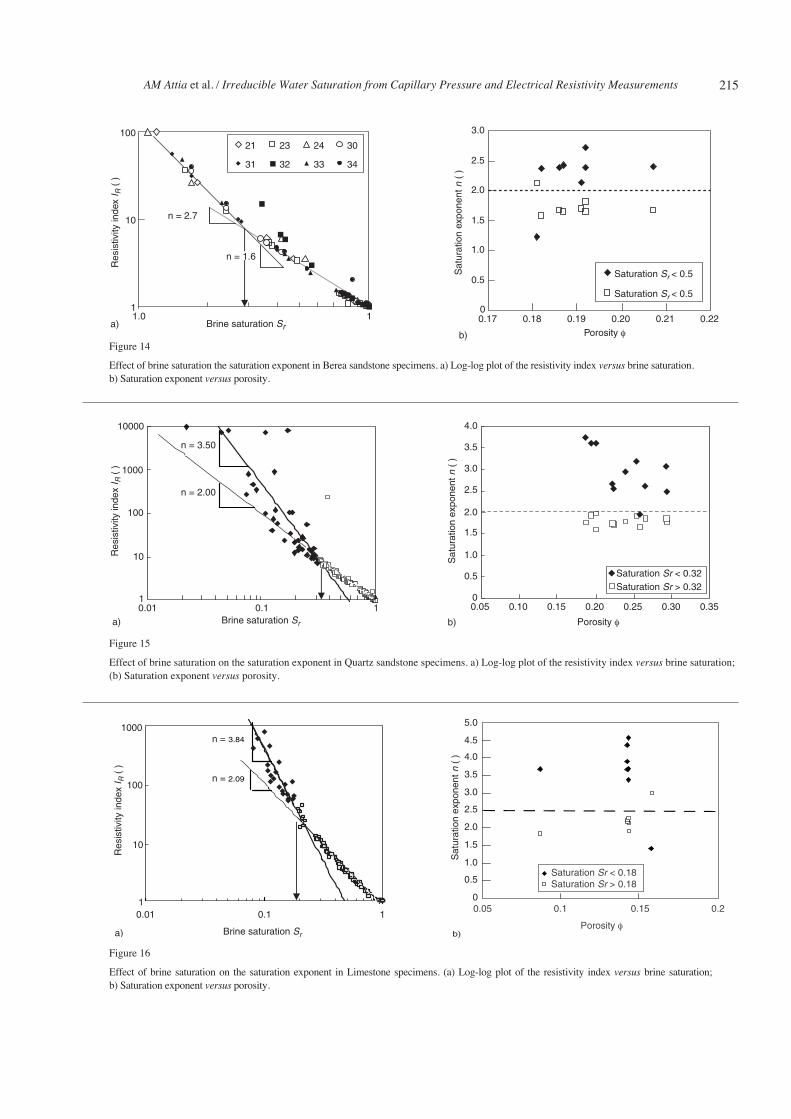
One common parameter used in the evaluation of the pro-duction potential of a formation is the saturation exponent.The saturation exponent in the measured core specimens isnot constant for different degree of saturations as indicatedby Archie (1942) even for clean Berea sandstone (Anderson,1986). Figures 14a, 15a and 16a show that average saturationcoefficient changes from 1.60 to 2.70, 2.00 to 3.50 and 2.09to 3.84 for Berea sandstone, Quartz, and Limestone corespecimens respectively, when the degree of saturation dropsbelow a certain value. The break in the slope of log(IR) versus log(Sr) occurs at the point that coincides with the capillary pressure-based irreducible brine saturation (see Figs. 14b, 15b and 16b) and it does help in the evalua-tion of the electrical resistivity-based irreducible saturationthat provides the higher bound in the production potential ofthe formation.
ρφ
ρ
φ
ρfmineral
r
pore gas
S=
−+
−( )⎛
⎝⎜⎜
⎞
⎠⎟⎟
−1 1
1
211
0.0
0.5
1.0
1.5
2.0
2.5
0.0
0.5
1.0
1.5
2.0
2.5
Berea sandstone 21
Berea sandstone 23
0.0
0.5
1.0
1.5
2.0
2.5
Berea sandstone 24
Berea sandstone 30
0.0
0.5
1.0
1.5
2.0
2.5
Berea sandstone 31
Berea sandstone 32
Berea sandstone 33
Berea sandstone 34
Siz
e di
strib
utio
n (m
2 )S
ize
dist
ribut
ion
(m2 )
Siz
e di
strib
utio
n (m
2 )S
ize
dist
ribut
ion
(m2 )
0.0 5 10 15 20 25Pore entry radii (µm)
0.0 5 10 15 20 25Pore entry radii (µm)
0.0 5 10 15 20 25Pore entry radii (µm)
0.0 5 10 15 20 25Pore entry radii (µm)
Figure 8
Pore size distribution for all eight Berea sandstone core specimens.

Oil & Gas Science and Technology – Rev. IFP, Vol. 63 (2008), No. 2
The change in slope seems to indicate the beginning of theprocess that produces the rupture of electrolyte paths in theporous media. At degrees of saturation higher than the pointof sudden change in the saturation exponent, the increase ofelectrical resistivity seems to occurs only due to the decreasein the cross sectional area of continuous electrolyte paths.Then a change in the behavior seems to occur at the point ofcapillary pressure-based irreducible brine saturation wherethe brine phase still percolates at a minimum through the sur-face of the porous. At this point the isolating non-wettingphase zone starts to become dominant over the conductivewetting phase.
Finally, the evaluation of tortuosity versus brine saturationis presented in Figure 17. The tortuosity is here calculated bymodifying Equation 6 to include the effect of saturation:
(9)
for Sr > SriE
where SriE is the irreducible water in the electrical resistivitysense. This new equation assumes that the trapped porositydoes not contribute to the electrical conductivity and the tortuosity reaches infinite value when all the brine in the chan-nel is removed (Fig. 17a). The normal-normal plot (Fig. 17a)clearly shows the value of lower value of the irreducible watersaturation, while it does not present a clear break in the log-logplot (Fig. 17b). The tortuosity provides an indication of thetwisting of ionic path and it appears as it only changes at aslowly rate and it does not suddenly alter the conduction pathsuntil the last brine percolation path is broken.
CONCLUSIONS
This paper presents the results of capillary pressure and electrical resistivity versus degree of saturation for threetypes of rocks. Berea sandstone, Quartz and Limestone corespecimens were measured with the porous stone method andwith the two-electrode method to evaluate the capillary
τφ
φφ φ
φ= +
−( )= +
−
−1 1trapped
channel r riE
m
mr rS S S S iiE( )
212
1
10
100
1000
Ele
ctric
al r
esis
tivity
ρ (
Ωm
)E
lect
rical
res
istiv
ity ρ
(Ω
m)
1
10
100
1000
1
10
100
1000
Ele
ctric
al r
esis
tivity
ρ (
Ωm
)E
lect
rical
res
istiv
ity ρ
(Ω
m)
1
10
100
1000
Brine saturation Sr
Berea specimen 21
Berea specimen 23
Berea specimen 31
Berea specimen 32
Berea specimen 33
Berea specimen 34
Berea specimen 24
Berea specimen 30
0.20.0 0.4 0.6 0.8 1.0
Brine saturation Sr
0.20.0 0.4 0.6 0.8 1.0
Brine saturation Sr
0.20.0 0.4 0.6 0.8 1.0
Brine saturation Sr
0.20.0 0.4 0.6 0.8 1.0
Figure 9
Electrical resistivity versus brine saturation for all eight Berea sandstone core specimens.

AM Attia et al. / Irreducible Water Saturation from Capillary Pressure and Electrical Resistivity Measurements 213
0
50
100
150
200
250
300
Cap
illar
y pr
essu
re p
c (k
Pa)
21 23 24 30
31 32 33 34
Irreducible brine saturationfor eight Berea Sandstonecores specimens obtained
from the capillarypressure-saturation curves
Core:
0.0 0.2 0.4 0.6
Brine saturation Sr
0.8 1.0
a)
0
20
40
60
80
100
Res
istiv
ity in
dex
I R (
)
21 23 24 30
31 32 33 34
Core:
0.0 0.2 0.4 0.6
Brine saturation Sr
0.8 1.0 b)
Irreducible brine saturationfor eight Berea Sandstonecores specimens obtained
from the resistivityindex-saturation curves
0
50
100
150
200
250
300
Cap
illar
y pr
essu
re P
c (k
Pa)
0 0.2 0.4
Brine saturation Sr
0.6 0.8 1.0
Irreducible brine saturation for twelve Quartz cores specimens obtained from the capillary pressure-saturation curves
a)
0
20
40
60
80
100
Res
istiv
ity in
dex
I R (
)
0 0.2 0.4
Brine saturation Sr
0.6 0.8 1.0
Irreducible brine saturation for twelve Quartz cores specimens obtained from the resistivity index-saturation curves
b)
Figure 10
Capillary pressure and resistivity index versus brine saturation in Berea sandstone core specimens. Two irreducible water saturations areidentified: one for capillary pressure and another one for the electrical properties.
Figure 11
Capillary pressure and resistivity index versus brine saturation in twelve Quartz (very fine-grained) sandstone core specimens. Two irreducible water saturations are identified: one for capillary pressure and another one for the electrical properties.
0
50
100
150
200
250
300
Cap
illar
y pr
essu
re P
c (k
Pa)
0 0.2 0.4
Brine saturation Sr
0.6 0.8 1.0
a)
Irreducible brine saturation for ten limestone cores using specimens obtained from the capillary pressure-saturation curves
0
20
40
60
80
100
Res
istiv
ity in
dex
I R (
)
0 0.2 0.4
Brine saturation Sr
0.6 0.8 1.0
b)
Irreducible brine saturation for ten limestone cores specimens obtained from resistivity index-saturation curves
Figure 12
Capillary pressure and resistivity index versus brine saturation in ten Limestone core specimens. Two irreducible water saturations are identified: one for capillary pressure and another one for the electrical properties.
Oil & Gas Science and Technology – Rev. IFP, Vol. 63 (2008), No. 2214
Sr
Increasing p
Increasing pc Increasing pc
Increasing pc Increasing pc
Sr
Sr Sr
Sr Sr
ρf pc
ρf pc
ρf pcρf pc
ρf pc
ρf pc
)b)a
)d)c
)f)e
Solidmineral
brine
air
Pe
tro
phy
sica
l pa
ram
ete
r
Pe
tro
phy
sica
l pa
ram
ete
r
Pe
tro
phy
sica
l pa
ram
ete
r
Pe
tro
phy
sica
l pa
ram
ete
r
Pe
tro
phy
sica
l pa
ram
ete
r
Pe
tro
phy
sica
l pa
ram
ete
r
Brokenionicpaths
pc (air pressure)
Evaporation and reductionof brine saturation
Evaporation and reductionof brine saturation
Figure 13
Effect of percolation on the capillary pressure and electrical resistivity measurements.
AM Attia et al. / Irreducible Water Saturation from Capillary Pressure and Electrical Resistivity Measurements 215
1
10
100
1Brine saturation Sr
Res
istiv
ity in
dex
I R (
)
21 23 24 30
31 32 33 34
n = 2.7
a)
n = 1.6
1.00
0.5
1.0
1.5
2.0
2.5
3.0
Sat
urat
ion
expo
nent
n (
)
Saturation Sr < 0.5
Saturation Sr < 0.5
b)
0.17 0.18 0.19 0.20 0.21 0.22
Porosity φ
a)
1
10
100
1000
10000
0.01 0.1 1
n = 3.50
n = 2.00
Brine saturation Sr
Res
istiv
ity in
dex
I R (
)
b)
Saturation Sr < 0.32Saturation Sr > 0.32
Porosity φ
Sat
urat
ion
expo
nent
n (
)
0
0.5
1.0
1.5
2.0
2.5
3.0
3.5
4.0
0.05 0.10 0.15 0.20 0.25 0.30 0.35
Figure 14
Effect of brine saturation the saturation exponent in Berea sandstone specimens. a) Log-log plot of the resistivity index versus brine saturation.b) Saturation exponent versus porosity.
a)
1
10
100
1000
0.01 0.1 1
n = 2.09
n = 3.84
Brine saturation Sr
Res
istiv
ity in
dex
I R (
)
0
0.5
1.0
1.5
2.0
2.5
3.0
3.5
4.0
4.5
5.0
Sat
urat
ion
expo
nent
n (
)
b)
Saturation Sr < 0.18Saturation Sr > 0.18
0.05 0.1 0.15 0.2
Porosity φ
Figure 16
Effect of brine saturation on the saturation exponent in Limestone specimens. (a) Log-log plot of the resistivity index versus brine saturation; b) Saturation exponent versus porosity.
Figure 15
Effect of brine saturation on the saturation exponent in Quartz sandstone specimens. a) Log-log plot of the resistivity index versus brine saturation;(b) Saturation exponent versus porosity.

Oil & Gas Science and Technology – Rev. IFP, Vol. 63 (2008), No. 2
pressure and electrical conductivity versus brine saturationcurves. In the electrical resistivity measurements, the pro-posed silver-based paint electrodes prevent problems withelectrode polarization for the tested frequency range.
Capillary pressure and electrical resistivity versus satura-tion curves show that the irreducible brine saturation is aparameter that depends on the type of conduction and its cor-responding value of saturation at percolation. The two valuesof irreducible brine saturation (Figs. 10-12) yield an upperand lower bound limits that can be used to estimate limits tothe production capacity of the porous medium. The detailedanalysis of the data shows that the change in the value of thesaturation exponent. This change occurs at the irreduciblebrine saturation as obtained with capillary pressure data. Thechange in the slope (Figs. 14a, 15a and 16a) seems to indi-cate the presence of discontinuous ionic path in porousmedia, however this observation must be confirmed withcomplementary testing techniques (e.g., micro-tomography).Finally, an equation to evaluate the tortuosity versus degreeof saturation is proposed. Tortuosity results provide an indi-cation of the distortion of the ionic path. Tortuosity appearsto change at slow rates and the conduction paths show nosudden changes until the last brine percolation path is broken.
ACKNOWLEDGMENTS
The authors acknowledge the support of the department ofPetroleum Engineering and the department of Civil andEnvironmental Engineering at the Louisiana State Universityand A&M College.
REFERENCES
Anderson W.E. (1986) Wettability Literature Survey – Part 3.The Effects of Wettability in the Electrical Properties of PorousMedia, J. Petrol. Technol. 39, 13, 1371-1378.
Archie G.E. (1942) The electrical resistivity log as an aid indetermining some reservoir characteristics, AIME T. 146, 54-67.
Attia M.A. (2005) Effects of petrophysical rock properties ontortuosity factor, J. Petrol. Sci. Eng. 48, 185-198.
Core Lab Instruments (2000) Soil Moisture Capillary PressureCell with Control Panel for 1, 3, and 15 bar plates (PPC-100A),Operation Manual. 2015 McKenzie, Suite 106. Carrolton, TX75006, USA.
Diederix K.M. (1982) Anomalous relationships betweenresistivity index and water saturations in Rotliegend sanstone (theNetherlands), Trans. SPWLA. 23rd Annual Logging Symposium,Paper X.
Donaldson E.C., Siddiqui T.K. (1989) Relation between Archiesaturation exponent and wettability, SPE Formation Evaluation16790, 359-362.
Hewlett Packard (1984) Model 4276A LCZ Meter – Operationand Service Manual, Yokogawa-Hewlett-Packard, LTD.Takakura-Cho, Hachioji-Shi. Tokyo, Japan.
Klein K., Santamarina J.C. (1997) Broad-band frequency measure-ments with electromagnetic waves, Geotech. Test. J. 20, 168-178.
Klein K., Santamarina J.C. (2003) Electrical Conductivity inSoils: Underlying Phenomena, J. Environ. Eng. Geophysics 8, 4,263-273.
Lewis M.G., Sharma M.M., Dunlap H.F., Dorfman M.H. (1988)Techniques for measuring the electrical properties of sandstonecores, 63th SPE Annual Technical Conference and Exhibition,Houston, TX, SPE paper 18178, 697-703.
Longeron D.G., Argaud M.J., Bouviever L. (1989b) Resistivityindex and capillary pressure measurements under reservoirconditions using crude oil, 64th SPE Annual Technical conferenceand Exhibition, San Antonio, Texas, SPE paper No. 19589.
Longeron D.G., Argaud M.J., Feraud J.P. (1989a) Effect ofoverburden pressure, nature and microscopic distribution of fluidon electrical properties of rock samples, SPE FormationEvaluation 4, 194-202.
Mavko G., Mukerji T., Dvorkin J. (1998) The Rock PhysicsHandbook, CRC Press.
Mitchel J.K. (1993) Fundamentals of Soil Behavior, John Wileyand Sons.
Moss A.K., Jing X.D., Archer J.S. (2000) LaboratoryInvestigation of Wettability and Hysteresis Effects on Resistivity
216
0
15
30
45
60
75
0 0.2 0.4 0.6 0.8 1.0
Brine saturation Sr
21Core 23 24 30
31 32 33 34
Tort
uosi
ty τ
( )
a)
1
10
100
1Brine saturation Sr
Tort
uosi
ty τ
( )
21 23 24 30
31 32 33 34
b) 1.0
Core:
Figure 17
Calculated tortuosity versus degree of saturation in Berea sandstone specimens. a) Normal-normal plot.(b) Log-log plot.

AM Attia et al. / Irreducible Water Saturation from Capillary Pressure and Electrical Resistivity Measurements
Index and Capillary Pressure Characteristics, J. Petrol. Sci. Eng.24, 2-4, 231-242.
Santamarina J.C., Fratta D. (2003) Dynamic Electrical-Mechanical Energy Coupling In Electrolyte-Mineral Systems,Transport Porous Med. 50, 153-178.Santamarina J.C., Klein K.A., Fam M.A. (2001) Soils andWaves, John Wiley and Sons.
Santamarina J.C., Rinaldi V.A., Fratta D., Klein K.A., Wang Y.-H.,Cho G.-C., Cascante G. (2005) A Survey of Elastic andElectromagnetic Properties of Near-Surface Soils, in Near-SurfaceGeophysics, Buttler D. (ed.), SEG. Tulsa, OK, pp. 71-87.
Swanson B.F. (1985) Microporosity in reservoir rock: Itsmeasurement and influence on electrical resistivity, The LogAnalyst, Nov.- Dec., pp. 42-52.
Telford W.M., Geldart L.P., Sheriff R.E. (1990) AppliedGeophysics, Cambridge University Press.
Tiab D., Donaldson E.C. (1996) Petrophysics – The Theory andPractice of Measuring Reservoir Rock and Fluid TransportProperties, Gulf Publishing Company.
Wang H.F., Anderson M.P. (1982) Introduction to GroundwaterModeling, Freeman Press.
Worthington P.F., Pallatt N. (1992) Effect of variable saturationexponent on evaluation of hydrocarbon saturation, SPEFormation Evaluation 7, 4, 331-336.
Final manuscript received in April 2007
217
Copyright © 2007 Institut français du pétrolePermission to make digital or hard copies of part or all of this work for personal or classroom use is granted without fee provided that copies are not madeor distributed for profit or commercial advantage and that copies bear this notice and the full citation on the first page. Copyrights for components of thiswork owned by others than IFP must be honored. Abstracting with credit is permitted. To copy otherwise, to republish, to post on servers, or to redistributeto lists, requires prior specific permission and/or a fee: Request permission from Documentation, Institut français du pétrole, fax. +33 1 47 52 70 78, or [email protected].