iron harbor roundtable_debt & deleveraging
TRANSCRIPT

Iron Harbor Capital Management
IPI Roundtable Discussion
The End of an Era: The Consequences of Debt and Deleveraging
Spring, 2015

Global debt-to-GDP has sharply expanded…
1
Source: ICMB Geneva Reports
Figure A.1: Total debt of private non-financial sector +39 ppt since 2007Global debt ex-financials (% of GDP)
1.60
1.70
1.80
1.90
2.00
2.10
2.20
2001 2003 2005 2007 2009 2011 2013
• Since 2007, global debt-to-GDP +39ppt
• The equivalent of $49 trillion
• Global GDP grew by $18 trillion

…and financial leverage is at all-time highs
2
Source: World Bank, ICMB Geneva Reports, Iron Harbor Calculations
Figure A.2: Marginal utility of debt is diminishingGlobal total debt (ex-financials), global nominal GDP
20
50
80
110
140
170
200
230
260
2001 2003 2005 2007 2009 2011 2013
Global debt
Global nominal GDP• 2002 – 2007:
• Annualized debt +12.0%• Annualized GDP +10.8%
• 2008 – 2013:• Annualized debt +7.0%• Annualized GDP +3.8%
• Deleveraging would have required GDP x 2

Inflexibility of debt creates vulnerabilities
3
Figure A.3: Gap between debt and GDP growth worseningGlobal total debt ex-financials/GDP normalized (2001)
0.90
1.40
1.90
2.40
2.90
3.40
2001 2003 2005 2007 2009 2011 2013
Global GDP
Global debt
Source: World Bank, ICMB Geneva Reports, Iron Harbor Calculations
• Nominal GDP is comprised of:• Real GDP• Inflation
• Debt is debt…inflexible
• Service costs will increase when Fed hikes

Worsening labor force dynamics are a global trend
4
1.00
1.20
1.40
1.60
1.80
2.00
2.20
2.40
1950 1970 1990 2010 2030 2050
US
Japan
Figure A.4: Lower inverse dependency ratio means lower demand for…Inverse dependency ratio
Figure A.5: …financial services and real assets.Inverse dependency ratio
Source: UN Dept of Economic and Social Affairs Source: UN Dept of Economic and Social Affairs
1.00
1.20
1.40
1.60
1.80
2.00
2.20
2.40
2.60
2.80
3.00
1950 1970 1990 2010 2030 2050
China
BRICS
EU-15

The twin peaks of demographics…
5
1.00
1.20
1.40
1.60
1.80
2.00
2.20
2.40
1950 1960 1970 1980 1990 2000 2010 2020 2030 2040 2050
US
Japan
1.00
1.20
1.40
1.60
1.80
2.00
2.20
2.40
1950 1960 1970 1980 1990 2000 2010 2020 2030 2040 2050
Spain
Ireland
Figure A.4: Housing is an important component of global GDPInverse dependency ratio
Figure A.6: For 50 years, demographic trend supported demandInverse dependency ratio
Source: UN Dept of Economic and Social Affairs Source: UN Dept of Economic and Social Affairs

…and demand for housing…
6
1.00
1.20
1.40
1.60
1.80
2.00
2.20
2.40
1950 1970 1990 2010 2030 2050
US
Japan
1.00
1.20
1.40
1.60
1.80
2.00
2.20
2.40
1950 1970 1990 2010 2030 2050
Spain
Ireland
Figure A.4: Now that the demographic trend has reversed…Inverse dependency ratio
Figure A.6: …a secular decline in housing is likely.Inverse dependency ratio
Source: UN Dept of Economic and Social Affairs Source: UN Dept of Economic and Social Affairs
Peak of Japanese property bubble
ca 1990
Peak of US sub-prime bubble
ca 2007+
Peak of Irish property bubble
ca 2006+
Peak of Spanish property bubble
ca 2008

…darken the BRICS outlook
7
1.00
1.20
1.40
1.60
1.80
2.00
2.20
2.40
2.60
2.80
3.00
1950 1970 1990 2010 2030 2050
China
BRICS
EU-15
Figure A.5: After 30 years, will continuing changes in 1-child policy…Inverse dependency ratio
Source: UN Dept of Economic and Social Affairs
China working age population peaked in 2012
0.00
0.50
1.00
1.50
2.00
2.50
3.00
3.50
1973 1983 1993 2003 2013
Employed persons 5yma % YoY
Figure A.7: …be sufficient to reverse the trend?Year-on-year change in employed persons
Source: Conference Board, Iron Harbor’s calculation

Global trend is lower for productivity
8
-2.00
0.00
2.00
4.00
6.00
8.00
1973 1983 1993 2003 2013
Japan
Germany
US
-10.00
-5.00
0.00
5.00
10.00
15.00
1973 1983 1993 2003 2013
China
India
Brazil
Figure A.8: Labor productivity in secular decline in G-7…Labor productivity per person employed
Figure A.9: …and could be taking hold in the BRICSLabor productivity per person employed
Source: Conference Board, Iron Harbor’s calculation Source: Conference Board, Iron Harbor’s calculation

13
The relentless increase of debt dependency
Causes of the debt supercycle?Among the advanced economies alone, the ratio of debt-to-GDP has risen from 167%in 1980 to 314% in 2011, or by an average of more than five percentage points of GDPper year over the past three decades. Should we be worried?
Policymaker inattention1. Prior to 2008, credit and debt dynamics were not a meaningful part of
policymaking frameworks.2. Focus on the real economy has not been sufficient to avoid serious
macroeconomic problems.
Monetary policy asymmetry1. Monetary policy does not “lean” against the booms, but eases aggressively and
persistently during busts.2. This induces a downward bias in interest rates and an upward bias in debt levels.
Cost of debt financing1. Implicit incentives can make debt more appealing2. Low policy rates -> low debt service payments -> debt more affordable
Unconventional Policy1. QE & forward guidance…triggering search for yield2. Global asset managers are leading the charge

The rate bias of policy implementation has been lower
12
Figure B.1: Policy asymmetry produces a bias for lower ratesOfficial monetary policy rate, total central government debt
Source: Bloomberg
0
5
10
15
20
25
30
0
2
4
6
8
10
12
14
16
18
20
1980 1984 1988 1992 1996 2000 2004 2008
Total central gov't debt
FED
BOE
BOC• Monetary policy has drifted steadily lower
• Globalization a contributor
• Greenspan ‘put’ reveals inherent rate bias

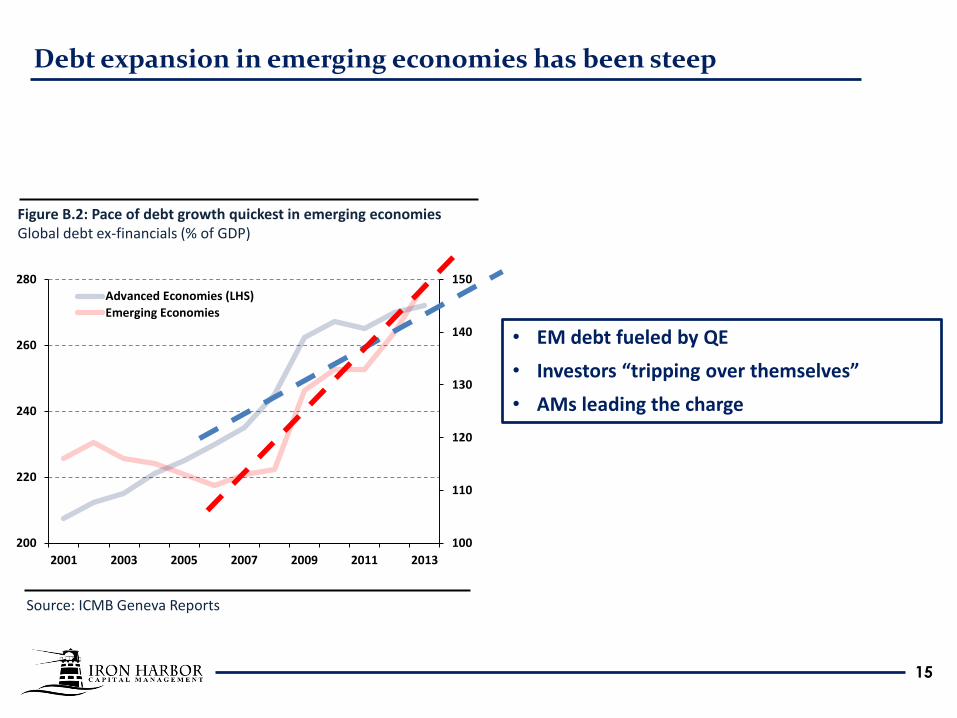
Debt expansion in emerging economies has been steep
14
Figure B.2: Pace of debt growth quickest in emerging economiesGlobal debt ex-financials (% of GDP)
100
110
120
130
140
150
200
220
240
260
280
2001 2003 2005 2007 2009 2011 2013
Advanced Economies (LHS)
Emerging Economies
• EM debt fueled by QE
• Investors “tripping over themselves”
Source: ICMB Geneva Reports
15
Figure B.2: Pace of debt growth quickest in emerging economiesGlobal debt ex-financials (% of GDP)
100
110
120
130
140
150
200
220
240
260
280
2001 2003 2005 2007 2009 2011 2013
Advanced Economies (LHS)
Emerging Economies
• EM debt fueled by QE
• Investors “tripping over themselves”
• AMs leading the charge
Debt expansion in emerging economies has been steep
Source: ICMB Geneva Reports

19
2nd Phase• FX appreciation• Local commodities boom• Asset prices rally
1st Phase• Slow growth/low yields search for yield• Hot money• Steady flows into Asia and LatAm
3rd Phase• Domestic credit expansion• Households• Public sector
4th Phase• Flows either stop or reverse
• Monetary policy• Geopolitical• End in a bang or whimper
Carmen and Vincent Reinhart, “Capital Flow Bonanzas”, 2008.
Capital Flow Bonanzas: Tracking investor flows

Stay on target with the correct policies and infrastructure
20
Investment goals and objectives1. Values clarity reassessment2. Investor Policy Statement3. Appropriate time horizon4. Acceptable levels of volatility5. Planning for liquidity needs6. Investor education
Asset diversification1. Avoid tactical deviations2. Forward looking strategic allocation3. Region/asset category concentration4. Active vs. passive

Current investment themes perform well in debt adjustment
21
Low and stable global inflation
Higher market volatility
Stronger US$
Downside growth surprise in China
Eurozone/Asia equities outperform US
Ongoing commodities opportunities