irina yegorova - eso · irina yegorova sissa, trieste, italy in collaboration with paolo salucci,...
TRANSCRIPT

The mass distribution in spiral galaxies
Irina Yegorova
SISSA, Trieste, Italy
In collaboration with Paolo Salucci,Alessandro Pizzella, Niv Drory

Outline:
•The disk mass of spiral galaxies
•Radial Tully-Fisher relation (RTF)
• Satellites of spiral galaxies


GVM(R)
2rot R
=

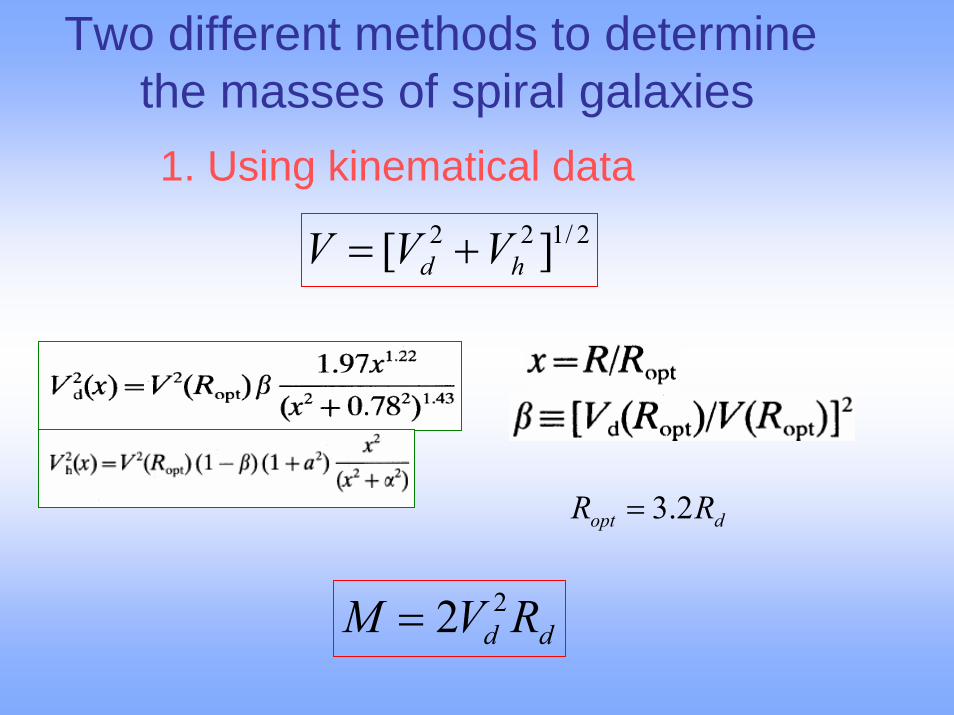
Two different methods to determine the masses of spiral galaxies1. Using kinematical data
2/122 ][ hd VVV +=
dopt RR 2.3=
dd RVM 22=

UGC 8460

2. Using photometrical data
The method is based on the comparison of multicolor photometry from SDSS to a grid of stellar population synthesis models (Niv Drory, Max-Planck, Garching)
The data:
ugriz bands from the Sloan Digital Sky Survey (SDSS) (Data Release 4)
JHK bands from the 2 Micron All Sky Survey

log Mpho = (-0.4 ± 1.27) + (1.02 ± 0.12) log Mkin

Mass-to-light ratio vs color and luminosity
)log(log21log kinphoD MMM +≅

The Tully-Fisher (TF) relation is an empirically established correlation between the luminosity L of a spiral galaxy and its rotational velocity V (Tully-Fisher, 1977)

New method of determiningDistances to galaxies
R.B.Tully and J.R.Fisher,A&A, 54. 661-673, 1977

TF-relation has two important applications:
1. It is used to obtain cosmological distances
M = m - 5logD - 25
2. It can be used for studying the dynamical properties and the evolution of galaxies

Physical basis of the TF-relation
From the equation of centrifugal equilibrium we get:
MV 20
cRGγ= V0 – representative velocity, M - total mass,
Rc – characteristic radius of luminous matter γ - structural parameter depending on the shape
of the mass distribution
M M M mass total lumdark +=
lum
dark
MM α
prametermatter dark
= 2c
lum0 R
Mµ
parameterdensity surface
=

The first equation can be written in this form:
10
22240 1M −+= ]µGα)([γVlum
This equation can be written in the form of theTully-Fisher relation:
10
22240 )]/M()1([ −+= LGVL lumµαγ
)/log(5.2 sunsun LLMM −=

Samples:1st sample: 967 spiral galaxies Mathewson
(1992)
2nd sample: 304 spiral galaxies Courteau(1997)86 galaxies selected for analysis
3 sample: 329 spiral galaxies Vogt (2004)81 galaxies selected for analysis
0.0 0.5 1.0 1.5 2.0 2.5 3.0
0
50
100
150
200
250
V
R/Rd
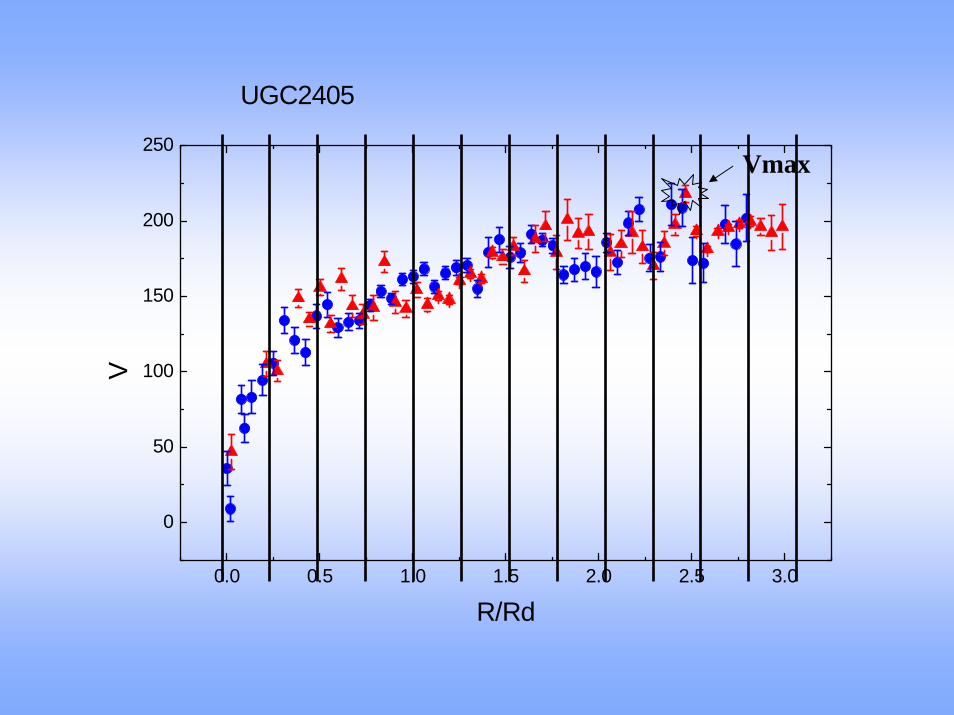
UGC2405
Vmax

1. Mathewson sample: R R/Ropt; bin=0.2
2. Courteau sample: R R/Rd; bin=0.2
3. Vogt sample: R R/Rd; bin=0.2
Ropt=3.2Rd, where R_d is the disk exponential length-scale, for Freeman (exponential) disk this corresponds to the 25 B-mag/arcsec^2 photometric radius.

1st sample: TF-relation for 967 galaxies
1.0 1.2 1.4 1.6 1.8 2.0 2.2 2.4 2.6
-16
-17
-18
-19
-20
-21
-22
-23
-24
Mi
log V
0.2R/Ropt
0.4R/Ropt
0.6R/Ropt
0.8R/Ropt
1.0R/Ropt
1.2R/Ropt

1st sample: TF-relation for 967 galaxies

Slope of the TF-relationMB = ai + bi log V(Ri)
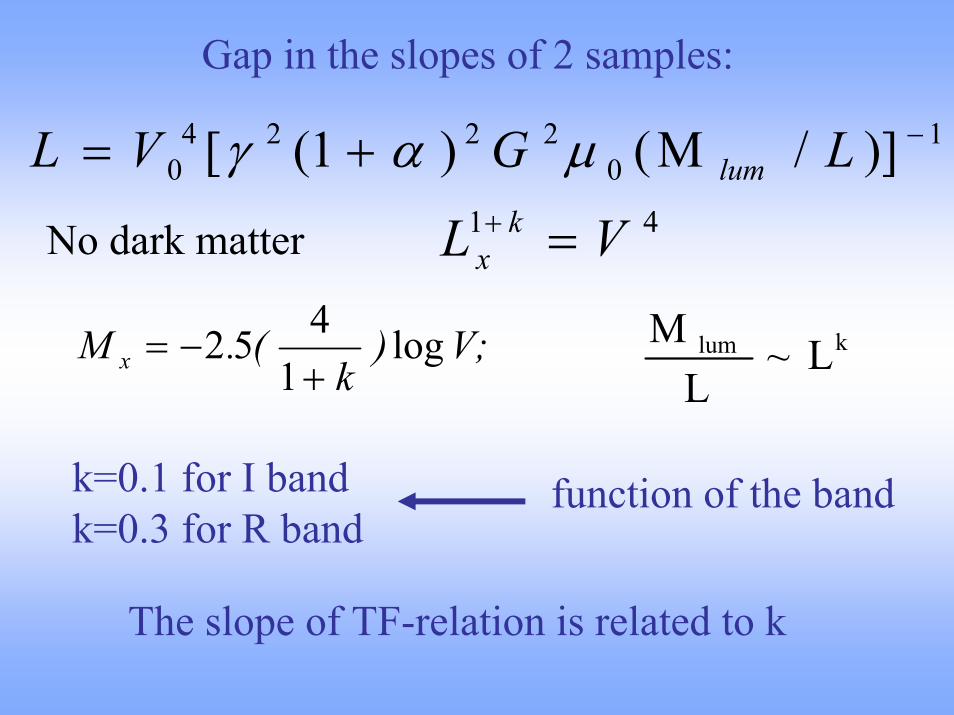
Gap in the slopes of 2 samples:
10
22240 )]/M()1([ −+= LGVL lumµαγ
No dark matter 41 VL kx =+
V;)k
(.M x log1
452+
−= klum L~L
M
k=0.1 for I bandk=0.3 for R band
function of the band
The slope of TF-relation is related to k

Physical meaning of the slope
The slope of the TF-relation steadily rises with distance due to the fact that the fractional amount of the dark matter in galaxies changes with the radius.
240 )),(1(~ −+ LRVL α
MM
lum
dark α= parmetermatter dark
α decreases with L
α increases with Rthis has influence on the slope

Scatter of the TF-relation

TF-relation using Vmax
1.9 2.0 2.1 2.2 2.3 2.4 2.5
-19.0
-19.5
-20.0
-20.5
-21.0
-21.5
-22.0
-22.5
MR
log Vmax
1.4 1.6 1.8 2.0 2.2 2.4 2.6-16
-17
-18
-19
-20
-21
-22
-23
-24
Mi
logVmax
slope=-7,579; scatter=0,328; number of galaxies=843
slope=-5.54; scatter=0.49; number of galaxies=83


Probing dark matter halos of spiral galaxies with their satellites
1.5 - 2 satellites per host galaxy
•Zaritsky (1993): 45 primaries – 69 satellitesKitt Peak 2.3 m
•Sales & Lambas (2004): 1498 primaries – 3079 satellites
2dFGRS 3.9 m
•T. Breinerd (2004) 3 samples: 1351 primaries – 2084 satellites, 948 primaries – 1294 satellites,400 primaries – 658 satellites
SDSS 2.5 m

We are studying 7 isolated spiral galaxies at z = 0.03 - 0.09
+ = 58 h
Satellites + Rotation curves

SDSS J154040.56-000933.5z=0.078

7 primaries 77 satellites identified
Primary galaxy
z N of sat. (SDSS)
N of sat. (found)
SDSSJ134215.02 0.029 4 8SDSSJ145211.01 0.046 4 7SDSSJ152621.67 0.083 4 17SDSSJ153221.6 0.085 5 19SDSSJ154040.5 0.075 7 11SDSSJ154904.29 0.077 2 8SDSSJ221957.2 0.038 4 7

SDSS J145211.01+044053.6

SDSS J145211.01+044053.6

SDSS J145211.01+044053.6

Main results:•The kinematical and spectro-photometrical methods coincides
•We found a Radial Tully-Fisher (RTF):
The slope decreases monotonically with the distance, while the scatter increases with distance. This implies the presence of a non luminous mass component (DM) whose dynamical importance, with respect to the stellar disk (baryonic matter) increases with radius.
The small scatter in the RTF-relation. This implies that galaxies have similar physical characteristics.
• Satellites seems a good tracer of matter distribution in spirals