ireland - stability programme...
TRANSCRIPT

Ireland - Stability Programme Update April 2011

2
FOREWORD This document updates Ireland’s Stability Programme. The previous Update and related Council Opinion were presented to and discussed by the Dáil Select Committee on Finance and the Public Service in June 2010. This Update of Ireland’s Stability Programme takes account of Budget 2011, the Programme for Government and the Joint EU/IMF Programme. It includes an update of the economic and fiscal outlook for this year and next, along with medium-term macroeconomic and budgetary projections. It was laid before Dáil Éireann on 29 April 2011. This document is being submitted to the European Commission in April 2011, in accordance with the requirements under the European Semester. It reflects the horizontal guidance issued by the European Council to Member States in March 2011, and the December 2010 ECOFIN Council recommendations to Ireland under the Excessive Deficit Procedure. It has been prepared in line with the revised Opinion on the content and format of Stability and Convergence Programmes agreed by the ECOFIN Council in September 2010. This Stability Programme should be read in conjunction with Ireland’s National Reform Programme (NRP), which sets out a broad range of structural reform measures and National Targets within the context of the Europe 2020 Strategy. The Irish NRP was laid before Dáil Éireann on 29 April 2011 and was submitted to the European Commission in April 2011.

3
CONTENTS Page
2 Foreword List of Tables and Figures 4
1. Introduction and Overview – General Policy Framework 5 1.1. Policy strategy 5 1.2. Economic and budgetary outlook 5
2. Economic Outlook 7 2.1. Summary 7 2.2. Recent developments 7 2.3. The external environment 8 2.4. Macroeconomic projections 2011-12 9 2.5. Medium-term growth prospects 11 2.6. The labour market 12 2.7. Price developments 13 2.8. Risks to the forecasts 14 2.9. Range of forecasts 14 2.10. Sensitivity analysis 15 3. The Public Finances – General Government Balance and Debt 17 3.1. Summary 17 3.2. Budgetary outturn 2010 17 3.3. Budgetary outlook 2011 18 3.4. Jobs Initiative 2011 20 3.5. Budgetary outlook 2012 21 3.6. Budget 2012 21 3.7. Comprehensive review of expenditure 21 3.8. Public finances 2013-15 22 3.9. Debt level and developments 25 3.10. Debt sustainability 28 3.11. Cyclically-adjusted budget balance and fiscal stance 28 4. Quality of Public Finances 31 4.1. Policy strategy 31 4.2. Developments on the expenditure side 31 4.3. Developments on the revenue side 32 4.4. EU/IMF Programme of support commitments 34 5. Institutional Features of Public Finances 35 5.1. Policy strategy 35 5.2. Budgetary reform 35 6. Long-Term Sustainability of Public Finances 37 6.1. Summary 37 6.2. Long-term budgetary prospects including the implications of ageing 37 6.3. Policy response 38 6.4. Implicit liabilities and medium-term budgetary objectives 39 7. The Excessive Deficit Procedure 40 7.1. EDP Recommendation – April 2009 40 7.2. Assessment of action taken 40 7.3. Revised EDP Recommendation – December 2010 40 7.4. Policy conditionality under the EU/IMF Programme 41

4
Annex 1 Ireland’s National Reform Programme under the Europe 2020 Strategy – Summary of Ireland’s National Targets
42
Annex 2 Competitiveness developments in Ireland 43 Annex 3 Structural reform simulations 44 Annex 4 Output gap methodology 46 Annex 5 Supplementary data 48
LIST OF TABLES AND FIGURES Page Tables Table 1 Economic growth, general government balance and debt ratio 6 Table 2 External assumptions 8 Table 3 Macroeconomic prospects 9 Table 4 External balance 10 Table 5 Divergence from Budget 2011 11 Table 6 Labour market developments 12 Table 7 Price developments 13 Table 8 Comparison of macroeconomic projections for Ireland 15 Table 9 Impact on the budget balance of a 1% change in GDP 15 Table 10 Indicative public finance projections 2011-15 24 Table 11 General government debt developments 26 Table 12 Estimated interest payments on the national debt 2011-15 27 Table 13 Cyclical developments 29 Table 14 Long-term spending projections 38 Figures Figure 1 Contributions to GDP growth 11 Figure 2 Interest payments on the national debt as a percentage of tax revenue
1985-2015 27
Annex 2 Figure 2a Unit labour cost developments in 2010 43 Figure 2b Inflation differentials 43 Figure 2c Nominal exchange rate vis-à-vis Sterling 43 Annex 3 Figure 3a Effect of structural reforms on GDP 44 Annex 5 Table 5a Measures announced to improve the budgetary position 48 Table 5b General government balance – technical estimates 49 Table 5c Explanation of difference between exchequer balance and general
government balance 50

5
CHAPTER 1
INTRODUCTION AND OVERVIEW – GENERAL
POLICY FRAMEWORK 1.1. Policy strategy This Update of Ireland’s Stability Programme elaborates on the Government’s medium-term economic and budgetary strategy. The overriding aim of this strategy is to return the economy to sustainable employment growth. A key condition for doing so is to restore order to the public finances and ensure the sustainability of the Government’s debt position. Substantial efforts in this respect are continuing, with significant steps also being taken to reform the banking sector, so as to ensure that it is fit for the purpose of supporting a modern economy emerging from a period of significant contraction. A further plank of the Government’s medium-term strategy is an ambitious programme of structural reform, including a frontloading of measures to increase competitiveness and support employment. These reforms, which also underpin Ireland’s commitments under the Euro Plus Pact, are discussed in detail in the Irish National Reform Programme. An overview of Ireland’s key priorities and National Targets within the context of the Europe 2020 Strategy is provided in annex 1 of this Update. Reflecting the move to an EU Semester, the presentation of this Stability Programme Update has been brought forward from December 2011 to April. This provides an opportunity to consider the emerging economic and fiscal outlook, together with the Government’s policy intentions, at national and EU level before the annual Budget process begins in earnest. 1.2. Economic and budgetary outlook This document provides an update of the economic and fiscal outlook for this year and next, along with medium-term macroeconomic and budgetary projections. As the degree of uncertainty and margins of error surrounding projections for Ireland are particularly high at this time, a number of downside and upside risks to this outlook are also identified. Following three consecutive years in which output fell, the Irish economy is expected to grow once again this year. On the back of a strong export performance, GDP growth is forecast at around ¾% in 2011 and 2½% in 2012. This represents a downward revision compared to the Budget 2011 forecasts, of around 1 percentage point for this year and ¾ of a percentage point for next year. The composition of growth has also altered, with the contribution of domestic demand revised down and the contribution of net exports revised up. These changes follow from a weaker than assumed starting position this year, along with the materialisation of some of the upside and downside risks identified at Budget time. Over the medium term, exports are expected to continue supporting economic activity, with a gradual pick-up in domestic demand also foreseen as the recovery broadens out and spills over to the labour market. The Jobs Initiative is expected to

6
provide further support in this respect, while a positive growth dividend is assumed from the various structural reforms that form part of the Programme for Government and the Joint EU/IMF Programme. For the period 2013-15, the Irish economy is forecast to grow by 3% per annum on average. Moreover, the current account of the balance of payments is set to turn positive this year, with further improvements projected for next year and beyond. This is an important development and points to the longer term sustainability of the economy as a whole. Table 1: Economic growth, general government balance and debt ratio
2010 2011 2012 2013 2014 2015Real GDP (% change) -1.0 0.8 2.5 3.0 3.0 3.0
General government balance (% of GDP) -32.4 -10.0 -8.6 -7.2 -4.7 -2.8
Structural primary balance (% of GDP) -6.7 -4.5 -3.4 -1.6 0.4 1.6
Debt ratio (year end) 96 111 116 118 116 111
Source: Department of Finance.
On the budgetary front, a General Government Balance of -10% of GDP is now projected for 2011. This is within the terms of the ECOFIN Council recommendation of 7 December 2010. For next year, a General Government Balance of about -8½% of GDP is expected, in line with the Council recommendation. This forecast is, however, somewhat higher than the Budget 2011 one, reflecting the cost of additional borrowing associated with the banking recapitalisations announced in March, and also the weaker economic outlook and its impact on potential tax revenue generation. The Irish Government is committed to bringing the General Government Deficit to below 3% of GDP by 2015, and will review progress in this regard as part of its preparations for Budget 2013. General Government Debt at end-2011 is currently forecast at 111% of GDP. It is projected to peak at 118% of GDP in 2013, coming back down to around 111% of GDP by the end of the forecast period. Nonetheless, the level is set to remain high, requiring a sustained tight budgetary position and the implementation of growth-friendly economic policies beyond the forecast horizon.

7
CHAPTER 2
ECONOMIC OUTLOOK
2.1. Summary Following three successive years in which output fell, the Irish economy is expected to grow once again this year. While near-term prospects remain subdued on the whole, reflecting significant headwinds on the domestic front, a strong export performance is projected to translate into GDP growth of around ¾% in 2011 and 2½% in 2012. Exports are expected to continue supporting economic activity over the medium term, with a gradual pick-up in domestic demand also foreseen as the recovery broadens out and spills over to the labour market. For the period 2013-15, the Irish economy is forecast to grow by 3% per annum on average. Amid continued high uncertainty, this growth outlook is subject to a number of risks, though these appear broadly balanced at this time. Whereas the medium-term outlook is for a return to robust and more balanced growth, short-term prospects are more muted than those set out at the time of Budget 2011. This downward revision to the short-term growth forecast reflects the latest data to hand, which, in the main, point to weaker than expected domestic activity that will not be compensated for by somewhat stronger external demand. While the possibility of such an outturn was previously identified, these risks are now materialising, and so are taken into account in this Update. 2.2. Recent developments Economic activity contracted for a third consecutive year in 2010, falling by 1% in GDP terms and by just over 2% on a GNP basis. Owing to a strong rebound in exports, this decline was, however, markedly less than that seen in the preceding two years. The solid export performance (up 9½% year-on-year, with both goods and services exports recording robust growth) followed in part from strengthening external demand, but also from improvements in competitiveness. As discussed in annex 2, the price and cost adjustments undertaken in recent years have helped Ireland recover some of the competitiveness losses of the previous decade. However, with households, firms and the government still working through past imbalances - from excessive indebtedness to an over-reliance on construction - all components of domestic demand fell in 2010. While the pace of the contraction eased somewhat, investment was nonetheless down by almost 28% in the year, with personal consumption shrinking by 1¼% and government spending by 2¼%. Last year also saw imports rebound, by more than a traditional final demand model would suggest, but by less than the pick-up in exports. As a result, net exports contributed positively to economic activity. While this was not sufficient to offset the drag from domestic demand, it resulted in a significant improvement in Ireland’s current account position – a positive development.

8
High-frequency indicators such as retail sales and consumer confidence data suggest that weak domestic demand conditions have persisted into this year. In contrast, recent readings of the new export orders components of the Purchasing Managers’ Indices – particularly in the manufacturing sector - have been buoyant, pointing to a continuation of positive export momentum into 2011. Overall, the short-term picture emerging is one of an export-led, but relatively jobless, recovery. This is in line with a priori expectations - recoveries of small open economies such as Ireland typically take this form – and underlies the policy focus at Government level on measures that will enhance job creation. 2.3. The external environment For the upswing phase of the Irish business cycle to take root, a reasonable outlook for the external environment is needed. The global economy recorded stronger than expected growth in the second half of 2010, and the expectation is that world growth will continue to expand at a solid pace in the coming years. The IMF has revised up its global growth projection since last autumn, while the European Commission now anticipates marginally stronger growth in Europe than was the case at Budget time. The global recovery remains quite uneven across countries, however. In many advanced economies – which make up the bulk of Ireland’s export markets - output is expected to expand at a rather moderate pace given the legacies of the financial crisis, most notably the need for further deleveraging and fiscal consolidation. A much stronger recovery has occurred in emerging and developing economies, by comparison, a trend that is expected to continue. While favourable on the whole, the external outlook is surrounded by considerable uncertainty. This reflects a number of factors, including geopolitical tensions, the impact of the recent Japanese earthquake and ongoing pressures in the European financial system. Weighted by their share in Irish exports, GDP in Ireland’s main trading partners is projected to increase by around 2% this year and next. Table 2: External assumptions
2010 2011 2012External GDP growth % changeWorld (excluding EU) 5.6 4.6 4.7United States 2.9 2.8 2.6Euro Area 1.7 1.6 1.8United Kingdom 1.3 1.7 2.3
Technical AssumptionsEuro-sterling exchange rate 0.86 0.87 0.88Euro-dollar exchange rate 1.33 1.40 1.41Brent crude (dollars per barrel) 80.2 112.8 112.0
Source: European Commission mid-April 2011 (with the exception of the Euro Area and the United Kingdomwhich are taken from the IMF's April 2011 WEO).

9
2.4. Macroeconomic projections 2011-12 Turning to the short-term prospects for the Irish economy, GDP is forecast to grow by ¾% this year, with growth of 2½% foreseen for next year. The corresponding GNP figures are ¼% and 2%. This represents a downgrading of the short-term outlook, reflecting the ongoing weakness of domestic demand. Table 3: Macroeconomic prospects
2010 2010 2011 2012 2013 2014 2015(€ millions) % change
Real GNP 135,301 -2.1 0.3 2.0 2.5 2.5 2.6Real GDP 164,614 -1.0 0.8 2.5 3.0 3.0 3.0Nominal GDP 153,939 -3.6 1.4 3.1 4.0 4.3 4.6
Components of real GDPPrivate consumption 87,081 -1.2 -1.8 0.0 1.0 1.3 1.4Government consumption 27,306 -2.2 -3.0 -2.3 -2.2 -2.2 -2.0Investment 19,838 -27.8 -11.5 1.0 4.4 5.1 5.5Changes in inventories (% of GDP) -856 -0.5 0.0 0.2 0.2 0.2 0.2Exports 157,573 9.4 6.8 5.7 5.0 4.5 4.1Imports -128,759 6.6 4.7 4.1 3.7 3.3 3.1
Contributions to real GDP growthDomestic demand (excl. inventories) -5.3 -2.8 -0.3 0.6 0.8 1.0Changes in inventories 0.9 0.5 0.3 0.0 0.0 0.0Net exports 3.6 3.0 2.6 2.3 2.1 2.0
€ millionsNominal GDP (rounded to the nearest €25m) 153,950 156,075 160,900 167,400 174,650 182,725
Source: 2010 - CSO and Department of Finance calculations; 2011 to 2015 - Department of Finance calculations. Note that rounding can affect totals.
Underpinning this pick-up in economic activity is a strong outlook for goods and services exports. On the back of reasonably solid demand in our main trading partners and further competitiveness gains, export growth is projected at about 6¾% in 2011 and 5¾% in 2012. Confidence effects stemming from the recently announced banking sector measures, along with a re-focusing of policy towards projects with higher employment content, should also support economic activity in the period ahead. Nonetheless, domestic demand is set to remain lacklustre for some time to come. On the investment front, a double-digit fall is expected again this year - housing start data are consistent with a further decline in the new house building component; while corporate deleveraging and uncertainty are weighing on equipment and machinery investment. A slight uptick in overall investment spending is projected for 2012, however, as the impetus from the rebound in exports becomes more broad-based and housing investment no longer acts as a drag. The near-term outlook for private consumption spending is similarly muted. Households face numerous headwinds at the current juncture, not least of which is the continued need to repair balance sheets. Reflecting this, the savings rate is set to remain relatively high. At the same time, disposable incomes are likely to decline in real terms. As such, personal spending is forecast to fall by around 1¾% this year. On foot of some improvement in labour-market conditions and a modest pick-up in wages, private consumption is projected to be broadly flat in 2012.

10
In line with the fiscal consolidation measures set out in Budget 2011 and in the Joint EU/IMF Programme of Financial Support, public consumption is also projected to decline this year, as well as next; by 3% and 2¼% respectively. Going in the opposite direction, import growth of 4¾% is foreseen for 2011, while growth of some 4% is projected for next year. This takes account of developments in final demand, with the trend towards higher import volumes observed last year also given some weight, as this may well represent a structural shift. Notwithstanding stronger imports, more robust export growth should contribute to an improved current account position. Indeed, the current account of the balance of payments turned positive during 2010. It is expected to show a surplus for this year as a whole, with further improvements projected for next year and beyond. This is an important development and points to the longer term sustainability of the economy as a whole. Table 4: External balance
2010 2011 2012 2013 2014 2015Current account (% of GNP) -0.9 1.4 2.6 3.7 4.7 5.2Current account (% of GDP) -0.7 1.2 2.1 3.0 3.7 4.1Of which: (% of GDP) - Balance on goods and services 18.6 21.2 23.1 24.7 26.0 27.1 - Balance of primary incomes and transfers -19.3 -20.1 -21.0 -21.7 -22.3 -22.9Capital account -0.5 -0.5 -0.5 -0.5 -0.4 -0.4Statistical discrepancy (€ millions) 721
Source: 2010 - CSO and Department of Finance calculations; 2011 to 2015 - Department of Finance calculations. Note that rounding can affect totals.
To sum up, the Irish economy is expected to return to growth in 2011, with a strong export performance offsetting falling domestic demand, both this year and next. While the narrative of an export-led recovery set out above is unchanged from that outlined in Budget 2011, the macroeconomic projections presented here embody a downward revision to GDP growth, of around 1 percentage point for this year and ¾ of a percentage point for next year. The composition of growth has also altered, with the contribution of domestic demand revised down compared to the Budget forecasts and the contribution of net exports revised up. These changes follow from a weaker than assumed starting position this year, along with the materialisation of some of the upside and downside risks identified at Budget time. Moreover, inflation has picked up recently on the back of rising oil and commodity prices, while interest rates have embarked on a clear upward path earlier than had previously been assumed. Given the typically less employment-intensive and tax-rich nature of export-driven growth, these compositional shifts, as well as the level changes, have implications for the labour market outlook. Together with other factors, such as the additional costs associated with the support of the banking sector, they also imply a changed budgetary and debt position (see table 5). In terms of 2011, the risks surrounding the fiscal side are now characterised as being tilted to the downside. For the period 2013-14, the growth outlook is little changed from that presented in Budget 2011.

11
Table 5: Divergence from Budget 20112010 2011 2012 2013 2014 2015
Real GDP growth (%) - Previous forecast 0.3 1.7 3.2 3.0 2.8 n.a - Current update -1.0 0.8 2.5 3.0 3.0 3.0 - Difference -1.3 -0.9 -0.7 0.0 0.2 n.a
General government balance (% of GDP) - Previous forecast -31.9 -9.4 -7.3 -5.8 -2.8 n.a - Current update -32.4 -10.0 -8.6 -7.2 -4.7 -2.8 - Difference -0.5 -0.6 -1.3 -1.4 -1.9 n.a
General government gross debt (% of GDP) - Previous forecast 94 99 102 103 100 n.a - Current update 96 111 116 118 116 111 - Difference 2 12 14 15 16 n.a
Source: Department of Finance calculations. Note that rounding can affect totals.
2.5. Medium-term growth prospects Turning to medium-term prospects in more detail, the Irish economy is forecast to grow on average by 3% per annum in GDP terms over the period 2013-15 (2½% on a GNP basis). These projections take account of the trend growth rate and the amount of slack in the economy, which gives rise to the possibility of growth above trend for a period, as surplus resources are brought into play. On the demand side, exports are expected to continue supporting economic activity further out the forecast horizon. While fiscal consolidation and ongoing deleveraging will still weigh on domestic demand, some firming of private consumption and equipment and machinery investment is foreseen as the recovery broadens out and spills over to the labour market. Housing investment is also expected to gradually increase, reaching 20,000 units per year by 2015. However, reflecting, inter alia, migration trends, this is below past estimates of sustainable medium-term housing output. Overall, domestic demand is projected to make a positive, though fairly modest, contribution to growth from 2013 onwards. Stock building, on the other hand, is not anticipated to add to, or subtract from, growth over the medium term.
Figure 1: Contributions to GDP growth
-15.0
-10.0
-5.0
0.0
5.0
10.0
15.0
2010 2011 2012 2013 2014 2015
perc
enta
ge p
oint
s
domestic demand stock changes exports imports GDP (%)
Source: Department of Finance calculations.

12
On the supply side, a positive growth dividend is assumed from the various structural reforms set out in the Programme for Government and the Joint EU/IMF Programme (these are also discussed in the National Reform Programme which should be read in conjunction with this Stability Programme Update. A summary of Ireland’s NRP is presented in annex 1). To give an illustrative order of magnitude of the impact of structural reforms, the simulations presented in annex 3 show that removing restrictions to trade and competition in the sheltered sector (modelled as a 1% reduction of the price mark-up in the final goods sector) would raise GDP by around ½% after 5 years, while a boost to innovation (modelled as a 1% increase in productivity) would raise GDP by just over 1% in the medium term. Moreover, on the back of the measures recently announced by the Government, it is assumed that the Irish banking system will be in a position to meet increased credit demand as it materialises, and thus support the real economy further out. 2.6. The labour market While the Irish labour market remained very weak at the end of 2010, the outlook is for a gradual improvement over the forecast horizon, supported by planned Government measures. Table 6: Labour market developments
2010 2010 2011 2012 2013 2014 2015('000s) % change
Employment 1,848 -4.2 -1.6 0.5 1.2 1.8 2.0Unemployment rate (QNHS) 292 13.6 14.4 13.7 12.7 11.5 10.0
Labour productivity (GDP per person employed) 3.3 2.4 2.1 1.7 1.2 1.0
Compensation of employees -5.4 -1.3 1.3 3.1 4.1 4.4Compensation per employee 0.3 0.0 0.6 1.4 1.8 2.2
Source: 2010 - CSO and Department of Finance calculations; 2011-15 - Department of Finance calculations.
Following a 4¼% decline last year, employment is projected to fall by a further 1½% in 2011. This reflects both the composition and rather modest pace of growth expected this year. Recoveries in hiring tend to lag those in economic activity as firms respond cautiously, meeting increased demand initially via the more productive use of their existing labour force. Moreover, growth this year is set to be driven entirely by the exporting sector, which is typically less labour intensive. The revisions to the overall economic projections for this year therefore impact significantly on the labour market in the 2011-12 period. From a sectoral standpoint, further losses are anticipated in the construction sector, while weak consumer spending and restructuring in the financial sector are expected to dampen services employment. The labour force is also projected to decline in 2011, albeit at a slower pace than in recent years. This follows from a further small decline in the participation rate, as well as demographic effects - net outward migration is forecast to outweigh the natural increase in the working age population. Given that the fall in the labour force is expected to be somewhat less than the decline in employment, unemployment is
13
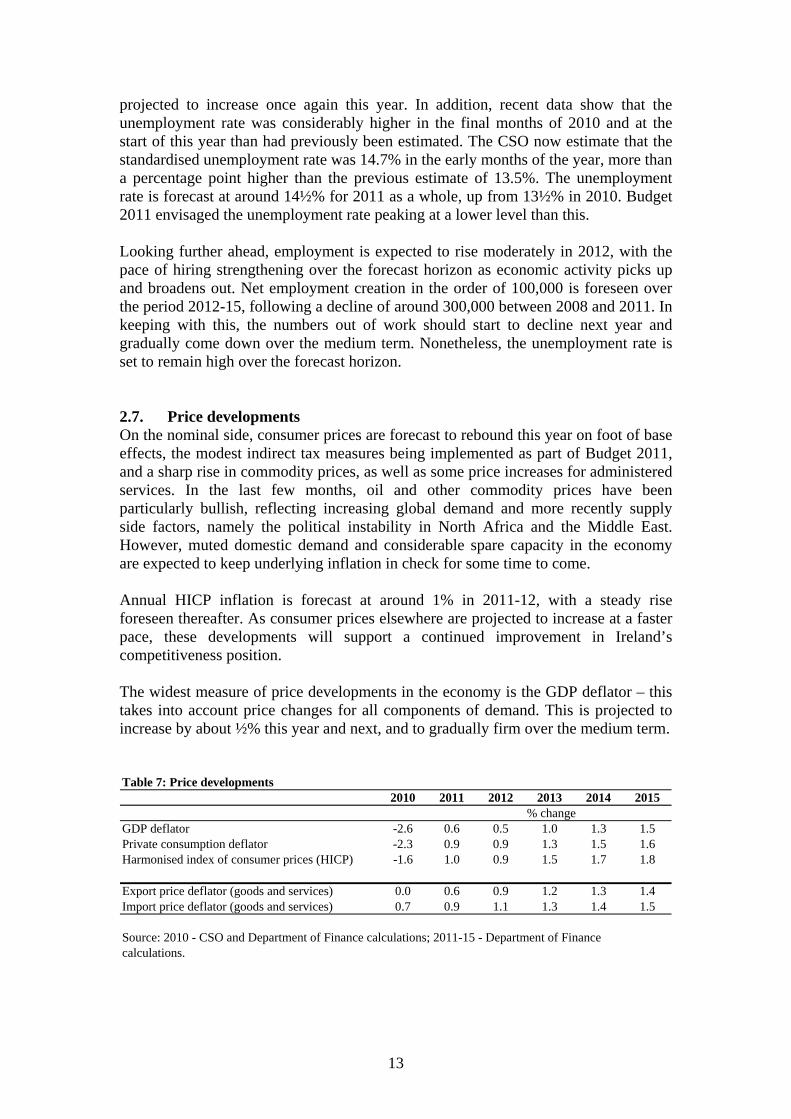
projected to increase once again this year. In addition, recent data show that the unemployment rate was considerably higher in the final months of 2010 and at the start of this year than had previously been estimated. The CSO now estimate that the standardised unemployment rate was 14.7% in the early months of the year, more than a percentage point higher than the previous estimate of 13.5%. The unemployment rate is forecast at around 14½% for 2011 as a whole, up from 13½% in 2010. Budget 2011 envisaged the unemployment rate peaking at a lower level than this. Looking further ahead, employment is expected to rise moderately in 2012, with the pace of hiring strengthening over the forecast horizon as economic activity picks up and broadens out. Net employment creation in the order of 100,000 is foreseen over the period 2012-15, following a decline of around 300,000 between 2008 and 2011. In keeping with this, the numbers out of work should start to decline next year and gradually come down over the medium term. Nonetheless, the unemployment rate is set to remain high over the forecast horizon. 2.7. Price developments On the nominal side, consumer prices are forecast to rebound this year on foot of base effects, the modest indirect tax measures being implemented as part of Budget 2011, and a sharp rise in commodity prices, as well as some price increases for administered services. In the last few months, oil and other commodity prices have been particularly bullish, reflecting increasing global demand and more recently supply side factors, namely the political instability in North Africa and the Middle East. However, muted domestic demand and considerable spare capacity in the economy are expected to keep underlying inflation in check for some time to come. Annual HICP inflation is forecast at around 1% in 2011-12, with a steady rise foreseen thereafter. As consumer prices elsewhere are projected to increase at a faster pace, these developments will support a continued improvement in Ireland’s competitiveness position. The widest measure of price developments in the economy is the GDP deflator – this takes into account price changes for all components of demand. This is projected to increase by about ½% this year and next, and to gradually firm over the medium term. Table 7: Price developments
2010 2011 2012 2013 2014 2015% change
GDP deflator -2.6 0.6 0.5 1.0 1.3 1.5Private consumption deflator -2.3 0.9 0.9 1.3 1.5 1.6Harmonised index of consumer prices (HICP) -1.6 1.0 0.9 1.5 1.7 1.8
Export price deflator (goods and services) 0.0 0.6 0.9 1.2 1.3 1.4Import price deflator (goods and services) 0.7 0.9 1.1 1.3 1.4 1.5
Source: 2010 - CSO and Department of Finance calculations; 2011-15 - Department of Finance calculations.

14
2.8. Risks to the forecasts Given the high degree of uncertainty at present, the growth outlook presented here is subject to an unusually large number of risks. To begin with, there are what might be described as ‘perennial’ risks, those to which macroeconomic projections, particularly for an open economy, are generally subject. These include growth in Ireland’s main trading partners which could be stronger or weaker than assumed, and the possibility of adverse commodity price, exchange rate and interest rate movements. But there are also risks specific to the circumstances in which the Irish economy currently finds itself. The most important of these relate to the speed of balance sheet repair on the part of households and the corporate sector, the unprecedented scale of fiscal adjustment and its effect on confidence and economic activity, and the availability of credit. The balance of risks in respect of these issues would appear to be largely to the downside. Conversely, risks to the outlook for net exports are to the upside for two reasons. First, the structural reform measures set out in the Programme for Government and the Joint EU/IMF Programme could boost competitiveness, and thus exports, by more than expected. Second, in so far as the assumption of a structural shift in import volumes does not materialise, GDP growth could be higher than projected. Related to the above risks is the fact that Ireland has gone through, and is still suffering from, an unprecedented period of turmoil that has shocked the economy. As such, normal, long-held economic relationships are now proving less reliable as indicators of future prospects. This uncertainty means that the margins of error surrounding macroeconomic projections for Ireland are considerably higher at the current juncture than would normally be the case.
2.9. Range of forecasts Against this background of uncertainty and heightened risks, some divergence of views among forecasting institutions is to be expected. That said, a narrowing of such differences has become evident of late, with most domestic and international forecasters revising down their growth projections for this year. The current range of forecasts for the main macroeconomic variables is set out below. When comparing the different projections, it should be borne in mind that the assumptions underpinning them may vary. As can be seen from table 8, the Department of Finance’s GDP forecast for 2011 is broadly in line with that of the European Commission and the Central Bank, and only marginally ahead of IMF and private sector expectations. The ESRI’s forecast is less recent and while it is stronger than others, the possibility of more robust economic growth than that projected by the Department is acknowledged in the risk assessment above.

15
Table 8: Comparison of macroeconomic projections for IrelandAnnual % change
2011 GDP GNP HICP EmploymentDepartment of Finance April '11 0.8 0.3 1.0 -1.6Central Bank of Ireland April '11 0.9 0.0 0.8 -1.4ESRI January '11 1.5 0.3 1.0 -1.4European Commission February '11 0.9 n.a 0.4 -0.8IMF April '11 0.5 n.a 0.5 n.aConsensus (Reuters poll) End-March '11 0.5 0.2 1.0 n.a
Annual % change2012 GDP GNP HICP EmploymentDepartment of Finance April '11 2.5 2.0 0.9 0.5Central Bank of Ireland April '11 2.2 1.6 0.5 0.1ESRI January '11 2.3 1.5 1.0 0.3European Commission February'11 1.9 n.a 0.6 0.5IMF April '11 1.9 n.a 0.5 n.aConsensus (Reuters poll) End-March '11 2.0 1.5 1.3 n.a
Source: Institutions cited.
2.10. Sensitivity analysis To test the sensitivity of the public finances to economic conditions, the Economic and Social Research Institute’s macroeconomic model (HERMES) has been used to simulate a situation in which GDP differs from the baseline by 1%. Two alternative causes of the change in economic growth are modelled – a change in interest rates and a change in world demand. Table 9: Impact on the budget balance of a 1% change in GDP
2011 2012 2013 2014 2015Baseline GDP growth (%) 0.8 2.5 3.0 3.0 3.0Baseline GGB (% of GDP) -10.0 -8.6 -7.2 -4.7 -2.8
1% change in GDP due to a change in interest ratesCumulative impact on GGB (% of GDP) Up to 0.5 Up to 0.5 Up to 0.6 Up to 0.6 Up to 0.6
GGB range (% of GDP) -10.5 to -9.5 -9.1 to -8.1 -7.8 to -6.6 -5.3 to -4.1 -3.4 to -2.2
1% change in GDP due to a change in world growthCumulative impact on GGB (% of GDP) Up to 0.4 Up to 0.4 Up to 0.5 Up to 0.5 Up to 0.5
GGB range (% of GDP) -10.4 to -9.6 -9.0 to -8.2 -7.7 to -6.7 -5.2 to -4.2 -3.3 to -2.3
Source: Department of Finance calculations on the basis of the ESRI's macroeconomic model.
These estimates suggest that a 1% fall in GDP resulting from higher interest rates would lead to a deterioration in the General Government Balance (GGB) of about 0.5 percentage points of GDP in the short run. This finding is broadly symmetrical in that higher growth as a result of lower interest rates would improve the GGB by a similar amount. The impact on the GGB rises to around 0.6 percentage points of GDP (relative to the baseline) over the medium term, as higher interest rates feed through to industrial costs.
16
A 1% increase in GDP resulting from stronger global activity would improve the GGB by around 0.4 percentage points of GDP (relative to the baseline) in the short run. Again, the effect is symmetrical. The short-run impact is less as it is assumed to take some time before the private sector is able to react and take advantage of the unexpected rise in world demand. The strength of the effect increases as such adjustment takes place - to about 0.5 percentage points of GDP over the medium term. The above estimates should be seen as indicative and are subject to considerable uncertainty. The estimated impacts may not hold in every circumstance - specific factors or policy stances within a given year could alter them. Moreover, it is assumed that there is no fiscal policy response to the changed budgetary position over the period. In reality such a response would occur if desirable in the interests of economic or budgetary sustainability.

17
CHAPTER 3
THE PUBLIC FINANCES - GENERAL GOVERNMENT BALANCE
AND DEBT
3.1. Summary The headline General Government Balance for 2010 was -€49.9 billion or -32.4% of GDP. This figure includes the full value of the €31 billion in Promissory Notes committed to a number of financial institutions over the course of 2010. Excluding the impact of State support to the banking sector, the underlying General Government Balance for 2010 is estimated at -€18.5 billion or –12% of GDP. Importantly, the 2010 outturn represents a stabilisation in the size of the underlying deficit, and reflects the significant consolidation measures taken since difficulties first emerged. In terms of this year, a consolidation package of €6 billion was implemented, with significant reductions to both current and capital expenditure and a widening of the tax base primarily through the introduction of a new Universal Social Charge. Based on the assessment that aggregate spending is maintained in line with initial targets and that the budgetary tax revenue target, while acknowledging some potential downside risk, remains broadly valid, the outlook is for a General Government Balance of -10% of GDP in 2011. The new Irish Government is committed to restoring sustainability to the public finances through the implementation of further budgetary consolidation with the aim of reducing the deficit below the 3% of GDP Stability and Growth Pact threshold by end-2015. This additional year over and above that set out in Budget 2011 is already provided for by the ECOFIN Council agreement in December of last year. For 2012, a consolidation package of €3.6 billion will be implemented. This will involve both further expenditure reductions and additional revenue raising measures, with the exact specifications to be decided in advance of Budget 2012, in light of more up-to-date economic and fiscal data. However, the details of future consolidation have been set out in some detail in Ireland’s Memorandum of Understanding underpinning the Joint EU/IMF Programme of Financial Support. On this basis, a General Government Balance of –8.6% of GDP is in prospect for next year. The ratio of General Government Debt to GDP is forecast to be 111% at the end of this year. The debt ratio is projected to peak at 118% at end-2013, declining to about 111% by the end of the current forecast horizon. 3.2. Budgetary outturn 2010 Taxation revenue fell by 3.9% last year, compared with double-digit declines in the previous two years. In terms of the main tax heads, corporation tax and excise duty receipts were ahead of expectations, while income tax receipts were below. VAT receipts were in line with expectations.

18
On the spending side, despite a significant year-on-year increase in the spending of the Department of Social Protection, owing primarily to the elevated unemployment level, total net voted expenditure recorded a year-on-year decline of 1½%. This reflected the delivery of the significant adjustments made to expenditure in Budget 2010. On foot of these developments, both the Exchequer Balance and the underlying General Government Balance – that is the General Government Balance excluding the impact of State support to the banking sector – in 2010 were broadly in line with the December 2009 targets as set in Budget 2010. The outturn for the underlying General Government Balance for 2010 was –€18.5 billion or –12% of GDP. Budget 2010 forecast a General Government Balance of -€18.7 billion or –11.6% of GDP in 2010. The main reason for the slight deterioration in the balance as a percentage of GDP is a revision by the CSO to the nominal level of 2010 GDP. The outturn for the headline General Government Balance in 2010 is estimated at –32.4% of GDP; the higher figure is due to the inclusion of the full €31 billion in Promissory Notes committed to a number of financial institutions in 2010. 3.3 Budgetary outlook 2011 Budget 2011 forecast a General Government Balance of -9.4% of GDP for 2011 and an Exchequer Borrowing Requirement of €17.7 billion. Tax revenues were projected to be €34.9 billion in 2011, an increase of close to 10% on the 2010 yield. There were two main reasons behind this large forecast increase:
• Approximately €2 billion in receipts from the health levy, previously classified as a Departmental receipt or Appropriation-in-Aid going directly to the Department of Health and Children, now forms part of the new Universal Social Charge, which is collected as part of income tax. As such this re-classification of what was previously an expenditure receipt significantly increases the year-on-year tax forecast.
• The implementation of tax raising measures estimated to yield €1.1 billion in
2011, primarily in the area of income tax, with a structural change involving a 10% reduction in the value of tax credits and the standard rate tax bands.
In terms of the performance in the period to end-March, exchequer data show that €7½ billion in tax revenue was collected in the first quarter of the year. While this was €270 million or 3.7% higher than the yield in the first quarter of 2010, it was nevertheless €136 million or 1.8% behind profile. While this is a relatively small shortfall, its composition is a source of some concern, with the performance of two tax-heads, namely VAT and income tax, somewhat worrisome. In relation to income tax, the year-on-year increase of 9.8% in the first quarter is due to the impact of the measures introduced in Budget 2011, most notably the new Universal Social Charge. Notwithstanding this significant year-on-year increase, income tax was €125 million or 4.2% below target at end-March, indicative of labour market weakness.

19
In addition, VAT receipts were also running €179 million or 5.4% behind profile at end-March, although an element of this shortfall may be due to profiling and timing issues, given the large shortfall in the non-VAT due month of February. Corporation tax receipts at end-March were well in excess of what was a relatively small target. However, the initial months of the year are not significant months for corporation tax collection and it will be the May/June period before a clearer indication emerges as to the likely performance for the year of this tax-head. Excise duties in the first quarter of the year were €60 million or 6.4% above target and 10.7% up year-on-year, continuing the relatively positive performance seen throughout much of 2010. Overall tax revenue growth in 2011 was forecast in Budget 2011 at almost 10%. While marginally behind profile for the first three months of the year, it is too early to consider any material revision to the annual forecast. However, the balance of risks would appear somewhat tilted to the downside, given in particular the revised macroeconomic forecast. This is something that the Department of Finance will continue to monitor closely in the context of the April-June monthly Exchequer Returns and will form a view on in the context of the mid-year Exchequer Returns due for publication on 4 July 2011. Net voted expenditure at the end of March was €188 million or 1.7% up year-on-year but this was primarily due to the revised accounting treatment of what were formerly health levy receipts. As already outlined, these were previously collected as a Departmental receipt or an Appropriation-in-Aid which offset gross expenditure. However, the health levy now forms part of the new Universal Social Charge and as such is part of the revenue side of the account, rather than offsetting expenditure. This has the effect of increasing net voted expenditure. This reclassification makes year-on-year comparisons difficult but it is estimated that, adjusting for this, net voted expenditure declined by just under 2% year-on-year in the first quarter, consistent with the reductions to expenditure implemented in Budget 2011. Overall, voted expenditure was €255 million or 2.3% below profile in the first quarter of the year but this shortfall was primarily due to timing issues and the projected expenditure for the year as a whole remains as per the Revised Estimates Volume 2011 published in February. On the assumption that tax revenue in 2011 meets the Budget target of €34.9 billion, this level of tax revenue would still be some €700 million below the amount collected as far back as 2004, and over a quarter below the peak yield of €47¼ billion collected in 2007. It is clear that even with a return to economic growth, a large proportion of the tax revenue previously collected will not return, as this was sourced primarily from property market and construction sector activity. In 2006, the Exchequer collected over €6.8 billion or 15% of total tax revenues from capital gains tax and stamp duty, the two taxes most closely associated with the property market boom. While not all tax revenue generated from these two sources is derived from the property market, the bulk of this money is estimated to have come from activity in this sector, including the purchase and disposals of residential and commercial premises, and sales of development land. In 2006 for example, approximately 80% of all stamp duties collected were derived from land and property transactions.
20
In 2011, the yield from these two tax-heads is estimated at less than €1.4 billion or 4% of total tax revenue, with a third of the stamp duty yield expected to come from the health insurance levy. While taxation receipts in 2011 are projected to be around 2004 levels, gross voted expenditure of Government Departments and Offices in 2011 is projected to be about 40% above the 2004 level. It is this large gap between the State’s revenues and expenditure that is now being addressed by budgetary policy, and will continue to be in the coming years. The current estimate of the Exchequer Balance for 2011 is -€18.21 billion. The slight deterioration in the Exchequer position compared to the Budget target is due primarily to higher than expected cash interest payments arising on drawdowns from the European funding facilities – the EFSF and EFSM – and to the additional interest costs on the extra Exchequer funding for banking recapitalisation. The requirement for additional capital for the banking sector, arising from the results of the PCAR/PLAR process, was announced on 31 March and this will also impact on the overall Exchequer position in 2011. The results of that process show that a further €24 billion is required by the banking sector. It should be noted that €5.3 billion of this €24 billion represents a buffer over and above the requirements of the stress test. Moreover €3 billion of this figure will represent contingent capital. €10 billion of the €24 billion will be provided from the National Pensions Reserve Fund (NPRF) and thereby has no impact on the Exchequer position. This was already included in the budgetary forecasts published in December 2010. Of the remaining €14 billion that is required, a substantial element will come from the Exchequer but there are a number of mitigating factors - such as burden sharing and capital generating asset disposals - which will help reduce the Exchequer funding requirement and alleviate the burden on the domestic taxpayer. For the purpose of the fiscal and debt projections contained in this Update, it is assumed that Exchequer funding in the order of €10 billion will be required. However, the actual amount to be sourced from the Exchequer will become clearer in the coming months in the context of the amount raised from the mitigating factors. 3.4. Jobs Initiative 2011 The Programme for Government sets out a commitment to resource a Jobs Initiative within the first 100 days of the start of the Government’s term. The focus of this initiative will include the acceleration of labour-intensive capital projects and provision for some reduction in certain taxation items. While the overall fiscal targets agreed under the Joint EU/IMF Programme of Financial Support for Ireland will be
1 This estimate of the Exchequer Borrowing Requirement (EBR) does not take account of the impact on the Exchequer of banking recapitalisations which will in all likelihood be provided by way of non-voted capital expenditure. Estimates of debt interest for 2011 included in the EBR do factor in the requirement for additional Exchequer borrowing to fund these recapitalisations.

21
maintained, the reorientation of policies under the Jobs Initiative will provide support to the labour market, thereby assisting both household and business confidence, which, in turn, will help underpin the emerging economic recovery. In discussions with the External Funding Partners, it has been agreed that the cost of these measures will be seen as compatible with the Funding Programme, subject to the measures being fully financed through offsetting measures, in the form of either a reallocation of existing expenditure or additional revenue-raising measures. In practice, this means that the package of measures to be announced as part of the Jobs Initiative must be budgetary neutral in the overall context. It is proposed to publish the Jobs Initiative in May. 3.5. Budgetary outlook 2012 The Irish Government is committed to the aggregate fiscal adjustment which underpins the Joint IMF/EU Programme of Financial Support for Ireland for the period 2011-12 as the State continues the process of aligning more closely its revenues and expenditure so that it can achieve the deficit reduction target by 2015. The overall fiscal adjustment for 2012 underpinning the Joint Programme is €3.6 billion and this will be implemented through a combination of further reductions to public expenditure and additional revenue raising measures. While recognising that the new Government has yet to finalise the precise details of its proposed fiscal adjustment plan, the public finance forecasts contained in this Stability Programme Update are consistent with this overall level of fiscal adjustment. The General Government Balance is currently forecast at –8.6% of GDP in 2012 taking account of the measures set out in the Memorandum of Understanding. This is some way higher than the Budget 2011 forecast of –7.3% of GDP reflecting, inter alia, the additional interest costs associated with additional borrowing for the banking recapitalisations announced in March, the weaker economic outlook as well as a lower than assumed level of GDP. However, this overall deficit target is in line with the ECOFIN Council recommendation of 7 December 2010. 3.6. Budget 2012 The Irish Government is committed to achieving a deficit of less than 3% of GDP by 2015 and to the aggregate fiscal adjustment set out in the Joint EU/IMF Programme of Financial Support for Ireland for the period 2011-12. For the purposes of producing public finance forecasts, table 10 below sets out the technical position based on the implementation of measures consistent with the overall commitments in the Programme for Government and the Joint EU/IMF Programme. Of course policy is a matter for Government and the precise nature of the measures to be implemented will be decided upon in advance of Budget 2012, in light of more up-to-date economic and fiscal data, and the Comprehensive Review of Expenditure which is to be completed by September 2011. In addition, the policy orientations of others including the EU Council made in the context of the European Semester will also be taken account of. 3.7. Comprehensive review of expenditure Ireland faces significant adjustment to ensure that debt remains on a sustainable path and access to market funding is restored. Accordingly, the Government is fully

22
committed to the fiscal consolidation agreed in the Joint EU/IMF Programme of Financial Support for Ireland, and to correcting the excessive deficit by end-2015. To ensure that the overall consolidation is underpinned by the most effective use of our scarce resources, the Government has recently launched an ambitious and comprehensive spending review. As part of this process, the scale of the necessary consolidation in Budgets 2013-15 will have to be reviewed in the context of the likely growth prospects nearer the time. It is clear that difficult choices need to be made so that available spending is targeted towards those most in need, as well as protecting enterprise and promoting competitiveness. Further reductions across various areas of spending will therefore be required and will be addressed in the context of the Comprehensive Review of Expenditure, which has been agreed by Government and which is discussed further in chapter 4. Capital spending must also be reduced further but reductions must be seen in the context of the very substantial investment over the past decade, which has bridged much of the infrastructure gap that had been a feature of the Irish economy for a long time. Moreover, the cost of financing projects through additional borrowing, as well as the rationale for certain large infrastructural projects, must be reassessed in light of the lower level of resources now available and the smaller scale of the economy. The road network, public transport system and educational, sport and tourist facilities have all been transformed and there is no longer a need for the level of spending that pertained throughout the early and middle parts of the last decade. In addition, in the current lower cost environment, better value can be achieved from a given level of capital investment. It is of course, possible to deliver the same overall fiscal outcome through alternative measures and the precise measures to be implemented will be a matter for Government to decide on later this year, taking account of a more up-to-date economic and fiscal outlook for 2012 and beyond. 3.8. Public finances 2013-15 Notwithstanding the commitment in the Programme for Government to reduce the public finance deficit to below 3% of GDP by end-2015, it is proposed, in preparation for Budget 2013, to review progress on deficit reduction. This is prudent given the high degree of uncertainty regarding both the short and medium-term growth prospects for the Irish economy, a point alluded to earlier in the risks section of chapter 2. Proceeding in this manner will also allow the results of the Comprehensive Review of Expenditure, which is being conducted in advance of Budget 2012, to be further considered for the later years. Over the period 2013-15 nominal economic growth is forecast to average around 4¼% per annum (in GDP terms). In tandem with the implementation of further budgetary adjustments on the revenue side, growth in tax revenues is expected to average approximately 5¾% per annum over this period. Economic growth will be predominantly export driven in the early years of the forecast horizon. As this is not as tax rich as domestically driven growth, tax revenues in 2015 are currently forecast at €44¼ billion, still 6% below their 2007 peak. This is despite the significant
23
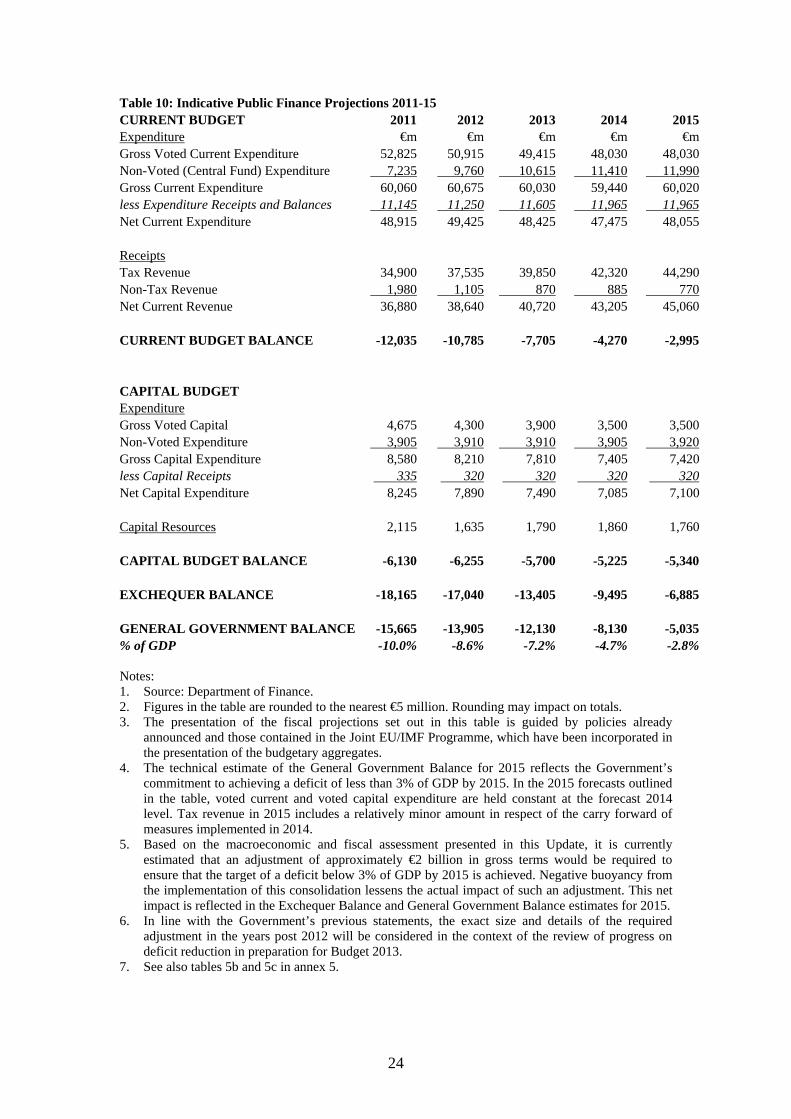
structural adjustments to the tax system, including the introduction of the new Universal Social Charge. Consistent with the plans outlined previously, further adjustments to the fiscal position will be required over the coming years so that day-to-day spending is funded out of day-to-day revenues. The scale and the speed of the adjustment will depend on the economic climate that pertains in each of the future years but the public finance forecasts underpinning this Update assume the level of adjustment required will be sufficient to ensure that the deficit is below 3% of GDP by 2015. Guided by policies already announced and those contained in the Joint EU/IMF Programme, consolidation amounts have been incorporated in the technical presentation of the budgetary aggregates shown in table 10 for the years out to 2015. The exact nature of the measures to be implemented will be decided by Government in light of the emerging outlook and informed by the review of the progress on deficit reduction that will be undertaken prior to Budget 2013. Tables 10 below sets out the budgetary projections for the period 2011-15 on this technical basis.
24
Table 10: Indicative Public Finance Projections 2011-15 CURRENT BUDGET 2011 2012 2013 2014 2015 Expenditure €m €m €m €m €m Gross Voted Current Expenditure 52,825 50,915 49,415 48,030 48,030 Non-Voted (Central Fund) Expenditure 7,235 9,760 10,615 11,410 11,990 Gross Current Expenditure 60,060 60,675 60,030 59,440 60,020 less Expenditure Receipts and Balances 11,145 11,250 11,605 11,965 11,965 Net Current Expenditure 48,915 49,425 48,425 47,475 48,055 Receipts Tax Revenue 34,900 37,535 39,850 42,320 44,290 Non-Tax Revenue 1,980 1,105 870 885 770 Net Current Revenue 36,880 38,640 40,720 43,205 45,060 CURRENT BUDGET BALANCE -12,035 -10,785 -7,705 -4,270 -2,995 CAPITAL BUDGET Expenditure Gross Voted Capital 4,675 4,300 3,900 3,500 3,500 Non-Voted Expenditure 3,905 3,910 3,910 3,905 3,920 Gross Capital Expenditure 8,580 8,210 7,810 7,405 7,420 less Capital Receipts 335 320 320 320 320 Net Capital Expenditure 8,245 7,890 7,490 7,085 7,100 Capital Resources 2,115 1,635 1,790 1,860 1,760 CAPITAL BUDGET BALANCE -6,130 -6,255 -5,700 -5,225 -5,340 EXCHEQUER BALANCE -18,165 -17,040 -13,405 -9,495 -6,885 GENERAL GOVERNMENT BALANCE -15,665 -13,905 -12,130 -8,130 -5,035 % of GDP -10.0% -8.6% -7.2% -4.7% -2.8% Notes: 1. Source: Department of Finance. 2. Figures in the table are rounded to the nearest €5 million. Rounding may impact on totals. 3. The presentation of the fiscal projections set out in this table is guided by policies already
announced and those contained in the Joint EU/IMF Programme, which have been incorporated in the presentation of the budgetary aggregates.
4. The technical estimate of the General Government Balance for 2015 reflects the Government’s commitment to achieving a deficit of less than 3% of GDP by 2015. In the 2015 forecasts outlined in the table, voted current and voted capital expenditure are held constant at the forecast 2014 level. Tax revenue in 2015 includes a relatively minor amount in respect of the carry forward of measures implemented in 2014.
5. Based on the macroeconomic and fiscal assessment presented in this Update, it is currently estimated that an adjustment of approximately €2 billion in gross terms would be required to ensure that the target of a deficit below 3% of GDP by 2015 is achieved. Negative buoyancy from the implementation of this consolidation lessens the actual impact of such an adjustment. This net impact is reflected in the Exchequer Balance and General Government Balance estimates for 2015.
6. In line with the Government’s previous statements, the exact size and details of the required adjustment in the years post 2012 will be considered in the context of the review of progress on deficit reduction in preparation for Budget 2013.
7. See also tables 5b and 5c in annex 5.

25
3.9. Debt level and developments Through a combination of repeated budgetary surpluses and strong economic growth, the Irish General Government Debt to GDP ratio fell dramatically over the course of much of the last two decades and at end-2007 stood at 25%, well below the European average. As a consequence of the large deficits that have emerged in each of the last three years, combined with the considerable level of support the State has been required to provide to the banking sector, this ratio has increased dramatically and at end-2010 stood at an estimated €148 billion or 96% of GDP. This ratio has also been affected by the large decline in the value of GDP, which in nominal terms fell by close to 20% between 2007 and 2010. While the impact of the State support provided to the banking sector has been dramatic in accounting terms, with the full €31 billion in Promissory Notes committed to various financial institutions in 2010 added to the overall stock of General Government Debt in that year, the impact in terms of funding is less dramatic. The borrowing to fund these Promissory Notes is being done on a phased basis to lessen the impact on the Exchequer, with the first instalment for Anglo Irish Bank and Irish Nationwide Building Society, equivalent to 10% of the total principal sum committed to these institutions, provided for by the Exchequer in March 2011. Similar payments will be made on an annual basis over the coming years until the full value of the Promissory Notes including interest has been paid over to the relevant financial institutions. General Government Debt is forecast to increase further in the coming years. Taking account of the recent announcement on the PCAR/PLAR exercise and the resultant €24 billion in additional recapitalisation required by the banking sector, combined with the weaker economic outlook, the General Government Debt to GDP ratio is currently estimated at end-2011 at 111% of GDP. This is some way in excess of the Budget 2011 forecast and reflects largely the additional borrowing that will be undertaken to fund the banking recapitalisations as well as the impact of a lower nominal level of GDP. In addition, the end-2011 debt ratio is also affected by the decision to advance borrowings from the various funding facilities to ensure that the Exchequer, at the end of 2011, has adequate funding to meet its estimated liabilities in the early part of 2012, which include a large bond redemption. This estimate of the end-2011 debt ratio assumes that €10 billion of the banking sector recapitalisation is provided from the National Pensions Reserve Fund. This was already included in the budgetary forecasts published in December 2010. Of the remaining €14 billion, a substantial element will come from the Exchequer but there are a number of mitigating factors which will help reduce the requirement for funding for the banks from the Exchequer and alleviate the burden on the domestic taxpayer. These include burden sharing from subordinated bond holders, capital generating asset disposals by banks, and possible private sector investment. For the purpose of the fiscal and debt projections contained in this Update, it is assumed that Exchequer funding in the order of €10 billion will be required. The debt to GDP ratio is forecast to peak at 118% of GDP in 2013 before declining to 111% by 2015.

26
A General Government Debt ratio peaking at 118% of GDP in 2013, is clearly an elevated ratio and one that requires that further budgetary consolidation and growth friendly economic policies be implemented in the coming years. Table 11 below shows the evolution of the General Government Debt to GDP ratio over the forecast period. Table 11 – General government debt developments
% of GDP 2010 2011 2012 2013 2014 2015 Gross debt 96 111 116 118 116 111 Change in gross debt ratio 30.7 14.6 5.6 1.9 -2.6 -4.3
Contributions to change in gross debt General Government Balance -32.4 -10.0 -8.6 -7.2 -4.7 -2.8 Interest expenditure 3.3 3.8 4.7 6.1 6.3 6.2 Primary balance -29.2 -6.2 -3.9 -1.1 1.7 3.4 Stock-flow adjustment -4.2 5.9 0.3 -0.8 -2.3 -2.0
of which Differences between cash and accruals -7.0 -0.6 n.a n.a n.a n.a Net accumulation of financial assets 2.8 6.5 n.a n.a n.a n.a
Net Receipts of Social Security Funds 0.0 0.4 0.2 0.2 0.2 0.2 Other factors influencing the debt ratio:
Increase in local authorities debt 0.0 0.1 0.1 0.1 0.1 0.1 p.m. implicit interest rate on debt 4.8 4.0 4.4 5.5 5.6 5.6
Notes: Interest expenditure and the implicit interest rate take into account the previously announced ‘interest holiday’ on promissory notes for 2011-12. Rounding can affect totals. Source: Department of Finance. The NTMA successfully raised €20 billion in long-term funding in 2010, money that was used to fund the Exchequer deficit of €18.7 billion and refinance a small amount of maturing debt. The majority of this funding had been completed before market sentiment towards Ireland deteriorated in the autumn, resulting in the NTMA cancelling planned bond auctions in October and November primarily to allow markets digest major policy announcements in relation to the banking sector at the end of September. However, investor concerns about the banking sector remained and coupled with worries about the State’s fiscal situation and the wider issue of eurozone stability meant that the Irish Government had to seek financial assistance through a Joint EU/IMF Programme of Financial Support. The three-year programme, which was put in place in December 2010, totals €85 billion, with €17½ billion contributed from domestic resources. The purpose of the external financial support is to provide a secure source of funding which the State can avail of over the period to 2013, to assist the Irish economy in returning to sustainable economic growth and to ensure that a properly functioning healthy banking system can play its part in the recovery. While the overall external element of the €85 billion programme is €67½ billion, which can be used for both sovereign and banking requirements, it is the stated aim of the Sovereign to resume market based funding as soon as conditions allow. In this

27
context pursuing a credible fiscal policy, enhancing the growth potential of the economy and the implementation of the new medium-term budgetary framework will greatly assist in this goal. Clearly, external factors, particularly developments at European level will also have a role in this regard. The external support is being provided through funding of €22½ billion from the European Financial Stability Mechanism (EFSM); €22½ billion from the International Monetary Fund (IMF); and €22½ billion from the European Financial Stability Fund (EFSF) and bilateral loans from the UK, Sweden and Denmark. Given the rapidly increasing volume of debt that has emerged in recent years, the cost of servicing the debt has also increased significantly and will, for the forecast period, absorb an increasing amount of tax revenues. Table 12 below sets out the current projections for interest costs on the national debt over the forecast period to 2015. In 2011, interest payments on the national debt are forecast to account for around 15% of tax revenues. In 2007, the equivalent figure was just 3½%. By 2015, based on current assumptions regarding the evolution of tax revenues, debt levels and interest rates on Government borrowing, some 21% of tax revenues will be required to pay interest on the national debt. While very high, this is lower than in the mid-1980s when around one third of all tax revenues were required for this purpose. Table 12: Estimated interest payments on the National Debt 2011-15
€ billions 2011 2012 2013 2014 2015 National Debt Interest Tax Revenue Interest as a % of Tax Revenue
5.22 34.9 15.0
7.2 37.5 19.2
8.0 39.9 20.1
8.7 42.3 20.7
9.2 44.3 20.8
Source: NTMA and Department of Finance calculations. Figure 2: Interest payments on the national debt as a percentage of tax revenue 1985-2015
0%
5%
10%
15%
20%
25%
30%
35%
1985 1986 1987 1988 1989 1990 1991 1992 1993 1994 1995 1996 1997 1998 1999 2000 2001 2002 2003 2004 2005 2006 2007 2008 2009 2010 2011 2012 2013 2014 2015
Source: Department of Finance.
2 Of which €4.6 billion comes from the Exchequer and €0.6 billion from the Capital Services Redemption Account (CSRA).

28
3.10. Debt sustainability The sharp downturn in economic activity since 2007, three years of large budget deficits and the significant level of State support required for the banking sector have combined to drive up steeply the ratio of Irish Government debt to GDP. A continuation of the upward trajectory evident since the end of 2007 is not sustainable and it is vital that the debt ratio is stabilised and returned to lower, safer levels as quickly as possible, bearing in mind the requirement to protect the economic recovery. The trajectory for the debt ratio depends on the relationship between economic growth, the interest rates applying to Government debt - both the stock outstanding and new debt to be issued in the coming years - and the level of budgetary adjustment implemented by the Government. Table 11 above shows the ratio of General Government debt to GDP peaking at 118% in 2013 before declining in the following two years to reach 111% of GDP by 2015. The ratio is very high relative to historic experience, to the threshold that is considered safe3 and to the 60% Stability and Growth Pact limit. These estimates are consistent with the further capital support required to be provided by the State to the banking sector, arising from the PCAR/PLAR process, the results of which were announced on 31 March 2011. They are also consistent with the implementation of the necessary fiscal adjustment measures to achieve a deficit of below 3% of GDP by 2015. A crucial requirement for debt sustainability is that the ratio of debt to GDP stabilises and starts to come down. Under the forecasts presented in this Update, the ratio is projected to peak in 2013 and start to decline thereafter. The narrowing of the gap that currently exists between revenues and expenditure through additional fiscal consolidation, coupled with the implementation of policy measures that will assist in boosting economic growth will assist in this regard, as will the achievement of a primary surplus – an excess of revenues over expenditure excluding interest expenditure – by 2014. In addition in the context of debt sustainability, it is outlined elsewhere in this chapter that some 21% of tax revenues will be required to pay interest on the national debt by 2015. While a significant level, it is worth bearing in mind that it is well below the ratio experienced in the mid-1980s when around a third of the tax revenues generated in the State went towards servicing the interest on the national debt. 3.11. Cyclically-adjusted budget balance and fiscal stance It is well known that the Government’s actual budget balance reflects the influence of both temporary and permanent factors. It is important, therefore, to disentangle temporary from permanent influences on the budget balance in order to gauge the medium-term orientation of fiscal policy.
3 A January 2010 paper prepared for the American Economic Review Papers and Proceedings by Reinhart and Rogoff “Growth in a Time of Debt” suggests that a debt ratio above 90% of GDP constitutes a dangerous level of debt.
29
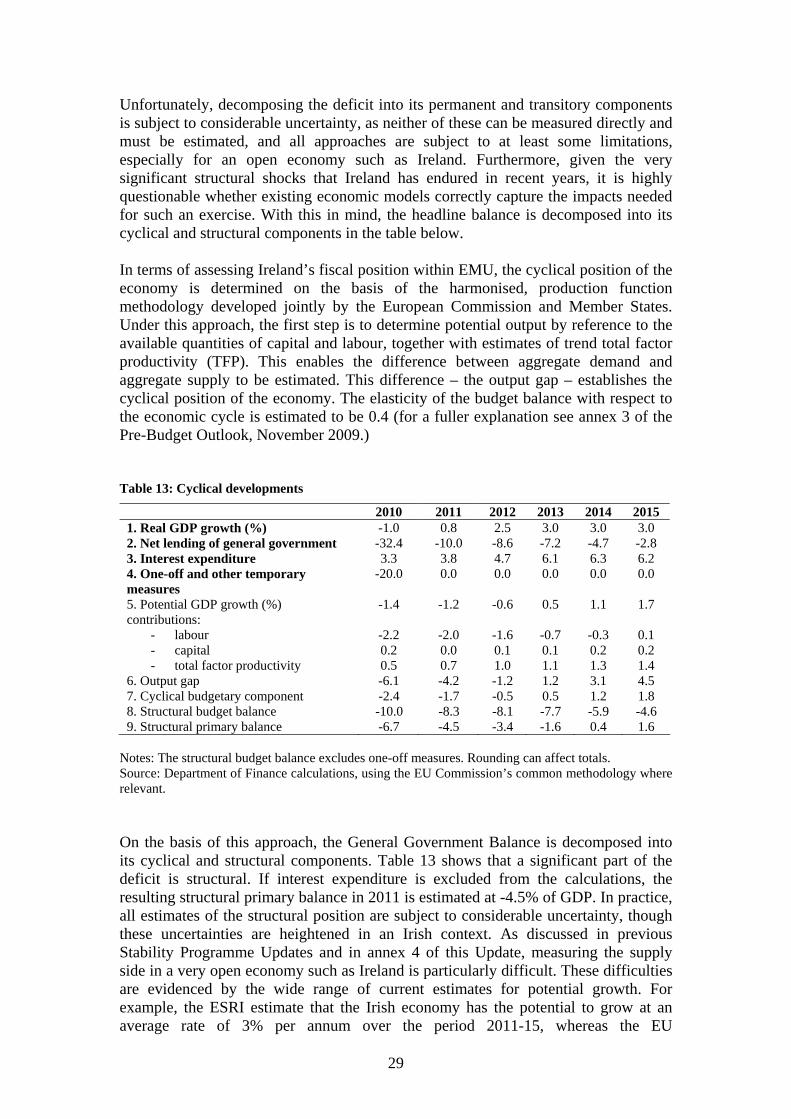
Unfortunately, decomposing the deficit into its permanent and transitory components is subject to considerable uncertainty, as neither of these can be measured directly and must be estimated, and all approaches are subject to at least some limitations, especially for an open economy such as Ireland. Furthermore, given the very significant structural shocks that Ireland has endured in recent years, it is highly questionable whether existing economic models correctly capture the impacts needed for such an exercise. With this in mind, the headline balance is decomposed into its cyclical and structural components in the table below. In terms of assessing Ireland’s fiscal position within EMU, the cyclical position of the economy is determined on the basis of the harmonised, production function methodology developed jointly by the European Commission and Member States. Under this approach, the first step is to determine potential output by reference to the available quantities of capital and labour, together with estimates of trend total factor productivity (TFP). This enables the difference between aggregate demand and aggregate supply to be estimated. This difference – the output gap – establishes the cyclical position of the economy. The elasticity of the budget balance with respect to the economic cycle is estimated to be 0.4 (for a fuller explanation see annex 3 of the Pre-Budget Outlook, November 2009.) Table 13: Cyclical developments
2010 2011 2012 2013 2014 2015 1. Real GDP growth (%) -1.0 0.8 2.5 3.0 3.0 3.0 2. Net lending of general government -32.4 -10.0 -8.6 -7.2 -4.7 -2.8 3. Interest expenditure 3.3 3.8 4.7 6.1 6.3 6.2 4. One-off and other temporary measures
-20.0 0.0 0.0 0.0 0.0 0.0
5. Potential GDP growth (%) -1.4 -1.2 -0.6 0.5 1.1 1.7 contributions:
- labour - capital - total factor productivity
-2.2 0.2 0.5
-2.0 0.0 0.7
-1.6 0.1 1.0
-0.7 0.1 1.1
-0.3 0.2 1.3
0.1 0.2 1.4
6. Output gap -6.1 -4.2 -1.2 1.2 3.1 4.5 7. Cyclical budgetary component -2.4 -1.7 -0.5 0.5 1.2 1.8 8. Structural budget balance -10.0 -8.3 -8.1 -7.7 -5.9 -4.6 9. Structural primary balance -6.7 -4.5 -3.4 -1.6 0.4 1.6
Notes: The structural budget balance excludes one-off measures. Rounding can affect totals. Source: Department of Finance calculations, using the EU Commission’s common methodology where relevant. On the basis of this approach, the General Government Balance is decomposed into its cyclical and structural components. Table 13 shows that a significant part of the deficit is structural. If interest expenditure is excluded from the calculations, the resulting structural primary balance in 2011 is estimated at -4.5% of GDP. In practice, all estimates of the structural position are subject to considerable uncertainty, though these uncertainties are heightened in an Irish context. As discussed in previous Stability Programme Updates and in annex 4 of this Update, measuring the supply side in a very open economy such as Ireland is particularly difficult. These difficulties are evidenced by the wide range of current estimates for potential growth. For example, the ESRI estimate that the Irish economy has the potential to grow at an average rate of 3% per annum over the period 2011-15, whereas the EU

30
Commission’s common methodology suggests a potential growth rate of around half that in 2015. The implication of the latter is a positive output gap of some 4½% of GDP in 2015, a figure which would suggest a rapidly overheating economy, with resulting inflationary pressures. This result is not viewed as plausible. Nevertheless, it is clear that erosion of the tax base and structural change within the economy (with the result that it may take a long time for unemployment to revert to pre-crisis levels), mean that a significant part of the deficit is structural and will not be eliminated with the cyclical recovery.

31
CHAPTER 4
QUALITY OF PUBLIC FINANCES
4.1. Policy strategy The expected improvement in the economy over the medium term will not be sufficient on its own to eliminate the gap between revenue and expenditure, as a large part of the deficit is of a structural nature. This imbalance between the levels of public spending and revenue cannot be eliminated without direct targeted action. In this regard, the Government intends to introduce a number of policies which will build upon the existing budgetary framework and which will aim to put the public finances back on a permanent sustainable footing. 4.2. Developments on the expenditure side There are a number of developments on the expenditure side of the account designed to assist in improving the efficiency and sustainability of the public finances. Comprehensive review of expenditure The delivery of further expenditure reductions, while maintaining a reasonable level of public services, will require a fundamental change to the way in which the Government and the Public Service operates. To assist in identifying the areas of public expenditure to which the required adjustments can be made, a Comprehensive Review of Expenditure will be undertaken in the coming months to examine all areas of public expenditure – including both Departments and Non-Commercial State Agencies - and to assess the effectiveness of spending programmes and value for money. The objectives of the spending review process will be to provide the Government with a comprehensive set of decision options in order to:
• Meet overall fiscal consolidation objectives, both as regards spending and numbers reduction targets,
• Re-align spending with the Programme for Government priorities, • Consider new ways of achieving Government objectives in the context of public
sector reform.
The results of this Review will be considered in the context of Budget 2012, and will play a key role over the medium term, as part of Ireland’s Medium-Term Expenditure Framework. The Review will set initial medium-term expenditure allocations and ensure that programmes are performing efficiently and effectively in delivering on the Government’s priorities. It is envisaged that a Comprehensive Review of Expenditure will be undertaken periodically (every 2-3 years) in line with new or revised Programmes for Government. This would enable a strategic and transparent allocation of resources in line with changing priorities, if necessary, and allow for the efficient ongoing operation of the Medium-Term Expenditure Framework.

32
Capital review The Government has authorised a comprehensive review of capital investment, in parallel with the comprehensive review of current expenditure, to inform a new capital investment framework for the next several years. This will focus on investment in infrastructure that will promote economic recovery and employment. The review will take full account of Ireland’s current economic and budgetary challenges and will address those infrastructure priorities most crucial to helping Ireland’s economy return to a path of sustainable growth. Budgeting for performance The Government is also committed to sharpening the focus on performance at the organisational level. The existing process of resource allocation is heavily focused on financial inputs (‘how much money is being spent?’) rather than on outputs and impacts (‘what is being achieved and delivered with this money?’). While reforms such as the introduction of Annual Output Statements have improved the expenditure framework, there is much scope for further progress. The introduction of a new system of ‘performance budgeting’ should bring a sharper focus on the actual outputs and outcomes delivered with scarce public resources. The proposed approach – which has been piloted in the 2011 Estimates – presents Departmental Estimates on a Strategic Programme basis, consistent with the presentation of the respective Annual Output Statements and Statements of Strategy. These Estimates are also supplemented with certain performance information regarding the outputs and impacts of Programme expenditure. This initiative should facilitate Dáil Éireann in holding Ministers and Departments to account for the effective and efficient use of resources, and would link effectively with other performance-related initiatives under the reform agenda, including improved value-for-money arrangements and clearer target-setting for State agencies. Subject to a critical review of the results of the pilot exercise across the votes of the Departments of Finance and Agriculture, it is intended that the pilot budgeting process will be extended to other Departments and Offices from the 2012 Estimates on. 4.3. Developments on the revenue side In keeping with international evidence and domestic experience which suggests that fiscal consolidation based primarily on expenditure reductions is more favourable for economic growth, the bulk of the large adjustments that have been implemented since mid-2008 have been to expenditure. However, considerable adjustments on the revenue side of the account have also been implemented as part of the fiscal correction process. Income, capital, inheritance, indirect, carbon, pensions and property related taxes have all been increased during this period. In terms of total taxes on income, marginal tax rates have increased across the board and the numbers paying tax has been increased considerably.
• The top marginal tax rate has increased from 43.5% for employees in 2008 to 52% in 2011.
• For the self employed it has increased from 46.5% to 55%.

33
• In addition, approximately 510,000 more people (or close to one quarter of the labour force) will pay the new Universal Social Charge than had been paying the Health and Income Levies, which the USC replaces.
Examples in other areas of taxation include:
• Tax on capital gains/inheritance has increased by a quarter from 20% to 25%; • Tax on interest from savings has been increased by a third from 20% to 27%; • An annual property charge on second homes has been introduced; • A comprehensive Carbon Tax has been introduced at €15 per tonne, with no
exceptions or exemptions. It is planned to increase this further over the next three years;
• Tax relief associated with private pension provision has been considerably reduced; and
• A programme of termination of tax expenditures has been set in train. The primary function of the tax system is to provide the resources to finance public expenditure. Taxation policy can also be used to incentivise growth, promote income and wealth redistribution and address social and environmental concerns. An efficient tax system must seek to minimise compliance costs and collection costs, while targeting tax avoidance and evasion. Revenue is generated by economic activity, not by increased tax rates. High tax rates and a narrow base of economic activity may raise far less revenue than lower rates on a much wider base. Accordingly, recognition must be given to not just the ‘quantity’ of revenue to be raised but also to the ‘quality’ of the measures adopted and their ability to deliver sustainable structural reforms. Stability of the revenue base is key. It is clear now that a significant proportion of the tax revenues that were generated in the middle part of the last decade were of a temporary nature and will not return even as the economy begins to grow again. Tax revenues in the future must not be as susceptible to economic downturns as the capital taxes generated in the mid part of the last decade have proven to be. The tax system must be capable of raising the resources necessary to meet public demands in a manner that does not unduly impede economic development and maximises our economic growth potential. Ireland is, under the Joint EU/IMF Programme, already implementing a comprehensive structural reform package including measures to broaden the tax base. In this regard, the Irish Government has chosen to spread the increased taxation across income, capital, inheritance, indirect, carbon, pensions and property related taxes. However, additional policy measures that could hinder growth and recovery should be avoided. In this respect, the Government remains steadfastly committed to the maintenance of Ireland’s 12½% corporate tax regime as the cornerstone of Irish industrial policy. Ireland is a small, open, peripheral economy with a heavy concentration of foreign direct investment. The 12½% corporation tax rate is critical to supporting Ireland’s economic recovery and employment growth. Certainty is a key element desired by investors and to abandon the present corporation tax policy would substantially

34
damage Ireland's ability to attract foreign direct investment and, hence, Ireland’s ability to 'grow our way' to economic recovery. The behavioural effects of a corporation tax rate increase would be significant and detrimental to Ireland’s future prospects. An OECD multi-country study suggests that a 1% increase in the corporate tax rate reduces inward investment by 3.7% on average. Other recent research by the OECD also points to the importance of low corporate tax rates to encourage growth. In ranking taxes by their impact on economic growth, corporate tax was found to be most harmful. In other words, Governments seeking additional tax revenues would be advised to consider increasing all other types of tax (property, consumption and income) before increasing corporate taxes. 4.4. EU/IMF Programme of support commitments Separately, under the terms of the Joint EU/IMF Programme of Financial Support, Ireland is committed to implementing a range of reforms to the process of budgetary management including the introduction of a medium-term expenditure framework with effective multi-annual expenditure ceilings in each area, an independent Budget Advisory Council, and a Fiscal Responsibility Law to provide for the sound management of the public finances. Specifically, there is a requirement to have a Fiscal Advisory Council in place by the end of June 2011 and a Fiscal Responsibility Law in place later this year.

35
CHAPTER 5
INSTITUTIONAL FEATURES OF PUBLIC FINANCES
5.1. Policy strategy The Programme for Government sets out an ambitious agenda of budgetary reform, intended to move Ireland’s system of budgeting and fiscal policy formulation into line with best international practice. A Department of Finance Discussion Document, “Reforming Ireland’s Budgetary Framework”4, set out a range of potential policy options in this regard, in advance of final policy decisions by Government. The Discussion Document has been drafted in the light of EU and other international proposals in this area, as well as analysis and proposals from the Joint Oireachtas Committee on Finance and the Public Service. The key reforms which are proposed in the Discussion Document are the introduction of legislation that would seek to provide for:
• A set of ‘fiscal rules’ designed to ensure that minimum rules of good practice are observed through the economic cycle and enforced on a ‘comply or explain’ basis;
• A multi-annual expenditure framework setting out fixed limits for current expenditure;
• A new system of performance budgeting to focus on actual outputs and outcomes delivered; and
• An independent Fiscal Advisory Council to assess and comment publicly on the Government’s budgetary plans.
The Joint Oireachtas Committee on Finance and the Public Service’s November 2010 report, “Macroeconomic Policy and Fiscal and Economic Governance”, included a range of proposals such as the introduction of multi-annual budgeting and fiscal rules, the establishment of an independent Economic Advisory Council and a separate Budget Review Council. 5.2. Budgetary reform Ireland has a long-established budgetary framework which has undergone a series of reforms in recent years to assist in making the budgetary process more transparent and effective, including:
• The introduction in 2007 of a Unified Budget, whereby spending and revenue decision are announced together on Budget day.
• Annual Output Statements were introduced in 2007 to provide a link between performance and resource allocation.
• The introduction of multi-year capital envelopes in 2004. However, as has been the case at European level in terms of the Stability and Growth Pact, there are weaknesses with the traditional domestic framework as it relates to multi-annual fiscal planning and management, including with respect to expenditure.
4 This Document is available on the Department of Finance website at: http://www.finance.gov.ie/documents/publications/guidelines/budgetref.pdf

36
There is a need for further strengthening of the budgetary architecture and the Programme for Government envisages a number of initiatives in this regard. The processes of economic and budgetary governance are now under active review at EU level, and specific proposals have been tabled to help ensure that all EU Member States manage their national budgets in a sustainable way. Reform proposals have also been developed at national level, as set out above. In addition, specific target dates for action on these matters have been agreed under the Joint EU/IMF Programme of Financial Support. The outline of the reform agenda is set out below (and in chapter 4), subject to refinement on the basis of public discussion and feedback, and to Government decisions in each case. Independent Fiscal Advisory Council There are growing moves at international level to supplement the traditional Governmental apparatus of budgetary planning and decision-making with independent fiscal bodies. The advantages cited for establishing such bodies include greater transparency of the budgetary process through public commentary on fiscal policy assumptions and decisions of government and stronger critique of official forecasts and proposed fiscal policy objectives. Essentially, an independent fiscal body can have a ‘soft enforcement’ role which helps to support a government’s capacity to adhere to budgetary policy. The Government is committed to establishing a Fiscal Advisory Council with an independent remit to assess and comment publicly upon the Government’s budgetary plans and forecasts. In order to be effective, the membership of the Council should be no more than five respected individuals with a strong track record in economic and financial matters and, to ensure added-value to the overall process, it should include international expertise. Appointments should be for a fixed period. It is envisaged that, in line with the Joint EU/IMF Programme of Financial Support, a Fiscal Advisory Council will be established by end-June 2011. The legislative underpinnings of the Fiscal Advisory Council may be provided for through the Fiscal Responsibility Bill later in the year. A new legal and administrative framework – Fiscal Responsibility Act It is proposed that a reformed fiscal framework should operate within a new legal context and be underpinned by new administrative arrangements. The key elements of the new architecture can be provided for in law by means of a Fiscal Responsibility Act, and a Bill will be brought forward at an early stage for discussion and will be enacted before the end of 2011. Revised and realigned administrative arrangements, including Circulars from the Department of Finance (or the Department of Public Expenditure and Reform as appropriate), can give effect to other components of the new framework such as the detailed arrangements for operating the Medium-Term Expenditure Framework, strengthened value-for-money arrangements and the development of performance budgeting.

37
CHAPTER 6
LONG-TERM SUSTAINABILITY OF PUBLIC FINANCES 6.1. Summary In addition to the budgetary challenges arising from the recent fiscal and banking crises, Ireland’s public finances – along with those of many other Member States – will face increasing pressure in the decades ahead as the composition of the population becomes older. The extra spending pressure associated with an ageing society will have major implications for the long-term sustainability of the public finances, manifesting itself in two ways. First, spending on pensions, health and long-term care as a percentage of GDP will rise. Second, the share of the population tasked with financing it will shrink. Ireland’s ability to meet these longer-term challenges will require the implementation of appropriate and timely policy responses, a process which has already started. 6.2. Long-term budgetary prospects including the implications of ageing The latest demographic projections from EUROSTAT5 indicate that the size and composition of Ireland’s population will undergo considerable change in the coming decades. The number of older people will rise considerably in both absolute and relative terms. The population aged 65 and over - which currently stands at about 11 per cent - is expected to more than double by 2060. In contrast, the share of the working age population is projected to gradually fall from around 69 per cent to below 60 per cent. There are currently about six people of working age for every older person in Ireland, which is well below European norms. This ratio will change to about two to one by 2060. The ageing of the population will result in increases in public expenditure. Projections carried out at EU level by the Economic Policy Committee and the European Commission provide an estimate of the magnitude for Ireland. These projections indicate that public spending on pensions, health and long-term care will increase from 12 per cent of GDP in 2007 to 15 per cent by 2030 and to 21 per cent by 2060. Potential savings from education expenditure will contribute only a small offsetting amount. Pension projections undertaken at national level as part of the National Pensions Framework6 (NPF) presents a similar picture of rising expenditure. Over the period to 2050, the NPF projects that spending on social welfare and public service pensions will increase from around 5½ per cent of GDP to 15 per cent. The technical long-run projections set out below, while subject to considerable uncertainty, are a useful tool in demonstrating the scale and timing of fiscal challenges. They are, however, quite dated given the impacts of the recession, particularly for Ireland. Updated projections, which should better reflect recent developments, will be made available in the 2012 Ageing Report.
5 EUROSTAT (2008) EUROPOP 2008 6 National Pensions Framework (Chapter 2) - www.nationalpensionsframework.ie.

38
Table 14: Long-term spending projections
% of GDP unless otherwise stated 2007 2020 2030 2040 2050 2060
Total age-related expenditures 17.1 18.7 20.4 21.7 24.5 26.1 Total pension expenditure 5.2 6.4 7.5 8.6 10.5 11.3 Social security pensions 4.0 4.6 5.4 6.4 8.0 8.6 Old-age and early pensions 2.6 3.2 4.0 5.0 6.6 7.2 Other pensions 1.4 1.4 1.4 1.5 1.4 1.4 Occupational pensions (Public Service) 1.2 1.8 2.1 2.2 2.5 2.7 Health care 5.8 6.1 6.5 6.9 7.3 7.6 Long-term care 0.8 0.9 1.1 1.4 1.8 2.2 Education expenditure 4.5 4.4 4.4 4.0 4.1 4.2 Other age-related expenditures (Unemployment benefit)
0.8 0.9 0.9 0.8 0.8 0.8
Underlying Assumptions Labour productivity growth 2.2 1.8 1.7 1.7 1.7 1.7 Real GDP growth 2.6 1.7 1.7 1.3 1.1 1.7 Participation rate males aged 15-64 81.4 81.8 80.6 80.5 81.2 81.1 Participation rate females aged 15-64 63.3 69.4 70.7 71.2 71.3 71.3 Total participation rates aged 15-64 72.5 75.7 75.7 76.0 76.3 76.3 Unemployment rate aged 15-64 4.7 5.1 5.1 5.1 5.1 5.1 Population aged 65+ over total population 11.2 13.3 16.0 19.4 23.7 25.2 Source: Economic Policy Committee and European Commission: 2009 Ageing Report, Economic and Budgetary Projections for the EU-27 Member States (2008-2060) 6.3. Policy response In October 2009, the European Commission assessed the sustainability of Ireland’s public finances as being of ‘high risk’ due to the large age-related spending pressures that lie ahead, as well as the budgetary position. In response to this and the EDP Recommendation of December 2010, a number of steps have been taken to address the long-term sustainability of the public finances, while also seeking to safeguard the welfare needs of older members of society. Recent measures in this respect include the following:
• A public service pension-related deduction was introduced in 2009. It is structured as a progressive tax-relieved levy on the gross pay of pensionable public servants. The deduction improves fiscal sustainability as it ensures that public servants make a greater contribution to the Exchequer to take account of their final-salary pensions;
• Public sector pay has been cut by an average of 14 per cent (with the more modest reductions applying to those at the lower end of the earnings spectrum) which will contribute to lowering the future pensions bill.
The National Pensions Framework, which was published in March 2010, set out the following substantial reforms:
• The State pension age will increase to 66 in 2014, 67 in 2021 and 68 in 2028. This is also a commitment under the Joint EU/IMF Programme;
• A ‘total contributions approach’ will be introduced for those reaching the State pension age from 2020, replacing the current averaging system;

39
• For public service pensions, a new pension scheme for all new entrants will be introduced in 2011. This will lower the cost of public service pension provision into the future;
• Tax relief for contributions to existing occupational and personal pension arrangements currently based on a contributor’s marginal rate of tax will be replaced with a State contribution equal to 33 per cent tax relief. This will promote simplicity and equity and ensure that similar options are available to all groups of employees.
With respect to long-term care, the main development has been the ‘Fair Deal’. This puts the financing of individuals’ long-term care needs on a fair and equitable basis - people are asked to contribute towards their long-term nursing home care according to their means. Notwithstanding the above steps, the scale of the task is such that it will be necessary to put in place additional policy measures in order to safeguard the long-term sustainability of the public finances. Such measures could include increasing the population at work, cutting age-related spending and improving the country’s productive capacity. However, given the present budgetary situation, due regard will need to be given to the impact on the wider economy of the various options and their timing. 6.4. Implicit liabilities and medium-term budgetary objectives In October 2007, the ECOFIN Council agreed that long-term fiscal sustainability, notably the future impact of ageing, should be better taken into account when Member States are determining their medium-term budgetary objectives (MTOs). The subsequent EU Commission document “Modalities for the implementation of the new MTOs” set out the methodology for doing so. In the Irish case, the findings suggest an MTO of -½ per cent of GDP, which allows for 33 per cent of the likely cost of ageing to be covered. For Ireland, meeting the challenges posed by an older population will require an appropriate policy mix, involving some degree of pre-funding, but also measures along the lines discussed above. These considerations, together with the updated long-term spending projections of the Economic Policy Committee and the European Commission, will inform the revision of Ireland’s MTO in due course. In the meantime, the focus is on reducing the General Government Deficit to below 3% of GDP by 2015 in the manner set out in this Stability Programme Update.

40
CHAPTER 7
THE EXCESSIVE DEFICIT PROCEDURE
7.1. EDP Recommendation - April 2009 On 27 April 2009, the ECOFIN Council concluded that an excessive deficit existed in Ireland and recommended that this deficit be corrected by 2013. On 2 December 2009, the Council decided that action had been taken in accordance with this recommendation, but noted that unexpected adverse economic events with major unfavourable consequences for the public finances had occurred after its adoption. In light of this, a new recommendation was issued, with the deadline for correction of the excessive deficit extended by one year, to 2014. This recommendation also stated that the deficit should be reduced in a credible and sustainable manner by taking action within a medium-term framework - ensuring an average annual fiscal effort of 2% of GDP over the period 2010-14, which would also help put the gross debt ratio back on a declining path towards 60% of GDP. The Council agreed a deadline of 2 June 2010 for the Irish government to take effective action, and to outline in some detail the consolidation strategy necessary to make progress towards the correction of the excessive deficit. 7.2. Assessment of action taken In July 2010, the European Commission assessed the action taken by Ireland, concluding, on the basis of information available at the time, that Ireland was making adequate progress towards the correction of the excessive deficit within the time limits set by the Council. In particular, a significant savings package for 2010 (2.5% of GDP) had been implemented, broadly in line with the Council's recommendation. Beyond 2010, a medium-term consolidation strategy had been outlined in some detail, including deficit targets and quantifying packages to reach them with a view to correcting the excessive deficit by 2014, the deadline recommended by the Council. In view of this assessment, the Commission considered that no further steps in the Irish excessive deficit procedure were needed. In accordance with the Treaty and the Stability and Growth Pact, budgetary developments in Ireland would, however, continue to be closely monitored. 7.3. Revised EDP Recommendation - December 2010 Following Ireland’s request for funds under the Joint EU/IMF Programme, a revised ECOFIN Council Recommendation was issued to Ireland. The key elements of this revised recommendation are as follows:
• The deadline for the correction of Ireland’s EDP was extended by one year to 2015. This followed from the EU Commission’s analysis that a further year might be necessary in order to achieve the 3% deficit target. This analysis was based on a more cautious growth outlook for 2011-12, and the need to service the cost of the additional bank recapitalisations envisaged under the Joint EU/IMF Programme for Ireland. This was fully in line with Article 126(7) of

41
the Treaty, which allows for a country’s EDP deadline to be extended if unexpected adverse economic events with major unfavourable consequences for government finances have occurred.
• The deficit targets under the revised EDP, as agreed on 7 Dec 2010, are: 10.6%
of GDP in 2011, 8.6% of GDP in 2012, 7.5% of GDP in 2013, 5.1% of GDP in 2014 and 2.9% of GDP in 2015, where the projected annual deficit path does not incorporate the possible direct effects of potential bank support measures in the context of the Government’s financial sector strategy.
The current outlook is for a General Government Balance of -10% this year. Notwithstanding that there is some downside risk to this forecast, it is expected that the EDP target for 2011 will be achieved. Annex 5 outlines the consolidation measures that have been taken over the past three years to consolidate the public finances.
• In order to limit the risks surrounding the budgetary adjustment, Ireland was
urged to establish a Fiscal Advisory Council to provide an independent assessment of the Government's budgetary position and forecasts; and to adopt a Fiscal Responsibility Law, providing for a medium-term expenditure framework with binding multi-annual ceilings on expenditure in each area.
Draft legislation in respect of a Fiscal Responsibility Law, which will also include a Fiscal Advisory Council, is being prepared in line with the timescale of mid-2011 for its implementation under the Joint EU/IMF Programme. A discussion document, “Reforming Ireland’s Budgetary Framework”, containing the draft legislative heads of the bill, was published on 1 April 2011 and can be viewed on www.finance.gov.ie.
• 7 June 2011 was established as the deadline by which the Irish Government
should take effective action to specify the measures that will be necessary to make progress towards the correction of the excessive deficit.
7.4. Policy conditionality under the EU/IMF Programme Under the Joint EU/IMF Programme, Ireland has agreed a Memorandum of Understanding (MoU) which contains specific economic and financial policy conditionality. This policy conditionality is consistent with and, indeed, goes further than the EDP Recommendation. The quarterly disbursement of financial assistance under the Programme is subject to quarterly reviews of this conditionality for the duration of the programme. The release of instalments will only occur if a positive evaluation of progress is made with respect to the policy criteria set out in the MoU, and with respect to ECOFIN Council Decisions and Recommendations in the context of the Excessive Deficit Procedure. The first and second quarterly review of Ireland’s actions under the Joint EU/IMF Programme has just taken place (April 2011). It was concluded that Ireland has met its agreed targets to date. The next review will be in July 2011.

42
ANNEX 1
IRELAND’S NATIONAL REFORM PROGRAMME UNDER THE EUROPE 2020 STRATEGY – SUMMARY OF IRELAND’S NATIONAL TARGETS
The Europe 2020 Strategy has been adopted as a successor to the Lisbon Strategy for Jobs and Growth and aims to enable Europe to emerge stronger from the current economic crisis and to turn the European Union into a smart, sustainable and inclusive economy. Five headline targets for 2020 have been set at the level of the EU as a whole, covering (i) employment, (ii) research and development, (iii) climate change, (iv) education and (v) poverty. Ireland’s National Reform Programme (NRP) identifies national targets in each of the five headline areas, the main bottlenecks to reaching these targets and sets out the measures necessary to allow Ireland overcome these and achieve its national targets. The NRP complements the Stability Programme Update as part of the new European Semester and has also been submitted to the European Commission in April 2011.
Ireland’s National Targets
Employment – to increase the employment rate to 69-71% for women and men aged 20-64, including through the greater participation of young people, older workers and low-skilled workers and the better integration of legal migrants, and to review the target level of ambition in 2014, in the context of a proposed mid-term review of the Europe 2020 Strategy. Key measures include the provision of a new higher education activation fund and the introduction of a Jobs Initiative in May 2011. Research and Development – to raise combined public and private investment levels in this sector to 2.5% of GNP (approximately equivalent to 2.0% of GDP). Key measures include the maintenance of public investment in R&D at the existing level to 2014, the completion of a comprehensive research prioritisation project by October 2011, and the development of a national IP protocol and appropriate supporting structures. Climate Change – to reduce emissions in the non-traded sector by 20% compared to 2005 levels; to increase the share of renewables in final energy consumption to 16%; and to move towards a 20% increase in energy efficiency. Key measures include the implementation of the National Climate Change Strategy and compliance with the mitigation requirements of the 2008 EU Climate and Energy Package, implementation of the National Renewable Energy Action Plan and the development of a national retrofit programme. Education – to reduce the percentage of 18-24 year olds with at most lower secondary education and not in further education and training to 8%; and to increase the share of 30-34 years olds having completed tertiary or equivalent education to at least 60%. Key measures include implementing a national action plan for educational inclusion Delivering Equality of Opportunity in Schools (DEIS), completing the mid term review of the National Plan for Equity of Access to Higher Education 2008-2013, and increasing the accessibility of higher education through an increase in flexible provision, particularly part time provision, and through developing other entry routes into higher education, including Recognition of Prior Learning (RPL). Poverty – To reduce the number experiencing consistent poverty to between 2-4% by 2012, with the aim of eliminating consistent poverty by 2016, which will lift at least 186,000 people out of the risk of poverty and exclusion. The Government proposes to initiate a comprehensive review of the national target in 2011. Key measures include income supports, activation measures, the key linkages to education and training and access to quality services through implementation of the National Action Plan for Social Inclusion.

43
ANNEX 2
COMPETITIVENESS DEVELOPMENTS IN IRELAND
The early part of the previous decade saw a steady erosion of Ireland’s competitive position with consumer prices, asset prices and wages all increasing at rates over and above our European peers. However, since mid-2008 this trend has started to correct and Ireland as a whole is becoming more competitive. Although there are a variety of proxies for competitiveness including energy costs, business friendly environment, etc., here the focus is on labour costs, consumer prices and nominal exchange rates. Labour costs According to the latest European Commission forecasts7, unit labour costs in Ireland will fall by an estimated 9 per cent over the period 2009 to 2012. The equivalent figure for the euro area as a whole is an increase of about 5 per cent, implying a relative improvement of 14 per cent. Unit labour cost developments in 2010 vis-à-vis our main trading partners are set out in the graph opposite. In terms of actual wages, there was a modest fall in private sector wages through 2010, with weekly earnings down 1 per cent. In the public sector, average weekly earnings fell by 4¾ per cent in 2010 on foot of the consolidation measures put in place by the Government. Wage developments in the public sector can have important signalling effects to the private sector. Consumer prices Consumer prices (harmonised basis) in Ireland have fallen by a cumulative 3½ per cent between 2008 and 2010. This compares with an increase in consumer prices of around 2 per cent in the euro area as a whole. In other words, a relative improvement of around 5½ per cent. Despite a return to positive territory more recently, Irish inflation remains considerably below that of the euro area and reflects an ongoing improvement in price competitiveness. Nominal exchange rate Movements in the euro exchange rate can be summarised by developments in the nominal Harmonised Competitiveness Indicator (HCI), which is a trade weighted exchange rate. Over the course of 2010, the nominal HCI depreciated by 5 per cent. More specifically, there has been an improvement (compared to the peak in 2009) in our nominal exchange rate vis-à-vis Sterling, which provides a significant competitiveness boost to indigenous Irish exports for whom the UK is our largest export market.
7 Commission Autumn 2010 forecasts are used to ensure the comparison is consistent.
Looking to the future While price and wage adjustments, along with improvements in productivity are helpful, the Joint EU/IMF Programme outlines a number of structural reforms to further restore competitiveness and support economic growth. Figure 2a: Unit labour cost developments in 2010
-6
-5
-4
-3
-2
-1
0
1
2
Ireland US Euro area UK
Source: Commission Autumn Forecasts
Figure 2b: Inflation differentials
-5.0
-4.0
-3.0
-2.0
-1.0
0.0
1.0
2.0
3.0
4.0
5.0
1999
2000
2001
2002
2003
2004
2005
2006
2007
2008
2009
2010
2011
Perc
enta
ge p
oint
diff
eren
tial
Rise = loss of competitiveness
Fall = gain of competitiveness
Source: Department of Finance
Figure 2c: Nominal exchange rate vis-à-vis Sterling

44
ANNEX 3
STRUCTURAL REFORM SIMULATIONS
A number of structural reforms are set out in the Programme for Government and the Joint EU/IMF Programme, while the National Reform Programme (NRP) outlines Ireland’s National Targets in areas such as Research and Development (R&D). To illustrate the potential impact of structural reforms on the overall level of GDP, this box presents the results of some simulations which allow for a boost to innovation, competitiveness and R&D. The analysis was conducted using the QUEST III model with endogenous growth developed by the European Commission specifically for the task of examining structural reform. Innovation The Programme for Government commits to the development of strategies which will lead to a greater focus on innovation. In order to measure the effect of an increase in innovation, an exogenous productivity improvement shock is implemented through a 1 percent increase in the production function of final output (Reform A). Increasing the level of efficiency has a permanent positive effect on GDP, with increases after the shock of 1.12 percent in the medium term (5 years), 1.20 percent in the long run (20 years) and 1.24 percent in the very long run (50 years). The GDP effect is driven by an endogenous R&D response to the Total Factor Productivity (TFP) shock in the final goods sector. The increased demand for investment goods stimulates entry into the intermediate goods production sector, which in turn increases the efficiency of capital and labour. Figure 3a: Effect of structural reforms on GDP (% change from baseline of no reform)
-0.2
0
0.2
0.4
0.6
0.8
1
1.2
1.4
1 5 10 20 50
Years
% C
hang
e
Reform A Reform B
Reform C Reform D
Source: Department of Finance.
Competitiveness Under the Joint EU/IMF Programme of Financial Support, Ireland has made a commitment to remove restrictions to trade and competition in sheltered sectors, such as the legal, medical and pharmaceutical professions. In order to measure the effect of such a reform on GDP, a shock that reduces the mark-up of prices over marginal costs is simulated. A one percent reduction of the price mark-up in the final goods sector increases GDP by 0.37 percent in the medium term, 0.66 percent in the long run and 0.79 percent in the very long run (Reform B). This is due to the endogenous growth effects generated by an increased demand for capital, which stimulates entry of new firms and increases R&D. Research and Development An oft-heard argument is that market economies underinvest in R&D because individual investors do not fully internalise the external effects from knowledge spillovers. The existence of positive externalities associated with R&D suggests that policies boosting knowledge investment yield social benefits. Therefore, a key element of the National Reform Programme is increased investment in the R&D sector. In order to quantify the benefits of such an increase, this section considers two alternative methods of incentivising such investment. The first scenario (Reform C) is an R&D subsidy in the form of a tax credit of 0.1 percent of GDP. The results show that permanent subsidies for R&D-using sectors give a permanent increase in GDP in the long run. Higher tax-credits allow for a reduction in the fixed costs of firms producing intermediate goods. This in turn raises the demand for blueprints and stimulates R&D, as well as reallocating high skilled workers from production into the research sector. The size of the effect is however rather limited. The results show an increase in GDP relative to the baseline

45
of 0.01, 0.15 and 0.22 percent in the medium, long and very long run respectively. Note that it takes time for the output effects to emerge because of short run output losses due to the reallocation of high skilled workers from production to research. Moreover, due to supply constraints for high skilled workers, part of the fiscal stimulus is offset by wage increases for high skilled workers. Reform D examines the effect of a subsidy on the wages of researchers in the R&D sector. Although there is no positive effect in the medium term, the results show somewhat stronger GDP effects in the long and very long run of 0.34 percent and 0.53 percent respectively. Conclusion The results suggest that increases in innovation and competiveness have a positive effect on output in the short, medium and long term. Reforms aimed at increasing the level of R&D investment also have a positive influence on output, albeit to a lesser extent than the other reforms examined.

46
ANNEX 4
OUTPUT GAP METHODOLOGY
The structural budget balance is intended to form a crucial part of the fiscal surveillance process under the Stability and Growth Pact. The information conveyed in this measure is used by policy makers to inform their assessment of the appropriate mix of macroeconomic and structural policies in EU member states. A harmonised production function methodology, which utilises the concepts of potential growth, the Non-Accelerating Wage Rate of Unemployment (NAWRU) and the output gap, has been developed by the EU Commission and Member States to calculate the structural balance. This involves the decomposition of the budget balance into a cyclical and a non-cyclical, or structural, component. The idea is to separate the cyclical influences on the budget balance resulting from the divergence between actual and potential output (the output gap), from those which are non-cyclical. However, the current method employed may not be the most appropriate for every Member State and its applicability to Ireland is a question that merits particularly close scrutiny.
The NAWRU in a small open economy The NAWRU is defined as the rate of unemployment at which there is no upward or downward pressure on the wage/inflation rate and is thus used to indicate whether there is a risk of inflationary build-up in the economy. The NAWRU is a notional rate and is unobservable. As such it must be estimated and its estimation is bound up with the nature of the inflationary process. In this regard, it needs to be emphasised that the inflation process differs significantly between a large economy and a small open economy, with external price developments playing a crucial role in the latter. The more open the economy, the more inflation is determined by international price developments. Ireland has a high degree of openness in both its product and labour markets, and therefore it is not surprising that a clear relationship between labour market tightness and either price or wage inflation has not been established. Thus, in the Irish case, any attempt to extract information about the unobservable NAWRU from aggregate inflation measures, such as the Harmonised Index of Consumer Prices (HICP) or wage inflation, is likely to be hampered by these external factors. Therefore the validity of using the NAWRU in a small open economy such as Ireland is questionable. NAWRU, which is relevant for both large and small open economies, is the ‘mechanical’ autoregressive process by which the NAWRU is extrapolated for medium-term forecasting purposes. This technique has been challenged on the grounds that it is biased towards pessimism, as it generates estimates of an ever increasing
NAWRU in recession phases for some countries. Recent attempts by the European Commission to find an economic foundation for the benchmarking of this extrapolation, such as through Okun’s law, have been unsuccessful yet highlight the fact that there is a consensus to find a more appropriate methodology. These issues result in an unrealistically high level for the NAWRU in the Irish case, which is estimated to be at 13.8 percent by 2015. This suggests that, even at relatively high rates of actual unemployment, there would be considerable inflationary pressure on wages. This is viewed as unlikely given the actual high rate of unemployment in the labour market. Kalman filter method Trend efficiency is measured using a bivariate Kalman filter model which extracts information about the cycle from an additional, explicitly observable indicator - capacity utilisation (CU) - that is strongly tied with the cycle variable. However, the collection of this CU data has been discontinued in Ireland, with the last sample observation relating to 2008. Since then there have been significant fiscal consolidation and a sharp deterioration in the economic situation, none of which are reflected in the data. Extrapolating this series out and using it to guide a forecast of the output gap is therefore likely to result in an unrealistic estimate. The Department of Finance is continuing to work on the identification of a more regularly updated variable, which would accurately reflect the recent changes in the Irish economy, to be used in place of capacity utilisation.

47
Conclusion These issues arising out of the current methodological framework have resulted in substantially reduced potential output figures for Ireland, with the knock on effect that the output gap for 2015 is positive at around 4½ percent of GDP. Given that this figure would suggest a rapidly overheating economy with resulting inflationary pressures; this result is not viewed as plausible.

48
ANNEX 5
SUPPLEMENTARY DATA
Table 5a: Measures announced to improve the budgetary position Announcement Planned Budgetary Impact July 2008: Expenditure Adjustments Savings focused on reducing the payroll bill, introducing a
range of efficiency measures across Departments and Agencies and reducing expenditure on consultancy, advertising and PR. In addition there was some re-prioritisation of capital projects.
€440 million saving in 2008 €1 billion saving in a full year
October 2008: Budget 2009 Revenue raising package – a significant element of which
was the introduction of an income levy. Strictly contained planned expenditure for 2009. Most areas
of expenditure saw reductions, with the health, education and welfare areas being the main areas where spending was allowed to increase reflecting demographic and labour market pressures.
€1.95 billion yield in 2009 (€2 billion in a full year)
February 2009: Expenditure Adjustments Most significant measure in this package was the introduction
of the public sector pension-levy which has the effect of reducing the public service pay bill.
€1.8 billion saving in 2009 (€2.1 billion in a full year)
Postponed next increase scheduled under the Social Partnership Towards 2016 pay agreement.
Saving of up to €1 billion in 2010
April 2009: Supplementary Budget Revenue raising package – main features were an increase in
the income levy and changes to social security (PRSI) and health levy arrangements.
Tax Measures: €1.8 billion in 2009 (€3½ billion in a full year)
Adjustments to current and capital expenditure Current: €886 million saving in 2009 (€1.2 billion in a full year) Capital: €576 million saving in 2009 (€600 million in a full year)
December 2009: Budget 2010 Budget 2010 delivered an overall package of €4 billion
through the implementation of expenditure adjustments primarily, including:
€760 million reduction in social welfare spending with reductions averaging 4% in working age welfare payments and 10% reduction in child benefit (1st and 2nd child);
€1 billion savings in public sector payroll through average reduction of 6.5% in public sector salaries;
€975 million reduction in other programme spending; €960 million savings in capital spending.
Current Expenditure: €3.1 billion saving in 2010 Capital Expenditure: €961 million saving in 2010 Taxation: €17 million yield in 2010 (€126 million yield in a full year)
December 2010: Budget 2011 Budget 2011 delivered an overall package of €6 billion
including: €1.4 billion in tax/PRSI increases – mainly to income
tax; €2.1 billion current expenditure savings with €875
million from Social Welfare (reductions in working age payments/child benefit);
€1.9 billion savings in capital spending; €660 million in other measures – increased dividends;
state assets sales.
Current Expenditure: €2.1 billion saving Capital Expenditure: €1.9 billion saving Taxation/PRSI increases: €1.4 billion Other measures: €0.7 billion

49
Table 5b: General government balance – technical estimates ESA 2010 2010 2011 2012 2013 2014 2015
€m % of GDP Net lending (EDP B.9) by sub-sector 1. General government (=6-7) S.13 -49,906 -32.4 -10.0 -8.6 -7.2 -4.7 -2.8 2. Central government S.1311 -49,043 -31.9 -9.9 -8.5 -7.1 -4.5 -2.6 3. State government S.1312 n.a n.a n.a n.a n.a n.a n.a 4. Local government S.1313 52 0.0 -0.1 -0.1 -0.1 -0.1 -0.1 5. Social security funds S.1314 -915 -0.6 0.0 0.0 0.0 0.0 0.0 General government (S.13) 6. Total Revenue TR 53,279 34.6 35.5 35.1 35.1 35.4 35.1 7. Total Expenditure TE 103,185 67.0 45.5 43.7 42.4 40.1 37.8 8. Net lending/borrowing (=6-7) B.9 -49,906 -32.4 -10.0 -8.6 -7.2 -4.7 -2.8 9. Interest expenditure D.41 5,020 3.3 3.8 4.7 6.1 6.3 6.2 10. Primary balance ( = 1 + 9) -44,886 -29.2 -6.2 -3.9 -1.1 1.7 3.4 11. One-off and other temporary measures -30,862 -20.0 0.0 0.0 0.0 0.0 0.0 Selected components of revenue 12. Total taxes (12=12a+12b+12c) 34,509 22.4 24.5 25.3 25.5 25.9 25.9
12a. Taxes on production and imports D.2 17,863 11.6 11.8 11.4 11.1 10.9 10.6
12b. Current taxes on income, wealth etc. D.5 16,409 10.7 12.5 13.7 14.3 14.8 15.1
12c. Capital taxes (CAT) D.91 237 0.2 0.2 0.2 0.2 0.2 0.2 13. Social contributions D.61 11,385 7.4 6.4 6.1 6.1 6.1 5.9 14. Property Income D.4 2,766 1.8 1.5 1.1 1.0 0.9 0.9 15. Other 4,618 3.0 3.1 2.7 2.5 2.5 2.4 16. (=6) Total revenue ( =12+13+14+15) TR 53,279 34.6 35.5 35.1 35.1 35.4 35.1
p.m.: Tax burden 46,294 30.1 31.1 31.6 31.9 32.3 32.1 Selected Components of Expenditure 17 Compensation of employees + intermediate consumption D.1,P.2 26,762 17.4 16.8 15.6 14.6 13.4 12.5 17a. Compensation of employees D.1 18,074 11.7 11.6 10.9 10.4 9.7 9.0 17.b Intermediate consumption P.2 8,688 5.6 5.2 4.7 4.2 3.7 3.5 18. Social payments (18 = 18a+18b) 27,790 18.1 17.2 16.3 15.3 14.2 13.3
18a. Social transfers in kind supplied via market producers D.63 3,361 2.2 2.1 2.0 1.9 1.8 1.6
18b. Social transfers other than in kind D.62 24,429 15.9 15.1 14.3 13.4 12.5 11.6 19=9 Interest expenditure D.41 5,020 3.3 3.8 4.7 6.1 6.3 6.2 20. Subsidies D.3 1,143 0.7 0.7 0.6 0.5 0.5 0.4 21. Gross fixed capital formation P.51 5,894 3.8 2.9 2.6 2.3 2.0 1.8 22. Other 36,576 23.8 4.1 3.9 3.6 3.6 3.7 23=7 Total expenditure ( = 17+18+19+20+21+22 ) TE 103,185 67.0 45.5 43.7 42.4 40.1 37.8
p.m. : Government consumption (nominal) P.3 29,551 19.2 18.7 17.7 16.4 15.2 14.7
See notes on page 50.

50
Table 5c: Explanation of difference between exchequer balance and general government balance
Item €m
2010
2011
2012
2013
2014
2015
(a) Exchequer Balance -18,745 -18,165 -17,040 -13,405 -9,495 -6,885 (b) Interest adjustments -1,339 -1,205 -300 -2,120 -2,165 -1,950 (c) Exclude equity and loan transactions 259 -50 -20 -105 -190 -105 (d) Balance of non-commercial State
sponsored bodies 179 -45 40 -45 20 80 (e) Transactions between the Exchequer and
Government Departments/Offices and Extra-Budgetary Funds -669 -165 -25 -10 20 70
(f) Impact of the National Pensions Reserve Fund 1,958 590 290 285 290 290
(g) Accrual Adjustments 164 490 265 385 505 580 (h) Promissory Notes issued to Financial
Institutions -30,850 3,085 3,085 3,085 3,085 3,085 (j) Net (Borrowing)/Surplus of Central
Government ( = a to h) -49,043 -15,465 -13,705 -11,930 -7,930 -4,835 (k) Net Surplus of the Social Insurance Fund -915 0 0 0 0 0 (l) Net (Borrowing)/Surplus of Local
Government 52 -200 -200 -200 -200 -200 (m) General Government Balance
( = j + k + l ) -49,906 -15,665 -13,905 -12,130 -8,130 -5,035 (n) General Government Balance as % of
GDP ( = m / p ) -32.4% -10.0% -8.6% -7.2% -4.7% -2.8% (p) GDP (forecast to nearest 25m) 153,939 156,075 160,900 167,400 174,650 182,725
Notes to tables 5b and 5c: 1. Source: Department of Finance. 2. Rounding may impact on totals. 3. The presentation of the fiscal projections set out in these tables is guided by policies already
announced and those contained in the Joint EU/IMF Programme, which have been incorporated in the presentation of the budgetary aggregates. These tables have been prepared on the same basis as table 10 in chapter 3.
4. The technical estimate of the General Government Balance for 2015 reflects the Government’s commitment to achieving a deficit of less than 3% of GDP by 2015.
5. Tax burden includes taxes collected by the EU.