ipsos global @dvisor: global public attitudes to immigration 2011 - 2015
TRANSCRIPT

Global Views on Immigration
1 © 2015 Ipsos.
Tracking 2011 - 2015

2 © 2015 Ipsos.
Research Methodology and Internet Penetration The study is based on interviews with
17,533 adults across 24 countries,
with sample sizes as below:
Argentina 66.4%
Australia 88.8%
Belgium 81.4%
Brazil 45.6%
Canada 83.0%
China 40.1%
France 79.6%
Germany 83.0%
Great Britain 83.6%
Hungary 65.4%
India 11.4%
Israel 74.7%
Italy 58.4%
Japan 79.5%
Mexico 36.5%
Poland 64.9%
Russia 47.7%
Saudi Arabia 49.0%
South Africa 17.4%
South Korea 82.5%
Spain 67.2%
Sweden 92.7%
Turkey 45.7%
United States 78.1%
Approximately 500 interviews conducted in each of: Argentina, Belgium,, Hungary, India, Israel , Mexico, Poland, Russia, South Africa, South Korea, Sweden, Turkey Approximately 1,000 interviews conducted in each of: Australia, Brazil, Canada, China, France, Germany, Great Britain, Italy, Japan, Spain, and the United States.
Online Omnibus from June 19 to July 3, 2015
Interviews were conducted via DATA ARE WEIGHTED to age, gender, region and household income based on recent Census and/or population figures for each country. The global numbers were calculated such that each market was given equal weight when aggregated (unweighted base size = 500 for all)
Where internet penetration is more than approx. 60%, the data output is comparable to the general population.
Of the those surveyed, 16 countries yield results that are balanced to reflect the general population: Argentina, Australia, Belgium, Canada, France, Germany, Hungary, Israel, Italy, Japan, Poland, South Korea, Spain, Sweden, United Kingdom and United States
The eight remaining countries surveyed –Brazil, China, India, Mexico, Russia, Saudi Arabia, South Africa and Turkey – reflect online populations that tend to be more urban and have higher education/income than the general population.

3 © 2015 Ipsos.
2014 2013 2011
78% 80% 80%
92% 92% 81%
90% 87% 93%
88% 95% 91%
81% 84% 81%
93% 97% 90%
77% 79% 66%
85% 90% 89%
84% 73% 63%
88% 88% 83%
77% 79% 79%
85% 86% 94%
79% 85% 83%
82% 81% 83%
77% 79% 77%
82% 81% 85%
- - -
81% 85% -
63% 75% 65%
74% 82% 81%
76% 78% 78%
65% 72% 77%
70% 73% 75%
52% 46% 56%
56% 63% 85%
Over the last 5 years, in your opinion has the amount of migrants in country increased/decreased? Increased 81% (+3)…
Over the last 5 years, in your opinion has the amount of migrants in Country?
81%
97%
94%
93%
91%
90%
88%
87%
87%
86%
86%
84%
83%
81%
81%
80%
79%
77%
77%
73%
70%
69%
62%
60%
58%
Total
Turkey
Italy
South Africa
Hungary
Russia
Sweden
Argentina
Germany
Brazil
France
Belgium
Mexico
India
Poland
Great Britain
Israel
China
Saudi Arabia
Australia
Canada
United States
South Korea
Japan
Spain
2015 Top2Box (Increased a Lot/Increased a Little)

4 © 2015 Ipsos.
Over the last 5 years, in your opinion has the amount of migrants in your country increased/decreased? Showing: Top2Box (Increased a Lot/Increased a Little)
. Over the last 5 years, in your opinion has the amount of migrants in Country?
Is HIGHEST 2015 Has experienced an
INCREASE since 2014 Has experienced a
DECREASE since 2014 Is LOWEST in 2015
Turkey 97% Saudi Arabia 14% South Korea 8% Spain 58%
Italy 94% Sweden 11% Canada 6% Japan 60%
South Africa 93% Hungary 10% China 4% South Korea 62%
Hungary 91% France 9% Russia 3% United States 69%
Russia 90% Japan 8% Brazil 2% Canada 70%
Sweden 88% South Africa 5% Great Britain 2% Australia 73%
Argentina 87% Turkey 5% Australia 1% Saudi Arabia 77%
Germany 87% Poland 4% Belgium 1% China 77%
Brazil 86% Italy 4% India 1% Israel 79%
France 86% Mexico 4%
Belgium 84% United States 4%
Mexico 83% Germany 3%
India 81% Argentina 2%
Poland 81% Spain 2%
Great Britain 80%

5 © 2015 Ipsos.
2014 2013 2011
21% 20% 21%
30% 33% 38%
41% 41% 43%
33% 31% 39%
32% 30% 31%
39% 38% 37%
16% 17% -
26% 25% 19%
25% 22% 18%
35% 29% 30%
21% 21% 19%
15% 17% 16%
16% 12% 10%
25% 23% 27%
- - -
14% 14% 17%
17% 12% 15%
20% 22% 22%
13% 13% 17%
10% 8% 9%
12% 11% 14%
8% 8% 10%
8% 6% 8%
9% 12% 14%
7% 7% 6%
Would you say that immigration has generally had a positive/negative impact on Country? 21% Positive (N/C)…
Would you say that immigration has generally had a positive or negative impact on Country?
21%
52%
49%
37%
36%
31%
29%
28%
25%
23%
21%
20%
20%
19%
18%
16%
15%
15%
13%
12%
11%
11%
6%
5%
2%
Total
Saudi Arabia
India
Canada
Australia
Sweden
China
Great Britain
United States
Brazil
Spain
Germany
South Africa
South Korea
Israel
Mexico
Argentina
Poland
Japan
Belgium
France
Russia
Hungary
Italy
Turkey
2015 Top2Box (Very Positive/Fairly Positive)

6 © 2015 Ipsos.
Would you say that immigration has generally had a positive or negative impact on Country? Showing: 2015 Top2Box (Very Positive/Fairly Positive)
Would you say that immigration has generally had a positive or negative impact on Country?
Is HIGHEST 2015 Has experienced an
INCREASE since 2014 Has experienced a
DECREASE since 2014 Is LOWEST in 2015
Saudi Arabia 52% Saudi Arabia 22% Brazil 12% Turkey 2%
India 49% China 13% Sweden 8% Italy 5%
Canada 37% India 8% South Korea 6% Hungary 6%
Australia 36% Germany 5% Poland 5% Russia 11%
Sweden 31% South Africa 4% Italy 4% France 11%
China 29% Canada 4% Argentina 2% Belgium 12%
Great Britain 28% Australia 4% Hungary 2% Japan 13%
United States 25% Russia 3% France 1% Poland 15%
Great Britain 2% Argentina 15%
Mexico 2% Mexico 16%
Belgium 2% Israel 18%
South Korea 19%
South Africa 20%
Germany 20%
Spain 21%
Brazil 23%
7 © 2015 Ipsos.
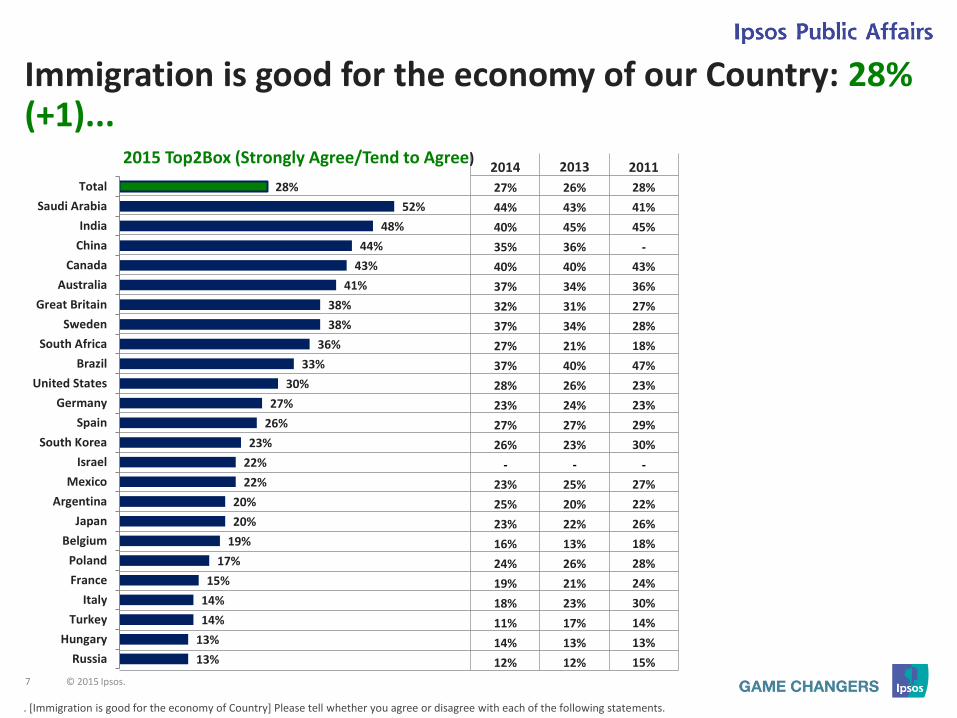
Immigration is good for the economy of our Country: 28% (+1)...
. [Immigration is good for the economy of Country] Please tell whether you agree or disagree with each of the following statements.
2014 2013 2011
27% 26% 28%
44% 43% 41%
40% 45% 45%
35% 36% -
40% 40% 43%
37% 34% 36%
32% 31% 27%
37% 34% 28%
27% 21% 18%
37% 40% 47%
28% 26% 23%
23% 24% 23%
27% 27% 29%
26% 23% 30%
- - -
23% 25% 27%
25% 20% 22%
23% 22% 26%
16% 13% 18%
24% 26% 28%
19% 21% 24%
18% 23% 30%
11% 17% 14%
14% 13% 13%
12% 12% 15%
28%
52%
48%
44%
43%
41%
38%
38%
36%
33%
30%
27%
26%
23%
22%
22%
20%
20%
19%
17%
15%
14%
14%
13%
13%
Total
Saudi Arabia
India
China
Canada
Australia
Great Britain
Sweden
South Africa
Brazil
United States
Germany
Spain
South Korea
Israel
Mexico
Argentina
Japan
Belgium
Poland
France
Italy
Turkey
Hungary
Russia
2015 Top2Box (Strongly Agree/Tend to Agree)

8 © 2015 Ipsos.
Immigration is good for the economy of our Country: 28% Showing: 2015 Top2Box (Strongly Agree/Tend to Agree)
[Immigration is good for the economy of Country] Please tell whether you agree or disagree with each of the following statements.
Is HIGHEST 2015 Has experienced an
INCREASE since 2014 Has experienced a
DECREASE since 2014 Is LOWEST in 2015
Saudi Arabia 52% China 9% Poland 7% Russia 13%
India 48% South Africa 9% Argentina 5% Hungary 13%
China 44% Saudi Arabia 8% France 4% Turkey 14%
Canada 43% India 8% Italy 4% Italy 14%
Australia 41% Great Britain 6% Brazil 4% France 15%
Great Britain 38% Germany 4% Japan 3% Poland 17%
Sweden 38% Australia 4% South Korea 3% Belgium 19%
South Africa 36% Turkey 3% Hungary 1% Japan 20%
Brazil 33% Belgium 3% Mexico 1% Argentina 20%
United States 30% Canada 3% Spain 1% Mexico 22%
Germany 27% United States 2% Israel 22%
Spain 26% Sweden 1% South Korea 23%
Russia 1%
9 © 2015 Ipsos.
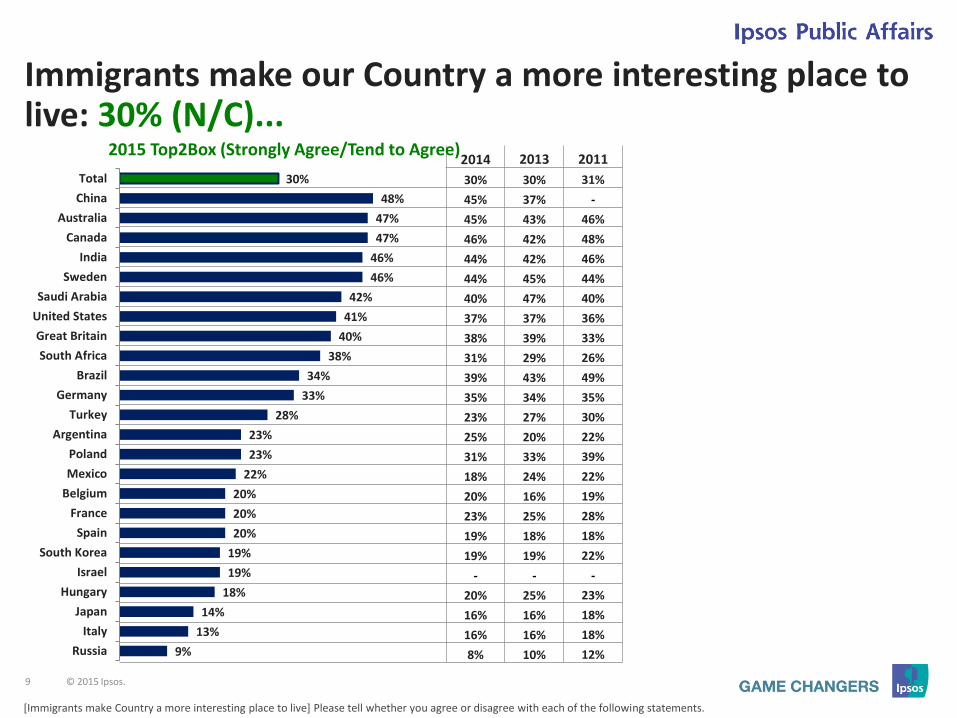
Immigrants make our Country a more interesting place to live: 30% (N/C)...
[Immigrants make Country a more interesting place to live] Please tell whether you agree or disagree with each of the following statements.
2014 2013 2011
30% 30% 31%
45% 37% -
45% 43% 46%
46% 42% 48%
44% 42% 46%
44% 45% 44%
40% 47% 40%
37% 37% 36%
38% 39% 33%
31% 29% 26%
39% 43% 49%
35% 34% 35%
23% 27% 30%
25% 20% 22%
31% 33% 39%
18% 24% 22%
20% 16% 19%
23% 25% 28%
19% 18% 18%
19% 19% 22%
- - -
20% 25% 23%
16% 16% 18%
16% 16% 18%
8% 10% 12%
30%
48%
47%
47%
46%
46%
42%
41%
40%
38%
34%
33%
28%
23%
23%
22%
20%
20%
20%
19%
19%
18%
14%
13%
9%
Total
China
Australia
Canada
India
Sweden
Saudi Arabia
United States
Great Britain
South Africa
Brazil
Germany
Turkey
Argentina
Poland
Mexico
Belgium
France
Spain
South Korea
Israel
Hungary
Japan
Italy
Russia
2015 Top2Box (Strongly Agree/Tend to Agree)

10 © 2015 Ipsos.
Immigrants make our Country a more interesting place to live: 30%... Showing: 2015 Top2Box (Strongly Agree/Tend to Agree)
[Immigrants make Country a more interesting place to live] Please tell whether you agree or disagree with each of the following statements.
Is HIGHEST 2015 Has experienced an
INCREASE since 2014 Has experienced a
DECREASE since 2014 Is LOWEST in 2015
China 48% South Africa 7% Poland 8% Russia 9%
Australia 47% Turkey 5% Brazil 5% Italy 13%
Canada 47% Mexico 4% Italy 3% Japan 14%
India 46% United States 4% France 3% Hungary 18%
Sweden 46% China 3% Hungary 2% Israel 19%
Saudi Arabia 42% India 2% Japan 2% South Korea 19%
United States 41% Sweden 2% Argentina 2% Spain 20%
Great Britain 40% Great Britain 2% Germany 2% France 20%
South Africa 38% Australia 2% Belgium 20%
Brazil 34% Saudi Arabia 2% Mexico 22%
Germany 33% Spain 1% Poland 23%
Turkey 28% Russia 1% Argentina 23%
Canada 1%

11 © 2015 Ipsos.
2014 2013 2011
49% 52% 51%
72% 66% 45%
68% 72% 76%
63% 59% 56%
- - -
59% 58% 58%
61% 63% 56%
61% 74% 63%
58% 65% 66%
63% 68% 68%
53% 55% 62%
53% 58% 59%
56% 59% 64%
56% 59% 70%
59% 54% 44%
52% 50% 58%
51% 56% 56%
37% 36% 40%
48% 52% 43%
27% 30% -
35% 43% 37%
34% 38% 33%
30% 30% 27%
34% 36% 25%
25% 29% 28%
Immigration has placed too much pressure on public services in our Country: 50% (+1)...
[Immigration has placed too much pressure on public services in Country (for example, health, transport, educational services)] Please tell whether you agree or disagree with each of the following statements.
50%
81%
68%
67%
62%
61%
60%
59%
58%
56%
53%
53%
52%
52%
49%
47%
45%
45%
43%
38%
37%
34%
34%
31%
21%
Total
Turkey
Great Britain
Italy
Israel
India
France
South Africa
United States
Belgium
Argentina
Hungary
Australia
Spain
Saudi Arabia
Germany
Canada
Sweden
Russia
China
Brazil
Mexico
Poland
South Korea
Japan
2015 Top2Box (Strongly Agree/Tend to Agree)

12 © 2015 Ipsos.
Immigration has placed too much pressure on public services in our Country: 50%... Showing: 2015 Top2Box (Strongly Agree/Tend to Agree)
.Immigration has placed too much pressure on public services in Country (for example, health, transport, educational services)] Please tell whether you agree or disagree with each of the following statements.
Is HIGHEST 2015 Has experienced an
INCREASE since 2014 Has experienced a
DECREASE since 2014 Is LOWEST in 2015
Turkey 81% China 11% Saudi Arabia 10% Japan 21%
Great Britain 68% Turkey 9% Belgium 7% South Korea 31%
Italy 67% Sweden 8% Canada 6% Poland 34%
Israel 62% Italy 4% Germany 5% Mexico 34%
India 61% Poland 4% Russia 5% Brazil 37%
France 60% India 2% Spain 4% China 38%
South Africa 59% Brazil 2% Australia 4% Russia 43%
United States 58% Japan 4% Sweden 45%
Belgium 56% South Korea 3% Canada 45%
Argentina 53% South Africa 2% Germany 47%
Hungary 53% France 1% Saudi Arabia 49%
Australia 52%
Spain 52%
13 © 2015 Ipsos.
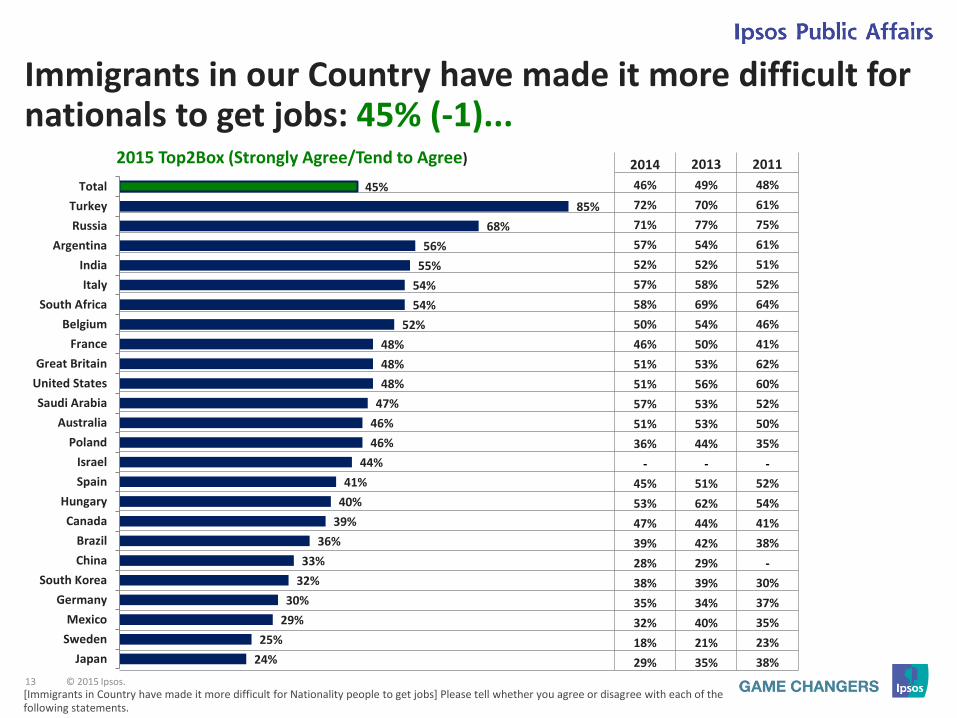
Immigrants in our Country have made it more difficult for nationals to get jobs: 45% (-1)...
[Immigrants in Country have made it more difficult for Nationality people to get jobs] Please tell whether you agree or disagree with each of the following statements.
2014 2013 2011
46% 49% 48%
72% 70% 61%
71% 77% 75%
57% 54% 61%
52% 52% 51%
57% 58% 52%
58% 69% 64%
50% 54% 46%
46% 50% 41%
51% 53% 62%
51% 56% 60%
57% 53% 52%
51% 53% 50%
36% 44% 35%
- - -
45% 51% 52%
53% 62% 54%
47% 44% 41%
39% 42% 38%
28% 29% -
38% 39% 30%
35% 34% 37%
32% 40% 35%
18% 21% 23%
29% 35% 38%
45%
85%
68%
56%
55%
54%
54%
52%
48%
48%
48%
47%
46%
46%
44%
41%
40%
39%
36%
33%
32%
30%
29%
25%
24%
Total
Turkey
Russia
Argentina
India
Italy
South Africa
Belgium
France
Great Britain
United States
Saudi Arabia
Australia
Poland
Israel
Spain
Hungary
Canada
Brazil
China
South Korea
Germany
Mexico
Sweden
Japan
2015 Top2Box (Strongly Agree/Tend to Agree)
14 © 2015 Ipsos.
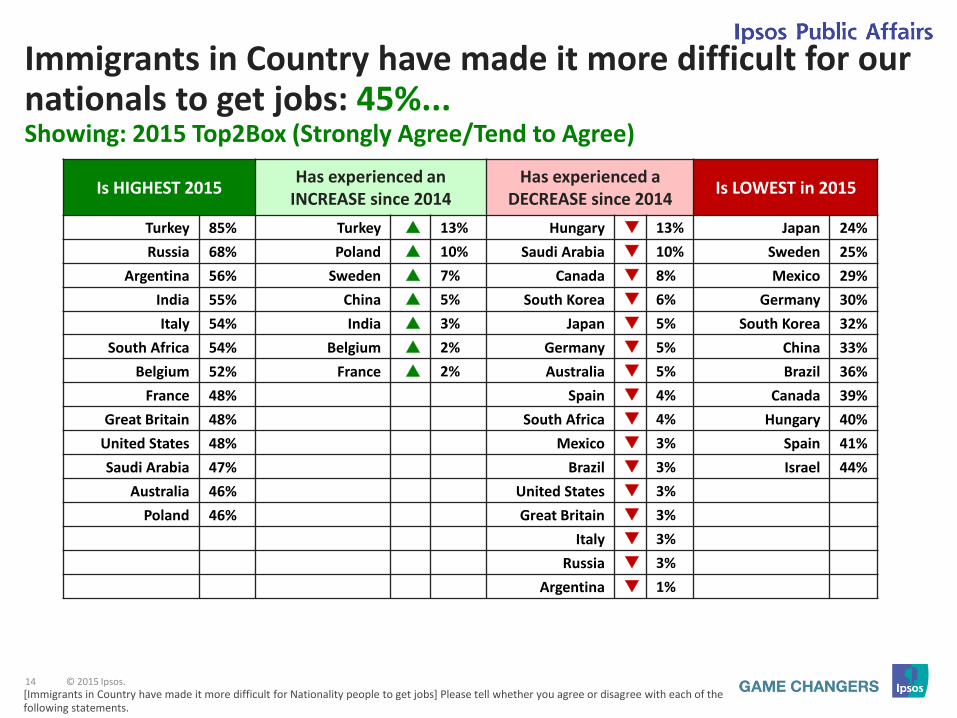
Immigrants in Country have made it more difficult for our nationals to get jobs: 45%... Showing: 2015 Top2Box (Strongly Agree/Tend to Agree)
[Immigrants in Country have made it more difficult for Nationality people to get jobs] Please tell whether you agree or disagree with each of the following statements.
Is HIGHEST 2015 Has experienced an
INCREASE since 2014 Has experienced a
DECREASE since 2014 Is LOWEST in 2015
Turkey 85% Turkey 13% Hungary 13% Japan 24%
Russia 68% Poland 10% Saudi Arabia 10% Sweden 25%
Argentina 56% Sweden 7% Canada 8% Mexico 29%
India 55% China 5% South Korea 6% Germany 30%
Italy 54% India 3% Japan 5% South Korea 32%
South Africa 54% Belgium 2% Germany 5% China 33%
Belgium 52% France 2% Australia 5% Brazil 36%
France 48% Spain 4% Canada 39%
Great Britain 48% South Africa 4% Hungary 40%
United States 48% Mexico 3% Spain 41%
Saudi Arabia 47% Brazil 3% Israel 44%
Australia 46% United States 3%
Poland 46% Great Britain 3%
Italy 3%
Russia 3%
Argentina 1%

15 © 2015 Ipsos.
Priority should be given to immigrants with higher education and qualifications who can fill shortages among certain professions in our Country: 41% (-1)...
[Priority should be given to immigrants with higher education and qualifications who can fill shortages among certain professions in Country.] Please tell whether you agree or disagree with each of the following statements.
2014 2013 2011
42% 42% 45%
55% 55% 56%
52% 46% -
48% 52% 51%
56% 57% 58%
59% 59% 58%
55% 55% 57%
57% 56% 62%
44% 51% 61%
43% 43% 49%
47% 41% 42%
39% 30% 38%
45% 44% 45%
32% 30% 34%
- 51% -
46% 48% 42%
33% 34% 33%
36% 36% 34%
33% 33% 41%
27% 30% 35%
29% 29% 36%
36% 39% 36%
39% 36% 35%
28% 28% 34%
26% 34% 36%
41%
60%
55%
55%
55%
54%
50%
49%
46%
44%
43%
42%
40%
40%
38%
37%
35%
34%
34%
31%
31%
31%
30%
26%
24%
Total
South Africa
China
India
Saudi Arabia
Great Britain
Russia
Canada
Australia
Turkey
Germany
Sweden
Belgium
Mexico
Israel
France
United States
Argentina
Hungary
Poland
South Korea
Spain
Brazil
Japan
Italy
2015 Top2Box (Strongly Agree/Tend to Agree)
16 © 2015 Ipsos.
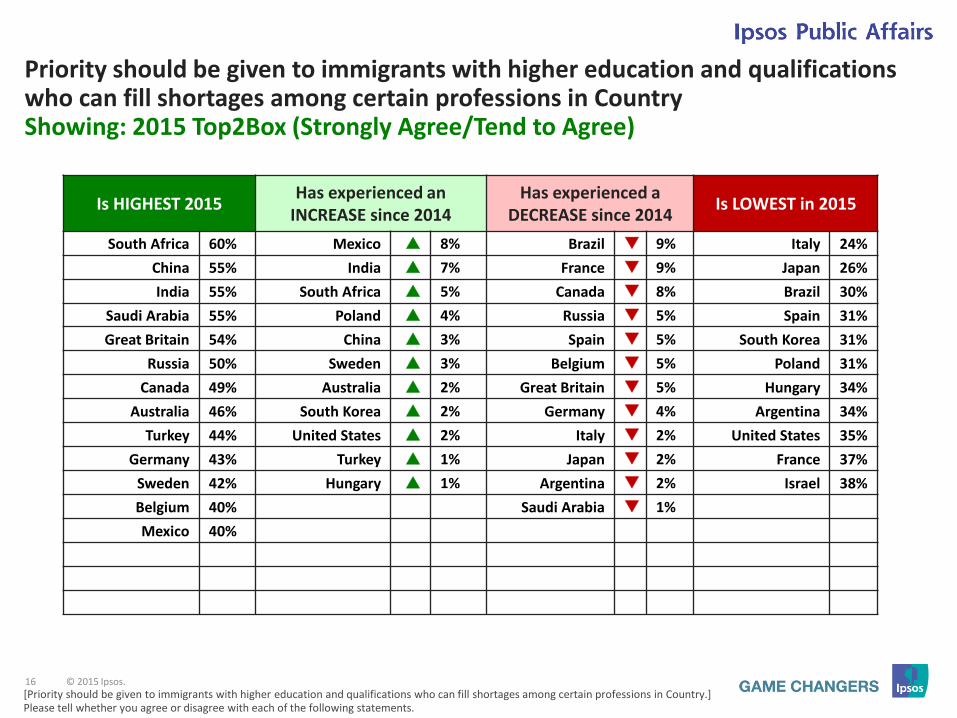
Priority should be given to immigrants with higher education and qualifications who can fill shortages among certain professions in Country Showing: 2015 Top2Box (Strongly Agree/Tend to Agree)
[Priority should be given to immigrants with higher education and qualifications who can fill shortages among certain professions in Country.] Please tell whether you agree or disagree with each of the following statements.
Is HIGHEST 2015 Has experienced an
INCREASE since 2014 Has experienced a
DECREASE since 2014 Is LOWEST in 2015
South Africa 60% Mexico 8% Brazil 9% Italy 24%
China 55% India 7% France 9% Japan 26%
India 55% South Africa 5% Canada 8% Brazil 30%
Saudi Arabia 55% Poland 4% Russia 5% Spain 31%
Great Britain 54% China 3% Spain 5% South Korea 31%
Russia 50% Sweden 3% Belgium 5% Poland 31%
Canada 49% Australia 2% Great Britain 5% Hungary 34%
Australia 46% South Korea 2% Germany 4% Argentina 34%
Turkey 44% United States 2% Italy 2% United States 35%
Germany 43% Turkey 1% Japan 2% France 37%
Sweden 42% Hungary 1% Argentina 2% Israel 38%
Belgium 40% Saudi Arabia 1%
Mexico 40%

17 © 2015 Ipsos.
There are too many immigrants in our country: 50% (+2)...
[There are too many immigrants in our country.] Please tell whether you agree or disagree with each of the following statements.
2014 2013 2011
48% 51% 52%
83% 76% 51%
67% 65% 67%
73% 83% 77%
61% 75% 66%
63% 70% 72%
56% 56% 60%
58% 57% 52%
60% 64% 71%
65% 69% 58%
- - -
57% 58% 61%
46% 50% 50%
48% 53% 59%
48% 56% 67%
43% 52% 52%
51% 47% 53%
37% 33% 46%
40% 45% 42%
42% 45% 41%
44% 44% 37%
30% 29% 24%
24% 31% -
24% 28% 29%
16% 17% 15%
50%
92%
71%
69%
62%
61%
61%
60%
60%
59%
58%
57%
54%
49%
48%
44%
43%
43%
39%
36%
35%
33%
32%
32%
13%
Total
Turkey
Italy
Russia
South Africa
Belgium
India
France
Great Britain
Saudi Arabia
Israel
Argentina
Hungary
United States
Spain
Australia
Germany
Sweden
Canada
Brazil
Mexico
South Korea
China
Poland
Japan
2015 Top2Box (Strongly Agree/Tend to Agree)

18 © 2015 Ipsos.
There are too many immigrants in our country: 50%... Showing: 2015 Top2Box (Strongly Agree/Tend to Agree)
. [There are too many immigrants in our country.] Please tell whether you agree or disagree with each of the following statements.
Is HIGHEST 2015 Has experienced an
INCREASE since 2014 Has experienced a
DECREASE since 2014 Is LOWEST in 2015
Turkey 92% Turkey 9% Mexico 9% Japan 13%
Italy 71% Hungary 8% Germany 8% Poland 32%
Russia 69% China 8% Saudi Arabia 6% China 32%
South Africa 62% Poland 8% Brazil 6% South Korea 33%
Belgium 61% Sweden 6% Russia 4% Mexico 35%
India 61% India 5% Japan 3% Brazil 36%
France 60% Italy 4% Belgium 2% Canada 39%
Great Britain 60% South Korea 3% Canada 1% Sweden 43%
Saudi Arabia 59% France 2% Germany 43%
Israel 58% South Africa 1% Australia 44%
Argentina 57% United States 1%
Hungary 54% Australia 1%
United States 49%
Spain 48%

19 © 2015 Ipsos.
Immigration is causing my country to change in ways that I don’t like: 46%...
[Immigration is causing my country to change in ways that I don’t like] Please tell whether you agree or disagree with each of the following statements.
46%
84%
65%
59%
58%
57%
57%
54%
54%
52%
52%
49%
47%
45%
44%
43%
41%
39%
38%
36%
32%
29%
25%
25%
22%
28%
7%
18%
28%
23%
23%
21%
24%
19%
21%
27%
24%
25%
24%
28%
26%
25%
37%
37%
14%
39%
42%
46%
34%
48%
22%
9%
15%
11%
17%
16%
19%
19%
26%
21%
16%
24%
25%
25%
23%
27%
30%
18%
18%
45%
23%
23%
25%
28%
16%
Total
Turkey
Italy
Russia
Belgium
France
Israel
South Africa
Great Britain
Hungary
India
Australia
Argentina
United States
Spain
Canada
Germany
Poland
Saudi Arabia
Sweden
Mexico
China
South Korea
Brazil
Japan
Top2Box (Strongly Agree/Tend to Agree)
MidBox (Neither Agree nor Disagree)
Low2Box (Tend to Disagree/Strongly Disagree)
New Question 2015

20 © 2015 Ipsos.
Credibility Intervals • The calculation of credibility intervals assumes that Y has a binomial distribution conditioned on the parameter θ\, i.e.,
Y|θ~Bin(n,θ), where n is the size of our sample. In this setting, Y counts the number of “yes”, or “1”, observed in the sample, so that the sample mean (y ̅) is a natural estimate of the true population proportion θ. This model is often called the likelihood function, and it is a standard concept in both the Bayesian and the Classical framework. The Bayesian 1 statistics combines both the prior distribution and the likelihood function to create a posterior distribution. The posterior distribution represents our opinion about which are the plausible values for θ adjusted after observing the sample data. In reality, the posterior distribution is one’s knowledge base updated using the latest survey information. For the prior and likelihood functions specified here, the posterior distribution is also a beta distribution (π(θ/y)~β(y+a,n-y+b)), but with updated hyper-parameters.
• Our credibility interval for θ is based on this posterior distribution. As mentioned above, these intervals represent our belief about which are the most plausible values for θ given our updated knowledge base. There are different ways to calculate these intervals based on π(θ/y). Since we want only one measure of precision for all variables in the survey, analogous to what is done within the Classical framework, we will compute the largest possible credibility interval for any observed sample. The worst case occurs when we assume that a=1 and b=1 and y=n/2. Using a simple approximation of the posterior by the normal distribution, the 95% credibility interval is given by, approximately:
For this poll, the Bayesian Credibility Interval was adjusted using standard weighting design effect 1+L=1.3 to account for complex weighting2
Examples of credibility intervals for different base sizes are below. Ipsos does not publish data for base sizes (sample sizes) below 100.
Sample size Credibility intervals
2,000 2.5
1,500 2.9
1,000 3.5
750 4.1
500 5.0
350 6.0
200 7.9
100 11.2
21 © 2015 Ipsos.
ABOUT IPSOS Ipsos ranks third in the global research industry. With a
strong presence in 87 countries, Ipsos employs more
than 16,000 people and has the ability to conduct
research programs in more than 100 countries. Founded
in France in 1975, Ipsos is controlled and managed by
research professionals. They have built a solid Group
around a multi-specialist positioning – Media and
advertising research; Marketing research; Client and
employee relationship management; Opinion & social
research; Mobile, Online, Offline data collection and
delivery.
Ipsos is listed on Eurolist - NYSE-Euronext. The company
is part of the SBF 120 and the Mid-60 index and is
eligible for the Deferred Settlement Service (SRD).
ISIN code FR0000073298, Reuters ISOS.PA,
Bloomberg IPS:FP
www.ipsos.com
GAME CHANGERS At Ipsos we are passionately curious about people, markets, brands and society. We deliver information and analysis that makes our complex world easier and faster to navigate and inspires our clients to make smarter decisions. We believe that our work is important. Security, simplicity, speed and substance applies to everything we do. Through specialisation, we offer our clients a unique depth of knowledge and expertise. Learning from different experiences gives us perspective and inspires us to boldly call things into question, to be creative. By nurturing a culture of collaboration and curiosity, we attract the highest calibre of people who have the ability and desire to influence and shape the future. “GAME CHANGERS” - our tagline - summarises our ambition.