ipsas financial statement for the year ended 31st
TRANSCRIPT
2020 KATSINA STATE
ACCOUNTANT GENERAL’S
REPORT MARCH 2021
IPSAS FINANCIAL STATEMENT FOR THE YEAR ENDED 31ST
DECEMBER, 2020
TRANSITIONAL ACCRUAL BASIS


TABLE OF CONTENT • TABLE OF CONTENTS 3
• Responsibility for Financial Statement 4
• Audit Certificate 5
• Disclosure Notes on State Audited Financial Statement For 2020 6
• Statement of Financial Performance 7
• Statement of Financial Position 9
• Statement of Cashflow 10
• Statement of Change in Net Asset/ Equity 12
• Comparison Between Budgeted & Actual on Cash Basis 13
• Notes to The Financial Statements 15

RESPONSIBILITY FOR FINANCIAL STATEMENT
This Financial Statements have been prepared in accordance with the provisions of the Financial (Control Management) Act
1958 Cap 144 LFN as amended. The Financial Statements are in Compliance with generally accepted accounting principles,
practice and other Government accounting regulations and pronouncements.
Also, to a large extend, the financial statement was prepared in accordance to International Public Sector Accounting
Statement (IPSAS) as issued by INTERNATIONAL PUBLIC SECTOR ACCOUNTING STANDARD BOARD (IPSASB) and
financial reporting council of Nigeria (FRCN).
In fulfillment of the accounting and reporting responsibilities, the Accountant General is responsible for establishing and
maintaining an adequate system of internal control designed to provide reasonable assurance that the transactions recorded
are within Statutory authority and properly recorded the use of all public financial resources by the Government.
The financial statements are prepared in Accordance with IPSAS on Accrual basis (IPSAS). However, by virtue of IPSAS 33
(First time Adoption of Accrual basis IPSAS) Katsina State Government is allowed a period of three years from the date of
commencement to adopt the exemptions in-respect of its yet-to-be fully valued recognized Assets and liabilities (This
exemption may affect the fair presentation of this transitional financial statement). Hence, I am unable to make an explicit
and unreserved statement of compliance with Accrual basis of IPSAS in preparing its transitional IPSAS reporting period.

5
AUDIT CERTIFICATE
The Financial Statements and Accounts of the Government of Katsina State of Nigeria for the year ended 31st December,
2020 have been audited in accordance with section 125 subsection 2 of the Constitution of the Federal Republic of Nigeria
1999 (as amended) and the Katsina State Audit Law No.12 of 2020.
The audit was conducted in accordance with International Standards on Auditing and INTOSAI Auditing Standards.
In the course of the audit, I evaluated the overall adequacy of the information presented in the General purpose Financial
Statements which were prepared in accordance with International Public Sector Accounting Standards (IPSAS) as
described in Note 1 to 31. I have obtained information and explanation that to the best of my knowledge was relevant and
necessary for the purposes of the audit. This audit has provided me with reasonable evidences and assurances which
formed the basis for my independent opinion.
In my opinion, the Financial Statements which are in agreement with the books of accounts and records show a true and
fair view of the Financial Position of the Government of Katsina State for the year ended December 31, 2020 and the
transactions for the fiscal year ended on that date.
Special Opinion
The State is eligible to receive performance-based grant financing from the Federal Government subject to performance
against predefined criteria in the World Bank Assisted States Fiscal Transparency, Accountability and Sustainability
Program for Results (SFTAS PforR). The expenditure framework (and receipts) are detailed in Note 1 to 31 in the attached
General Purpose Financial Statements of Katsina State Government.
In my opinion, Note 1 to 31 presents fairly, in all material respects, the expenditures incurred (and funds received) against
the SFTAS Program by the State for the year ended December 31st,2019, 2020 as required in accordance with IPSAS as
described in Note 1 to 31.
Anas Tukur A. (FCNA, FICEN),
Auditor General,
Katsina State.

6
DISCLOSURE NOTE IN STATE AUDITED FINANCIAL STATEMENTS FOR 2020
Katsina State participated in the World Bank assisted States Fiscal Transparency, Accountability and Sustainability Program for Results (SFTAS PforR)
having met the Eligibility Criteria for 2020. The amount of Grant earned is determined by Disbursement Linked Results achieved by the State as
defined is Subsidiary Grant Agreement dated 31-12-2020. The achievement of performance by the State is verified by an Independent Verification
Agent. The Program Expenditure Framework for SFTAS Program comprises expenditures incurred in the following budget lines:
2020 2019 2018
Personnel Overheads Total Personnel Overhead Total Personnel Overhead Total
-Naira ‘000-
Ministry of Finance
48,107,695.78 477,420,948.62 525,528,644.40 48,443,483.03 50,887,796.00 99,331,279.03 62,613,316.03 44,437,038.00 107,050,354.0 3
Ministry of Budget and Economic Planning
36,874,735.17 52,043,252.00 88,917,987.17 30,742,084.21 89,122,500.00 119,864,584.21 33,114,828.12 17,116,950.00 50,231,778.12
State Board of Internal Revenue
193,067,174.7 7
380,724,266.88 573,791,441.65 167,502,768.1 9
506,352,591.00 673,855,359.19 158,935,975.7 4
440,106,542.0 0
599,042,517.7 4
Accounta nt General
153,214,447.0 5
2,854,477,005. 32
3,007,691,452. 37
157,445,499.5 0
2,677,297,897. 11
2,834,743,396. 61
155,409,921.9 1
19,324,500.00 174,734,421.9 1
Total 341,264,052.7 7
3,764,665,472. 82
4,195,929,525. 59
404,133,834.9 3
3,323,660,784. 11
3,727,794,619. 04
410,074,041.8 0
520,985,030.0 0
931,059,071.8 0
The State was found eligible to participate in the Program for 2018 and 2019 for verification and disbursements occurred during the year.
Verification and disbursement for 2020 is to occur in 2021. The disbursements below were received as grants from the Federal Government in the
State’s [Consolidated Revenue Fund] and are reflected in the activity and balances under Note 18 (note for cash and bank balances).
2020 2019
Amount earned for 2018 performance 0.00 0.00
Amount earned for 2019 performance 4,720,000,000.00 0.00
TOTAL 4,720,000,000.00 0.00

7
KATSINA STATE GOVERNMENT OF NIGERIA GENERAL PURPOSE FINANCIAL STATEMENTS (GPFS) ACCRUAL BASED
STATEMENT NO. 1
STATEMENT OF FINANCIAL PERFORMANCE FOR THE YEAR ENDED 31/12/2020 DETAILS NOTES 2020 ACTUAL 2019
Revenue: N,000.00
Share of FAAC 1 47,697,993,270.25 53,144,067,364.01
VAT 2 18,502,451,466.19 15,135,674,727.84
Tax Revenue 3 10,822,320,118.57 7,956,319,399.63
Non-Tax Revenue 4 5,024,528,827.91 2,913,185,973.67
Investment Income 5 45,132,035.81 45,875,607.34
Interest Earned 6 8,988.99 20,836,626.22
Aids & Grants 7 10,207,697,367.78 3,930,307,983.05
PARIS CLUB 9 - 10,889,204,907.97
Transfer from LGAs 9A 2,266,078,293.99 3,144,354,017.23
Proceed from Sales of Housing 15A 71,980,686.65 246,509,120.62
Gains on Disposal of Assets 17 160,543,879.24 107,804.53
SFTAS 8 4,720,000,000.00
Total Revenue (A) 99,518,734,935.38 97,426,443,532.11
Expenditure:
Salary & Wages 10 31,626,757,245.49 29,184,952,308.44
Social Benefits 11 5,548,680,256.99 6,115,720,202.71
Overhead Cost (Recurrent) 12 16,295,185,356.85 17,355,037,825.94
Grants & Contribution 13 495,810,822.00 476,313,576.00
Depreciation Charges 14 5,123,375,308.97 4,413,618,620.95
Public Debt Charges (Loan Repayment) 15 6,489,708,277.14 6,560,460,073.26
Transfer to Other MDA's 16 2,905,939,478.33 4,241,898,119.11
Transfer to Revenue Generating MDA's 16 4,406,192,777.83
Other Expenditure (Transfer to JAAC Acct.) 27 4,793,087,606.78 1,000,000,000.00
COST OF IGR COLLECTION (BOIR) 28 805,289,609.66 555,076,438.77
Aids & Grants 7 9,992,185,255.69
Total Expenditure (B) 88,482,211,995.73 69,903,077,165.18

8
Surplus from Operating Activities C= (A-B) 11,036,522,939.65 27,523,366,366.93
107,804.53
Total Non-Operating Revenue/Expenses (D) 107,804.53
Surplus From Ordinary Activities E=(C+D) 11,036,522,939.65 27,523,474,171.46
Net Surplus for the Year G=(E-F) 11,036,522,939.65 27,523,474,171.46

9
STATEMENT NO.2
STATEMENT OF FINANCIAL POSITION Assets NOTES 2020 ACTUAL 2019
Current Assets Cash & Cash Equivalents 18 13,156,363,955.16 14,975,546,360.86
Receivables 19 7,090,163,310.09 7,090,163,310.09
Total Current Assets(A) 20,246,527,265.25 22,065,709,670.95
Non-Current Asset Long Term Loans Granted 20 6,090,163,310.09
Investment 21 4,276,892,128.84 4,207,709,543.30
Property Plant & Equipment 26 130,787,603,704.99 115,299,458,451.65
Investment Property 23 1,404,094,868.84 1,165,025,130.85
Other Assets 27 4,793,087,606.78 1,000,000,000.00
Total Non-Current Assets (B) 141,261,678,309.45 127,762,356,435.89
Total Assets [C] 161,508,205,574.70 149,828,066,106.84
Liabilities
Current Liabilities Payables 24 19,051,381,052.41 11,162,163,207.94
Total Current Liabilities (D) 19,051,381,052.41 11,162,163,207.94
Long Term Borrowings 25 56,533,272,532.99 57,688,710,539.16
Total Non-Current Liabilities (E) 56,533,272,532.99 57,688,710,539.16
Total Liabilities F= (D+E) 75,584,653,585.40 68,850,873,747.10
Net Assets G=(C-F) 85,923,551,989.30 80,977,192,359.74 NET ASSETS/EQUITY
ACCUMULATE SURPLUS 85,923,551,989.30

10
STATEMENT NO.3
STATEMENT OF CASHFLOW FOR THE YEAR ENDED 31/12/2020 NOTE 2020 ACTUAL 2019
CASH FLOW FROM OPERATING ACTIVITES N 000.00
Inflows
Share of FAAC NOTE 1 47,697,993,270.25 53,144,067,364.01
Share of VAT NOTE 2 18,502,451,466.19 15,135,674,727.84
Tax Revenue NOTE 3 10,822,320,118.57 7,956,319,399.63
Non-Tax Revenue NOTE 4 5,024,528,827.91 2,913,185,973.67
Aids & Grant NOTE 7 10,207,697,367.78 3,930,307,983.05
Other Revenue (SFTAS) NOTE 9 - 10,889,204,907.97
Transfer from LGAs NOTE 9A 2,266,078,293.99 3,144,354,017.23
Interest on Deposit NOTE 6 8,988.99 20,836,626.22
Gains on Disposal of Assets NOTE 17 160,543,879.24 107,804.53
SFTAS NOTE 8 4,720,000,000.00
Total inflows from operating activities =A 99,401,622,212.92 97,134,058,804.15
Outflows:
Salaries & Wages NOTE 10 31,626,757,245.49 29,184,952,308.44
Social Benefits NOTE 11 5,548,680,256.99 6,115,720,202.71
Overhead Cost (Recurrent) NOTE 12 16,295,185,356.85 17,355,037,825.94
Grants & Contributions NOTE 13 495,810,822.00 476,313,576.00
Transfer to Other MDA's NOTE 16 2,905,939,478.33 4,241,898,119.11
Transfer to Revenue Generating MDA's NOTE 21B 4,406,192,777.83
Other Expenditure (Transfer to JAAC Acct.) NOTE 27 1,000,000,000.00
Cost of IGR Collection (BOIR) NOTE 28 805,289,609.66 555,076,438.77
Aids & Grant NOTE 7 9,992,185,255.69 3,930,307,983.05
Total outflow from operating activities =B 72,076,040,802.84 62,859,306,454.02
Net cashflow from operating activities =C (A-B) 27,325,581,410.08 34,274,752,350.13
CASH FLOW FROM INVESTING ACTIVITES

11
Dividend Received NOTE 5 45,132,035.81 45,875,607.34
Purchase & Const. of PPE NOTE 26 -21,982,686,170.63 (31,611,456,422.76)
Net cashflow from investing activities (21,937,554,134.82) (31,565,473,010.89)
Cashflow From Financing Activities
0.00
Proceed from Sales of Housing NOTE 15A 71,980,686.65 246,509,120.62
Repayment of Borrowings NOTE 15A -6,489,708,277.14 -6,560,460,073.26
Net Cashflow from financing activities (6,417,727,590.49) -6,313,950,952.64
Net Cashflow From All Activities (1,029,700,315.23) (3,604,671,613.40)
Cash & Its Equivalent as at 1/1/2020 4,834,201,038.39 8,438,980,456.32
Cash & Its Equivalent as at 31/12/2020 3,804,500,723.16 4,834,201,038.39

12
STATEMENT NO.4
STATEMENT OF CHANGES IN NET ASSETS/EQUITY FOR THE YEAR ENDED 31/12/2020 RESERVES ACCUMULATED SURPLUS/DEFICITS TOTAL
- Balance as at 1/1/2020 11,498,991,910.47 63,388,037,139.18 74,887,029,049.65
- Surplus for the Period 11,036,522,939.65 11,036,522,939.65
- Surplus on Revaluation of PPE
- Fair Value of Investment Property -
- Net Surplus for the Period
- Balance as at 31/12/2020 11,498,991,910.47 74,424,560,078.84 85,923,551,989.30
STATEMENT OF CHANGES IN NET ASSETS/EQUITY FOR THE YEAR ENDED 31/12/2019 RESERVES ACCUMULATED SURPLUS/DEFICITS TOTAL
8,438,980,456.32 Balance as at 1/1/2019 - 39,457,586,452.31 39,457,586,452.31
- Additional Grant Received -
- Surplus on Revaluation of PPE 11,498,991,910.47 11,498,991,910.47
- Revaluation of Investment Property (3,592,915,680.06) (3,592,915,680.06)
31,018,605,995.99 Net Surplus for the Period - 27,523,366,366.93 27,523,366,366.93
39,457,586,452.31 Balance as at 31/12/2019 11,498,991,910.47 63,388,037,139.18 74,887,029,049.65

13
STATEMENT NO. 5 COMPARISON BETWEEN BUDGETED AND ACTUAL ON CASH BASIS FOR THE YEAR, 2020
BUDGETTED ACTUAL VARIANCE %
1 Opening Balance 5,000,000,000.00 4,834,201,038.39 165,798,961.61 0.97
2 Revenues and Grants:
Gross (Not Net of Deductions) Statutory Allocation 58,849,856,966.00 47,697,993,270.25 11,151,863,695.75 0.81
Other FAAC Transfers 7,072,400,744.00 - 7,072,400,744.00
VAT 23,127,611,453.00 18,502,451,466.19 4,625,159,986.81 0.80
IGR 11,736,860,000.00 15,846,848,946.48 (4,109,988,946.48) 1.35
Internal Grants 12,379,765,305.00 - 12,379,765,305.00 0.00
Citizens Covid 19 Responses 4,211,342,144.00 - 4,211,342,144.00 0.00
External Grants 3,600,000,000.00 10,207,697,367.78 (6,607,697,367.78) 2.84
120,977,836,612.00 92,254,991,050.70 28,722,845,561.30 3 Expenditures:
Personnel Cost 32,364,136,515.00 30,730,896,829.19 1,633,239,685.81 0.95
Overhead Cost 17,613,716,772.00 16,295,185,356.85 1,318,531,415.15 0.93
Public Debt Charges 6,045,000,000.00 6,489,708,277.14 (444,708,277.14) 1.07

14
Consolidated Fund Revenue Fund Charges 18,426,919,670.00 895,860,416.30 17,531,059,253.70 0.05
74,449,772,957.00 54,411,650,879.48 20,038,122,077.52 Capital Expenditures:
Economic 26,599,837,578.00 13,652,761,377.35 12,947,076,200.65 0.51
Social 38,826,940,547.00 5,188,841,641.24 33,638,098,905.76 0.13
Law and Justice 886,500,000.00 185,505,500.00 700,994,500.00 0.21
Regional 36,600,461,640.00 - 36,600,461,640.00 0.00
Administration 4,828,842,235.00 2,955,577,652.04 1,873,264,582.96 0.61
4 Balance (=(1+2-3)) 51,528,063,655.00 42,677,541,209.61 8,850,522,445.39

15
NOTES TO THE FINANCIAL STATEMENTS
1. LEGAL BASIS AND ACCOUNTING RULES.
The accounting framework of the Katsina state Government focusing on reporting the budgetary activity of the Government for the
financial year as laid down in the appropriation law.
The transitional financial statement of Katsina state Government have been prepared using the accrual basis in accordance with the
requirements of international public sector accounting standards (IPSAS) 33 'first time adoption of accrual IPSAS' and in accordance
with the Katsina state financial instruction Revised (2004). The office of the Accountant General is empowered to choose the basis of
reporting.
2. ACCOUNTING PRINCIPLE
The objective of the financial statement is to provide information about the financial position, performance and cash flows of an entity
that is useful to a wide range of users. Being a public sector entity, the objectives were developed specifically to provide information
useful for decision making, and also to demonstrate the level of Katsina state Government's accountability for the resources entrusted
to it.
The key consideration and accounting principles to be followed when preparing the financial statement are laid out in Katsina State
Government’s Financial Instructions and not at variance with those described in IPSAS 1. These include: fair presentation, accrual
basis, going concern, consistency of presentation, aggregation, offsetting and comparative information. Presentation of the financial
statements in accordance with the above mentioned rules and principles requires management to make estimate that affect the
reported amount of certain items in the statement of financial position and statement of financial performance, as well as the related
disclosures.
.

16
3. RISK MANAGEMENT.
i) Foreign Currency Risk:
Katsina State is exposed to the extend of its exposure to the risk of changes in foreign exchange rates when repayment of its
foreign loans denominated in USD, thus can affect the fair value of future cash flows.
ii) Liquidity Risk:
Most of the revenue accruing to the State is from the Federation Account, when it fluctuate, the State may experience difficulty
in discharging its financial responsibilities.
iii) Interest Rate:
At present the state has no floating rate financial instruments.
iv) Commodity Price Risk:
The State is affected to the extend of the fluctuation of Crude-oil price, Savings were made for future allocation when excess
revenue as recorded on sales above the benchmark price.
v) Credit Risk:
The State is exposed to this risk especially to the extend it guarantees certain loans to its citizens that lack collaterals such as
SMEDAN Loan. Some of the beneficiaries may not meet their obligations which means the State making the repayment without
recovery.
4. BASIS OF PREPARATON.
a) Statement of Compliance.
Katsina State Government initiated accrual basis IPSAS and elected to adopt the transitional exceptions in IPSAS 33 that allow it to
apply a transitional period of up to three years. Our transitional exemptions for the state's owned assets and liabilities that are yet to
be valued and recognized. Currently, efforts are being put in place to come up with fair values assessments of all assets owned and
controlled by the state. We plan to achieve this through the state audit technical committee that is working with professional

17
consultants. As a result of adoption of these transitional exemptions and provisions, Katsina state Government is not able to make an
explicit and unreserved statement about its compliance with Accrual basis IPSAS.
These Financial Statements are therefore referred to as the 3rd transition IPSAS Financial Statement of Katsina State Government.
b) Basis for Measurement.
The Financial Statement have been prepared on the basis of historical cost, unless stated otherwise. In this Financial Statements for
Katsina State Government, the following statements are presented:
➢ Statement of financial performance for the year ended 31 December, 2020.
➢ Statement of financial position as at 1 January, 2020.
➢ Statement of financial position as at 31 December, 2020.
➢ Statement of changes in Net Asset for the year ended 31 December, 2020.
➢ Statement of Cash Flows for the year ended 31December, 2020.
➢ Statement of comparison of budget and Actual information for the year ended 31 December, 2020.
c) Function and presentation currency
The financial statement is presented in Naira, which is the functional and reporting currency of Katsina State Government.
d) Going Concern.
The financial statements have been prepared on a going concern basis.
5. SUMMARY OF SIGNIFICANT ACCOUNTING POLICIES.
Katsina State Government has applied the following accounting policies in preparation of the Financial Statement for the year ended
31st December, 2020. These policies have been consistently applied to all the years presented, unless otherwise stated.
5.1.1 REVENUE FROM NON-EXCHANGE TRANSACTIONS.
18
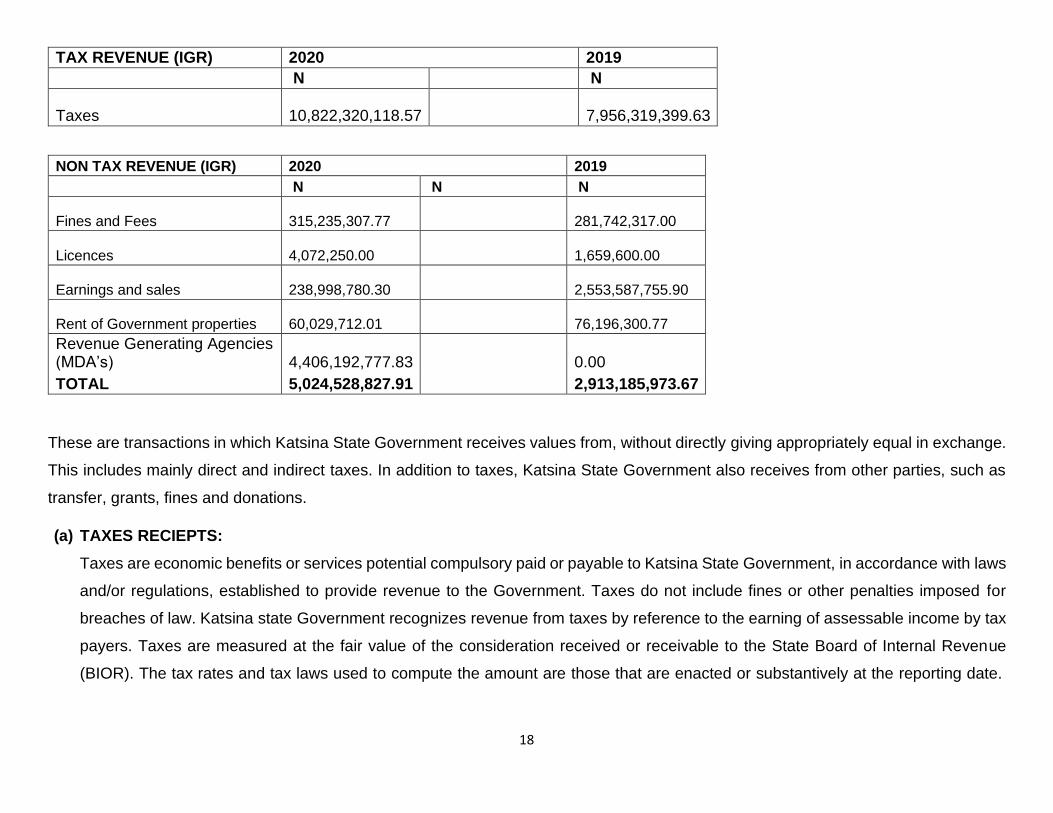
TAX REVENUE (IGR) 2020 2019
N N
Taxes 10,822,320,118.57 7,956,319,399.63
NON TAX REVENUE (IGR) 2020 2019
N N N
Fines and Fees 315,235,307.77 281,742,317.00
Licences 4,072,250.00 1,659,600.00
Earnings and sales 238,998,780.30 2,553,587,755.90
Rent of Government properties 60,029,712.01 76,196,300.77
Revenue Generating Agencies (MDA’s) 4,406,192,777.83 0.00
TOTAL 5,024,528,827.91 2,913,185,973.67
These are transactions in which Katsina State Government receives values from, without directly giving appropriately equal in exchange.
This includes mainly direct and indirect taxes. In addition to taxes, Katsina State Government also receives from other parties, such as
transfer, grants, fines and donations.
(a) TAXES RECIEPTS:
Taxes are economic benefits or services potential compulsory paid or payable to Katsina State Government, in accordance with laws
and/or regulations, established to provide revenue to the Government. Taxes do not include fines or other penalties imposed for
breaches of law. Katsina state Government recognizes revenue from taxes by reference to the earning of assessable income by tax
payers. Taxes are measured at the fair value of the consideration received or receivable to the State Board of Internal Revenue
(BIOR). The tax rates and tax laws used to compute the amount are those that are enacted or substantively at the reporting date.

19
The state Government taxes include: Pay-As-you- earn, withholding tax, stamp duties, Development levy, property tax, business
premises and other tax receipts.
(b) FINE AND FEES:
These are inflows of future economic benefit or service potentials from non-exchange transactions other than taxes. they are
economic benefits or service potential receivable by the Katsina State Government, as determine by a court or other law enforcement
body, as consequence of breach of laws or regulations and are recognized at the point when the levy is being imposed.
(c) REVENUE GENERATING AGENCIES (MDA’s):
These are inflows generated from revenue generating MDA’s. There is State Government provision by Law that the inflows from the
Revenue generated MDA’s will be disburse to them. And the economic benefit or service potentials received by the agencies (MDA’s).
(d) STATUTORY ALLOCATIONS:
2020 2019
Share of FAAC 47,697,993,270.25 53,144,067,364.01
VAT 18,502,451,466.19 15,135,674,727.84
Statutory allocations are income from the revenue allocation system wherein Federal Government allocates funds (on sharing formula)
to each state of the federation based on constitutional requirements. Statuary allocations are measured at a value and recognized at
point of receipt.
(e) CAPITAL RECEIPT:
OTHER REVENUE 2020 2019
N N
Other Revenue (FAAC) 1,962,284,360.58 1,680,824,766.39
Exchange Difference 1,058,435,670.39 84,589,416.29

20
Excess bank charges 8,673,151.56 105,147,335.29
Excess Crude Oil 1,085,127,110.56 -
NNPC additional refund (Additional share of FAAC) - 159,796,462.95
Refund from Paris Club - 10,889,204,907.97
Distribution from stabilization Acct. - 497,993,798.22
Refund From FAAC 727,821,540.16 -
SFTAS 4,720,000,000.00 -
Non-Oil Revenue 389,772,669.02 -
Forex Equalization 527,501,234.80 -
Covid 19 1,000,000,000.00 -
These include grants and other capital receipts. Capital receipts are measured at fair value and recognized at the point of grant or
when there is an enforceable claim to receive the assets if it is free from conditions and it is probable that the economic benefits or
Service potential related to the asset will flow to Katsina State Government and can measured reliability.
(f). REFUND FROM FAAC:
These are refund received from FAAC for deductions made for the month of March and April, 2020.
5.1.2 REVENUE FROM EXCHANGE TRANSACTIONS.
These are transactions in which Government receives consideration from and directly gives approximately equal value in exchange
from goods, services or use of assets. They are recognized at fair value of consideration received or receivable. The state revenue

21
from exchange transactions includes: rent on Government properties, proceeds from hospital units and other miscellaneous revenue
from exchange transactions.
Revenue from the sale of goods and services is recognized when the significant risk and rewards of ownership of the goods are
transferred to the buyer, this is when the goods have been delivered.
Revenue involving the provision of service is recognized by the reference to the stage of completion of the transaction at the reporting
date Revenue arising from the use by others of Katsina State Government's assets yielding rental incomes, interest, royalties and
dividends or similar distributions, are recognized as they are earned in accordance with the substance of the agreement. Revenue is
recognized when the amount can be measured reliably; and it is probable that economic benefits or services potential associated with
the transaction will flow to Katsina State Government.
Where the contract outcome cannot be measured reliably, revenue is recognized only to the extent that the expenses incurred are
recoverable.
RENTAL INCOMES.
Rental incomes arising from operating leases on investment properties is accounted for on a straight line basis over the lease terms
and included in revenue.
REVENUE FROM OTHER SERVICE:
Revenue from other services includes proceeds from other miscellaneous revenue from exchange transactions. Katsina State
Government recognized revenue from rendering of service as it is earned, that is, as the services is provided. it is measured at the
fair value of the consideration received or receivable.
INVESTMENT INCOMES.
Investment incomes consist of dividend income. Dividend incomes or similar distributions are recognized when right to receive
payments is established.

22
5.2 NET FINANCE INCOME/COST.
Interest income/cost arises as a result of cash deposited in financial institution/loans from financial institution.
5.3 FINANCIAL INSTRUMENTS.
Financial instrument is any contract that gives rise to both a financial asset of one entity and a financial liability or equity instrument of
another entity. The state classified its financial assets in line with the requirement of IPSAS and classified financial liabilities in
accordance with the requirement of IPSAS. Classification of financial liabilities is based on the nature or characteristic of the
instrument. The Office of the Accountant General determines the classification of its financial liabilities at initial recognition. Katsina
State Government has recognized financial liabilities which include local and foreign debts.
5.4 CASH AND CASH EQUIVALENTS.
2020 2019
Cash in Banks 13,156,363,955.16 14,975,546,360.86
Cash held by MDA’s 83,227.50 15,643,200.00
Cash equivalent as shown in the statement of financial position comprise cash in hand or bank, deposit held at call with banks and
time deposits which are readily convertible to cash with a maturity of three month or less.
5.5 BORROWING COST.
Borrowing costs are interest and other expenses incurred by the state in connection with the borrowing of funds for qualifying assets,
Government
adopted benchmark treatment, under which borrowing cost are recognized as an expense in the period in which they are incurred,
regardless of how the borrower are applied.

23
5.6 EMPLOYEE BENEFITS.
(a) SHORT TERM EMPLOYEE BENEFIT:
Government approves the following short term benefits in the period in which associated services are rendered in employee salaries;
wages; paid annual leave, also the Government recognized short term employee benefits costs when the employee rendered service
in exchange for those benefits and a liability to the extent that the benefits are not yet paid at the reporting date. The State does not
operate contributory pension yet.
5.7 FOREIGN CURRENCY TRANSACTIONS
Items included in the financial statement of each of Government entities are measured using the economic environment in which the
entity operates ('the functional currency of primary currency'). The financial statement is presented in Nigerian naira (NGN) rate of
exchange at the dates of the transactions Foreign currency balances as at the year ended are value at the exchange rate prevailing
at that date.
Monetary assets and liabilities dominated in foreign currencies are translated into Nigerian naira in the basis of the exchange rate
applicable at the reporting period. Foreign exchange gains and losses that related to public debts are presented within the public debts
charge in the statement of financial performance. All other foreign exchange gains and losses are presented in the statement of
financial performance on a net basis within other incomes or other expenses.
Non-monetary items that are measured at fair value in foreign currency are translated using the exchange rate at the date when the
fair value was determined. Transaction differences on assets and liabilities carried at fair value are reported as part of the fair value
gain or loss.
(C) EXPLANATION OF DIFFERENCES BETWEEN FINANCIAL BUDGET AND ACTUAL AMOUNT.
• INTERNALLY GENERATION REVENUE.

24
Realization of the receipt from direct taxes, licenses, penalties, fines fees, leaves and other IGR, impacted positively against
the budgeted amount.
• INVESTMENT INCOME.
The performance of investment income to the tune of 92.3% of the budgeted figure can be attributed to income from bond
sinking fund which was not part of the budgeted estimate for the year but was realized.
• STATUTORY ALLOCATION.
This is Statutory allocation to the State from the Federation account that was shared within the financial year is provided on the
sharing formula. This type of revenue is only recognized when it was receipt because the state does not have control on
generation nor the sharing.
• CAPITAL EXPENDITURE.
Total amount debited to asset account and the corresponding entry was credited to equity account.
• REPAYMENT OF BORROWING.
2020 2019
6,489,708,277.14 6,395,460,020.76
This comprises the principal and interest charged on the borrowing both for foreign and local debts.
• RECEIVABLES.
Paris Club share of LG:
2020 2019
1,000,000,000.00
888,661,529.29
600,000,000.00
768,735,379.61
1,393,488,410.00
1,439,277,991.19
1,000,000,000.00

25
TOTAL 7,090,163,310.09
• INVESTMENT IN SECURITIES.
a) Sovereign Wealth Fund As at 31/12/2019
3,528,025,505.70
Value as at 31/12/2020 3,539,592,802.44
b) QUOTED COMPANIES.
2020 2019
FBN Holding 16,330,623.50 0.00
UBN Plc 461,228,850.00 11,748,650.00
Access Bank Plc 241,500,000.00 195,000,000.00
Unity Bank Plc 3,963,485.40 4,010,904.25
Zenith Bank Plc 8,669,925.00 0.00
Flour Mill NIG. PLC - 0.00
CCNN - 0.00
Forte Oil 16,032.00 19,968.00
Flour Mill Plc 816,186.80 456,007.20
FCMB 73,688.00 29,036.00
UBN Plc - 0.00
Unity Bank Plc - 0.00
FCMB Group Plc - 0.00

26
Jaiz Bank Plc 4,329,285.70 640,173.03
Jaiz Bank Plc 371,250.00 0.00
URBAN DEV. BANK OF NIG 0 0.00
KANKARA PHARMACEUTICAL
KAOLINE COMPANY 0 0.00
NEW AFRICAN MERCHANT BANK 0 0.00
Jaiz Bank Plc 0 0.00
TOTAL 737,299,326.40 639,177,357.38
NIG. SOVEREIGGN WEALTH INVEST.
AUTHORITY (STATE) Adjusted. 3,539,592,802.44 3,592,915,680.06
• PAYABLES & OTHER LIABILITIES
2020 2019
Outstanding Gratuities 2,482,811,826.56 814,787,879.70
Contractors arrears 16,568,569,225.85 10,347,375,328.24
Outstanding Gratuities represent the Gratuities as at the Last Quarter of the Financial Year 2020 that is yet to be paid as at
31/12/2020.
Contractors arrears: - Represent the value of yet to be paid interim & final certificate of valuation of work done by the contractors
mobilization (Advance payment).
• OVERHEAD COST AND SUBVENTIONS.

27
2.1 the financial statement has been presented in accordance with accrual basis international public sector Accounting standard
(IPSASS). IPSAS 33 allows a first-time adopter period of up to three years to recognize and/or measure certain assets and/or
liabilities. In its transition to accrual based IPSASS, the State government has taken advantage of exemptions that affect fair
presentation and those that do not affect fair presentation and as such is unable to make an explicit and unreserved statement
of compliance with accrual based IPSAS. The date of adoption of IPSAS is 1st January 2017.
PUBLIC DEBTS.
DOMESTIC DEBTS:
i. Salary Bailout:-
On the inception of this administration in 2015, it was discovered that many States & Local Governments have a lot of
Unpaid Salaries, Pension & Gratuities. As a result of this, it was agreed as part of an intervention program to bail out
States from such Burden. The consent to borrow was signed in 2015 for a duration of 20years at an interest rate of 9%
on reducing method.
ii. Budget Support:-
In order to improve States Budget performance, the Federal Government of Nigeria (FGN) granted this facility at the rate
of 9%, but could be reviewed upward to 15% per annum where a State failed to met all the indicators contained in fiscal
sustainability plan (FSP).
iii. Excess Crude-Oil Account ECA LOAN:-
This was borrowed to Finance Infrastructural deficit within the State. It has a duration of 20years at 9% covering from
February 2016 to February 2036.
iv. SMEDAN(SMALL AND MEDIUM ENTERPRISE DEVELOPMENT LOAN PROGRAMME) :-
As part of its development role, the Central Bank of Nigeria (CBN) has established the Small and Medium Enterprises
Credit Guarantee Scheme (SMEGS), for promoting access to credit by SMES in Nigeria.
Katsina State fast-track the development of the manufacturing SME sector of the State economy. The loan shall have a
maximum tenor of seven (7) years.

28
EXTERNAL DEBTS:
i. Katsina State Health Dev. IV:-
Katsina State Health System Development iv was secured during the year 2003 to improve health system facilities in
the State.
ii. Katsina State Health Dev.:-
In its effort in providing regular Health services, Katsina State Health System Development IV secured during the year
2003 to finance and improve general health services in the State.
iii. Katsina State Small Earth Dam (Const. & Rehab.):-
Katsina State Small Earth Dam was borrowed during the year 2009 to improve the level of irrigation activities and grazing
areas.
iv. Katsina State Multi State Water:-
In its effort to improve infrastructural facility, Katsina State Multi State Water was secured during the year 1993 to provide
adequate water supply in the State.
v. Katsina State Universal Education:-
Education serve as basic need for sustainable development, Katsina State Universal Education was borrowed during
the year 2003 to finance the Universal Basic Education in the State, especially building of Primary Schools and other
equipment.
vi. Katsina State Health System Dev. :-
Katsina State Health System Development was secured during the year 2003 to improve health sector in the State.
vii. Katsina State Local Empowerment & Environmental management project.:-

29
In its ambition to empower local environment, Katsina State Local Empowerment & Environ. Was secured during the
year 2004 to help Local Communities and its Environment.
viii. Katsina State HIV/AIDS:-
In its consideration on HIV/AIDS Victims, Katsina State HIV/AIDS was secured during the year 2002 to control the
spread of the HIV/AIDS and provide necessary facilities to the Victims all over the State.
ix. Katsina State Community & Social Dev. :-
In its effort to provide infrastructural facilities and maintain Social Development, Katsina State Community & Social
Development was secured during the 2009 to improved community development.
x. Katsina State Third National Fadama Dev. :-
Agriculture serve as basic rudiment for economic setting, Katsina State Third National Fadama Development was
secured during the year 2009 to finance the agricultural services in the State.
xi. Katsina State Second HIV/AIDS:-
In its effort to fight against and control the spread of HIV/AIDS, Katsina State Second HIV/AIDS was secured during the
year 2011 to fight and supply adequate medical facilities in the State.
xii. Katsina State Agric & Community Dev. :-
Katsina State Agric & Community Development was secured during the year 1991 to finance and improve Agriculture in
the State.
xiii. Katsina State Agric & Community Dev. :-
Katsina State Agric & Community Dev. Was secured during the year 2015 to improve Agricultural activities in the State.
xiv. Katsina State Comm. Based Agric :-
Katsina State Comm. Based Agric was secured during the year 2002 to improved and empower local communities.

30
BREAKDOWN OF SHARE OF FAAC (STATUTORY ALLOCATION)
2020
1a 1b 1c 1d 1e 1e 1f 1g 1h 1i 1j
MONTH NET RECEIPTS DEDUCTION FROM FAAC
REFUND FROM FAAC
EXCESS BANK
CHARGES
OTHER REVENUE (FAAC)
FOREX EQUALIZATIO
N OTHER FAAC EXCHANGE DIFFERENCE
NON OIL REVENUE
EXCESS CRUDE COVID 19 TOTAL
NOTE 1 N N N N N N N N
JANUARY 3,955,182,390.67 506,513,899.18 9,095,118.48 4,470,791,408.33
FEBRUARY 3,499,693,910.36 501,565,517.25 146,875,669.87 7,986,883.31 4,156,121,980.79
MARCH 3,014,130,010.05 519,477,015.84 114,532,015.79 5,763,344.79 3,653,902,386.47
APRIL 3,172,264,697.74 154,091,693.14 489,651,456.11 3,816,007,846.99
MAY 2,166,048,608.20 152,706,384.14 254,233,846.08 983,365,531.87 207,629,121.21 3,763,983,491.50
JUNE 2,997,238,062.86 152,706,384.14 473,587,694.08 216,948,391.63 3,840,480,532.71
JULY 3,156,138,421.22 152,706,384.14 441,862,469.87 338,309,746.49 4,089,017,021.72
AUGUST 4,034,863,429.20 152,706,384.14 4,187,569,813.34
SEPTEMBE R 3,945,999,103.25 196,507,140.17
1,000,000,000.0 0 5,142,506,243.42
OCTOBER 2,452,786,312.79 196,507,140.17 297,973,188.29 389,772,669.02 542,563,555.28 3,879,602,865.55
NOVEMBER 2,536,061,752.56 196,507,140.17 8,673,151.56 55,709,338.69 173,232,297.34 542,563,555.28 3,512,747,235.60
DECEMBER 2,929,468,611.63 196,507,140.17 59,286,692.03 3,185,262,443.83
TOTAL 37,859,875,310.53 3,078,502,222.65 727,821,540.16 8,673,151.56 0.00 527,501,234.80 1,962,284,360.58 1,058,435,670.39 389,772,669.02 1,085,127,110.5
6 1,000,000,000.0
0 47,697,993,270.25

31
NOTE 2 DETAILS OF GOVERNMENT SHARE OF VAT
MONTHS NET RECEIPT DEDUCTION AT SOURCE TOTAL N N N
JANUARY
1,470,035,819.43
1,470,035,819.43
FEBRUARY
1,306,071,664.24
1,306,071,664.24
MARCH
1,240,566,887.44
1,240,566,887.44
APRIL
1,493,170,449.61
1,493,170,449.61
MAY
1,179,885,669.87
1,179,885,669.87
JUNE
1,326,128,678.27
1,326,128,678.27
JULY
1,595,589,127.81
1,595,589,127.81
AUGUST
1,648,521,529.71
1,648,521,529.71
SEPTEMBER
1,959,044,154.13
1,959,044,154.13
OCTOBER
1,767,136,591.10
1,767,136,591.10
NOVEMBER
1,577,425,965.55
1,577,425,965.55

32
DECEMBER 1,938,874,929.03 1,938,874,929.03
TOTAL 18,502,451,466.19 18,502,451,466.19
NOTE 3 TAX REVENUE (IGR) 2020 2019
N N N
Taxes 10,822,320,118.57
TOTAL 10,822,320,118.57 7,956,319,399.63
NOTE 4 NON TAX REVENUE (IGR) 2020 2019
N N N
Fines and Fees 315,235,307.77 281,742,317.00
Licences 4,072,250.00 1,659,600.00
Earnings and sales 238,998,780.30 2,553,587,755.90
Rent of Government properties 60,029,712.01 76,196,300.77
Revenue Generating Agency (MDA's) 4,406,192,777.83 -
TOTAL 5,024,528,827.91 2,913,185,973.67

33
NOTE 5 INVESTMENT INCOME 2020 2019
N N N
Dividend Received :
Loan Repayment house of assembly Members 45,132,035.81
TOTAL 45,132,035.81 45,875,607.34
NOTE 6 INTEREST FROM BANKING
OPERATIONS 2020 2019
N N N
S/N MONTH AMOUNT
1 JANUARY 1,012.95 -
2 FEBRUARY 915.11 1,595.27
3 MARCH 1,046.05 838.44
4 APRIL 980.88 811.57
5 Interest on bank Deposit 5,034.00 838.80
6 - 811.90

34
7 - 8,992,499.14
8 - 5,200,711.78
9 - 6,624,962.23
10 - 5,259.42
11 - 5,090.85
12 - 3,206.82
TOTAL 8,988.99 20,836,626.22
NOTE 7 2020
APPROVED OPENING BALANCE ACTUAL RECEIPT 2020 EXPENDITURE - BALANCE AS AT 31/12/2020 - 2019
TOTAL RECIEPT FROM JANUARY TO DECEMBER,
2020 0 LOAN GRANT LOAN GRANT LOAN GRANT
NIGERIAN EROSION AND WATER SHADE MGT PROJECT (NEWMAP) 2,775,533,992.00 5,760,000,000.00 115,200,000.00 8,426,889,068.52 115,200,000.00 108,644,923.48 - 3,306,445,076.65
IFAD/CASP 97,326,552.79 346,662,368.85 40,334,454.14 337,121,733.03 40,334,454.14 106,867,188.61 - 447,181,012.45
NIGERIA PARTNERSHIP FOR EDUCATION PROJECT (NIPEP) - 0.00 1,072,640,000.00 0.00 1,072,640,000.00 - - 126,681,893.95
RURAL ACCESS & AGRIC. MARKETING PROJECT (RAAMP) 0.00 0.00 - 0.00 - - - 50,000,000.00
ADOLECENT GIRLS INITIATIVE FOR LEARNING & EMPOWEMENT (AGLE) 0 0.00 - 0.00 - - -
ACCELERATING NUTRITION RESULT IN NIG. (ANIRN) 0 0.00 - 0 - - -

35
SUB-TOTAL
2,872,860,544.79
6,106,662,368.85
1,228,174,454.14
8,764,010,801.55
1,228,174,454.14
215,512,112.09
-
GRAND TOTAL
10,207,697,367.78
9,992,185,255.69
-
-
3,930,307,983.05
NOTE 8 OTHER REVENUE 2020 2019 N N N
SFTAS 540,000,000.00
1,900,000,000.00
2,280,000,000.00 4,720,000,000.00
PARIS CLUB
10,889,204,907.97 NOTE 9 -
NOTE 9A
TRANSFER FROM OTHER MDAs
2020
2019
N N N Escow Receipts:
Local Governments Contribution Security 681,666,663.94 718,333,331.82 Local Government Scholarship 410,119,018.01 146,983,605.14 Local Govt Ecological 1,174,292,612.04 1,251,435,922.92
TOTAL LOCAL GOVT. CONTRIBUTION
2,266,078,293.99
2,116,752,859.88
NOTE 9B
STATE GOVT. CONTRIBUTION:
Ecological Fund: State Govt. Cont. 488,442,611.00 730,617,552.35 Security: State Govt. Cont. 0.00 150,000,000.00 State Government Scholarship 127,353,950.00 146,983,605.00

36
SUB-TOTAL
615,796,561.00
1,027,601,157.35
GRAND TOTAL 2,881,874,854.99 3,144,354,017.23
NOTE 10
SALARIES AND WAGES
2020
2019
N N N
ACTUAL TOTAL SALARY FOR THE YEAR 2020
30,730,896,829.19
28,434,077,460.73
CRF Charges 895,860,416.30 750,874,847.71
TOTAL
31,626,757,245.49
29,184,952,308.44
NOTE 11
SOCIAL BENEFITS
2020
2019
N N N
Pension 5,234,284,597.79 4,705,202,878.29
Gratuities 314,395,659.20 1,410,517,324.42
Others
TOTAL 5,548,680,256.99 6,115,720,202.71
NOTE 12
OVERHEAD COST
2020
2019
N N N

37
SECTORS
ACTUAL EXPENDITURE
Economic sector 4,105,512,220.83 3,737,244,778.07
Social sector 2,669,715,897.82 3,983,282,783.26
Administrative sector 8,543,374,246.20 8,352,467,880.02
Law & Justice 976,582,992.00 1,282,042,384.59
TOTAL
16,295,185,356.85
17,355,037,825.94
NOTE 13
GRANTS AND CONTRIBUTION
2020
2019
N N N
10%salary contribution to SUBEB
79,497,246.00
60,000,000.00
2.5% contribution to LGSPB
416,313,576.00
416,313,576.00
TOTAL 495,810,822.00 476,313,576.00
NOTE 14
DEPRECIATION CHARGES
2020
2019
N N N
LAND & BUILDING
315,678,096.29
222,348,897.73
INFRUSTRUCTURE
2,113,348,063.65
1,896,205,344.46

38
TRANSPORTATION & EQUIP
1,152,506,296.52
1,208,429,842.11
OFFICE EQUIOMENT
308,411,572.22
257,548,097.63
FURNITURE & FITTINGS
182,577,509.80
160,884,728.79
PLANT & MACHINERY
1,022,046,285.06
668,201,710.22
INVESTMENT PROPERTY
28,807,485.42
TOTAL
5,123,375,308.97
4,413,618,620.95
NOTE 15
PUBLIC DEBT CHARGES (DEDUCTIONS AT SOURCE), CDS
2020
2019
N N N
FROM IGR:
JANUARY
284,130,364.13
208,195,941.31
FEBRUARY
284,130,364.43
208,195,941.31
MARCH
284,130,364.43
208,195,941.31
APRIL
284,130,364.43
208,195,941.31

39
MAY
284,130,364.43
208,195,941.31
JUNE
284,130,364.43
208,195,941.31
JULY
272,989,647.13
208,195,941.31
AUGUST
272,989,647.13
208,195,941.31
SEPTEMBER
272,989,647.13
-
OCTOBER
272,989,647.13
-
NOVEMBER
272,989,647.13
-
DECEMBER
272,989,647.13
-
SUB TOTAL
3,342,720,069.06
1,665,567,530.48
FROM FAAC
JANUARY
506,513,899.18
326,575,650.99
FEBRUARY
501,565,517.25
319,075,825.40
MARCH
519,477,015.84
320,794,782.29
APRIL
154,091,693.14
317,873,886.81
MAY
152,706,384.14
319,463,579.15

40
JUNE
152,706,384.14
316,565,464.41
JULY
152,706,384.14
354,598,301.68
AUGUST
152,706,384.14
353,932,700.11
SEPTEMBER
196,507,140.17
579,652,553.76
OCTOBER
196,507,140.17
508,510,703.90
NOVEMBER
196,507,140.17
505,669,541.03
DECEMBER
196,507,140.17
507,179,500.75
SUB TOTAL
3,078,502,222.65
4,729,892,490.28
MATCHING GRANT (SUBEB)
JANUARY
-
FEBRUARY
-
MARCH
-
APRIL
-
MAY
-
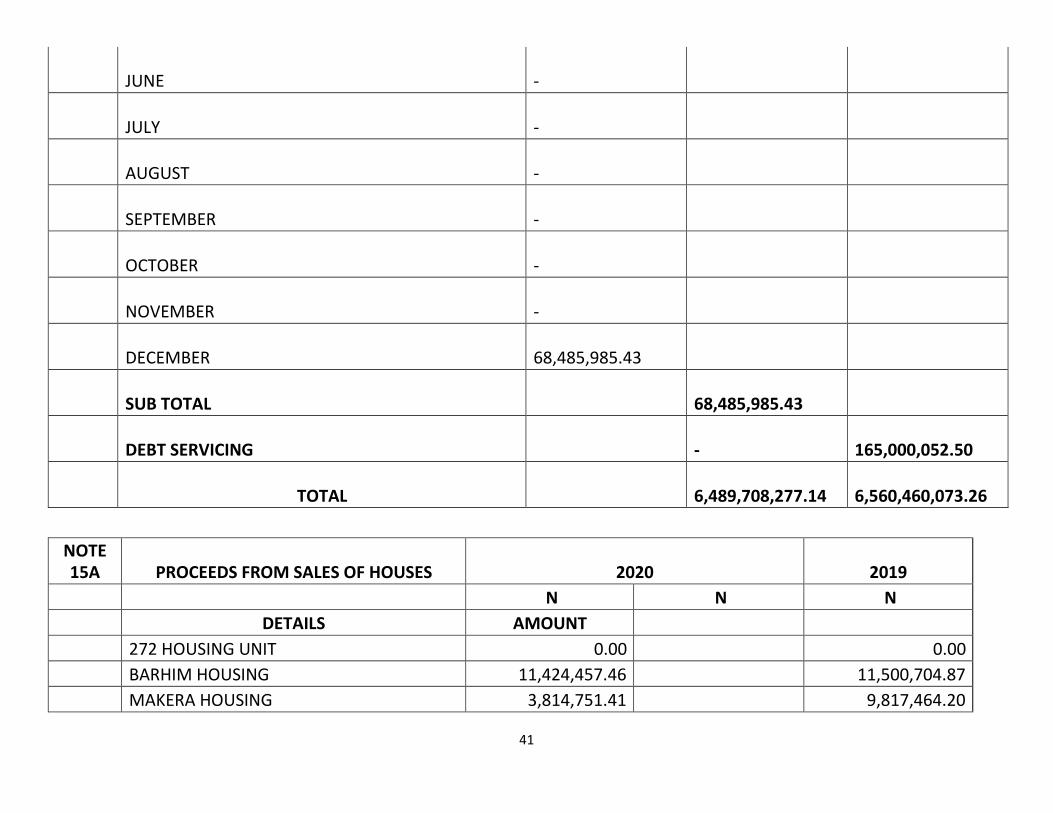
41
JUNE
-
JULY
-
AUGUST
-
SEPTEMBER
-
OCTOBER
-
NOVEMBER
-
DECEMBER
68,485,985.43
SUB TOTAL
68,485,985.43
DEBT SERVICING
-
165,000,052.50
TOTAL
6,489,708,277.14
6,560,460,073.26
NOTE 15A
PROCEEDS FROM SALES OF HOUSES
2020
2019
N N N
DETAILS AMOUNT
272 HOUSING UNIT 0.00 0.00
BARHIM HOUSING 11,424,457.46 11,500,704.87
MAKERA HOUSING 3,814,751.41 9,817,464.20

42
KAFE, ABUJA 41,819,000.00 184,878,600.11
250 ESTATE KABUKAWA 14,922,477.78 40,312,351.44
TOTAL 71,980,686.65 246,509,120.62
NOTE 16
TRANSFER TO OTHER MDAs
2020
2019
N N N
SGS: Security Escrow Expenses 800,107,651.95 1,940,509,340.00
Higher Education:( Scholarship Trust Funds) 537,178,850.00 293,967,210.00
Environment: Ecological Expenses 1,568,652,976.38 2,007,421,569.11
TOTAL 2,905,939,478.33 4,241,898,119.11
NOTE 17
REVENUE ON DISPOSAL ASSETS ACCT.
2020
2019
N N N
Sales of Landed Property
7,089,836.01
107,804.53
Sales of Houses to Occupants
153,454,043.23
-
TOTAL
160,543,879.24
107,804.53

43
NOTE 18 CASH & CASH EQUIVALENT
TSA A/C 3,178,040,933.27
0PERATIONAL A/C 626,459,789.89
SUB-TOTAL 3,804,500,723.16
MDA'S OPERATIONAL A/C 9,351,780,004.50
CASH AT HAND (MDA'S) 83,227.50
SUB-TOTAL 9,351,863,232.00
TOTAL 13,156,363,955.16
NOTE 19 RECEIVABLES (JAAC) 2020 2019
N N N
7,090,163,310.09 -
TOTAL 7,090,163,310.09 7,090,163,310.09

44
NOTE 21 INVESTMENT 2020 2019
N N N
COMPANIES/BANKS HOLDING PRICE VALUED
FBN Holding 2,349,730.00 6.95 16,330,623.50 0.00
UBN Plc 743,917,500.00 0.62 461,228,850.00 11,748,650.00
Access Bank Plc 30,000,000.00 8.05 241,500,000.00 195,000,000.00
Unity Bank Plc 5,828,655.00 0.68 3,963,485.40 4,010,904.25
Zenith Bank Plc 383,625.00 22.60 8,669,925.00 0.00
Flour Mill NIG. PLC 0.00 0.00 0.00 0.00
CCNN 0.00 0.00 0.00 0.00
Forte Oil 960.00 16.70 16,032.00 19,968.00
Flour Mill Plc 33,044.00 24.70 816,186.80 456,007.20
FCMB 24,400.00 3.02 73,688.00 29,036.00
UBN Plc 0.00 0.00 0.00 0.00
NOTE 20 PAYMENT TO JAAC ACCT. FROM PARIS CLUB Disbursement
2020 2019
2020 N N N
3/21/2020 1,000,000,000.00
3/28/2020 888,661,529.29
3/4/2020 600,000,000.00
3/4/2020 768,735,379.61
8/9/2020 1,393,488,410.00
7/8/2020 1,439,277,991.19
TOTAL - 6,090,163,310.09

45
Unity Bank Plc 0.00 0.00 0.00 0.00
FCMB Group Plc 0.00 0.00 0.00 0.00
Jaiz Bank Plc 840,638.00 5.15 4,329,285.70 640,173.03
Jaiz Bank Plc 6,750.00 55.00 371,250.00 0.00
URBAN DEV. BANK OF NIG 2,600,000.00 0.00 0.00 0.00
KANKARA PHARMACEUTICAL KAOLINE COMPANY 2,561,290.00 0.00 0.00 0.00
NEW AFRICAN MERCHANT BANK 20,000,000.00 0.00 0.00 0.00
Jaiz Bank Plc 20,000,000.00 0.00 0.00 0.00
SUB TOTAL A 828,546,592.00 143.47 737,299,326.40 639,177,357.38
NIG. SOVEREIGGN WEALTH INVEST. AUTHORITY (STATE) 7,517,991.79 7,517,991.79
NIG. SOVEREIGGN WEALTH INVEST. AUTHORITY (STATE) 1,883,901.23 2,165,403.72
NIG. SOVEREIGGN WEALTH INVEST. AUTHORITY (STATE) 2,165,403.72 1,883,901.23
SUB TOTAL B 11,567,296.74 306.00 3,539,592,802.44 3,539,592,802.44
GRAND TOTAL C (A+B) 4,276,892,128.84 4,178,770,159.82
NOTE 22
PROPERTY, PLANT & EQUIPMENT
2020
2019
N N N
LAND & BUILDING 4,791,032,649.46 5,017,758,269.72
INFRUSTRUCTURE 12,498,274,477.97 19,043,708,296.67
TRANSPORTATION & EQUIP
743,049,691.32
3,584,927,922.00
OFFICE EQUIOMENT 345,751,497.00 158,747,277.11

46
FURNITURE & FITTINGS
215,478,907.04
154,749,981.07
PLANT & MACHINERY 1,949,939,667.54 1,468,567,524.23
TOTAL 20,543,526,890.33 20,543,526,890.33 29,428,459,270.80
TOTAL FOR THE YEAR 49,971,986,161.12
NOTE 23
INVESTMENT PROPERTY
2020
2019
N N N
239,069,737.99 1,165,025,130.85
TOTAL
239,069,737.99
-
TOTAL FOR THE YEAR 1,404,094,868.84

47
NOTE 24 PAYABLES 2020 2019
N N N
GRATUITY : Staffs 2,482,811,826.56 0.00
CONTRACTORS ARREARS 16,568,569,225.85
19,051,381,052.41 11,162,163,207.94
NOTE 25 BAL LONG TERM BORROWINGS 2020 2019
N N N
External 21,346,885,453.00 21,943,812,061.00
Internal 35,186,387,079.99 35,744,898,478.16
TOTAL 56,533,272,532.99 57,688,710,539.16
ACCUMULATED ASSETS FOR THE
PERIOD
NOT E 26
SCHEDULE OF ASSETS AS AT 31/12/2020
LAND & BUILDING INFRUSTRUCTURE
TRANSPORTATIO N & EQUIP
OFFICE EQUIOMENT
FURNITURE & FITTINGS
PLANT & MACHINERY
INVESTMENT PROPERTY
INTANGIBL E ASSETS TOTAL
CONSTRUCTION N N N N N N N N N
NET BOOK VALUE B/Forward (01/Jan/2020)
10,895,095,988.5 8 92,914,061,878.65 4,833,719,368.45 772,644,292.89
643,538,915.1 8
2,672,806,840.9 0
1,196,425,558.6 8 -
113,928,292,843.3 2
Addition During The Year 4,888,808,825.98 12,753,341,304.05 928,812,114.15 461,001,996.00 269,348,633.8 0
2,437,424,584.4 2 243,948,712.23 - 21,982,686,170.63
Disposal During The Year -
Balance C/Forward (31/Dec/2020)
15,783,904,814.5 6
105,667,403,182.7 0 5,762,531,482.60
1,233,646,288.8 9
912,887,548.9 8
5,110,231,425.3 2
1,440,374,270.9 1 -
135,910,979,013.9 5

48
-
ACCUMULATED DEPRECIATION -
Balance B/Forward (01/Jan/2020) 222,348,897.73 1,896,205,344.46 1,208,429,842.11 257,548,097.63
160,884,728.7 9 668,201,710.22 24,416,848.14 - 4,438,035,469.08
Addition During The Year 315,678,096.29 2,113,348,063.65 1,152,506,296.52 308,411,572.22 182,577,509.8 0
1,022,046,285.0 6 28,807,485.42 - 5,123,375,308.97
Disposal During The Year -
Balance C/Forward (31/Dec/2020) 538,026,994.02 4,009,553,408.11 2,360,936,138.63 565,959,669.85
343,462,238.5 9
1,690,247,995.2 8 53,224,333.56 - 9,561,410,778.05
-
ACCUMULATED IMPAIRMENT -
Balance B/Forward (01/Jan/2020) -
Addition During The Year -
Disposal During The Year -
Balance C/Forward (31/Dec/2020) -
-
NET BOOK VALUE 15,468,226,718.2 7
103,554,055,119.0 4 4,610,025,186.08 925,234,716.67
730,310,039.1 8
4,088,185,140.2 5
1,411,566,785.4 9 -
130,787,603,704.9 9
CURRENT YEAR ASSETS AND DEPRECIATION
NOT E
26A SCHEDULE OF ASSETS AS
AT 31/12/2020 LAND &
BUILDING INFRUSTRUCTURE TRANSPORTATIO
N & EQUIP OFFICE
EQUIOMENT FURNITURE &
FITTINGS PLANT &
MACHINERY INVESTMENT PROPERTY
INTANGIBL E ASSETS TOTAL
CONSTRUCTION N N N N N N N N N
During The Year 4,888,808,825.98 12,753,341,304.05 928,812,114.15 461,001,996.00 269,348,633.8 0
2,437,424,584.4 2 243,948,712.23 21,982,686,170.63

49
Disposal During The Year -
Balance C/Forward (31/Dec/2020) 4,888,808,825.98 12,753,341,304.05 928,812,114.15 461,001,996.00
269,348,633.8 0
2,437,424,584.4 2 243,948,712.23 - 21,982,686,170.63
-
ACCUMULATED DEPRECIATION -
Addition During The Year 97,776,176.52 255,066,826.08 185,762,422.83 115,250,499.00 53,869,726.76 487,484,916.88 4,878,974.24 - 1,200,089,542.32
Disposal During The Year -
Balance C/Forward (31/Dec/2020) 97,776,176.52 255,066,826.08 185,762,422.83 115,250,499.00 53,869,726.76 487,484,916.88 4,878,974.24 - 1,200,089,542.32
-
ACCUMULATED IMPAIRMENT -
During The Year -
Disposal During The Year -
Balance C/Forward (31/Dec/2020) -
-
NET BOOK VALUE 4,791,032,649.46 12,498,274,477.97 743,049,691.32 345,751,497.00 215,478,907.0 4
1,949,939,667.5 4 239,069,737.99 - 20,782,596,628.31
NOTE 27 OTHER EXPENDITURE(TRANSFER TO JAAC ACCT.) 2020 2019
3,793,087,606.78
1,000,000,000.00 1,000,000,000.00
TOTAL 4,793,087,606.78 1,000,000,000.00

50
NOTE 30
NOTE 28 COST OF IGR COLLECTION (BOIR) 2020 2019
10% COST OF COLLECTION 805,289,609.66 171,105,182.99
5% TO BOIR 383,971,255.78
TOTAL 805,289,609.66 555,076,438.77
NOTE 29 2020
PERSONNEL OVERHEAD TOTAL
MINISTRY OF FINANCE
MINISTRY OF BUDGET & ECONOMIC PLANNING
STATE BOARD OF INTERNAL REVENUE
OFFICE OF THE ACCOUNTANT GENERAL
TOTAL
JOURNAL ENTRY INRESPECT OF NIPEP (NOTE 7), 2019
NIPEP 126,681,893.95 BALANCE C/D:
NIPEP (2019) 21,922,819.05 148,604,713.00

51
148,604,713.00 148,604,713.00
BAL. B/D 148,604,713.00
THE FIGURE IN THE DEBIT SIDE IS INCORRECT, ITS RECOREDED AS N126,681,893.95
BUT THE CORRECT FIGURE IS N148,604,713.00
DEBIT THE A/C WITH N21,922,819.05
NEWMAP
NEWMAP (2019) 3,306,445,076.65 BALANCE C/D:
NEWMAP 433,632,079.35 3,740,077,156.00
3,740,077,156.00 3,740,077,156.00
BAL. B/D 3,740,077,156.00

52
THE FIGURE IN THE DEBIT SIDE IS INCORRECT, ITS RECOREDED AS N126,681,893.95
BUT THE CORRECT FIGURE IS N148,604,713.00
DEBIT THE A/C WITH N21,922,819.05

53