ipplc-ar2003.files.investis.com · contents chairman’s statement 2 chief executive officer’s...
TRANSCRIPT

International Powerannual report 2003

Contents Chairman’s statement 2
Chief Executive Officer’s statement 3
Asset portfolio 4
Operating and financial review 5
Board of Directors 22
Senior management team 24
Corporate governance 27
Corporate social responsibility 36
Employees 44
Directors’ remuneration report 46
Directors’ report 60
Statement of Directors’ responsibilities 61
Independent auditor’s report 61
Accounts for the year ended 31 December 2003 62
Five-year financial summary 92
Additional information for US shareholders 94
Shareholder profile 97
Shareholder services and information 98
Financial calendar 98
Glossary 99
Our core business values
Fiscal discipline
Integrity of communication
Respect for the individual
Substance with style
Team first culture
Careful adherence to our core business values will achieve our financialobjectives and fulfil our obligations to all our stakeholders.

Year ended Year ended31 December 31 December
2003 2002
£m £m
Turnover (including joint ventures and associates) 1,273 1,129
Profit/(loss) on ordinary activities before interest and taxation
Excluding exceptional items 285 388
Including exceptional items (57) 327
Profit/(loss) on ordinary activities before taxation
Excluding exceptional items 174 256
Including exceptional items (184) 195
Earnings/(loss) per share (EPS) in pence
Basic excluding exceptional items 10.2p 15.5p
Basic including exceptional items (19.7)p 10.1p
Operating cash flow 285 391
Free cash flow – see page 14 121 252
Capital expenditure
Maintenance 64 48
Growth 57 98
As at As at31 December 31 December
2003 2002
£m £m
Net assets 1,562 1,769
Net debt 692 812
Gearing 44% 46%
Debt capitalisation 31% 31%
annual report 2003 1
Financial highlights

2 International Power
Chairman’s statement
Following two years of exceptional growth, I advised
you in my statement last year that our earnings
would be lower in 2003, and in the range of 9p –
11p per share. In the event, earnings per share at
10.2p (before exceptional items) was down 34%
against 2002 and profit before interest and tax (before
exceptional items) at £285 million was down 27%.
The details behind these headline figures are presentedand explained elsewhere in this Report, but in summarythey show that our assets outside of the US and UK did well. The extremely weak markets in Texas and NewEngland, which in fact worsened as the year progressed,meant that losses there offset some exceptionalperformances elsewhere. In the UK, although wholesalemargins showed some temporary improvement in mid2003, this was short lived and therefore of limited benefitto our earnings for the year.
As we look ahead, we can still see good progress being made in many of our markets around the world.Unfortunately, without some industry re-structuring in ourUS markets and in the UK, possibly accompanied by somerepositioning of our business and assets in these areas,we believe that the next few years could remain difficult.Importantly, we have well run and highly efficient assetsin both the US and the UK, and as the current imbalancebetween supply and demand reduces, we expect to beamong the first generators able to return our plants to profit.
I would like to comment on two other issues that willaffect our decision making as we manage our existing US and UK assets, and consider how much support and investment, or otherwise, we should provide.
In the US, because the visible medium-term outlook for our markets remains weak, we are in discussions with the bank group for our US business to restructureits non-recourse debt facility. A successful conclusion tothis exercise, in the interests of shareholders and all otherparties, is essential to ensure our on-going commitmentto these assets. In the UK, a sensible carbon allocationlevel which is compatible with that adopted by ourEuropean trading partners, is equally important to ourinvestment decisions in this market. Both of these issueswill become much clearer as the year progresses, and we will keep you informed at the appropriate times.
Our policy on distributions to shareholders has alsodeveloped during 2003. We implemented a sharebuyback programme in May, and to date have boughtback some 10.7 million shares at a cost of £13 million. We also negotiated some additional flexibility in ourcorporate bank facility, enabling dividend distributions tocommence in 2005. We will review our dividend policy atour 2004 year end, based on our cash flow performanceand our business outlook.
The last year was also a year of change in your Board. At the end of November 2003, our Chief ExecutiveOfficer (CEO), David Crane, left the Board when he wasoffered an exceptional US-style salary package, with whichwe could not and did not wish to compete. We also saidgoodbye to Peter Giller. I would like to express my thanksto David and to Peter for their contribution to theCompany over the last few years. When we knew thatDavid was leaving, we set in train the process to find theright replacement. This involved the appointment ofexternal search consultants, and an examination of bothexternal as well as internal candidates. At the end of thisprocess, I was very pleased that Phil Cox accepted ouroffer to become CEO. Phil had been our Chief FinancialOfficer since demerger and there is no-one who has abetter overall understanding of our business, our marketsand our objectives. Phil’s replacement is Mark Williamson,who had been the head of our finance function fromdemerger. At the beginning of 2004, we also welcomedtwo new operational Directors to the Board. Steve Riley,who recently returned from Australia, is now the ExecutiveDirector responsible for our European activities, and TonyConcannon, who until recently managed our UK assets, isnow the Executive Director responsible for our businessin Australia. Steve and Tony are both young men, but theyhave been with the Company for some time and bring tothe Board their considerable experience in our industry.
I would also like to thank all the employees across theGroup for their continued efforts in 2003. Wherever I goin the Group I am always impressed by their enthusiasticand professional approach to their work.
Good corporate governance remains at the forefront ofour minds, and last year I undertook to report on thissubject more fully. In the event, the Financial ReportingCouncil issued a revised Combined Code in July 2003.Although this Revised Code is not directly applicable tous for the financial year just ended, we do report in ourcorporate governance section, not only on our practiceduring 2003, but also on the application of the RevisedCode, highlighting those limited areas where currently wemay be at variance with its requirements.
As you will see from our CEO’s statement, we continue toactively review growth opportunities in all our core regions.We do, however, need to resolve some difficult issues thisyear, particularly the restructuring of our US non-recoursedebt facility, to ensure that we can return to the path ofearnings growth and increased shareholder value.
Sir Neville Simms
Chairman

annual report 2003 3
Chief ExecutiveOfficer’s statement
Dear Shareholder,
I am pleased to report earnings per share (beforeexceptional items) in line with our earnings guidance for2003, but I recognise that 2003 was the difficult year weanticipated, with profits down on last year – principallydue to low prices for wholesale power in two of our keymarkets, namely the US and the UK. The fact that we diddeliver on our earnings guidance is a testament to thestrength of our global portfolio.
The Operating and financial review that follows in thisreport will give you a full explanation of our regionalperformance. There were many success stories. OurEuropean assets (outside the UK) had another excellentyear, with EOP in the Czech Republic delivering a recordperformance and our contracted assets in Portugal andTurkey achieving high levels of availability that resulted in good financial results. This was balanced against ourperformance in the UK, where trading conditions remaindifficult, with low margins for wholesale power generators.Our Middle East business, which is underpinned by long-term off-take contracts, continues to grow profitably, withthe acquisition of the Umm Al Nar power and desalinationplant in Abu Dhabi. In Australia, the strength of ourcontracted position has maintained financial performancein a year when underlying market prices were somewhatweaker. Our assets in the Rest of the World, namely inMalaysia and Thailand, had excellent years. In Pakistan the agreements reached in 2000 have stood firm, andwe continue to be paid in full and on time.
We have also taken steps to strengthen our capitalstructure by issuing a new convertible bond, and byrenegotiating and renewing our Corporate bank facility.These steps provide additional security and flexibility toour capital structure.
Looking forward, we have many opportunities and somechallenges, all of which I believe we are well equipped to deal with. Our principal challenge is the US business,where the clear objective is to preserve value for ourshareholders. A wide range of options are currently under review. The fundamental issue is oversupply, and it will probably take some time for the supply/demandimbalance in our US markets to be corrected. We aretaking active steps to manage this position, including areduction in our cost base, selective mothballing of plantthat is uneconomic to run, and the renegotiation of ournon-recourse project debt. At this stage, we cannotpredict with certainty the outcome of these negotiations,
but we remain focused on minimising the financialdemands on the Group, whilst recognising the upsidevalue from future market recovery. We have also taken a prudent view on the balance sheet value of our USmerchant assets, and have written down their value by£404 million at the year end, based on our view of theirlong-term cash flows. Weak market conditions in the US is the sole reason our earnings guidance for 2004 is lower, with an EPS range of 7p to 9p.
We continue to be very active in reviewing growthopportunities, both in our existing merchant markets and in those that provide secure long-term contracts. Let me give you two examples. The low wholesale priceenvironment means that selected merchant assets inboth the UK and the US are potentially available at adiscount to original cost, providing an opportunity to add value, scale and complementary assets in our coremarkets. Secondly, as an investment that will significantlyincrease our long-term contracted position, we announcedin December 2003 that we will build four power stationsin Saudi Arabia with a total capacity of 1,074 MW, all ofwhich are fully contracted to Saudi Aramco, one of thelargest oil and gas companies in the world. These plantswill start operating during 2006. We continue to reviewfurther opportunities in the Middle East. Our investmentcriteria remain stringent and we will use your capitalcarefully.
We take our environmental and communityresponsibilities very seriously, and the corporate social responsibility section of this report will give yousome practical examples of our commitment. We alsoannounced in early 2004 our first wind farm developmentin Australia, and we continue to develop the capability touse more environmentally-friendly fuels in our UK coal-fired plant.
The senior management team and I have a clear vision of the future for your Company. Our strategy remains tocreate value through wholesale power generation in ourcore regions, and we have the people, the resources andthe determination to ensure we deliver for the benefit of all our shareholders and stakeholders.
Philip Cox
Chief Executive Officer

4 International Power
Asset portfolio
THE TABLE BELOW SETS OUT DETAILS IN RELATION TO OUR OPERATING PLANTSAND PLANTS UNDER CONSTRUCTION AS AT 26 FEBRUARY 2004.
Fuel/type Gross Net Gross Netcapacity capacity(2) capacity capacity(2)
power power heat (MWth) heat (MWth)MW MW desal (MIGD) desal (MIGD)
steam steam(million lbs/hr) (million lbs/hr)
Assets in operation
North America Hartwell, Georgia Gas (OCGT) 310 155
Oyster Creek, Texas Gas (Cogen/CCGT) 425 213 100 MWth 50 MWth
Hays, Texas(1)(4) Gas (CCGT) 1,100 1,100
Midlothian I and II, Texas(1) Gas (CCGT) 1,650 1,650
Blackstone, Massachusetts(1) Gas (CCGT) 570 570
Milford, Massachusetts Gas (CCGT) 160 160
Bellingham, Massachusetts(1) Gas (CCGT) 570 570
North America total in operation 4,785 4,418 100 MWth 50 MWth
Europe EOP, Czech Republic(3) Coal/Gas 585 580 1,945 MWth 1,925 MWth
Deeside, UK Gas (CCGT) 500 500
Rugeley, UK Coal (50 MW of OCGT) 1,050 1,050
Tejo Energia (Pego), Portugal Coal 600 270
Uni-Mar (Marmara), Turkey Gas (CCGT) 480 160
Europe total in operation 3,215 2,560 1,945 MWth 1,925 MWth
Middle East Al Kamil, Oman Gas (OCGT) 285 285
Arabian Power Company
(Umm Al Nar), UAE Gas (CCGT)/desalination 870 174 162 MIGD 32 MIGD
Middle East total in operation 1,155 459 162 MIGD 32 MIGD
Australia Hazelwood, Victoria Coal 1,610 1,480
Synergen, South Australia Various (OCGT) 360 360
Pelican Point, South Australia Gas (CCGT) 485 485
SEA Gas pipeline, South Australia(5) n/a n/a
Australia total in operation 2,455 2,325
Rest of the World Malakoff, Malaysia(3) Gas (OC/CCGT) 1,895 355
Thai National Power
(Pluak Daeng), Thailand Gas (Cogen) 110 110 20 MWth 20 MWth
HUBCO, Pakistan Oil 1,290 270
KAPCO, Pakistan Gas/Oil (CCGT) 1,600 575
Rest of the World total in operation 4,895 1,310 20 MWth 20 MWth
TOTAL in operation around the world 16,505 11,072
Assets under construction
Arabian Power Company
(Umm Al Nar Expansion), UAE Gas (CCGT)/desalination 1,550 310 25 MIGD 5 MIGD
Shuweihat S1, UAE Gas (CCGT)/desalination 1,500 300 100 MIGD 20 MIGD
Saudi Aramco Cogen Projects, Saudi Arabia Gas (Cogen) 1,074 644 4.5m lbs/hr 2.7m lbs/hr
Malakoff, Malaysia(3) Coal 1,890 355
TOTAL under construction around the world 6,014 1,609
(1) Capacity shown for these assets is the nameplate capacity.(2) Net capacity – Group share of gross capacity.(3) Gross capacity amount shown for EOP and Malakoff represents the actual net interest owned directly or indirectly by EOP and Malakoff, respectively.(4) The generation capacity at Hays was mothballed in January 2004.(5) 687 km gas pipeline from Victoria to South Australia.

annual report 2003 5
Operating and financial review
ABOUT INTERNATIONAL POWER WE ARE AN INTERNATIONAL WHOLESALE POWERGENERATOR AND DEVELOPER WITH INTERESTS IN 12 COUNTRIES COVERING FOURCONTINENTS. FOR REPORTING PURPOSES WE ORGANISE OUR BUSINESS INTO FIVE SEGMENTS: NORTH AMERICA, EUROPE, MIDDLE EAST, AUSTRALIA AND REST OF THE WORLD.
Our businessInternational Power owns, controls or operates morethan 16,000 MW of generating capacity worldwide.Formed in October 2000 by the demerger of NationalPower, International Power is currently listed on theLondon and New York Stock Exchanges. Since demerger,we have increased our international presence by buildingnew generating assets in the US, Oman and the UAE and through the acquisition of plants in Australia, theUAE and the UK.
We generate electricity from gas, oil, coal and renewable energy sources. We also maximise valuethrough complementary activities. These include mining coal and transporting gas by pipeline in Australia,desalinating water in the Middle East and providing steamfor district heating systems in Europe. Some of the powerwe generate is sold to customers through competitivemerchant markets. The remainder is sold to singlecustomers under long-term power purchase agreements.
Environmental care is an integral part of all ouroperations. New initiatives range from developing ourfirst wind farm in Australia to increasing our capability toburn more environmentally friendly fuels in our UK coal-fired power station.
The corporate social responsibility section (see pages 36 to 42) sets out how we manage environmentalimpacts and our relationship with the communities inwhich we operate.
Our strategy We aim to create value in wholesale power generationthrough operating our existing asset portfolio efficiently,trading output competitively and growing the business inour core regions of North America, Europe, the MiddleEast and Australia. We aim to maintain a balancedportfolio of assets in terms of fuel diversity, dispatch type,geographical spread and participation in both merchantmarkets and long-term contracts.
We have the people, the resources and the determinationto deliver for the benefit of all our shareholders and stakeholders.
Our core skillsWe operate in a capital-intensive industry where financing expertise optimises the funding structure for all our assets and investments. Growth comes from amixture of development projects and acquisitions. Wehave a co-ordinated corporate and regional approach to the sourcing, selection and evaluation of acquisitionopportunities. Robust technical, commercial and financialcriteria ensure our capital is used wisely.
Long-term success depends on the quality of thedevelopment opportunities we secure. We have beenparticularly successful in the Middle East, where long-term off-take agreements significantly balance risk indeveloping and building new capital-intensive plant. Ourdevelopment, construction management and commercialskills are essential for ensuring satisfied customers andsound financial returns.
Our business requires maximum plant availability,particularly at times of peak demand, and ourexperienced operations and engineering personnel help us deliver at these times of significant value. There is close integration between operations and trading teams in all our core regions to ensure speed and flexibility of response to market conditions. Our fuel procurement teams are responsible for co-ordinatingour gas, coal and oil supply with the demands of ourpower generation profile.

6 International Power
Financial highlights
Profit and loss accountYear ended Year ended
31 December 31 December2003 2002
£m £m
Excluding exceptional items
Turnover – gross 1,273 1,129
Profit before interest and tax 285 388
Interest (111) (132)
Tax (54) (77)
Minority interests (7) (6)
113 173
Earnings per share 10.2p 15.5p
Including exceptional items
(Loss)/profit before interest and tax (57) 327
(Loss)/earnings per share (19.7)p 10.1p
Balance sheetAs at As at
31 December 31 December2003 2002
£m £m
Net assets 1,562 1,769
Net debt 692 812
Gearing 44% 46%
Debt capitalisation 31% 31%
• Earnings per share (before exceptional items) of 10.2p, in line with guidance
• Profit before interest and tax (before exceptional items) of £285 million (2002: £388 million)
• Operating cash flow of £285 million (2002: £391 million)
• Book value of US merchant plants written down by £404 million to £600 million (as an exceptional item)
• Balance sheet strength maintained – gearing 44%; debt capitalisation 31%
• Interest cover (before exceptional items) of 2.6x (2002: 2.9x)
• US$252 million convertible bond issued; US$450 million three-year revolver signed
Left: Umm Al Nar, UAE

annual report 2003 7
Regional highlights
Segment results – excluding exceptional items
Year ended Year ended31 December 31 December
2003 2002
£m £m
Turnover
North America 414 315
Europe 474 440
Middle East 33 –
Australia 224 226
Rest of the World 128 148
Gross turnover 1,273 1,129
Less: turnover of joint ventures (136) (122)
Less: turnover of associates (285) (290)
Group turnover 852 717
Profit before interest and tax
North America 2 99
Europe 103 100
Middle East 23 9
Australia 101 101
Rest of the World 84 108
Segmental operating profit 313 417
Corporate costs (28) (29)
Operating profit (excluding exceptional items) 285 388
Exceptional items (342) (61)
(Loss)/profit before interest and tax (57) 327
• Added 1,600 MW (net) of new capacity (in operation and under construction) to portfolio
• Acquired 20% ownership of Umm Al Nar power and water desalination plant in Abu Dhabi
• De-mothballed 250 MW unit at Deeside, UK in Q4 2003
• Awarded contract by Saudi Aramco for four cogeneration plants in Saudi Arabia
• Completed 687km SEA Gas pipeline in Australia
• Secured first wind farm project in Australia (46 MW) with 10-year power purchase agreement
The regional performance is discussed in more detail on pages 8 to 12. Corporate costs and exceptional items are discussed on page 13.

8 International Power
Regional performance
North AmericaYear ended Year ended
31 December 31 December2003 2002
£m £m
Turnover 414 315PBIT (pre-exceptional items) 2 99Exceptional items (404) –PBIT (402) 99
Weak wholesale prices impacted our financialperformance in North America during 2003. Grossturnover in North America increased to £414 millionfrom £315 million in 2002, as all plants were operationalduring 2003. However, 2003 profit before interest andtax decreased to £2 million from £99 million in 2002,due to a combination of low spark spreads and decliningcompensation payments from Alstom.
In light of recent trading conditions and future priceforecasts in the ERCOT (Texas) and NEPOOL (New
England) markets, we reviewed the balance sheet bookvalues of the US merchant plants (Hays, Midlothian,Blackstone, Bellingham and Milford). This review resultedin an impairment of these assets by an aggregate amountof £404 million. The revised net book value of theseassets totals £600 million.
Given uncertainty in the ability of these merchant assets to meet all future costs including interestpayments, our US subsidiary, ANP Funding 1, hasproactively approached its US bank group to renegotiatethe terms of its non-recourse project finance in order to provide an appropriate long-term financing structure.Discussions with the bank group will examine a widerange of options. As we are also in discussion with theUS bank group regarding certain claimed technical events of default, this non-recourse debt is disclosed as current debt in our accounts.
Due to uneconomic prices, we mothballed our modern1,100 MW combined cycle gas turbine (CCGT) Hays powerstation in Texas in January 2004, for an indefinite period.
Fuel / Type Gross Net Gross Netcapacity capacity(2) capacity capacity(2)
power power heat (MWth) heat (MWth)MW MW
Assets in operation
Hartwell, Georgia Gas (OCGT) 310 155 – –
Oyster Creek, Texas Gas (Cogen/CCGT) 425 213 100 50
Hays, Texas(1)(3) Gas (CCGT) 1,100 1,100 – –
Midlothian I and II, Texas(1) Gas (CCGT) 1,650 1,650 – –
Blackstone, Massachusetts(1) Gas (CCGT) 570 570 – –
Milford, Massachusetts Gas (CCGT) 160 160 – –
Bellingham, Massachusetts(1) Gas (CCGT) 570 570 – –
North America total in operation 4,785 4,418 100 50
(1) Capacity shown for these assets is the nameplate capacity.(2) Net capacity is the Group share of gross capacity.(3) The generation capacity at Hays was mothballed in January 2004.
International Power operates within the wholesalegeneration market, with the skills and resources to playan active role in all phases of the power generation chain.
Left: Blackstone, US

annual report 2003 9
EuropeYear ended Year ended
31 December 31 December2003 2002
£m £m
Turnover 474 440
PBIT (pre-exceptional items) 103 100Exceptional items 7 (103)PBIT 110 (3)
All our European assets delivered a strong operationalperformance last year. Turnover increased by 8% to £474 million, principally supported by the performanceof the contracted assets in this region. Our long-termcontracted assets in Portugal and Turkey deliveredexcellent financial performance, and coupled with arecord profit performance from EOP in the CzechRepublic, offset the weak market conditions in the UK and helped the region generate profit before interest and tax of £103 million (2002: £100 million).
Overall profitability in the UK was lower than last year due to the termination of the tolling agreement at Rugeley (with TXU Europe) in November 2002 andweak wholesale prices during much of 2003. Followingthe termination of the tolling contract, the existing £160 million non-recourse debt facility for Rugeley wasrenegotiated and reduced to £90 million in August 2003.We continue to discuss appropriate compensation withTXU Europe’s administrators, but at present we areunable to forecast the timing of a resolution.
In the UK, in order to provide additional support for ourcontracted capacity during the winter period, we returnedthe 250 MW mothballed unit at the Deeside plant toservice in October 2003.
Although UK wholesale prices showed someimprovement in the second half of 2003, significantincreases in gas and coal prices quickly eroded thisbenefit. Despite these tough market conditions, we see
potential opportunities to add value by consolidating ourposition in the UK and we will continue to review marketdevelopments carefully.
In January 2004, the UK government announced draftcarbon dioxide emission allocations and commencedindustry consultation to finalise the position by the end of September this year. The draft allocations for Rugeleyand Deeside were broadly in line with our expectations.Carbon dioxide allocations are an important factor indeciding whether the fitting of flue gas desulphurisation(FGD) at Rugeley is economic. This decision will be madein June 2004 when we decide on our plans for Rugeleyunder the Large Combustion Plant Directive (LCPD).
EOP and Pego are well placed to meet theirrequirements under the LCPD. FGD is already fitted at EOP, and plans are underway to build FGD at Pegoduring 2006.
The Portuguese government has commenced discussionswith incumbent generators to make changes to existinglong-term Power Purchase Agreements (PPAs). Thesediscussions are targeted to enable the Portuguese marketto integrate with the new liberalised Iberian wholesalepower market that is due to commence operation in2006. These discussions are at an early stage and arelikely to continue into the second half of 2004. Webelieve that the government intends to preserve the valuein these contracts and therefore we expect to be kepteconomically whole through this process.
In February 2004, we disposed of our stake in Elcogas,Spain. This investment had been fully provided against,and the release of a guarantee will result in anexceptional gain in Q1 2004.
To reflect our current management structure we now report the results of our Middle East business as a separate region rather than with the European business results, as reported last year.
Fuel / Type Gross Net Gross Netcapacity capacity(1) capacity capacity(1)
power power heat (MWth) heat (MWth)MW MW
Assets in operation
EOP, Czech Republic(2) Coal/Gas 585 580 1,945 1,925
Deeside, UK Gas (CCGT) 500 500 – –
Rugeley, UK Coal (50 MW of OCGT) 1,050 1,050 – –
Tejo Energia (Pego), Portugal Coal 600 270 – –
Uni-Mar (Marmara), Turkey Gas (CCGT) 480 160 – –
Europe total in operation 3,215 2,560 1,945 1,925
(1) Net capacity is the Group share of gross capacity.(2) Gross capacity amount shown for EOP represents the actual net interest owned directly or indirectly by EOP.

10 International Power
Middle EastYear ended Year ended
31 December 31 December2003 2002
£m £m
Turnover 33 –
PBIT (pre-exceptional items) 23 9Exceptional items – –PBIT 23 9
Turnover rose to £33 million (2002: £nil) and operatingprofit increased to £23 million (2002: £9 million) as a result of the acquisition of Umm Al Nar and thecommencement of operations at Al Kamil.
In April, together with our partners TEPCO and Mitsui,we acquired a 20% interest in Umm Al Nar, a largepower and water desalination plant. The acquisition isbacked by a 23-year Power and Water PurchaseAgreement (PWPA) with the Abu Dhabi Water andElectricity Company. In July, a US$1.77 billion non-recourse funding package was secured to fund theacquisition and the associated plant expansion project.Since acquisition, the plant has delivered robust financialand operational performance.
In December, together with our partner Saudi Oger, we signed an agreement with Saudi Aramco to develop,own and operate four cogeneration plants in SaudiArabia. These facilities will have a total capacity of 1,074 MW and be capable of producing 4.5 millionlbs/hr of steam. They are expected to commenceoperation on a phased basis between March andDecember 2006. On completion the plants will supplypower and steam to Saudi Aramco under 20-year EnergyConversion Agreements. International Power owns 60%of the project company, with Saudi Oger holding theremaining 40%.
In February 2004, the financing for the Saudi Aramcocogeneration projects was completed. The financingcomprises a non-recourse US$510 million facility that has a 17-year term. International Power’s total equitycommitment to the projects amounts to US$78 million.
The construction of the Shuweihat S1 power and waterplant in Abu Dhabi is progressing and the plant isexpected to commence operation in Q4 2004. The firsttwo of five gas turbines and the first of six multi-stageflash desalination units have been successfullycommissioned.
Fuel / Type Gross Net Gross Netcapacity capacity(1) capacity capacity(1)
power power heat (MWth) heat (MWth)MW MW desal (MIGD) desal (MIGD)
steam steam(million lbs/hr) (million lbs/hr)
Assets in operationAl Kamil, Oman Gas (OCGT) 285 285 – –
Arabian Power Company (Umm Al Nar), UAE Gas (CCGT)/desalination 870 174 162 MIGD 32 MIGD
Middle East total in operation 1,155 459 162 MIGD 32 MIGD
Assets under constructionArabian Power Company
(Umm Al Nar expansion), UAE Gas (CCGT)/desalination 1,550 310 25 MIGD 5 MIGD Shuweihat S1, UAE Gas (CCGT)/desalination 1,500 300 100 MIGD 20 MIGDSaudi Aramco Cogen Projects, Saudia Arabia Gas (Cogen) 1,074 644 4.5m lbs/hr 2.7m lbs/hr
Middle East total under construction 4,124 1,254
(1) Net capacity is the Group share of gross capacity.

annual report 2003 11
AustraliaYear ended Year ended
31 December 31 December2003 2002
£m £m
Turnover 224 226
PBIT (pre-exceptional items) 101 101Exceptional items – –PBIT 101 101
Reflecting the strength of our contracted position inAustralia, turnover at £224 million (2002: £226 million),and operating profit at £101 million (2002: £101 million)were both flat when compared to 2002, despite relativelylower market prices in 2003. We continue to retain astrong forward contracted position through 2004.
Work is underway to further develop the open cast coal mine at Hazelwood. This project will extend the lifeof the mine and will provide coal reserves to supportgeneration at Hazelwood until the end of 2009. TheHazelwood turbine upgrade programme is progressingwell and is expected to increase the plant’s peak capacityfrom 1,610 MW to 1,740 MW by 2007.
Construction of the 687km SEA Gas pipeline wascompleted on 1 January 2004 on schedule and onbudget. The pipeline will be used to transport gas fromthe Minerva gas field in Victoria by Q4 2004.
We are pleased to report that we have secured our first wind power project at Canunda in South Australia.Construction of this 46 MW plant is expected to start in Q2 of this year, with a view to commencingcommercial operation in Q2 2005. Power from this plantwill be sold under a 10-year long-term contract to AGL,Australia’s largest energy retailer. With the addition ofCanunda, our Australian portfolio is now well balancedwith good fuel diversity, ranging from fossil fired (browncoal and efficient gas-fired) through to wind power.
Fuel / Type Gross Netcapacity capacity(1)
power powerMW MW
Assets in operationHazelwood, Victoria Coal 1,610 1,480
Synergen, South Australia Various (OCGT) 360 360
Pelican Point, South Australia Gas (CCGT) 485 485
SEA Gas pipeline, South Australia(2) n/a n/a
Australia total in operation 2,455 2,325
(1) Net capacity is the Group share of gross capacity.(2) 687km gas pipeline from Victoria to South Australia.
With interests in over 30 power stations around the world, we own oneof the most geographically diverse asset portfolios, generating enoughpower to light up 20 million homes.
Above: Wind farm, Australia

12 International Power
Rest of the WorldYear ended Year ended
31 December 31 December2003 2002
£m £m
Turnover 128 148
PBIT (pre-exceptional items) 84 108Exceptional items 55 42PBIT 139 150
Our plants in the Rest of the World have delivered steady performance over the past year, with turnover of £128 million (2002: £148 million) and profit beforeinterest and tax at £84 million (2002: £108 million).
Both of our investments in Pakistan (HUBCO andKAPCO) continue to perform well. We have sold a 5% shareholding in HUBCO in line with our policy ofselectively monetising investments at the appropriate timegenerating cash of £21 million. Our equity interest inHUBCO now totals 20.7%. We have booked an exceptional
gains of £52 million, reflecting the profit on this sale andthe reversal of a previous impairment provision.
Malakoff made two acquisitions in Malaysia in 2003. Itacquired 100% of Prai Power, a 350 MW CCGT plantand 90% of the equity interest in Tanjung Bin, a 2,100 MWcoal-fired plant. Both acquisitions are backed by long-termPPAs with Tenaga Nasional Berhad, Malaysia’s leadingutility.
Our 110 MW plant in Thailand sells the majority of its power under a long-term contract to the ElectricityGenerating Authority of Thailand with the remainder of its output being sold to local industrial customers. In2003, the plant benefited from increased retail sales to itsindustrial customers due to the acceleration of economicgrowth in Thailand, which looks set to continue.
In 2003 we concluded our divestments in China, realising an exceptional gain of £3 million.
Fuel / Type Gross Net Gross Netcapacity capacity(1) capacity capacity(1)
power power heat (MWth) heat (MWth)MW MW
Assets in operationMalakoff, Malaysia(2) Gas (OC/CCGT) 1,895 355 – –
Thai National Power(Pluak Daeng), Thailand Gas (Cogen) 110 110 20 20
HUBCO, Pakistan Oil 1,290 270 – –
KAPCO, Pakistan Gas/Oil (CCGT) 1,600 575 – –
Rest of the World total in operation 4,895 1,310 20 20
Assets under constructionMalakoff, Malaysia(2) Coal 1,890 355
Rest of the World under construction 1,890 355
(1) Net capacity is the Group share of gross capacity.(2) Gross capacity amount shown for Malakoff represents the actual net interest owned directly or indirectly by Malakoff.
Above: Lumut power plant, Malakoff, Malaysia

annual report 2003 13
OutlookOur clear immediate priority is the successfulrestructuring of the US business and we are focused onfinding a solution that provides value for our shareholders.Alongside our drive to deliver value from our existingasset base, we continue to review a range of growthopportunities in our core markets.
Our earnings per share guidance for 2004 remains 7p to 9p.
CorporateCorporate costs
The Group operates from corporate offices in Londonand Swindon, where corporate and business functions arebased to support our worldwide operations. Continuedcost control resulted in the cost of providing these servicesbeing reduced to £28 million (2002: £29 million).
In addition, the Group operates regional business supportoffices in the US, Australia, the Czech Republic, Italy,Japan and the UAE.
These offices vary in size dependent on the scale ofoperations in the region, and apart from the US andAustralia, are primarily focused on business development.
Exceptional items
During the year, the Group recorded two operatingexceptional items:
• impairment of US plant by £404 million;
• reversal of past impairment of our HUBCO investment by £35 million.
The carrying values of our US plant were reviewedfollowing the sharp decline in both current and forwardelectricity prices in the ERCOT and NEPOOL markets in the US. This resulted in impairment of our USmerchant plants (Hays, Midlothian, Blackstone, Bellingham and Milford).
The revised US book values were determined by applyinga risk adjusted discount rate of 9.7% to the post-tax cashflows expected from the plants over their remaininguseful lives.
Additionally during the year, the Group recorded thefollowing three non-operating exceptional items:
• profit on disposal of a 5% holding in HUBCO of £17 million;
• profit on disposal of a Czech fixed asset investment of £7 million;
• proceeds and a gain relating to China exit of £3 million.
Net interest
Net interest payable for the year ended 31 December2003 was £111 million (excluding exceptional items).Corporate and subsidiary operations accounted forinterest payable of £79 million comprising gross interestof £123 million on bonds, bank loans and overdraftsoffset by £23 million interest receivable, foreign exchangegains of £19 million and by capitalised interest of £2 million. Associates and joint ventures incurred netinterest payable of £32 million. Consolidated interestcover was 2.6 times (excluding exceptional items).
Additionally during 2003, the Group recorded an exceptionalinterest charge of £16 million in relation to the write-offof unamortised facility costs in the US and the UK.
Tax
The tax charge for the year (pre-exceptional items)amounted to £54 million compared to £77 million in theprevious year. The tax charge represents an effective taxrate of 31%, compared to 30% in the prior period.
Additionally during 2003, the Group recorded anexceptional tax credit of £26 million relating to a netwrite back of deferred tax following the impairment ofthe US plant.
We are actively seeking viablerenewable energy opportunities for future development.
Above: Pego, Tejo Energia Portugal

14 International Power
Financial position and resources
Liquidity A summarised, reclassified presentation of the Group cash flow is set out below:
Year ended Year ended31 December 31 December
2003 2002
£m £m
Operating (loss)/profit (279) 105
Impairment of plant 404 103
125 208
Depreciation and amortisation 109 112
Dividends from joint ventures and associates 68 84
Dividends received from fixed asset investments – ordinary 33 31
Movement in working capital and provisions (50) (44)
Operating cash flow 285 391
Capital expenditure – maintenance (64) (48)
Tax and interest paid (96) (108)
Exceptional items:
Dividends received from fixed asset investments – 42
Refinancing charges (4) (25)
Free cash flow 121 252
Capital expenditure – growth (57) (98)
Capital expenditure – other financial investment (9) –
Compensation for long-term performance shortfalls 56 –
Acquisitions and disposals (2003 - exceptional) 35 (144)
Share buyback (13) –
Foreign exchange, hedging and other (13) 75
Decrease in net debt 120 85
Opening net debt (812) (897)
Closing net debt (692) (812)
Operating cash flow for the year ended 31 December 2003 decreased by 27% to £285 million as compared to £391 million for the year ended 31 December 2002. The principal reasons include lower operating profit performancefrom the US and the UK and a reduction in dividend receipts from joint ventures and associates. Capital expenditure tomaintain the operating capacity of our power stations has increased compared with the previous year, reflecting thecompletion of our new build capacity in Massachusetts and Texas in 2002. Capital expenditure to increase our operatingcapacity amounted to £57 million as compared to £98 million in the previous year, reflecting spend on the build of ourUS and Al Kamil plants. During the year ended 31 December 2003, the Group received £56 million from contractors inrelation to compensation for plants not achieving the long-term performance levels specified in the original contracts.
Net interest of £79 million (2002: £88 million) was paid in the year reflecting a small reduction in average debt levelsover the course of the year, together with a slightly lower average cost of debt. Additionally, debt issue costs totalling £3 million are also included within the interest line. Net tax payments in the year were £14 million (2002: £20 million).Acquisitions and disposals principally comprise of cash receipts from the sale of a 5% holding in HUBCO and from thesale of our investment in VCE (Czech Republic).

annual report 2003 15
Year ended Year ended31 December 31 December
2003 2002
£m £m
Fixed assets
Intangibles and tangibles 2,049 2,474
Investments 538 507
Total fixed assets 2,587 2,981
Net current liabilities (excluding short-term debt) (90) (138)
Provisions and creditors due after more than one year (243) (262)
Net debt (692) (812)
Net assets 1,562 1,769
Gearing 44% 46%
Debt capitalisation 31% 31%
2003 2002
£m £m
Cash and liquid resources 743 842
Euro dollar bonds – (37)
Convertible bond (200) (231)
Loans (non-recourse) (1,235) (1,386)
(692) (812)
Balance sheet A summarised, re-classified presentation of the Group balance sheet is set out below:
Net assets at 31 December 2003 decreased by £207 million to £1,562 million, as compared with £1,769 million at theend of the previous year. The significant impacts on net assets in the year were a reduction in fixed assets of £404 millionfollowing the US impairment, an increase of £35 million in investments following the reversal of the HUBCO impairmentand a reduction in tax creditors of £27 million following a net deferred tax write back following the US impairment.
Net debt at 31 December 2003 of £692 million is down from £812 million at 31 December 2002. This reflects thestrong operating cash flow of the business and the positive impact of translation of net debt balances denominated inforeign currencies, offset by the write-off of unamortised facility fees in the US. Net debt at 31 December 2003 isshown net of facility fees of £15 million, which have been capitalised and offset against the debt in accordance withaccounting standard FRS 4.
In addition, net assets were also impacted by a net gain of £15 million arising on the retranslation of our net investmentin foreign entities offset by a reduction of £13 million as a result of the share buyback programme.
The above net debt of £692 million excludes the Group’s share of joint ventures’ and associates’ net debt of £712 million(2002: £503 million). These obligations are generally secured by the assets of the respective joint venture or associateborrower and are not guaranteed by International Power plc or any other Group company. In view of the significance ofthis amount, it has been disclosed separately.
Net debt and capital structure Group net debt at 31 December comprised:

16 International Power
The Group has sufficient credit facilities in place to fund and support adequately its existing operations andto finance the purchase of new assets. These facilitiescomprise a revolving credit facility for US$450 million(expiry October 2006), the portion of the existingconvertible bond for US$103 million not ‘put’ by bond holders (maturing November 2005), and a newconvertible bond for US$252 million (maturing August2023 but with bondholders having the right to ‘put’ thebond back to the Group in August 2010, 2013, 2018and 2023). In addition, the Group has uncommittedbilateral credit lines from various banks at its disposal at the corporate level.
Secured non-recourse financeThe Group’s financial strategy is to finance its assets by means of limited or non-recourse project financings at the asset or intermediate holding company level,wherever that is practical. As part of this strategy, werefinanced EOP in the Czech Republic, increasing thefacility to Czk 3,000 million and extending the maturity to 2007.
The non-recourse debt at Rugeley of £160 million, whichwas in technical default at the beginning of the year, wassuccessfully renegotiated in August 2003 and the debtmaturity reinstated to 2008 for a reduced amount of£90 million. In May 2003 at American National Power(ANP), our US bank group waived all claimed technicaldefaults on our US non-recourse financing and thereforethis debt was redesignated to its original maturity at 30 June 2003. However, in the fourth quarter our USbanks claimed further technical defaults on this financing.
Therefore as these issues were not formally resolved at31 December 2003, the debt at ANP has been reportedas current non-recourse debt in our accounts.
In line with all non-recourse finance, any support to theANP facility would be entirely discretionary, and wouldnot have a material impact on the Group’s liquidity orinvestment capability.
During 2003 both Standard & Poors and Moody’sreviewed the credit rating of our wholly owned subsidiary ANP and this resulted in a downgrade tobelow investment grade. This in itself is not an act ofdefault on the ANP facility, although it does increase the interest margin of the outstanding debt.
Corporate and Group debtApart from the ANP facility, which is reclassified as current, there are no major debt maturities atCorporate or Group level in 2004. Significant new capitalexpenditure on growth projects will be financed fromexisting cash resources, drawing down on bank lines orissuing new fixed rate debt, depending on marketconditions at the time.
On 31 December 2003, we had aggregated debtfinancing of £1,435 million denominated principally in US dollars, Australian dollars, sterling, Czech koruna andThai baht. Of this amount £531 million is due forrepayment in 2004, with the majority of the remainingbalance due after 2008. This short-term debt includesthe ANP facility already discussed in this section.
Left: Blackstone, US

annual report 2003 17
Treasury and counterparty risk policyTreasury policy seeks to ensure that adequate financialresources are available for the development of theGroup’s business whilst managing its currency, interestrate and counterparty credit risks. The Group’s treasurypolicy is not to engage in speculative transactions. Grouptreasury acts within clearly defined guidelines that areapproved by the Board. The major areas of treasuryactivity are set out below.
Currency translation exposure In common with other international companies, theresults of the Group’s foreign operations are translatedinto sterling at the average exchange rates for the periodconcerned. The balance sheets of foreign operations aretranslated into sterling at the closing exchange rates. Thistranslation has no impact on the cash flow of the Group.In order to hedge the net assets of foreign operations,borrowings are generally in the same currency as theunderlying investment. The Group aims to hedge areasonable proportion of its non-sterling assets in this way.
It is our policy not to hedge currency translation throughforeign exchange contracts or currency swaps.
Average and year end sterling rates for major currencieswhich are significant to the Group were:
At 31Average December
2003 2002 2003 2002
US dollar 1.64 1.50 1.79 1.61
Australian dollar 2.53 2.78 2.38 2.86
Czech koruna 46.20 49.16 45.97 48.42
Currency transaction exposure This arises where a business unit makes actual sales andpurchases in a currency other than its functional currency.Transaction exposure also arises on the remittance fromoverseas of dividends or surplus funds. The Group’s policyis to match transaction exposure where possible, andhedge remaining transactions as soon as they arecommitted, by using foreign currency contracts andsimilar instruments.
Short-term depositsSurplus funds are placed for short periods in investmentsthat carry low credit risk and are readily realisable inmajor currencies.
Interest rate riskThe Group’s policy is to fix interest rates for a significantportion of the debt (82% as at 31 December 2003)using forward rate or interest rate swap agreements.Significant interest rate management programmes andinstruments require specific approval of the Board. Theweighted average interest of the fixed rate debt was 7%.Where project finance is utilised, our policy is to align thematurity of the debt with the contractual terms of thecustomer off-take agreement.
Counterparty credit riskThe Group’s policy is to manage its credit exposure totrading and financial counterparties within clearly defined limits. Energy trading activities are strictly monitored andcontrolled through delegated authorities and procedures,which include specific criteria for the management ofcounterparty credit exposures in each of our key regions.Counterparty exposure via customer off-take agreementsis monitored and managed by the local asset team withassistance from Group treasury where appropriate. Inaddition, Group treasury manages the Group-widecounterparty credit exposure on a consolidated basis,with the active and close involvement of the Global RiskManager. Financial counterparty credit exposure is limited to relationship banks and commercial paper with companieswhich have strong investment grade credit ratings.
Our focus on fiscal discipline togetherwith our solid financial position is a key strength.

18 International Power
Critical accounting policies and estimatesWe prepare our consolidated financial statements inaccordance with accounting principles generally acceptedin the UK. As such, we are required to make certainestimates, judgements and assumptions that we believeare reasonable based upon the information available.These estimates and assumptions affect the reportedamounts of assets and liabilities at the date of thefinancial statements; the reported amounts of revenuesand expenses during the periods presented and therelated disclosure of contingent assets and liabilities.
On an ongoing basis, we evaluate our estimates usinghistorical experience, consultation with experts and othermethods considered reasonable in the particularcircumstances to ensure full compliance with UK GAAPand best practice. Actual results may differ significantlyfrom our estimates, the effect of which is recognised inthe period in which the facts that give rise to the revisionbecome known.
Our Group accounting policies are detailed on pages 67 and 68. The table below identifies the areas wheresignificant judgements are required, normally due to the uncertainties involved in the application of certainaccounting policies.
Of the accounting policies identified in the table adiscussion follows on the policies we believe to be themost critical in considering the impact of estimates andjudgements on the Group’s financial position and resultsof operations.
Fixed asset valuation
Tangible fixed assets
The original cost of greenfield-developed assets includesrelevant borrowing and development costs:
• Interest on borrowings relating to major capital projectswith long periods of development is capitalised duringconstruction and written-off as part of the total costover the useful life of the asset.
• Project development costs (including appropriate direct internal costs) are capitalised from the point that it is virtually certain that the project will proceed to completion.
Accounting policy
Fixed asset valuation
Consolidation policy – trade investments,
associates, joint ventures and subsidiaries
Liquidated damages
Exceptional items
Tax provisions
Judgements/uncertainties affecting application
Determination of trigger events indicating impairment and measurement of fair value using projected cash flows,together with risk adjusted discount rates, or other moreappropriate methods of valuation.
Determination of the extent of influence the Group hasover the operations and strategic direction of entities inwhich it holds an equity stake.
Determination of the appropriate accounting treatment of receipts from contractors.
Determination of the transactions or events which requireseparate disclosure as exceptional items.
Determination of appropriate provisions for taxation, taking into account anticipated decisions of tax authorities.
Assessment of the ability to utilise tax benefits throughfuture earnings.

annual report 2003 19
Depreciation of plants is charged so as to write down theassets to their residual value over their estimated useful lives.
• Gas turbines and related equipment are depreciatedover 30 years to a 10% residual value, unless thecircumstances of the project or life of specificcomponents indicate a shorter period or a lowerresidual value.
• Coal plant is considered on an individual basis.
Tangible fixed assets and fixed asset investments
Management regularly considers whether there are anyindications of impairment to carry values of fixed assetsor investments (e.g. the impact of current adverse marketconditions). Impairment reviews are generally based onrisk adjusted discounted cash flow projections thatinevitably require estimates of discount rates and futuremarket prices over the remaining lives of the assets.
Consolidation policy – significant influence
The determination of the level of influence the Group has over a business is often a mix of contractually defined and subjective factors that can be critical to the appropriate accounting treatment of entities in the consolidated accounts.
We achieve influence through Board representation andby obtaining rights of veto over significant actions. Wegenerally treat investments where the Group holds lessthan 20% of the equity as trade investments. Tradeinvestments are carried in the balance sheet at cost lessamounts written off. Income is recorded as earned onlyon the receipt of dividends from the investment.
Above: Deeside, UK
The continuing global trends of deregulationand privatisation offer us multiple opportunitiesto grow.
Above: Hazelwood, Australia

20 International Power
Where the Group owns between 20% and 50% of the equity and has significant influence over the entity’soperating and financial policies, we generally treat theentity as an associated undertaking or joint venture.Equally, where the Group holds a substantial interest (butless than 20%) in an entity and is able to exert significantinfluence over its operations, we treat it as an associatedundertaking or joint venture. Conversely, although wegenerally treat a holding of more than 20% of the equityas an associated undertaking or joint venture, where theGroup is unable to exert significant influence over theoperations of the entity, we treat it as a trade investment.
Associated undertakings and joint ventures are accountedfor using the equity method of accounting, which involvesincluding the Group’s share of operating profit, interestand tax on the respective lines of the profit and lossaccount, and the Group’s share of net assets within the fixed asset investments caption in the balance sheet.In addition, we provide voluntary disclosure of theamount of net debt held by these entities, although in accordance with UK GAAP, this net debt is notincluded in the consolidated balance sheet.
The Group generally consolidates entities in which itholds in excess of 50% of the equity and where it exertscontrol over the strategic direction of the entity. However,if the Group were to hold in excess of 50% of the equitybut was unable to exert dominant influence over thestrategic direction or operations of the entity, we wouldaccount for the entity as an associated undertaking orjoint venture.
Liquidated damages
The Group receives amounts from contractors in respect of the late commissioning and underperformance of new power plants. The receipts thatrelate to compensation for lost revenue are treated asrevenue when the compensation is due and payable bythe contractor. Those receipts that relate to compensationfor plants not achieving long-term performance levelsspecified in the original contracts are recorded as areduction in the cost of the assets.
We continue to be very active inreviewing growth opportunities, both inour existing merchant markets and inmarkets that provide long-term contracts.
Below: Al Kamil, Oman

annual report 2003 21
Exceptional items An item is considered exceptional if it derives fromordinary activities and is considered of such significancethat separate disclosure is needed if the financialstatements are to give a true and fair view. All exceptionalitems, other than those listed below are included underthe statutory line-item to which they relate. In addition,separate disclosure on the face of the profit and lossaccount is required for the following items:
• profits or losses on the sale or termination of an operation;
• costs of a fundamental re-organisation or restructuringhaving a material effect on the nature and focus of theCompany’s operations;
• profits or losses on the disposal of fixed assets.
Determining which transactions are to be consideredexceptional in nature is often a subjective matter.
Preparing for the conversion to InternationalFinancial Reporting Standards (IFRS)For reporting periods beginning on or after 1 January2005, the consolidated accounts of the Group mustcomply with IFRS.
The Group has developed a conversion plan to assess the potential impact of IFRS and to determine a clearpath forward that is cost effective, minimises disruption to the business and ensures ongoing communication ofthe impact of IFRS on our performance targets. We havereviewed and assessed the impact of accounting literatureexpected to be effective on the date of transition to IFRSand will continue to monitor and assess the impact ofany further pronouncements issued by the InternationalAccounting Standards Board (IASB).
The principal areas expected to be impacted by thetransition to IFRS are as follows:
• presentation of primary financial statements;
• recognition of derivatives and financial instruments;
• accounting for goodwill on acquisitions;
• accounting for employee benefits (pensions and share-based payments);
• accounting for joint ventures, associates and trade investments.
Above: HUBCO, Pakistan

22 International Power
Board of Directors
Executive Directors
PHILIP COX (52)CHIEF EXECUTIVE OFFICER
Philip joined the Company on 1 May 2000 from Invensysplc and became Chief Financial Officer in October 2000.Philip was appointed Chief Executive Officer of InternationalPower in December 2003. He has responsibility for theoverall management of the business and the delivery of itsstrategy. He is a Non-Executive Director of Wincanton plc.
MARK WILLIAMSON (46)CHIEF FINANCIAL OFFICER
Mark joined the Company in September 2000 from theSimon Group plc, and became Group Financial Controllerresponsible for the Company’s financial reporting. Markwas appointed Chief Financial Officer of InternationalPower in December 2003. His responsibilities includefinancial control and reporting, tax and risk management.
STEPHEN (STEVE) RILEY (42)EXECUTIVE DIRECTOR, EUROPE
Steve joined the business in 1985, holding seniorpositions in two UK power stations. He was appointedInternational Power’s Managing Director, Australia inJanuary 2000. In August 2003 he took up his currentposition as head of the European region.
Steve was appointed to the Board in January 2004.
ANTHONY (TONY) CONCANNON (40)EXECUTIVE DIRECTOR, AUSTRALIA
Tony joined the business in 1982. In October 2000 Tonybecame International Power’s Country Manager for theUnited Kingdom. He took up his current role leading theAustralian business in August 2003.
Tony was appointed to the Board in January 2004.
Non-Executive Directors
ADRI BAAN (60)NON-EXECUTIVE DIRECTOR
Adri became a Non-Executive Director of the Company in June 2002. He was previously CEO of Philips ConsumerElectronics, Member of the Board of Management. He is currently on the Boards of ASMI, KVWS, ICI PLC andWolters Kluwver.
ANTHONY (TONY) ISAAC (62)NON-EXECUTIVE DIRECTOR
Tony become a Non-Executive Director of the Companyin October 2000 and is the Senior Independent Director.He is the Chief Executive of The BOC Group plc and is aNon-Executive Director of Schlumberger Limited.
JOHN (JACK) TAYLOR (65)NON-EXECUTIVE DIRECTOR
Jack has 37 years’ experience in project finance, privateequity and international banking. Having served as theAsian Development Bank’s Director-Infrastructure, Energy,and Financial Sectors Department West and PrivateSector Group, following a 30-year career as a seniorexecutive with The Chase, Jack is today active in privateequity in the UK, Europe and Asia.
SIR NEVILLE SIMMS (59)CHAIRMAN
Sir Neville became a Non-Executive Director of National Power in August 1998 and was appointed Chairman ofInternational Power in October 2000. He is currently Chairman of Carillion plc, and a member of the President’sCommittee of the CBI.

TOP: MARK WILLIAMSON
MIDDLE: STEVE RILEY
BOTTOM: TONY CONCANNON
TOP: ADRI BAAN
MIDDLE: TONY ISAAC
BOTTOM: JACK TAYLOR
TOP: SIR NEVILLE SIMMS
BOTTOM: PHILIP COX
DETAILS OF BOARD COMMITTEES AND THEIR MEMBERSHIP ARE SET OUT ON PAGES 29-30.
annual report 2003 23

1
2
3
4
5
8
9
10
6
7
24 International Power
Senior management team
1 PETER BARLOW
2 PENNY CHALMERS
3 GARETH GRIFFITHS
4 VINCE HARRIS
5 SEAN NEELY
6 IAN NUTT
7 KEN OAKLEY
8 STEPHEN RAMSAY
9 RANALD SPIERS
10 KEN TEASDALE

annual report 2003 25
PETER BARLOWPeter is the head of Corporate Finance for InternationalPower and is responsible for funding and bank relationships.Peter joined us in 1998 and has been especially involvedin Corporate Finance, Project Finance and Treasuryactivities since that time.
PENNY CHALMERSPenny heads up our corporate services. She is responsiblefor Group human resources, including staffing andsupport of development, information technology and corporate communications. Penny has 16 years’experience in the energy sector and has been with us since 1997.
GARETH GRIFFITHSGareth manages Global trading, with responsibility for our trading operations in the UK, US and Australia. He has 11 years’ experience in the industry and waspreviously Vice President, Marketing and Trading for our US business.
VINCE HARRIS Vince is the new head of Rest of the World and CEO ofthe Hub Power Company in Pakistan. He was responsiblefor managing the disposal of our Chinese assets. He is achartered engineer and has 34 years’ experience in thepower generation industry.
SEAN NEELYSean manages the Mergers and Acquisitions Group. He has 10 years’ experience in the industry. As well asacquisitions, he has previous experience in strategicplanning and project finance.
IAN NUTTIan runs American National Power (ANP). In his last rolehe was our head of Global Operations and, in addition,played a critical role in asset management. He has 28years’ experience in development, operation andmaintenance of power plants.
KEN OAKLEYKen manages our Corporate Tax function. He joined us in October 2000 and is a chartered accountant andchartered tax advisor.
STEPHEN RAMSAYStephen is our Company Secretary and General Counsel.He joined the Company in 1996, after 10 years as asolicitor in private practice, first working at National WindPower and then in the international legal group beforebecoming Company Secretary in October 2000.
RANALD SPIERSRanald is head of our Middle East region. He has beenwith us for 11 years, having previously worked for BP Group for 12 years across a wide spectrum of industries,including petrochemicals, detergents, oil refining,downstream gas, advanced materials and aerospace.
KEN TEASDALEKen heads up Operations and Engineering. He is achartered electrical engineer and a chartered mechanicalengineer. He has over 30 years’ experience in the industryand was previously CEO of Hazelwood Power Company,a 1,610 MW power station in Victoria, Australia.


Corporate governance
WE ARE COMMITTED TO HIGH STANDARDS OF CORPORATE GOVERNANCE AND,ALONGSIDE REPORTING ON OUR GOVERNANCE PRACTICE IN TERMS OF THEREQUIREMENTS IN FORCE AT THE BEGINNING OF 2003, WE ALSO SET OUTHOW WE COMPLY WITH THE PRINCIPLES IN THE NEW CODE, AND HOW ANYSIGNIFICANT EXCEPTIONS WILL BE ADDRESSED.
annual report 2003 27
In July 2003, the Financial Reporting Council issued the revised Combined Code on Corporate Governance,which applies to reporting years beginning on or after 1 November 2003. We are committed to high standardsof corporate governance and, in addition to reporting onour governance practice in terms of the requirements for2003, we also explain how we comply with the new code.
The BoardThe full Board met nine times during 2003. Tony Isaacwas unable to attend two of these meetings. All otherDirectors were in attendance on the relevant meetingdates. Meetings of the Chairman and the Non-ExecutiveDirectors are also held without the Executive Directorsbeing present. During 2003, two such meetings took place. The Non-Executive Directors intend to meet once a yearwithout the Chairman present. This meeting will bechaired by Tony Isaac, the Senior Independent Non-Executive Director, and will include a review of theChairman’s performance.
From January to 30 November 2003, the Boardcomprised the Chairman (Sir Neville Simms); a Non-Executive Deputy Chairman (Peter Giller); twoExecutive Directors (David Crane and Philip Cox) andthree Non-Executive Directors (Tony Isaac, Jack Taylorand Adri Baan). Tony Isaac is the Senior IndependentNon-Executive Director. The three Non-ExecutiveDirectors are considered to be independent. Peter Gillerwas not considered to be independent because of hisformer role as Chief Executive Officer of the Company.
On 30 November 2003, David Crane resigned as aDirector. On 11 December 2003 Philip Cox succeededhim as Chief Executive Officer. Also on 11 December
2003 Mark Williamson was appointed as Chief FinancialOfficer and an Executive Director. Peter Giller resigned asDeputy Chairman and as a Director on 31 December 2003.On 1 January 2004, Steve Riley and Tony Concannonwere appointed as Executive Directors. The Boardbelieves that it now has the skills and experiencenecessary to provide effective leadership and control of the Company.
For the majority of 2003 the effectiveness of the Boardwas underpinned by a balance between Executive andNon-Executive Directors. Whilst there is at present onemore Executive Director than independent Non-ExecutiveDirectors, the Chairman of the Company retains thecasting vote. The Board is currently seeking to recruit anew Non-Executive Director. The Board has also indicatedthat it intends to appoint an additional Executive Directorto head our US business in due course.
In accordance with the Combined Code and theCompany’s Articles of Association, all Directors submitthemselves for re-election every three years and newly appointed Directors are subject to election byshareholders at the first Annual General Meeting (AGM)after their appointment. Arrangements are in place to ensure that newly appointed Directors receive acomprehensive briefing on the Company, and training is provided for Directors on their roles and their legalobligations to ensure that they are fully conversant withtheir responsibilities as Directors. In accordance with thispolicy Tony Concannon, Steve Riley and Mark Williamsonhave already attended a course arranged through theInstitute of Directors.
A programme of continuous training is provided for theDirectors. Directors are also kept informed of changes to the regulatory regime such as the revised CombinedCode, new institutional investor guidelines and the USSarbanes-Oxley Act. All of the Directors have access tothe advice and services of the Company Secretary andalso to external independent advice should they so wish.Periodically the Board meets at the site of one of theGroup’s assets and briefings are also given at Boardmeetings on particular parts of the business, includingregional and functional reviews.
Below and left: EOP, Czech Republic

28 International Power
Operation of the BoardThe Board has responsibility for defining strategy,ensuring the successful implementation of approvedprojects/proposals and for the financial policies of theGroup. It maintains a schedule of all matters requiringspecific Board approval. Throughout 2003, this includedall strategy decisions and significant capital investmentproposals. The Board receives information on capitalexpenditure projects and investment proposals in advanceof Board meetings, as well as management reports onthe operational and financial performance of the business.Financial performance is monitored on a monthly basisand the overall performance of the Group is reviewedagainst approved budgets. At least once a year, the CEOpresents a corporate strategy plan to the Board forreview and approval. Each investment decision is made in the context of this plan.
The Board has established business values and standardsfor the Company, which provide a framework for theCompany to balance the interests of all its stakeholders in the conduct of its business. The business values (FIRST)are set out at the front of this Annual Report. TheCompany’s Code of Business Conduct has been formallyadopted by the Board and is set out on the Company’swebsite. This code includes a whistle blowing procedureand is in the process of being disseminated throughoutthe Group.
A questionnaire on Board performance is completed byeach Director and discussed with the Chairman and theCompany Secretary. The results of this questionnaire arediscussed with the Board as a whole. Overall theseevaluations confirmed that the Directors considered
that the Board and its Committees worked effectively.The contribution by individual Directors to Board andCommittee meetings was considered to be high. Thereview did highlight the imbalance of the Board and,following the departure of David Crane, it was decidedto widen and strengthen the Executive Director team ofthe Company.
Chairman and Chief Executive OfficerThere is a clear division of responsibilities at the head of the Company between the roles of the Chairman andthe CEO. The Chairman is responsible for the leadershipand effective operation of the Board, in terms of itsagenda, decision making and the utilisation of the skillsand experience of the Directors. He monitors, with theassistance of the Company Secretary, the informationprovided to the Board to ensure that it is sufficient,pertinent, timely and clear. The Chairman is alsoresponsible for ensuring that there is effective engagementand communication with shareholders. The CEO isresponsible for the running of the Company, and leadingthe executive and operational teams in implementing the strategies approved by the Board.
In addition to his role as Chairman of the Company, Sir Neville Simms is also Chairman of Carillion plc. TheBoard believes this does not compromise his role asChairman of the Company.
Philip Cox is also a Non-Executive Director of Wincantonplc. His remuneration from this role is retained by him.His remuneration for the year ended 31 March 2003was £28,000.
Above: Marmara, Turkey
Above: Coal delivery facility, Pego, Portugal

annual report 2003 29
Non-Executive Directors and their functionThrough membership of the Board Committees, theNon-Executive Directors have responsibilities for: ensuringthat systems of internal control and risk management areappropriate and effective; evaluating the performance ofmanagement in meeting targets and objectives; settingthe remuneration of Executive Directors; the appointmentof Executive Directors; and senior managementsuccession planning.
Board CommitteesThe Company has established the following committees:the Audit Committee, the Remuneration Committee andthe Appointments Committee. No person other than theCommittee members is entitled to attend the meetingsof these Committees, except at the invitation of theCommittee. The full terms of reference for eachCommittee are available on the Company’s website:www.ipplc.com.
Audit Committee
The Committee is responsible for selecting and fixing theremuneration of the external auditors and reviewing theeffectiveness of the external audit process. The Committeealso ensures policies and procedures are in place toensure that the external auditors remain independent. In addition to reviewing the Group’s accounts, resultsannouncements, risk management and accountingpolicies, the Committee monitors the effectiveness ofinternal control systems for the Board. The Committeemonitors the work of the internal audit function and itsprogress against the Group’s annual internal audit plan,and also reviews reports from the external auditors.
The Audit Committee is comprised of all theindependent Non-Executive Directors of the Companyand the Chairman. Whilst the revised Combined Codestates that the Audit Committee should be comprised ofindependent Non-Executive Directors only, the Boardbelieves that due to the importance of the role of the
Audit Committee, particularly in reviewing the role of the external auditors and internal control systems, it isappropriate for the Chairman to be a member of thisCommittee. The Audit Committee Chairman is TonyIsaac, who is a Fellow of the Chartered Institute ofManagement Accountants and, before becoming ChiefExecutive of The BOC Group plc, was its Group FinanceDirector. The Company Secretary acts as secretary to theCommittee. During 2003 the Audit Committee met onfour occasions. Tony Isaac and Jack Taylor attended eachof these meetings, whilst Adri Baan and Sir Neville Simms attended three meetings each.
Time is set aside for the Committee to meet the externalauditors without executive management present andthese sessions have been extended to include the head of the Group’s internal audit function. In addition to themembers of the Committee, regular attendees at theAudit Committee meetings included representatives ofthe external auditors, the Chief Executive Officer, theChief Financial Officer, the Group Financial Controller and the head of Internal Audit.
Remuneration Committee
The Remuneration Committee is responsible for monitoringthe performance of the Executive Directors of the Companyagainst targets, and making recommendations to theBoard on remuneration.
The Committee is comprised of all of the independentNon-Executive Directors of the Company and theChairman. The Chairman of the Committee is Adri Baan.The Human Resources Manager of International Poweracts as secretary to the Committee. Whilst the revisedCombined Code states that the RemunerationCommittee should be comprised of independent non-executive directors only, the Board believes that given theimportance of executive remuneration to the Companyand the Chairman’s role in maintaining contact with itsprincipal shareholders on Directors’ remuneration, it isappropriate that the Chairman of the Company be a
Our business values – FIRST – set out the ethical mannerin which we operate throughout the world.

30 International Power
member of the Committee. During 2003 the RemunerationCommittee met on four occasions. Sir Neville Simms,Adri Baan and Jack Taylor attended each of thesemeetings whilst Tony Isaac attended two meetings.
Appointments Committee
The Appointments Committee is responsible for mattersof management succession and the identification andappointment of Directors. The Committee is comprised ofthe Chairman and all of the independent Non-ExecutiveDirectors of the Company. The Chairman of the Committeeis Sir Neville Simms. The Human Resources Manager ofInternational Power acts as secretary to the Committee.During 2003 the Committee met on three occasions. Sir Neville Simms was in attendance at all three meetings,whilst Adri Baan, Tony Isaac and Jack Taylor attended two meetings each.
When reviewing candidates for the appointment of Chief Executive Officer, the Appointments Committeeinstructed Spencer Stuart, external search consultants.The appointment of Philip Cox was made following fullevaluation of internal and external candidates, after takinginto account their past experience, their personalachievements and other factors such as their knowledgeand experience of the global electricity industry and thebusiness environment of International Power. For theother executive positions filled in December 2003 and inJanuary 2004, the Appointments Committee evaluatedthe balance of skills, knowledge and experience requiredfor the business. In appointing Mark Williamson, SteveRiley and Tony Concannon, the Committee was satisfiedthat the candidates’ knowledge of the Group and theindustry, and their past performance as senior managers,matched the skills and personal attributes necessary forthe roles.
Relations with shareholdersThe Board is accountable to shareholders for theperformance and activities of the Group. InternationalPower ensures that its Annual General Meeting (AGM)provides shareholders with an opportunity to receivecomprehensive information on all aspects of the Group’sbusiness activities and to question senior managementabout business issues and prospects.
All proxy votes are counted and the level of proxy voteslodged for each resolution is reported at the AGM. In linewith best practice, the Company aims to ensure that theNotice of AGM and the Annual Report are sent toshareholders at least 20 working days before the AGM.
International Power also runs, within the terms of theregulatory framework, frequent contact programmes with industry analysts and institutional investors to discussmatters of strategy and financial performance. Contact is made principally by the Chief Executive Officer and theChief Financial Officer. On issues of major importance,the Chairman communicates with major shareholders.The Senior Independent Non-Executive Director (TonyIsaac) is also available as an alternative point of contact if shareholders have concerns over the Chairman’sperformance or where contact with the Chairman wouldbe inappropriate. The Non-Executive Directors do nothave any direct communications with institutionalinvestors, primarily to avoid potential confusion overchannels of communication. At each Board meeting anupdate is given on movements in major shareholdingsand on contact programmes between the ExecutiveDirectors and institutional shareholders. Reports issued by financial analysts on the Company are circulated toBoard members. These summaries and reports enablethe Directors to gain an understanding of the views andopinions of those with an interest in the Company.
Above: SEA Gas pipeline, Australia

annual report 2003 31
All results presentations and stock exchangeannouncements are available to shareholders on the Company’s website, www.ipplc.com.
Accountability and auditThe Board is mindful of its responsibility to present abalanced and understandable assessment of InternationalPower’s financial position and prospects, both to investorsand regulatory authorities. The Annual Report, preliminary,interim and quarterly results are the principal means ofachieving this objective.
An explanation of the respective responsibilities of theDirectors and external auditors in connection with thefinancial statements is set out on page 61. The Directorsconfirm on page 60 their view that the Group is a going concern.
The Audit Committee approves all non-audit servicesprovided by the external auditor to ensure that theobjectivity and independence of the external auditor isnot compromised. In line with the requirements of theSarbanes-Oxley Act, our procedures specify the servicesfrom which the external auditor is excluded and therigorous approval process for all other services.
Internal controlThe Board has responsibility for the Group’s system of internal control and for monitoring and reviewing its effectiveness.
Systems are in place to meet the requirements of theCombined Code and the Turnbull Guidance.
Any system of internal control is designed to manage,rather than eliminate, the risk of failure to achievebusiness objectives. The system can only providereasonable, and not absolute, assurance against materialfinancial misstatement or loss. The principal features of the Group’s systems of internal control are:
Control environment
The Board encourages a culture of integrity andopenness. The Company has an organisation structurewith clear lines of accountability and authority across itsworldwide operations, supported by appropriatereporting procedures. Each of the regional businesses is accountable to the Chief Executive and is managedwithin the strategic guidelines and delegated authoritiesadopted by the Board.
Control procedures
Control procedures have been established in each of the Company’s operations to safeguard the Group’sassets from loss or misuse and to ensure appropriateauthorisation and recording of financial transactions. Riskmanagement procedures are in place for the Company’soperations, including its energy marketing and tradingactivities, which are overseen by the Global CommoditiesRisk Committee, which comprises executive and seniormanagement, and is chaired by the Global Risk Manager.The Group treasury function operates under definedpolicies and the oversight of the Treasury Committee,chaired by the Chief Financial Officer. All acquisition andinvestment decisions are subject to disciplined investmentappraisal processes.
Above: Thai National Power (Pluak Daeng), Thailand

32 International Power
Performance reporting and information
Corporate plan Executive management submits anannual corporate plan to the Board for approval. The planfor each business unit is the quantified assessment of itsplanned operating and financial performance for the nextfinancial year, together with strategic reviews for thefollowing four years. Group management reviews theplans with each operational team. The individual plans arebased on key economic and financial assumptions andincorporate an assessment of the risk and sensitivitiesunderlying the projections.
Performance monitoring Monthly performance andfinancial reports are produced for each business unit, withcomparisons to budget. Reports are consolidated for overallreview by executive management, together with forecastsfor the profit and loss account and cash flow. Detailedreports are presented to the Board on a regular basis.
Performance review Each business unit is subject to aperformance review with Group management regularlyduring the year. Actual results and forecasts for the yearare compared to budget. Key operational and financialresults are reviewed together with the risk profile andbusiness environment of the reporting unit.
Investment projects These are subject to formal review andauthorisation procedures with designated levels of authority,including a review by an investment appraisal committeecomprising the Executive Directors and senior managers.Major projects are subject to Board review and approval.
Risk identification and management
There is a continuous process for identifying, evaluatingand managing the key risks faced by the Company.Activities are co-ordinated by the Risk Committee, which is chaired by the Chief Financial Officer, and hasresponsibility, on behalf of the Board, for ensuring theadequacy of systems for identifying and assessingsignificant risks, that appropriate control systems andother mitigating actions are in place, and that residualexposures are consistent with the Company’s strategyand objectives. Assessments are conducted for allmaterial entities.
As part of the annual business planning process, the keyrisks associated with achievement of principal objectivesare identified and their impact quantified. During the year,significant changes in the risk profile are highlightedthrough the business performance reports. The principalrisks are reviewed by the Risk Committee, which providesreports to the Board and the Audit Committee.
Energy marketing and trading
The objective of the Group’s energy marketing andtrading operations is to maximise the return from thepurchase of fuel and the sale of the associated output.
For each of the businesses that operate in merchantenergy markets, local risk committees have been establishedto oversee the management of the market, operational andcredit risks arising from the marketing and trading activities.The committees are made up of the Global and LocalRisk Managers, Directors and senior managers.
Risk management is a key part of theannual planning process.

annual report 2003 33
The Group hedges its physical generating capacity byselling forward its electrical output, and purchasing its fuelinput, as and when commercially appropriate and withinapproved control limits. This is accomplished through arange of financial and physical products. Our limitedproprietary trading operations use similar methods.
Energy market risk on our asset and proprietary portfolios is measured using various techniques includingValue-at-risk (VaR). VaR is used where appropriate andprovides a fair estimate of the net losses or gains whichcould be recognised on our portfolios over a certainperiod and given a certain probability; it does not providean indication of actual results. Scenario analyses are used to estimate the economic impact of sudden marketmovements on the value of our portfolios. Thissupplements the other techniques and methodologiesand captures additional market risks.
Monitoring
The Board reviews the effectiveness of establishedinternal controls through the Audit Committee whichreceives reports from management, the Risk Committee,the Group’s internal audit function and the externalauditors on the systems of internal control and riskmanagement arrangements.
Internal Audit reviews the effectiveness of internal controlsand risk management through a work programme which isbased on the Company’s objectives and risk profile and isagreed with the Audit Committee. Findings are reportedto operational and executive management, with periodicreporting to the Audit Committee.
Business unit managers provide annual self-certificationstatements of compliance with procedures. Thesestatements give assurance that controls are in operationand confirm that programmes are in place to address anyweaknesses in internal control. The certification processembraces all areas of material risk. Internal Audit reviewsthe statements and reports any significant issues to theAudit Committee.
Compliance with the Combined CodeDuring the year the service agreements for both DavidCrane and Philip Cox contained a provision whereby if,before 31 December 2004, their service agreementswere terminated by reason of a change of control of theCompany, then their notice periods would be increasedfrom 12 months to 24 months. This provision wasagreed by the Remuneration and AppointmentsCommittee upon the resignation of Peter Giller as CEOat the end of 2002 to provide security for the ExecutiveDirectors in the event of a change of control. DavidCrane’s provision lapsed upon his resignation. Philip Cox’sservice agreement still has this provision in place. However,if no change of control takes place before 31 December2004, then his notice period in the event of a change ofcontrol reverts to 12 months.
In all other respects, the Company has complied with theprovisions of the Combined Code throughout the periodof the review.
Above: Rugeley, UKLeft: KAPCO, Pakistan

34 International Power
Compliance with the revised Combined Code
The revised Combined Code applies to financial reportingyears beginning on or after 1 November 2003; thereforethe first reporting year to which the revised CombinedCode applies for International Power is the year beginning1 January 2004. The Board believes that it is broadlycompliant with the requirements of the revised CombinedCode. The Chairman, however, is a member of the Auditand Remuneration Committees. An explanation as towhy the Company feels this is appropriate is provided in the narrative above. Other principal areas of variance with the revised Code requirements have already beenoutlined in the corporate governance report for 2003.
US corporate governance complianceThe Company has securities registered in the US and, as a result, it is required to comply with those provisionsof the Sarbanes-Oxley Act 2002 (the Act) as it applies to foreign issuers. The Board continues to monitor thenew rules arising from the Act and arrangements are alsobeing developed to ensure that the Company will be ableto report on its systems of internal controls over financialreporting as required for year ended 31 December 2005.
As recommended by the US Securities and ExchangeCommission (SEC), the Company has established aDisclosure Committee comprising the CompanySecretary, the head of Internal Audit and representativesof the investor relations, finance and company secretariatdepartments. The Committee meets regularly and isresponsible for performing an oversight and advisory rolein the disclosure process for the content and form of theannual report and Form 20-F. The Committee makes
recommendations to the CEO, the CFO and theexecutive management on the adequacy of processes topermit the signing of certifications required by the Act.
In November 2003, the SEC approved changes to thelisting standards of the New York Stock Exchange (NYSE)related to the corporate governance practices of listedcompanies. Under these rules, listed foreign privateissuers, such as International Power, must disclose anysignificant ways in which their corporate governancepractices differ from those followed by US domesticcompanies under the NYSE listing standards. There areno significant differences in the corporate governancepractices undertaken by International Power as comparedto those followed by US domestic companies under the NYSE standards. Under the terms of the NYSE rules, Sir Neville Simms is deemed to be an independentDirector as all the payments he receives from theCompany are in respect of Directors’ fees and thereforehis membership of the Audit Committee, RemunerationCommittee and Appointments Committee is in accordancewith the requirements of the NYSE corporate governancerules. The terms of reference of the AppointmentsCommittee only relate to succession issues rather thancorporate governance principles, which are currentlyreserved to the Board as a whole.
We strive to play a positive role in thecommunities in which we operate – they are one of our most importantstakeholder groups.
Above and right: Milford, US


36 International Power
Corporate social responsibility
OUR COMMITMENT ELECTRICITY IS A UNIQUE PRODUCT THAT HAS THE POWER TOENHANCE THE QUALITY OF LIFE FOR PEOPLE THROUGHOUT THE WORLD. WITH THISPOWER COMES RESPONSIBILITY. FOR A WHOLESALE ELECTRICITY GENERATING COMPANY,IT MEANS PROTECTING OUR EMPLOYEES, THE ENVIRONMENT AND THE HOST COMMUNITIESWHO TRUST US TO DO OUR JOB SAFELY, COMPETENTLY AND EFFICIENTLY.
Left: Children from Loughborough PrimarySchool and their mentors on the London Eye
Corporate social responsibility (CSR) is not a new concept.Each one of our power stations and business units has, inthe past, been empowered to work in line with their ownbusiness plans and targets, local and national regulatorysystems for the welfare of their employees and inharmony with the communities in which they operate.They were given the freedom to be entrepreneurial anddynamic, which we believed vital in growing a new andvibrant business like International Power.
Now we have taken stock and analysed what is bestwithin the Company. We are sharing the knowledgeresiding in our assets, much of it acquired from ourheritage in the power sector. We are drawing togethermany different initiatives and individual examples of goodpractice into a cohesive process. This is a significant task in a Company with a range of assets spanning 12 different countries. However, through this process we expect to improve our CSR performance.
As well as taking a new, hard look at the way we operate,we are also conscious that we have to satisfy the outsideworld’s increasing interest in our affairs.
CSR provides a coherent, coordinated and convenientmatrix for appraising our values, policies, strategies andpractices. It helps us assess how we are performing.It highlights where we need to align our approach.It shows us where we need to give extra support. Intime, it will deliver our commitment through measurableimprovements. And it will progressively allow our
achievements as a sharper, sleeker, well-organisedCompany to be benchmarked against other industriesand other players in the power sector. Such increasedtransparency will, in turn, increase stakeholder confidencein everything that we do.
Translating words into actionIn 2003, the International Power Board of Directorsapproved a new set of principles for the Company, whichwe call FIRST:
F Fiscal disciplineI Integrity of communicationR Respect for the individualS Substance with styleT Team-first culture.
FIRST is translated into direct action through a Code of Business Conduct. This covers the environment, healthand safety, equal opportunities, procurement, ethicalbusiness practices, conduct in the community andcharitable contributions (our website – www.ipplc.com –sets these policies out in detail). Line managers will putthe policies into practice and monitor performance. The Board will, in turn, review the effectiveness of these arrangements each year.

annual report 2003 37
Back to school
Thirty of International Power’s head office staff in London have gone back to the classroom.
Each week, they help children at a local primary school to improve their reading. Through
regular contact with an individual ‘mentor’, the children (aged 7 to 8 years) have steadily
become more confident and fluent with this essential skill. Their efforts were rewarded when
a recent government education inspection officially up-rated the progress of Loughborough
Primary School.
To further boost the Company’s reading improvement initiatives, UK staff have raised money
by raffle (matched by International Power’s Charities and Donations Committee). Half of the
£2,830 total has been earmarked for books for Loughborough Primary School. The remainder
will benefit the Citizens Foundation’s sponsored school in Pakistan.
A target was set in 2002 to incorporate CSR intoour internal audit programmes. Health, safety andenvironmental issues are now fully integrated intothe scope of our audits. In 2003, we developed amethodology for including community and employeeissues which will be implemented in 2004.
Integrating CSR issues into our day-to-day businesspractice is part of the story. In 2003, we demonstratedour commitment to raise standards by taking part, withother leading companies, in the following initiatives:
• For the second year we are participating in the UK-based Business in the Community (BITC) CorporateResponsibility Survey.
• As a member of the London Accord, we took part inthe Right to Read campaign in conjunction with localeducation authorities.
• As a member of the UK Emissions Trading Group, weare advising the UK Department of Environment, Foodand Rural Affairs on the implementation of the EUEmissions Trading Directive.
It is satisfying when our efforts are recognised. In 2003,our Pego plant in Portugal was acknowledged by Examemagazine as one of the most socially responsible in thecountry. Our Hays plant in the US won the 2003 WaterEfficiency Achievement Award from the City of San Marcos.Our HUBCO plant in Pakistan won an award for the mostEnvironmentally Friendly Organisation 2002 from a panelof non-government organisations and regulatory bodies.
Both Rugeley and Deeside, in the UK, have retained their‘Investors in People’ accreditation to the year 2005.
A management system approachAll of our power stations have formal health, safety andenvironmental (HSE) management systems, operating to the principles of recognised international or nationalstandards. These systems ensure that our stations notonly operate in line with official regulations, InternationalPower policies and Company standards, but also that they continue to improve their CSR performance wherever practicable.
In order that these systems are developed andmaintained to the highest standards we encourage ourstations to implement management systems which arecertified to international or recognised national standards.For 2003 we set a corporate target to promote this processand our progress can be seen in the table opposite.
In 2003, a Health, Safety and Environment Committee(HSEC) was established to strengthen the managementof HSE risks. The Committee is chaired by the head ofOperations and Engineering and includes representativesfrom all the regions in which we operate. The Committeemet on three occasions in 2003 and provided reports to the Board. The HSEC has already proved to be aneffective mechanism for promoting best practice across the Company.

38 International Power
Putting road safety first
In a continuing effort to improve safety on the roads, Hazelwood Power in Australia sponsors the
local Children’s Traffic School.
The school is the only one of its type in the area. Local schools use it for their bike education and
road safety programmes. It provides a safe learning environment for children of all ages. Parents
are encouraged to learn the same skills as the children – use of safety equipment and respect for
all road users – to reinforce road safety messages.
The school has become a popular venue for children’s birthday parties, making learning fun.
2003 Targets
Encourage all assets to operate to ISO 14001 (the international environmental management system standard).
Encourage all assets to operate certified health and safety and quality management systems.
2003 Progress
All of our assets worldwide operate formal HSEmanagement systems. To date, nine have been certifiedto ISO 14001. The remainder have formal targets intheir 2004 business plans to achieve certification.
In addition, four of our assets have health and safetymanagement systems certified to recognised internationalor national standards (i.e. OHSAS 18001). A furtherthree have formal targets in their 2004 business plans to achieve certification.
Three of our assets have quality management systemscertified to ISO 9000 (the international quality managementsystem standard). A further three have formal targets intheir 2004 business plans to achieve certification.
Minimising environmental impactWhen generating electricity, the key environmentalimpacts are emissions to air, water and land. These aresubject to strictly defined official limits which may varyfrom country to country, or by region.
Wherever possible we try to improve our performanceby going beyond regulatory requirements. However,when generating electricity in bulk, as with any otherindustrial process, there is always a small risk of anincident occurring. During 2003, across all of ourstations, we reported three occasions where we did notcomply with permit levels. Such incidents are investigatedfully in conjunction with regulatory authorities and
measures are implemented to prevent re-occurrence.Because of their minor nature none of these incidentsresulted in regulatory action.
We recognise climate change as a major issue, whereInternational Power has an important part to play inreducing its emissions of carbon dioxide (CO2). Ourstrategy has two main elements: our drive to operateassets more efficiently in order to minimise emissions of CO2, and to seek viable opportunities for the use of renewables in our generation portfolio.
A key measure of our performance is the amount of CO2 emitted for each kilowatt-hour of electricitygenerated. In 2003 the figure fell from 0.82 kilograms

annual report 2003 39
Left: The Children’s Traffic School in Australia
of CO2 per kilowatt-hour in 2002 to 0.81 kilograms of CO2 per kilowatt-hour last year (see Figure 1). The performance data also shows a reduction in the total CO2 emitted across our assets of approximately2,214 kilo tonnes last year.
Improving the energy efficiency of the generating processreduces CO2 emissions. Ongoing initiatives to cut CO2
emissions from our assets include:
• increasing thermal efficiency by improving boiler airheater performance;
• upgrading and refurbishing turbines;
• increasing combustion efficiency by reducing excess airin boilers;
• reducing in-house energy consumption;
• increasing the operational efficiency at our mine inHazelwood, Australia.
Our Renewables Group is actively seeking viableopportunities for a range of renewable energy options for future development. Our strategy includes thedevelopment of both wind power and biomass fuels.
During 2004 we intend to build the 46 MW Canundawind farm in South Australia. Once operational, the windfarm will represent a significant contribution to reducingCO2 and other emissions associated with fossil fuel basedelectricity generation. We are also actively progressingseveral other wind power initiatives in Australia, Italy, theCzech Republic and the UK.
The second component of our renewable strategy is the use of biomass fuels. These include residues fromagriculture, such as straw and olive cake, and those fromwood and paper production. Our Rugeley power stationis using these products, through a process of blendingwith our traditional coal supply. The majority of biomassis currently moved by road. However, we are trialling thetransportation of biomass on the Grand Union Canal.
In Europe, the revised Large Combustion Plant Directiveand the Emissions Trading Directive will impact thepower-generating sector. We are currently discussing the implementation of these directives with the UKgovernment to ensure that industry concerns areconsidered in terms of their impact on the sector. We have strategies in place to ensure the eventualrequirements of this legislation are included in ourbusiness planning process.
Figure 1: CO2 emissions from InternationalPower’s power stations
0.0
0.2
0.4
0.6
0.8
1.0
2001 2002 2003
0.790.82 0.81
kgC
02/k
WH
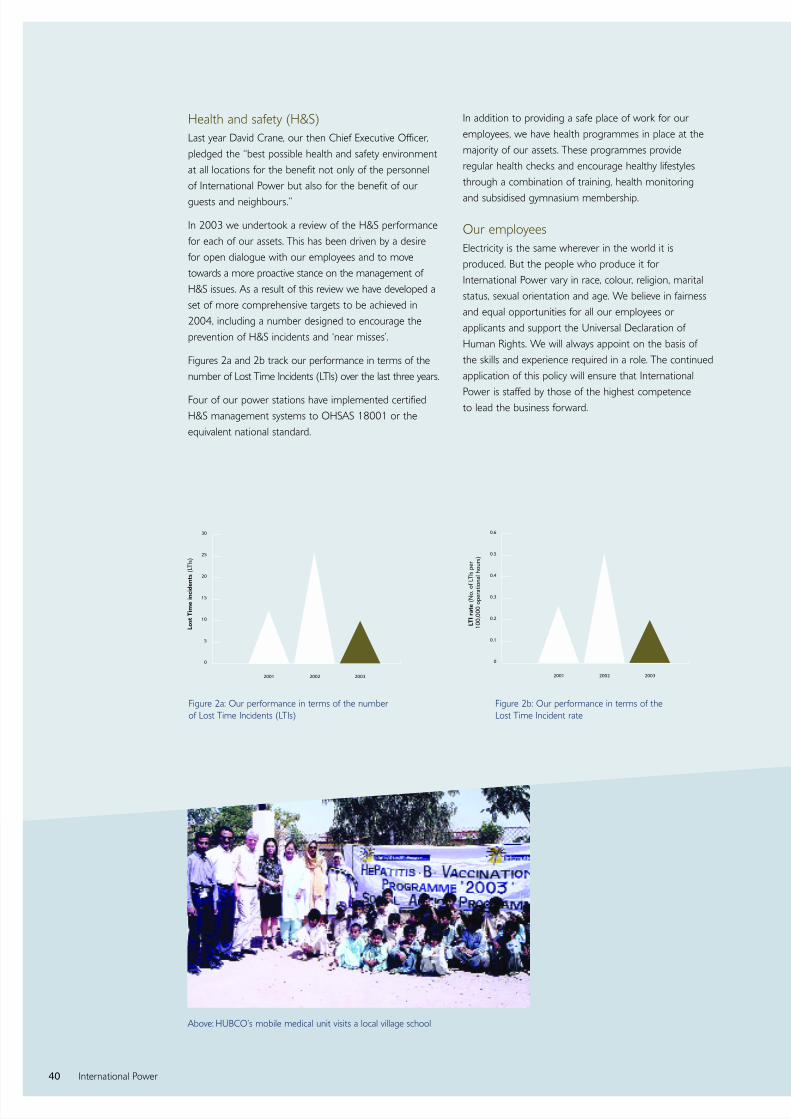
40 International Power
Health and safety (H&S)Last year David Crane, our then Chief Executive Officer,pledged the “best possible health and safety environmentat all locations for the benefit not only of the personnelof International Power but also for the benefit of ourguests and neighbours.”
In 2003 we undertook a review of the H&S performancefor each of our assets. This has been driven by a desirefor open dialogue with our employees and to movetowards a more proactive stance on the management ofH&S issues. As a result of this review we have developed aset of more comprehensive targets to be achieved in2004, including a number designed to encourage theprevention of H&S incidents and ‘near misses’.
Figures 2a and 2b track our performance in terms of thenumber of Lost Time Incidents (LTIs) over the last three years.
Four of our power stations have implemented certifiedH&S management systems to OHSAS 18001 or theequivalent national standard.
In addition to providing a safe place of work for ouremployees, we have health programmes in place at themajority of our assets. These programmes provideregular health checks and encourage healthy lifestylesthrough a combination of training, health monitoring and subsidised gymnasium membership.
Our employeesElectricity is the same wherever in the world it isproduced. But the people who produce it forInternational Power vary in race, colour, religion, maritalstatus, sexual orientation and age. We believe in fairnessand equal opportunities for all our employees orapplicants and support the Universal Declaration ofHuman Rights. We will always appoint on the basis of the skills and experience required in a role. The continuedapplication of this policy will ensure that InternationalPower is staffed by those of the highest competence to lead the business forward.
Above: HUBCO’s mobile medical unit visits a local village school
Lost
Tim
e in
cide
nts
(LT
Is)
2001 2002 2003
0
5
10
15
20
25
30
Figure 2a: Our performance in terms of the numberof Lost Time Incidents (LTIs)
LTI ra
te (
No.
of L
TIs
per
10
0,00
0 op
erat
iona
l hou
rs)
2001 2002 2003
0
0.1
0.2
0.3
0.4
0.5
0.6
Figure 2b: Our performance in terms of the Lost Time Incident rate

annual report 2003 41
During 2003, in response to a 2002 target, we collectedand analysed data from the main geographical regionswhere we operate to gain a better understanding of ouremployee population and their gender split and ethnicity.Our analysis concluded that, at our operational assets, wehave a mainly male employee population recruited fromthe local available workforce. However, at our corporateoffices we have a relatively higher female representation,again recruited from the local available workforce. We willcontinue to ensure that our local recruitment policiesenable us to benefit from the wide ranging knowledgeand experience of individuals in all sectors of society.
Community involvementElectricity touches every area of modern life. We, in turn,accept a responsibility to conduct our business with aproper concern for the world around us. Communitysupport is a major focus of International Power’scorporate activities. We play a positive role in thecommunities in which we operate, not because we haveto but because we want to. Our strategy is to provide
local employment; support the local economy; act as aresponsible neighbour and employer and contribute towardsthe improvement of local health and education services.
Many of our employees demonstrate personalcommitment to local community initiatives throughvoluntary work. Where fundraising forms part of theseinitiatives, International Power considers match fundingthrough our Corporate Charities Committee.
During 2003, International Power and its subsidiariescontributed £570,303 to charitable causes and othercommunity projects. Companies in which we have aminority shareholding (associates, joint ventures andtrade investments) contributed a further £157,375.
The annual variation in the level of contribution (shown in figure 3 below), reflects our policy on conduct in thecommunity and charitable contributions where causes arecarefully targeted to ensure that we improve economic,environmental, educational or social well being indemonstrable ways.
Working to keep children healthy
HUBCO in Pakistan is at the centre of an on-going sponsorship programme to improve health
care in the local community. Last year, around 300 children from four primary schools were
vaccinated against Hepatitis B. Throughout 2003, a mobile clinic provided 45,000 patients with
the health care and free medicines they needed. Staffed by a qualified local doctor, health visitors
and a nursing assistant, the clinic visited 25 villages in the vicinity of the power station.
HUBCO’s continuing involvement in these and other preventative and curative services are
recognised and have been commended by the region’s government officials.
Figure 3: Charitable donations
0
100
200
300
400
500
600
700
800
Tota
l (£0
00s)
2001 2002 2003
603
194
455
215
570
157Total community investment by subsidiaries
Total community investment by associates, joint ventures and trade investments

42 International Power
Further details on our policy and case studies of ourcommunity involvement projects can be found on ourwebsite – www.ipplc.com.
SuppliersInternational Power’s major areas of procurement coverpower generation and desalination equipment, fuel suppliesand maintenance services. Our supplier relationships arecovered by the International Power Code of BusinessConduct, which sets codes of conduct and ethics.
When constructing new power stations, our projects are often arranged as Engineer, Procure and Constructcontracts, where direct responsibility for main equipmentsupplies is written into formal contract agreements. Weprefer to limit our dealings to a small number of world-renowned manufacturers of power generation anddesalination equipment. We expect these companies to work to high CSR standards.
For our maintenance contracts, where we have more direct control, we also use major internationalequipment suppliers.
Many of our assets have an existing fuel supplieragreement which means that we have little or no ability to influence the CSR credentials of our fuelsuppliers. However, where we do contract directly with fuel suppliers we seek to ensure that their social,environmental and health and safety performance meetsInternational Power, European or World Bank standards.During the contract negotiation phase our suppliersprovide us with general details of their environmental,health and safety and community performance. In 2004 we will seek detailed CSR performance informationfor all of our key fuel suppliers.
As an electricity generator, we see corporate socialresponsibility as being an integrated approach tomanaging environmental, health and safety, employee,community and ethical issues completely and transparently.
2004 targets• Support assets towards their environment,
health and safety or quality management systemobjectives/certification targets for December 2004.
• Improve employee awareness of our CSR policies and initiatives.
• Review the CSR credentials of our key fuel suppliers.
• Implement the integration of community involvementand employee management into our existing internalaudit programme.
• Review our H&S induction processes at all of ourconstruction and operational sites to confirm that these processes are appropriate.
• Ensure that as a minimum each asset undertakes atleast 4 safety walks for each specified area per year.
• Ensure that as a minimum each asset undertakes atleast 4 H&S toolbox talks per workgroup per year.
• Continue working to reduce the number of LTIs andour LTI rate towards our goal of zero.
• Continue to reduce the number of incidents requiringfirst-aid treatment.
We see our corporate social responsibility as an integratedapproach to managing environmental, health and safety,employee, community and ethical issues completely and transparently.
Above and right: Bellingham, US


44 International Power
INTERNATIONAL POWER OPERATES IN AN INCREASINGLY COMPLEX BUSINESSENVIRONMENT. WE PLACE A HIGH PRIORITY ON THE RECRUITMENT, RETENTION AND TRAINING OF STAFF AT ALL LEVELS, WHETHER EMPLOYED BY US DIRECTLY OR BY ANY OF OUR SUBSIDIARIES, JOINT VENTURES OR ASSOCIATES.
Employees
We operate an incentive-weighted compensation schemewhich we believe rewards and develops staff on thefollowing bases:
• Achievement of tangible personal objectives:
annual targets are set for all personnel, calibrated atlevels designed to ensure that individuals are able tocontribute to the attainment of these objectives.
• Professional and educational advancement:
we promote and facilitate mid-career training, internaland external seminars, personal development plans andother educational programmes. In addition, weencourage our employees to participate activelyin their personal development and in relevantprofessional organisations.
• Leadership: we expect our employees to exerciseleadership in their dealings with colleagues, partners,customers and other contract parties.
This all relies on a foundation of personal integrity. We endeavour to ensure that all of our staff conductthemselves, internally and externally, in a manner of the highest integrity.
Clear communication links are critical to enhancebusiness and commercial awareness throughout ourbusiness. Corporate publications, the International Powerwebsite and intranet, employee awareness briefings fromexecutive management and team briefings are all used topromote communications and an understanding of thedevelopment and application of policies and strategy. Weuse the latest technology to aid rapid communicationwith all staff around the world, as well as regularlyholding Global Employee Forums.
Equal opportunitiesThe Group is committed to equal opportunities, bothfrom a sense of social responsibility and also because itmakes sound business sense to benefit from the wide-ranging knowledge and experience of individuals in allsectors of society. This commitment to equalopportunities means that decisions to appoint, reward,train, develop and promote are taken purely on the basisof skills and abilities, as matched against the requirementsof the job. The Group values its reputation as a caringemployer and seeks to attract and retain high calibreemployees. Opportunities for training are given a high priority to ensure that all individuals can contributeto their own career development. This approach extends itself to the fair treatment of people with disabilities inrelation to their recruitment, training and development.
Employee share plans International Power has in place a number of share-basedplans under which employees of the Group and itssubsidiary companies may acquire Ordinary Shares inInternational Power plc. These plans form an integral partof the Group’s strategy to provide appropriate rewardand retention strategies for employees, to align employeeand shareholder interests through incentive targets basedon clear operational and financial criteria and to recruit,motivate and retain employees.
We value our reputation as a caring employer and seekto attract and retain high calibre employees.

annual report 2003 45
These employee share plans are:
• the Demerger Long-Term Incentive Plan (a one-off planestablished at Demerger which is open to ExecutiveDirectors and a small number of senior managers),which ceased operation on 2 October 2003;
• the 2002 Performance Share Plan (an annual plan open to Executive Directors and a small number ofsenior managers);
• the International Power Approved Executive ShareOption Scheme (a discretionary plan open to selectedUK resident employees);
• the International Power Unapproved Executive ShareOption Plan (a discretionary plan for selected UK-based employees);
• the Global Executive Share Option Plan (a discretionaryplan for executives resident outside of the UK);
• the International Power Sharesave Plan (open to all UK resident employees);
• the International Power Global Sharesave Plan (open toemployees in certain jurisdictions outside of the UK);
• the Demerger Share Plan (open to UK employeesemployed by the Group as at Demerger), which ceasedoperation on 2 October 2003.
All of the listed plans are currently in operation, exceptfor the Demerger Long-Term Incentive Plan and theDemerger Share Plan which ceased operation on 2 October 2003.
Executive Share Options have been granted to executivesin four countries outside the UK and the GlobalSharesave Plan is now in operation in four countriesoutside the UK. As the Group continues to grow andemployee numbers continue to increase, we anticipatethat the extension of share plans to overseas jurisdictionswill continue apace.
Whilst Executive Directors are eligible to participate in all of the listed Plans, David Crane and Philip Cox onlyparticipated in the Demerger Long-Term Incentive Plan,the 2002 Performance Share Plan, the Approved andUnapproved Executive Share Option Plans and theInternational Power Sharesave Plan. Tony Concannon,Steve Riley and Mark Williamson participate in the 2002Performance Share Plan, the Approved and UnapprovedExecutive Share Option Plans and the International PowerSharesave Plan. They also participated in the DemergerShare Plan.
The vesting of any awards made under each of theDemerger Long-Term Incentive Plan and the 2002Performance Share Plan and the ability to exerciseoptions granted under the Approved and UnapprovedExecutive Share Option Plans and the Global ExecutiveShare Option Plan are all subject to the satisfaction ofperformance conditions. Information on the relevantperformance conditions for each award or option grantunder each plan is given in the Directors’ remunerationreport. The exercise of options under the Sharesave Plan is not subject to any performance condition. Therelease of shares under the Demerger Share Plan, beingan all employee share plan, was also not subject to anyperformance condition.
Left: EOP, Czech Republic

46 International Power
Directors’ remuneration report
The Committee has access to external independentadvice in relation to remuneration. During the year the Remuneration Committee appointed Towers Perrinto provide specialist advice on Director and seniormanagement remuneration. Towers Perrin did notundertake any other services on behalf of the Companyduring the year ended 31 December 2003.
In addition, it received advice from James Richards,Human Resources Manager, with regard to all aspects of remuneration. The CEO attended Committeemeetings to report on Executive Directors’ performance(other than his own).
This report to the shareholders by the Committee coversthe following: remuneration policy (including informationon share options, long-term incentive plans, Directors’service contracts and Directors’ pension benefits); Directors’aggregate remuneration and compensation; andDirectors’ interests in the Company’s shares.
Remuneration policy The Company’s remuneration policy for each ExecutiveDirector takes account of the changing nature of thebusiness in both the UK and overseas. In order tocompete with and meet these challenges, the Committee has designed executive remuneration along the following principles:
• Total remuneration levels that will retain and motivatetop quality executives.
• All remuneration packages have a significantperformance-related element.
• Incentives are based on meeting specific, measurableperformance objectives, and align executives’ rewardswith creating value for our shareholders.
• Total remuneration packages that include significantopportunities to acquire International Power sharesconsistent with our strategy of reinvestment andbuilding a strong share ownership culture.
This policy applies to the current year and theCommittee intends to continue it for the foreseeablefuture, taking into account developing market practice.
At the start of each financial year the RemunerationCommittee establishes a framework of individual andcorporate performance targets against whichperformance is measured.
Consideration is also given to remuneration levels in comparator companies both within the UK andinternationally. The Committee also has regard to the pay of staff and management generally within the Group,to ensure that an appropriate balance is maintained inremuneration levels.
THE SETTING OF REMUNERATION POLICY AND THE DETERMINATION OF THECOMPENSATION OF EXECUTIVE DIRECTORS IS UNDERTAKEN ON BEHALF OF THE BOARD BY THE REMUNERATION COMMITTEE.
Left: Hartwell, US
annual report 2003 47
As part of its continued review of executive remunerationpolicy, and to assist with the succession management planimplemented on 1 January 2003, the Chairman consulteda number of the Company’s principal institutionalshareholders and other major institutional bodiesregarding its executive remuneration arrangements. The Committee incorporated those arrangements intothe service agreements for Philip Cox, and that held by David Crane prior to his resignation. During2003 the Chairman consulted a number of theCompany’s principal institutional shareholders and othermajor institutional bodies regarding its process for recruitinga CEO to replace David Crane.
In 2003 the Company has introduced two new areas ofremuneration policy for Executive Directors and seniormanagers related to paying bonuses in shares and shareretention, both of which are detailed in this report.
Elements of remuneration Executive Directors receive a remuneration packagealigned with short and medium-term corporate andpersonal targets. The package comprises a marketcompetitive base salary; performance-related annualbonus (satisfied part in cash and part in shares); mediumand long-term share related incentives; pension benefits;and other benefits including a health care programmeand a company car allowance.
With regard to the performance related elements of Executive Director remuneration packages, they are structured to provide significant awards for superior performance.
Main fixed and performance-related elements of remuneration
FIXED PERFORMANCEELEMENTS ELEMENTS
Base salary Annual bonus (paid in cash and shares)
Pension Demerger LTIP (ceased operationon 2 October 2003)
Healthcare Performance Share Plan
Car allowance Executive Share Option Scheme
The total value of the fixed elements of remunerationreferred to in the table above represents 137% of basesalary. The value of the performance related elements
(annual bonus and long term incentives) represents260% of base salary. The level of remuneration actuallyreceivable in respect of the performance related elementswill be dependent upon the extent to which the relevantperformance conditions are achieved over the relevantperformance period.
Base salary as at 1 January 2004
NAME SALARY
Philip Cox £475,000
Mark Williamson £250,000
Tony Concannon £235,000
Steve Riley £235,000
The International Power annual performance bonus is a non-pensionable payment for achieving targets set bythe Board (including EPS, cash flow and personal targets).The maximum annual bonus opportunity for ExecutiveDirectors was set at 60% of base salary for theperformance year 1 January to 31 December 2003.In order to increase the share ownership of ExecutiveDirectors and senior management, and to furtherincrease the alignment of remuneration package toshareholder return, the bonus award for this period has been made part in cash and part in shares.
For this period the Committee awarded Philip Cox a cash bonus of £71,411 and 71,411 shares, recognisingboth the significant corporate and personal achievementsduring the period 1 January to 31 December 2003. MarkWilliamson was appointed a Director on 11 December2003. For the period 11 December to 31 December2003 he was awarded a cash bonus of £2,399 and2,399 shares. The shares for Philip Cox and MarkWilliamson will be released to them on 2 March 2004.
The details of these payments are set out in theDirectors’ aggregate remuneration table on page 54.
As part of the new share retention arrangements, theseshares (less a proportion of the shares sold to meettaxation liabilities) are required to be held until January2007. An Executive Director may dispose of these sharesprior to January 2007 if his total beneficial interest in the shares of the Company is equal to or greater than 100% of his base salary.
It is intended that the bonuses payable for the performanceyears 2004 and 2005 will also be paid part in cash andpart in shares, subject to the above retention arrangements.

48 International Power
Share Plans for Executive Directors:Performance Conditions
Demerger Long-Term Incentive Plan Two separate performance conditions applied for awardsto be made under this Plan. First that the average of theclosing mid-market prices of an Ordinary Share on theLondon Stock Exchange for the 60 consecutive dealingdays immediately prior to the third anniversary of theDemerger Date must have been equal to or greater than152% of the Initial Price (the Initial Price having beenfixed as being 295.175p per share) immediately followingthe Demerger. Second, that the average annual growth innormalised earnings per share of the Company for thefinancial reporting period of the Company ending on 31 December 2000 to the end of the financial reportingperiod ending on 31 December 2003 must have beenequal to or greater than 7%. No awards have been madein respect of this plan and the plan ceased operation on2 October 2003.
2002 Performance Share Plan
2002 awards
The awards made under this Plan in 2002 will normallyvest after the end of a three-year period commencing on1 January 2002 and ending on 31 December 2004 (thePerformance Period). The performance condition thatapplies to the awards made in 2002 is based on growthin normalised earnings per share (EPS growth). Under thiscondition, 30% of the award will vest after 31 December2004 if average annual EPS growth over the PerformancePeriod is not less than RPI+7%. 100% of the award willvest if average annual EPS growth over the PerformancePeriod is equal to or greater than RPI+12%. Vesting willbe pro-rated for EPS growth between these two points.
2003 awards
As part of the Company’s succession management plan,a special conditional award was made in March 2003 toDavid Crane and Philip Cox which will normally vest afterthe end of a three-year period commencing on 1 January2003 and ending on 31 December 2005 (the PerformancePeriod). The performance condition that applies to theabove award is based on growth in normalised earningsper share (EPS growth). Under this condition, 30% of the award will vest after 31 December 2005 if EPSperformance for the year ended 31 December 2005 isnot less than 11.5p. 100% of the award will vest if EPSperformance for the year ended 31 December 2005 isequal to or greater than 14p. Vesting will be pro-ratedfor EPS performance between these two points. Thesespecial conditional awards represented 50% of the basesalary of David Crane and Philip Cox.
Additionally, as part of the Company’s annual incentivearrangements, annual awards were also made in March2003. These will normally vest after the end of a three-year period commencing on 1 January 2003 and endingon 31 December 2005 (the Performance Period). Theperformance condition that applies to this annual incentiveaward is based on growth in normalised earnings pershare (EPS growth). 30% of the award will vest after 31 December 2005 if EPS performance for the yearended 31 December 2005 is not less than 11.5p. 100%of the award will vest if EPS performance for the yearended 31 December 2005 is equal to or greater than16p. Vesting will be pro-rated for EPS performancebetween these two points. David Crane and Philip Cox,being the serving Executive Directors, were given annualincentive Conditional Awards of shares to the value of100% of their base salary, subject to performanceconditions. Tony Concannon, Steve Riley and MarkWilliamson participate in this award up to 50% oftheir base salary.
David Crane’s awards under this plan lapsed upon hisresignation as a Director on 30 November 2003.
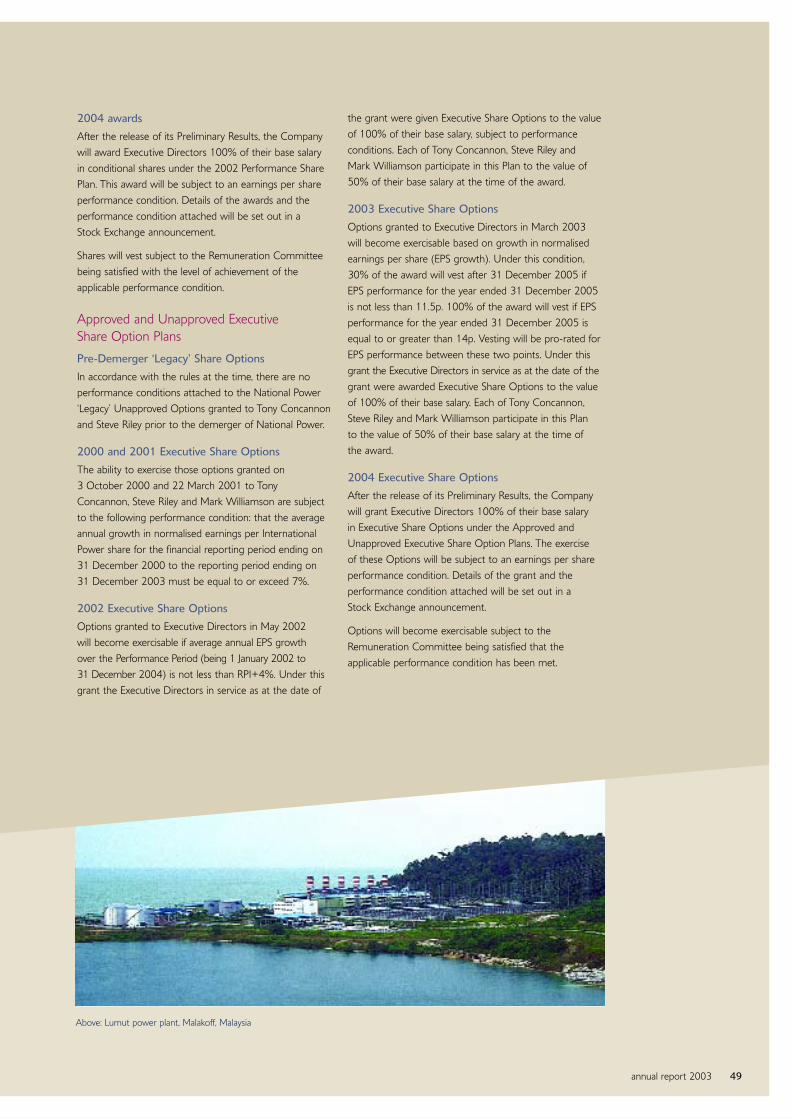
annual report 2003 49
2004 awards
After the release of its Preliminary Results, the Companywill award Executive Directors 100% of their base salaryin conditional shares under the 2002 Performance SharePlan. This award will be subject to an earnings per shareperformance condition. Details of the awards and theperformance condition attached will be set out in a Stock Exchange announcement.
Shares will vest subject to the Remuneration Committeebeing satisfied with the level of achievement of theapplicable performance condition.
Approved and Unapproved Executive Share Option Plans
Pre-Demerger ‘Legacy’ Share Options
In accordance with the rules at the time, there are noperformance conditions attached to the National Power‘Legacy’ Unapproved Options granted to Tony Concannonand Steve Riley prior to the demerger of National Power.
2000 and 2001 Executive Share Options
The ability to exercise those options granted on 3 October 2000 and 22 March 2001 to TonyConcannon, Steve Riley and Mark Williamson are subjectto the following performance condition: that the averageannual growth in normalised earnings per InternationalPower share for the financial reporting period ending on31 December 2000 to the reporting period ending on31 December 2003 must be equal to or exceed 7%.
2002 Executive Share Options
Options granted to Executive Directors in May 2002 will become exercisable if average annual EPS growth over the Performance Period (being 1 January 2002 to 31 December 2004) is not less than RPI+4%. Under thisgrant the Executive Directors in service as at the date of
the grant were given Executive Share Options to the valueof 100% of their base salary, subject to performanceconditions. Each of Tony Concannon, Steve Riley and Mark Williamson participate in this Plan to the value of50% of their base salary at the time of the award.
2003 Executive Share Options
Options granted to Executive Directors in March 2003will become exercisable based on growth in normalisedearnings per share (EPS growth). Under this condition,30% of the award will vest after 31 December 2005 ifEPS performance for the year ended 31 December 2005is not less than 11.5p. 100% of the award will vest if EPSperformance for the year ended 31 December 2005 isequal to or greater than 14p. Vesting will be pro-rated forEPS performance between these two points. Under thisgrant the Executive Directors in service as at the date of thegrant were awarded Executive Share Options to the valueof 100% of their base salary. Each of Tony Concannon,Steve Riley and Mark Williamson participate in this Plan to the value of 50% of their base salary at the time of the award.
2004 Executive Share Options
After the release of its Preliminary Results, the Companywill grant Executive Directors 100% of their base salary in Executive Share Options under the Approved andUnapproved Executive Share Option Plans. The exercise of these Options will be subject to an earnings per shareperformance condition. Details of the grant and theperformance condition attached will be set out in a Stock Exchange announcement.
Options will become exercisable subject to theRemuneration Committee being satisfied that theapplicable performance condition has been met.
Above: Lumut power plant, Malakoff, Malaysia

Above and right: Blackstone, US
50 International Power
Selection of performance criteria For the 2002 Performance Share Plan and the Approvedand Unapproved Executive Share Option Plans, theperformance conditions have been aligned with the keyobjective of growth in earnings per share of the Company.
For the Demerger LTIP, now closed, the performanceconditions were aligned with this same objective, togetherwith growth in the Company’s share price.
The Remuneration Committee has chosen EPS growth asthe performance measure for its share plans to ensure thatthere is an objective measure of relative performance andthe Committee has decided to measure the relative growthin EPS taking into account growth in the RPI index. Thischoice of EPS growth recognises that International Poweris a UK-based company that operates almost entirelyoutside the UK, that there is no comparator group ofcompanies against which the Company’s performance can adequately be measured in terms of Total ShareholderReturn (TSR), and that EPS is an objective financialmeasure that can be tracked. Whilst the Committeerecognises that this is not a measure that is universallyliked by shareholders, the Committee believes that thetargets set are challenging and, if achieved, willdemonstrate significant financial performance on the partof the Directors and employees of the Company.
This approach will continue to be adopted for furtherawards under the 2002 Performance Share Plan andgrants under the Approved and Unapproved ExecutiveShare Option Plans.
The Remuneration Committee will assess the level ofperformance in respect of any performance conditionobjectively. Given that the principal performance measurefor the Company’s Share Plans is based on growth inearnings per share, the Committee will take into account,and adjust appropriately for, the enhancement effects ofany purchase and subsequent cancellation of shares, or placing of shares into Treasury, by the Company.
Total shareholder return (TSR) As required by the Directors’ remuneration reportregulations, below is a graph showing TSR for theCompany as marked against a broadbased market equityindex over the last five years. The index that has beenused is the FT All Share, of which the Company is aconstituent member.
0
30
60
90
120
150
1999 2001 2002 20032000
FT All Share
International Power
Demerged from National Power October 2000


52 International Power
Directors’ service contracts
Service contracts – David Crane and Philip Cox
During 2003, David Crane (who resigned on 30 November 2003) and Philip Cox each had service contracts subject to 12-months’ notice by theCompany. For a limited period only (1 January 2003 to 31 December 2004), if the service agreements for David Crane and Philip Cox are terminatedfor a change of control, the notice period is increased to 24 months. For termination other than for cause, an Executive Director may receive a paymentof 125% of annual basic salary (not in addition to the 12-months’ notice) to take account of the value of contractual benefits. For termination throughthe temporary change of control provision referred to above, this payment increases to 250% of annual basic salary (not in addition to the 24-months’notice). The date upon which these contracts were entered into was 25 February 2003.
Service contracts – Newly appointed Directors
Mark Williamson (appointed a Director on 11 December 2003), Steve Riley and Tony Concannon (appointed Directors on 1 January 2004) have servicecontracts which are subject to 12-months’ notice by the Company. For termination by the Company, an Executive Director may receive a payment of125% of annual basic salary (not in addition to the 12-months’ notice) which will be paid on a monthly basis until the Executive Director securesalternative employment, up to a maximum of 12 monthly payments. The date upon which these contracts were entered into was 23 February 2004.
Service contracts – Non-Executive Directors
The Chairman of International Power plc, Sir Neville Simms, has a letter of appointment with a 12-month notice period. The letter of appointment wassigned on 22 February 2000. Peter Giller, for the period 1 January 2003 to 31 December 2003, was Deputy Chairman and Non-Executive Director.This arrangement terminated on 31 December 2003. The other Non-Executive Directors are appointed on a three-year fixed-term, annualfixed-fee basis.
The following table summarises the appointment and termination dates for Directors:
Non-Executive Directors Date contract entered into Contract expiry
Adri Baan 30 May 2002 AGM May 2006Peter Giller 1 January 2003 31 December 2003Tony Isaac 2 October 2000 AGM May 2006Sir Neville Simms 22 February 2000 12 months’ noticeJack Taylor 2 October 2000 AGM May 2005
Sir Neville Simms’ contract will expire at the 2010 AGM, following his 65th birthday, or earlier, subject to the above notice period.
Executive Directors
David Crane 25 February 2003 Terminated through resignation on 30 November 2003
Philip Cox 25 February 2003 12-months’ noticeTony Concannon 23 February 2004 12-months’ noticeSteve Riley 23 February 2004 12-months’ noticeMark Williamson 23 February 2004 12-months’ notice
Executive Director contracts automatically terminate on the date they reach normal retirement age which is 22 September 2011 for Philip Cox,
17 December 2023 for Tony Concannon, 16 August 2021 for Steve Riley and 29 December 2017 for Mark Williamson.
Non-Executive Directors’ fees and shareholding requirements In order to maintain our Chairman and Non-Executive Directors’ fee levels at a comparable scale to the market place, the Company has, effective from 1 July 2003 increased these fees. The revised fees are set out in the Directors’ aggregate remuneration table on page 54. In order to receive thisincrease, the Chairman and Non-Executive Directors have committed to use the net value of the increase, each year, to purchase International Powershares. In addition, as part of a new shareholding requirement, they will also be required to hold these shares until their appointment terminates.
As part of this arrangement, the Chairman and Non-Executive Directors acquired the following shares:
Adri Baan 3,901Tony Isaac 3,901Sir Neville Simms 10,000Jack Taylor 2,595
The structure of any further review of the Chairman’s or Non-Executive Directors’ fees will be agreed at the time of that review, and may not involvethe requirement to purchase shares over and above the arrangement set out above. Save as set out above, no remuneration or other benefits (including,but not limited to, pension, life assurance, shares, share options, bonuses and other incentive arrangements) are provided as consideration for theperformance of their duties.

annual report 2003 53
AuditThe detail of the Directors’ remuneration, pensions and interests in share options and long-term incentive plans as disclosed on pages 53 to 59 have been audited by the Company’s external auditors.
Directors’ pension benefits With effect from 1 January 2003 pension arrangements for David Crane and Philip Cox were provided through the Senior Section of the InternationalPower Group of the Electricity Supply Pension Scheme, which is a scheme approved by the Inland Revenue. The scheme provides for: a normalretirement age of 60; an accrual rate of one thirtieth of pensionable salary; four times salary death-in-service benefits; a widow’s pension of 2/3executive’s pension; and executive’s contribution of 6% of salary up to 15% of Inland Revenue earnings limits.
The benefits provided through the scheme are restricted by Inland Revenue earnings limits. These arrangements are supplemented by the Companymaking contributions to personal pensions, life assurance, and a Funded Unapproved Retirement Benefit Scheme, up to a cost to the Company of 30%of salary (which includes the cost of the benefit provided through the Senior Section of the International Power Group Electricity Supply Pension Scheme).
As a result of David Crane’s resignation, and his having been a member of the Pension Scheme for less than 12 months, he was refunded his pensionscheme contributions, which have been included in the table below.
Cash allowance received Cash allowance receivedPercentage of base salary for the year to for the year to
paid in lieu of pension 31 December 2003 31 December 2002 arrangements (£000) (£000)
Peter Giller n/a n/a n/aDavid Crane 30% 131 87Philip Cox 30% – 87
Accrued benefit Transfer value of accrued benefitIncrease in year
At 31 including excluding At 31 At 31 Increase less Increase inDecember inflation inflation December December Directors’ year excluding
2003 2003 2002 contributions inflation£000 £000 £000 £000 £000 £000 £000
Philip Cox 4 4 4 45 – 30 30Mark Williamson 10 4 4 96 51 37 29
• The pension entitlement shown is that which would be paid annually on retirement based on service to the end of the year. The normal retirementage is 60.
• Dependants’ pensions on death are 58% of members’ pension in respect of service prior to 2 October 2000 and two-thirds of members’ pension inrespect of service thereafter. On death in service a lump sum of four times salary is payable. On death within the first five years of retirement, a lumpsum is payable equal to the balance outstanding of the first five years’ pension payments.
• Post-retirement increases are expected to be in line with inflation (guaranteed up to the level of 5% p.a. and discretionary above that level).
• The transfer value has been calculated on the basis of actuarial advice in accordance with Actuarial Guidance Note GN11.
• Members of the pension scheme have the option to pay Additional Voluntary Contributions; neither the contributions nor the resulting benefits are included in the above table.
• Mark Williamson joined the Board on 11 December 2003. However his entitlement is calculated on the amounts and values at 31 December 2002and those accrued over the period 31 December 2002 to 31 December 2003.
• Philip Cox joined the pension scheme on 1 January 2003. Prior to that date he received cash benefit in lieu of any pension arrangements.
• In addition to the above entitlements, during the year contributions of £68,911 were paid to a funded unapproved retirement benefit scheme in respect of Philip Cox.

54 International Power
2003 DIRECTORS’ REMUNERATION AND INTERESTS
Directors’ aggregate remunerationThe table below shows the aggregate remuneration of the International Power plc Directors for the year ended 31 December 2003.
Aggregate Aggregate remuneration remuneration
Performance Performance Payment year to 31 year to 31related bonus related bonus in lieu of Other December December
Salary Fees - cash - shares pension benefits 2003 2002£ £ £ £ £ £ £ £
Sir Neville Simms(6) – 192,500 – – – – 192,500 175,000Philip Cox(7) 357,056 – 71,411 96,762 68,911 15,881 610,021 509,632David Crane(2) 435,417 – – – 130,625 16,883 582,925 513,311Peter Giller(3)(4)(5) – 100,000 – – – – 100,000 675,843Mark Williamson(8) 14,113 – 2,399 3,251 – 736 20,499 –JackTaylor(1) – 35,000 – – – – 35,000 30,000Tony Isaac(1) – 42,500 – – – – 42,500 35,000Adri Baan(1) – 37,500 – – – – 37,500 17,500Dennis Hendrix(1) – – – – – – – 12,500Total 806,586 407,500 73,810 100,013 199,536 33,500 1,620,945 1,968,786
Notes 1. The International Power plc Non-Executive Directors’ fees were reviewed as at 1 July 2003. The basic fee effective from this date, which covers
Board membership (i.e. attendance at Board meetings, general duties as Directors, and their membership of Board Committees) is £40,000(increased from £30,000). In addition, Tony Isaac receives an additional fee of £5,000 per annum for his role as Senior Independent Director. With effect from 1 July 2003 Tony Isaac also receives £5,000 per annum for his role as Chairman of the Audit Committee, and Adri Baan receives an additional fee of £5,000 per annum for his role as Chairman of the Remuneration Committee.
2. As a result of David Crane’s resignation and him having been a member of the Pension Scheme for less than 12 months, he was refunded hisPension Scheme contributions which are included in the table above. He also received a company car allowance and private medical insurance,both of which are included in other benefits. These arrangements ceased on 30 November 2003.
3 On 2 October 2000, Peter Giller received a one-off conditional award of 677,564 Ordinary Shares in the Company in respect of his three yearterm of employment (subject to the rules of the Restricted Share Plan). One third of the Ordinary Shares conditionally awarded to him (being225,854) were issued to him on 2 October 2001 and a further third (225,855) were released on 2 October 2002. The final third (225,855) were issued to him on termination of his service agreement on 31 December 2002. The 2002 total remuneration stated in the table abovereflects: 9/12 of the value of his 2002 release, based on the share price at 2 October 2002 of 82.875p per share at the time of the vesting of the shares; and 3/12 of the remaining third released to him on 31 December 2002 based on a share price of 95.125p per share. In addition,during 2002 he was provided with a weekly cash supplement of £1,100 in respect of housing costs.
4. As part of Peter Giller’s termination of his service agreement he received, on 31 December 2002, the balance of his 2003 Restricted Share Planrelease and the full release of his 2002 Performance Share Plan award of 255,102 shares. Both these releases were based on a share price of95.125p, and are reflected in the 2002 total remuneration shown in the table above. He also received, as part of termination arrangements, arelocation allowance of £25,000.
5. As part of Peter Giller’s role as Deputy Chairman and Non-Executive Director, he received a fee of £100,000. This arrangement terminated on 31 December 2003.
6. The Chairman’s fee was reviewed as at 1 July 2003 (rather than 2 October 2002, as stated in his original contract). The fee effective from this date,is £210,000 (from £175,000).
7. Philip Cox was appointed Chief Executive Officer on 11 December 2003. The increase in his salary, effective from that date, is included in the above table. The payment in lieu of pension detailed in the above table sets out the contributions made to Philip Cox’s Death In Service insurancepremium and Funded Unapproved Retirement Benefits Scheme. He also received a company car allowance and private medical insurance, both ofwhich are included in Other benefits. The value of the Performance related bonus-share in the above table has been calculated using a share priceof 135.5p (being the mid-market quoted price for 23 February 2004).
8. Mark Williamson was appointed an Executive Director on 11 December 2003. His remuneration from that date is included in the above table. Thevalue of the Performance related bonus-share in the above table has been calculated using a share price of 135.5p (being the mid-market quotedprice for 23 February 2004).

annual report 2003 55
The following information shows the interests of the Directors as at the end of the financial year in the Company’s Long-Term Incentive Plans, ExecutiveShare Option Plans and the Sharesave Plan. Additionally, as both Tony Concannon and Steve Riley were appointed Directors of the Company on the firstday of the current financial year, full information on the interests of each of Tony Concannon and Steve Riley in the same plans is also given in thissection, in the interests of full disclosure.
Long-term incentive plans
Demerger LTIPMarket value
No. of shares of an Ordinary No. of shares under award Conditional Share as at End of under award as
as at 1 January awards made Date of date of award performance at 31 December2003 during the year award (pence) period 2003
David Crane – – – – 2 October 2003 –Philip Cox – – – – 2 October 2003 –
Details of the qualifying conditions with respect to performance under the Demerger LTIP are given in the Directors’ remuneration report on page 48.As no awards have been made under the Demerger LTIP before the end of the performance period, the Demerger LTIP ceased to operate on 2 October 2003.
2002 Performance Share PlanDirectors who served during the year
Market valueNo. of shares of an Ordinary No. of shares under award Conditional Share as at End of under award as
as at 1 January awards made Date of date of award performance at 31 December2003 during the year award (pence) period 2003
David Crane(1) 148,724 – 24 May 2002 196p 31 December 2004 –917,264 10 March 2003 70p 31 December 2005 –
Total Options –
Philip Cox 148,724 – 24 May 2002 196p 31 December 2004 148,724675,879 10 March 2003 70p 31 December 2005 675,879
Total Options 824,603
Mark Williamson(2) 31,530 – 24 May 2002 196p 31 December 2004 31,53088,286 10 March 2003 70p 31 December 2005 88,286
Total Options 119,816
(1) Awards lapsed following resignation of David Crane on 30 November 2003.(2) As at date of appointment 11 December 2003.
Directors appointed since 31 December 2003
Market valueNo. of shares of an Ordinary No. of shares under award Conditional Share as at End of under award as
as at 1 January awards made Date of date of award performance at 31 December2003 during the year award (pence) period 2003
Tony Concannon(1) 21,619 – 24 May 2002 196p 31 December 2004 21,61960,536 10 March 2003 70p 31 December 2005 60,536
Total Options 82,155
Steve Riley(1) 28,141 – 24 May 2002 196p 31 December 2004 28,14178,795 10 March 2003 70p 31 December 2005 78,795
Total Options 106,936
(1) As at date of appointment 1 January 2004.
Details of the performance conditions in respect of awards made under the 2002 Performance Share Plan are given in the Directors’ remunerationreport on page 48.

56 International Power
Executive share optionsDirectors who served during the year
No. of No. of shares under
shares under option as atoption as at Granted Exercise price Exercise Exercise 31 December
1 January 2003 during the year per share period from period to 2003
David Crane(1) 15,306(3) 196p 24 May 2005 24 May 2012 –
133,418(4) 196p 24 May 2005 24 May 2012 –
678,571(4) 70p 10 March 2006 10 March 2013 –
Total Options 148,724 –
Philip Cox 15,306(3) 196p 24 May 2005 24 May 2012 15,306
133,418(4) 196p 24 May 2005 24 May 2012 133,418
500,000(4) 70p 10 March 2006 10 March 2013 500,000
Total Options 148,724 648,724
Mark Williamson(2) 4,811(3) 311.75p 3 October 2003 3 October 2010 4,811
27,265(4) 311.75p 3 October 2003 3 October 2010 27,265
6,382(3) 235p 22 March 2004 22 March 2011 6,382
14,893(4) 235p 22 March 2004 22 March 2011 14,893
31,530(4) 196p 24 May 2005 24 May 2012 31,530
88,285(4) 70p 10 March 2006 10 March 2013 88,285
Total Options 84,881 173,166
(1) Options lapsed following resignation of David Crane on 30 November 2003. (2) As at date of appointment 11 December 2003.(3) Approved Executive Share Options. (4) Unapproved Executive Share Options.
Directors appointed since 31 December 2003No. of
No. of shares undershares under option as atoption as at Granted Exercise price Exercise Exercise 31 December
1 January 2003 during the year per share period from period to 2003
Tony Concannon(1) 6,028(4) 336.21p 30 November 1997 30 November 2004 6,028
6,401(4) 323.23p 23 December 1999 23 December 2006 6,401
6,188(4) 386.09p 2 December 2000 2 December 2007 6,188
7,010(4) 352.61p 1 December 2001 1 December 2008 7,010
3,007(2) 311.75p 2 October 2003 2 October 2010 3,007
17,040(3) 311.75p 2 October 2003 2 October 2010 17,040
3,989(2) 235p 22 March 2004 22 March 2011 3,989
9,308(3) 235p 22 March 2004 22 March 2011 9,308
5,740(2) 196p 24 May 2005 24 May 2012 5,740
15,879(3) 196p 24 May 2005 24 May 2012 15,879
60,535(3) 70p 10 March 2006 10 March 2013 60,535
Total Options 80,590 141,125
Steve Riley(1) 11,327(4) 306.14p 13 December 1998 13 December 2005 11,327
10,953(4) 323.23p 23 December 1999 23 December 2006 10,953
10,685(4) 386.09p 2 December 2000 2 December 2007 10,685
12,379(4) 352.61p 1 December 2001 1 December 2008 12,379
5,052(2) 311.75p 2 October 2003 2 October 2010 5,052
28,628(3) 311.75p 2 October 2003 2 October 2010 28,628
6,063(2) 235p 22 March 2004 22 March 2011 6,063
16,277(3) 235p 22 March 2004 22 March 2011 16,277
28,141(3) 196p 24 May 2005 24 May 2012 28,141
78,795(3) 70p 10 March 2006 10 March 2013 78,795
Total Options 129,505 208,300
(1) Date of appointment as Directors 1 January 2004. (2) Approved Executive Share Options. (3) Unapproved Executive Share Options. (4) National Power ‘Legacy’ Unapproved Executive Share Options.

annual report 2003
Sharesave Options Directors who served during the year
No. of No. of shares under
shares under option as atoption as at Granted Exercise price Exercise Exercise 31 December
1 January 2003 during the year per share period from period to 2003
David Crane(1) 18,250 – 90p 24 December 2007 lapsed –Total Options –
Philip Cox 18,250 – 90p 24 December 2007 24 June 2008 18,250Total Options 18,250
Mark Williamson(2) 10,500 – 90p 24 December 2005 24 June 2006 10,500Total Options 10,500
(1) Options lapsed upon resignation of David Crane as director on 30 November 2003.(2) On appointment 11 December 2003.
Directors appointed since 31 December 2003
No. of No. of shares under
shares under option as atoption as at Granted Exercise price Exercise Exercise 31 December
1 January 2003 during the year per share period from period to 2003
Tony Concannon(1) 8,400 – 90p 24 December 2005 24 June 2006 8,400Total Options 8,400
Steve Riley(1) 10,500 – 90p 24 December 2005 24 June 2006 10,500Total Options 10,500
(1) Date of appointment as Directors 1 January 2004.
The middle market quotation for an Ordinary Share of the Company on 31 December 2003 was 123.5p and the daily quotations during the
period ranged from 70.13p to 160.00p.
2002 Performance Share Plan Share Option In respect of awards made on 10 March 2003 under the 2002 Performance Share Plan to Directors and eligible employees, on 28 March 2003 andpursuant to the rules of the Plan, the Company granted an option to the Trustee of the 2002 Performance Share Plan to acquire 3,807,057 OrdinaryShares in the Company. The option exercise price is 84p per share, being the middle market quotation for the Company’s Ordinary Shares on 27 March2003. The total number of shares that may be received by Directors in the event of exercise of this option (and assuming full performance of the performance condition) is 903,496.
Shares held in trustAs at 31 December 2003, a total of 3,003,312 Ordinary Shares of the Company were held in two separate Employee Share Ownership Trusts (31 December 2002: 1,917,414). The Directors (together with all other employees of the Company and its subsidiaries) being potential beneficiaries of these shares have an interest in all of these shares. Of these shares, 1,273,138 were purchased in 2002 in respect of awards made under the 2002Performance Share Plan at a cost (net of administration expenses) of £2.5 million. 255,102 of these shares were released at the end of 2002 to PeterGiller. An additional 1,800,000 shares were acquired by the Employee Share Ownership Trusts on 28 March 2003 at a total cost (net of administrationexpenses) of £1.5 million for the purposes of the bonus and share retention plan. In line with recommended practice, the fund balances are beingwritten down to £nil over the period of service to which they relate. The book value of the shares placed in Trust as at 31 December 2003 was £2 million (31 December 2002: £1 million).
In respect of awards made to Directors under the Performance Share Plan as at the date of this report, the number of shares that may vest to Directors if full performance of the relevant performance condition is achieved is 230,014. Shares held in trust for this Plan relate to the Conditional Awards made in 2002.
Details of the performance conditions that apply with respect to the ability to exercise options under both the Approved and Unapproved ExecutiveShare Option Plans, detailed on page 56 opposite, are given on page 49.
57
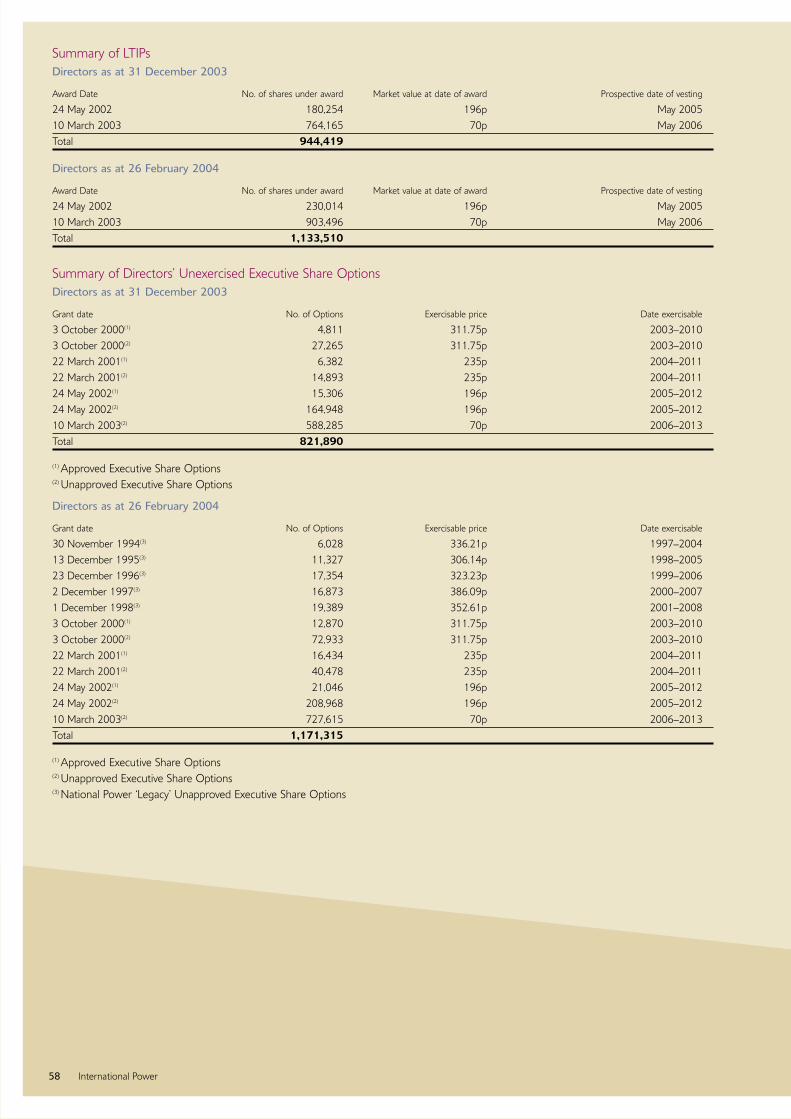
58 International Power
Summary of LTIPsDirectors as at 31 December 2003
Award Date No. of shares under award Market value at date of award Prospective date of vesting
24 May 2002 180,254 196p May 200510 March 2003 764,165 70p May 2006Total 944,419
Directors as at 26 February 2004
Award Date No. of shares under award Market value at date of award Prospective date of vesting
24 May 2002 230,014 196p May 200510 March 2003 903,496 70p May 2006Total 1,133,510
Summary of Directors’ Unexercised Executive Share OptionsDirectors as at 31 December 2003
Grant date No. of Options Exercisable price Date exercisable
3 October 2000(1) 4,811 311.75p 2003–20103 October 2000(2) 27,265 311.75p 2003–201022 March 2001(1) 6,382 235p 2004–201122 March 2001(2) 14,893 235p 2004–201124 May 2002(1) 15,306 196p 2005–201224 May 2002(2) 164,948 196p 2005–201210 March 2003(2) 588,285 70p 2006–2013Total 821,890
(1) Approved Executive Share Options(2) Unapproved Executive Share Options
Directors as at 26 February 2004
Grant date No. of Options Exercisable price Date exercisable
30 November 1994(3) 6,028 336.21p 1997–200413 December 1995(3) 11,327 306.14p 1998–200523 December 1996(3) 17,354 323.23p 1999–20062 December 1997(3) 16,873 386.09p 2000–20071 December 1998(3) 19,389 352.61p 2001–20083 October 2000(1) 12,870 311.75p 2003–20103 October 2000(2) 72,933 311.75p 2003–201022 March 2001(1) 16,434 235p 2004–201122 March 2001(2) 40,478 235p 2004–201124 May 2002(1) 21,046 196p 2005–201224 May 2002(2) 208,968 196p 2005–201210 March 2003(2) 727,615 70p 2006–2013Total 1,171,315
(1) Approved Executive Share Options(2) Unapproved Executive Share Options(3) National Power ‘Legacy’ Unapproved Executive Share Options
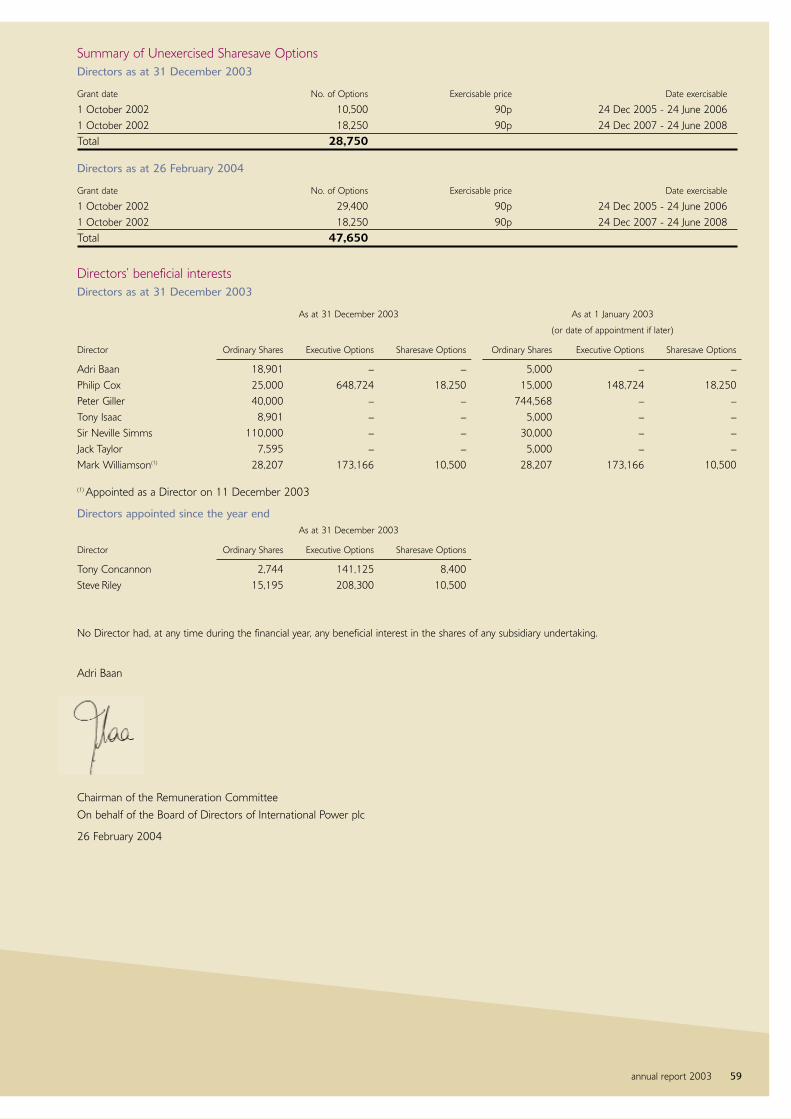
annual report 2003 59
Summary of Unexercised Sharesave OptionsDirectors as at 31 December 2003
Grant date No. of Options Exercisable price Date exercisable
1 October 2002 10,500 90p 24 Dec 2005 - 24 June 20061 October 2002 18,250 90p 24 Dec 2007 - 24 June 2008Total 28,750
Directors as at 26 February 2004
Grant date No. of Options Exercisable price Date exercisable
1 October 2002 29,400 90p 24 Dec 2005 - 24 June 20061 October 2002 18,250 90p 24 Dec 2007 - 24 June 2008Total 47,650
Directors’ beneficial interestsDirectors as at 31 December 2003
As at 31 December 2003 As at 1 January 2003
(or date of appointment if later)
Director Ordinary Shares Executive Options Sharesave Options Ordinary Shares Executive Options Sharesave Options
Adri Baan 18,901 – – 5,000 – –Philip Cox 25,000 648,724 18,250 15,000 148,724 18,250Peter Giller 40,000 – – 744,568 – –Tony Isaac 8,901 – – 5,000 – –Sir Neville Simms 110,000 – – 30,000 – –Jack Taylor 7,595 – – 5,000 – –Mark Williamson(1) 28,207 173,166 10,500 28,207 173,166 10,500
(1) Appointed as a Director on 11 December 2003
Directors appointed since the year endAs at 31 December 2003
Director Ordinary Shares Executive Options Sharesave Options
Tony Concannon 2,744 141,125 8,400Steve Riley 15,195 208,300 10,500
No Director had, at any time during the financial year, any beneficial interest in the shares of any subsidiary undertaking.
Adri Baan
Chairman of the Remuneration CommitteeOn behalf of the Board of Directors of International Power plc
26 February 2004

60 International Power
Directors’ report
IntroductionThe Directors submit their report and the auditedfinancial statements of International Power plc (the“Company”) for the year ended 31 December 2003. Theprincipal activity of the Company is to act as the holdingcompany for a group of companies and a number ofassociated companies and joint ventures (the “Group”).The principal activities of the Group are the generationand sale of electricity.
Key informationThe following sections form part of this Directors’ report:
– The Operating and financial review (pages 5 to 21). – Corporate governance (pages 27 to 35). – Employees (pages 44 and 45).– Directors’ remuneration (pages 46 to 59).– Current Directors’ biographical details and Directors
who served through the year (pages 22 and 23).– Directors who served during the year (page 27).– Audited financial statements (pages 62 to 91).
DividendThe Directors do not propose the payment of a dividendfor the year ended 31 December 2003.
Charitable and political donationsThe company does not make political donations. Detailsof charitable donations are set out on page 41.
Research and developmentPure research is not a core element of the business of the Company. Therefore, for the period under review,the Company did not undertake any expenditure onresearch and development. The Company will look totake advantage of technical advances as they arise andwill continue to seek to develop power stations in theregions in which the Group operates making effective use of current and new technology as it arises.
Share capitalDuring the period 1 January to 31 December 2003,and utilising the authority given by shareholders at the 2003 Annual General Meeting, the Companypurchased on the London Stock Exchange 10,652,323 of its own Ordinary Shares at a total cost of£12,847,593. These shares were cancelled bythe Company following their purchase.
Resolutions will be proposed at the 2004 Annual General Meeting (AGM) to renew for a further five yearsthe Directors’ general authority to allot shares; to renewfor a year the partial disapplication of shareholders’statutory pre-emption rights over Ordinary Shares; and,to renew the authority to purchase a proportion of theCompany’s shares.
An explanation of these and other resolutions beingproposed at the 2003 AGM will be provided in theNotice of AGM, which will be sent to shareholders during March 2004.
Shares held in trustAs at 31 December 2003, 3,003,312 Ordinary Shares of the Company were held in trust for the benefit ofemployees of the Company and its subsidiaries. Theseshares had a nominal value of £1,501,656 and a marketvalue of £3,709,090. The employee share plan for whichthese shares may be utilised is the 2002 PerformanceShare Plan and the bonus and share retention plan.
Substantial shareholdingsAs at the date of this report, the Company is aware ofinterests in 3% or more of the issued share capital of theCompany on behalf of the organisations as shown in thetable below.
SUBSTANTIAL NO. OF SHARESSHAREHOLDINGS
Merrill Lynch Investment Managers Ltd 112,589,353 10.16%
BriTel Fund Trustees Ltd 51,778,561 4.67%
AXA S.A. 39,905,357 3.57%
Legal & General InvestmentManagement Ltd 34,230,622 3.06%
Morley Fund Management Ltd 33,897,293 3.06%
Going concernThe Directors are satisfied that the Company and theGroup have adequate resources to continue to operatefor the foreseeable future. Accordingly, the Directorscontinue to adopt the ‘going concern’ basis for the preparation of the accounts.
AuditorsA resolution to re-appoint KPMG Audit Plc as auditors ofthe Company and to authorise the Directors to agree theirremuneration will be proposed at the forthcoming AGM.
Prompt payment policyThe Company aims to observe the highest standards ofbusiness practice as both a buyer and seller of productsand services. The Company’s average number of daysoutstanding in respect of trade creditors at 31 December2003 was 32 days.
By order of the BoardStephen RamsayCompany Secretary26 February 2004

In respect of the preparation of the financial statements
The following statement, which should be read in conjunction with the statement of auditor’s responsibilities included in their report below, is made with
a view to distinguishing for shareholders the respective responsibilities of the Directors and auditors in relation to the financial statements. Company law requires
the Directors to prepare financial statements for each financial period which give a true and fair view of the state of affairs of the Company and of the Group and
of the profit or loss for that period. In preparing those financial statements, the Directors are required to:
• select suitable accounting policies and then apply them consistently;
• make judgements and estimates that are reasonable and prudent;
• state whether applicable accounting standards have been followed, subject to any material departures disclosed and explained in the financial statements;
• prepare the financial statements on the going concern basis unless it is inappropriate to presume that the Company and the Group will continue in business.
The Directors are responsible for keeping proper accounting records which disclose with reasonable accuracy at any time the financial position of the Company and of
the Group and to enable them to ensure that the financial statements comply with the Companies Act 1985. They have general responsibility for taking such steps as
are reasonably open to them to safeguard the assets of the Group and to prevent and detect fraud and other irregularities.
Independent auditor’s report
To the members of International Power plc
We have audited the financial statements on pages 62 to 91. We have also audited the information in the Directors‘ remuneration report that is described
as having been audited. This report is made solely to the Company’s members, as a body, in accordance with section 235 of the Companies Act 1985. Our audit work
has been undertaken so that we might state to the Company's members those matters we are required to state to them in an auditor’s report and for no other purpose.
To the fullest extent permitted by law, we do not accept or assume responsibility to anyone other than the Company and the Company’s members as a body, for our
audit work, for this report, or for the opinions we have formed.
Respective responsibilities of Directors and auditorsThe Directors are responsible for preparing the Annual Report and the Directors’ remuneration report. As described above, this includes responsibility for preparing the
financial statements in accordance with applicable UK law and accounting standards. Our responsibilities, as independent auditors, are established in the UK by statute, the
Auditing Practices Board, the Listing Rules of the Financial Services Authority and by our profession’s ethical guidance.
We report to you our opinion as to whether the financial statements give a true and fair view and whether the financial statements and the part of the Directors’ remuneration
report to be audited have been properly prepared in accordance with the Companies Act 1985. We also report to you if, in our opinion, the Directors’ report is not consistent
with the financial statements, if the Company has not kept proper accounting records, if we have not received all the information and explanations we require for our audit, or if
information specified by law regarding Directors’ remuneration and transactions with the Group is not disclosed.
We review whether the statement on page 33 reflects the Company’s compliance with the seven provisions of the Combined Code specified for our review by the Listing
Rules, and we report if it does not. We are not required to consider whether the Board’s statements on internal control cover all risks and controls, or form an opinion on
the effectiveness of the Group's corporate governance procedures or its risk and control procedures.
We read the other information contained in the Annual Report, including the corporate governance statement and the unaudited part of the Directors’ remuneration
report, and consider whether it is consistent with the audited financial statements. We consider the implications for our report if we become aware of any apparent
misstatements or material inconsistencies with the financial statements.
Basis of audit opinion
We conducted our audit in accordance with Auditing Standards issued by the Auditing Practices Board. An audit includes examination, on a test basis, of evidence relevant
to the amounts and disclosures in the financial statements and the part of the Directors’ remuneration report to be audited. It also includes an assessment of the
significant estimates and judgements made by the Directors in the preparation of the financial statements, and of whether the accounting policies are appropriate to the
Group’s circumstances, consistently applied and adequately disclosed.
We planned and performed our audit so as to obtain all the information and explanations which we considered necessary in order to provide us with sufficient evidence
to give reasonable assurance that the financial statements and the part of the Directors’ remuneration report to be audited are free from material misstatement, whether
caused by fraud or other irregularity or error. In forming our opinion we also evaluated the overall adequacy of the presentation of information in the financial statements
and the part of the Directors’ remuneration report to be audited.
Opinion
In our opinion:
• the financial statements give a true and fair view of the state of affairs of the Company and the Group as at 31 December 2003 and of the loss of the Group for the
year then ended;
• the financial statements and the part of the Directors’ remuneration report to be audited have been properly prepared in accordance with the Companies Act 1985.
KPMG Audit PlcChartered accountantsRegistered auditor26 February 2004
61annual report 2003
Statement of Directors’ responsibilities
8 Salisbury SquareLondon
EC4Y 8BB

Consolidated profit and loss account
FOR THE YEAR ENDED 31 DECEMBER 2003 Year ended 31 December Year ended 31 December
Excluding Exceptional Including Excluding Exceptional Includingexceptional items exceptional exceptional items exceptional
items items items items2003 2003 2003 2002 2002 2002
Note £m £m £m £m £m £m
1 Turnover: Group and share of joint ventures and associates 1,273 – 1,273 1,129 – 1,129
Less: share of joint ventures’ turnover (136) – (136) (122) – (122)
Less: share of associates’ turnover (285) – (285) (290) – (290)
1 Group turnover 852 – 852 717 – 717
2/8 Net operating costs (727) (404) (1,131) (509) (103) (612)
Operating profit/(loss) 125 (404) (279) 208 (103) 105
Share of operating profit of:
Joint ventures 32 – 32 26 – 26
8 Associates 95 35 130 123 – 123
8 Income from investments 33 – 33 31 42 73
1/8 Operating profit/(loss) and investment income 285 (369) (84) 388 (61) 327
8 Non-operating exceptional items:
Profit on sale of fixed asset investments – 27 27 – – –
1 Profit/(loss) on ordinary activities before interest and taxation 285 (342) (57) 388 (61) 327
4 Interest receivable and similar income 42 – 42 24 – 24
5/8 Interest payable and similar charges (121) (16) (137) (121) – (121)
5 Share of net interest of joint ventures and associates (32) – (32) (35) – (35)
Net interest (111) (16) (127) (132) – (132)
3 Profit/(loss) on ordinary activities before taxation 174 (358) (184) 256 (61) 195
8/9 Tax (charge)/credit on profit/(loss) on ordinary activities (54) 26 (28) (77) 1 (76)
Profit/(loss) on ordinary activities after taxation 120 (332) (212) 179 (60) 119
Minority interests – equity (7) – (7) (6) – (6)
Profit/(loss) for the financial year 113 (332) (219) 173 (60) 113
11 Earnings/(loss) per share:
Basic 10.2p (29.9)p (19.7)p 15.5p (5.4)p 10.1p
Diluted 10.1p (29.9)p (19.7)p 15.5p (5.4)p 10.1p
The results for the years ended 31 December 2003 and 2002 derive from continuing operations. There were no material changes in the activities of theentities consolidated in these financial statements and no material acquisitions or disposals.
62 International Power

AT 31 DECEMBER 2003 Group
31 December 31 December 2003 2002
Note £m £m
Fixed assets
Intangible fixed assets:
12 Goodwill 7 8
12 Negative goodwill (6) (7)
Net goodwill 1 1
13 Tangible fixed assets 2,048 2,473
14 Fixed asset investments:
Joint ventures:
Share of gross assets 337 300
Share of gross liabilities (211) (198)
Net investment 126 102
Associates 315 303
Other investments 97 102
Total fixed asset investments 538 507
Total fixed assets 2,587 2,981
Current assets
15 Stocks 65 55
16 Debtors 160 134
17 Investments 70 43
Cash at bank and in hand 673 799
Total current assets 968 1,031
18 Creditors: amounts falling due within one year:
Secured loans without recourse (531) (810)
Other current liabilities (315) (595)
Creditors: amounts falling due within one year (846) (1,405)
Net current assets/(liabilities) 122 (374)
Total assets less current liabilities 2,709 2,607
19 Creditors: amounts falling due after more than one year (including convertible debt) (909) (583)
20 Provisions for liabilities and charges (238) (255)
1 Net assets 1,562 1,769
Capital and reserves
22/23 Called up share capital 554 559
23 Share premium account 289 289
23 Capital redemption reserve 145 140
23 Capital reserve 422 422
23 Profit and loss account 113 330
23 Shareholders’ funds – equity 1,523 1,740
Minority interests – equity 39 29
Total equity 1,562 1,769
The accounts were approved by the Board of Directors on 26 February 2004 and signed on its behalf by
Philip Cox Mark WilliamsonChief Executive Officer Chief Financial Officer
Consolidated balance sheet
63annual report 2003

Balance sheet
AT 31 DECEMBER 2003 Company
31 December 31 December 2003 2002
Note £m £m
Fixed assets
13 Tangible assets 1 2
14 Investments:
Subsidiary undertakings 1,847 1,877
Other investments 3 1
Total fixed asset investments 1,850 1,878
Total fixed assets 1,851 1,880
Current assets
16 Debtors 247 72
Cash at bank and in hand 478 311
Total current assets 725 383
18 Creditors: amounts falling due within one year (890) (676)
Net current liabilities (165) (293)
Total assets less current liabilities 1,686 1,587
19 Creditors: amounts falling due after more than one year – –
20 Provisions for liabilities and charges (38) (47)
Net assets 1,648 1,540
Capital and reserves
22/23 Called up share capital 554 559
23 Share premium account 289 289
23 Capital redemption reserve 145 140
23 Capital reserve 415 415
23 Profit and loss account 245 137
Shareholders’ funds – equity 1,648 1,540
The accounts were approved by the Board of Directors on 26 February 2004 and signed on its behalf by
Philip Cox Mark WilliamsonChief Executive Officer Chief Financial Officer
64 International Power

FOR THE YEAR ENDED 31 DECEMBER 2003 Year ended Year ended31 December 31 December
2003 2002Note £m £m
24 Net cash inflow from operating activities 184 276
24 Dividends received from joint ventures and associates 68 84
Dividends received from fixed asset investments – ordinary 33 31
285 391
Dividends received from fixed asset investments – exceptional – 42
24 Returns on investments and servicing of finance – ordinary (84) (88)
24 Returns on investments and servicing of finance – exceptional (4) (25)
Taxation (14) (20)
24 Capital expenditure and financial investment – ordinary (74) (159)
24 Capital expenditure and financial investment – exceptional 11 –
24 Acquisitions and disposals – ordinary – (144)
24 Acquisitions and disposals – exceptional 24 –
Net cash inflow/(outflow) before management of liquid resources and financing activities 144 (3)
Management of liquid resources (20) –
24 Financing activities (260) 210
(Decrease)/increase in cash in the year (136) 207
Consolidated reconciliation of net cash flow to movement in net debt
FOR THE YEAR ENDED 31 DECEMBER 2003 Year ended Year ended31 December 31 December
2003 2002Note £m £m
26 (Decrease)/increase in cash in the year (136) 207
26 Cash outflow/(inflow) from decrease/(increase) in debt financing 247 (210)
26 Cash outflow from increase in liquid resources 20 –
Change in net debt resulting from cash flows 131 (3)
Foreign exchange movement 11 98
Other non-cash movements (22) (10)
Movement in net debt in the year 120 85
Net debt at the start of the year (812) (897)
26 Net debt at the end of the year (692) (812)
Consolidated cash flow statement
65annual report 2003

Consolidated statement of total recognised gains and losses
FOR THE YEAR ENDED 31 DECEMBER 2003 Year ended Year ended31 December 31 December
2003 2002£m £m
(Loss)/profit for the financial year (219) 113
Exchange differences on the retranslation of net investments and related borrowings 15 (42)(net of £7 million tax (2002: £10 million))
Share of recognised loss of associated undertaking – (1)
Total recognised gains and losses relating to the financial year (204) 70
Reconciliation of movements in shareholders’ funds – equity
FOR THE YEAR ENDED 31 DECEMBER 2003 Year ended Year ended31 December 31 December
2003 2002£m £m
(Loss)/profit for the financial year (219) 113
Other recognised gains and losses relating to the year 15 (43)
Share buyback (13) –
Net (reduction from)/addition to shareholders’ funds (217) 70
Opening shareholders’ funds 1,740 1,670
Closing shareholders’ funds 1,523 1,740
66 International Power

The following accounting policies have beenapplied consistently in dealing with items whichare considered material in relation to the Group’s financial statements.
ACCOUNTING POLICIES
i Basis of preparation of accountsThe financial statements of International Powerplc and its subsidiary undertakings (the Group)are prepared under the historical cost conventionand in accordance with applicable accountingstandards, except for the departures noted below.
Certain energy-based futures contracts used forproprietary trading purposes are marked to marketusing externally derived market prices. This is adeparture from the general provisions of Schedule4 of the Companies Act 1985. An explanation ofthis departure is given in note xv.
ii Basis of consolidationThe consolidated financial statements include thefinancial statements of the Company and all of its subsidiary undertakings up to 31 December2003. The results of subsidiary undertakingsacquired or disposed of in the period are included in the consolidated profit and lossaccount from the date of acquisition or up to the date of disposal.
An associate is an undertaking in which theGroup has a long-term participating interest,usually from 20% to 50% of the equity votingrights, and over which it exercises significantinfluence. A joint venture is an undertaking inwhich the Group has a long-term participatinginterest and over which it exercises joint control.The Group’s share of the profits less losses ofassociates and of joint ventures is included in theconsolidated profit and loss account. Its interest in their net assets is included in fixed assetinvestments in the consolidated balance sheet.
Purchased goodwill (both positive and negative)arising on consolidation in respect of acquisitionsbefore 1 April 1998, when FRS 10 (Goodwill and Intangible Assets) was adopted, was set off against reserves in the year of acquisition.When a subsequent disposal occurs any relatedgoodwill previously set off to reserves is takenback through the profit and loss account as part of the profit or loss on disposal.
Purchased goodwill (representing the excess ofthe fair value of the consideration given over thefair value of the separable net assets acquired)arising on consolidation in respect of acquisitionssince 1 April 1998 is capitalised. Positive goodwillis fully amortised by equal annual instalments over its estimated useful life, currently not morethan 20 years.
Negative goodwill arising on consolidation inrespect of acquisitions since 1 April 1998 isincluded within fixed assets and released to theprofit and loss account in the periods in which thefair values of the non-monetary assets purchasedon the same acquisition are recovered, whetherthrough amortisation or sale.
On the subsequent disposal or termination of abusiness acquired since 1 April 1998, the profit orloss on disposal or termination is calculated aftercharging/(crediting) the unamortised amount ofany related goodwill/(negative goodwill).
In the Company’s financial statements,investments in subsidiary undertakings, associatesand joint ventures are stated at cost less amountswritten off.
iii Income recognitionTurnover from plants subject to power purchaseagreements (PPAs) is recognised in accordance with the contract terms in respect of ownedassets or in accordance with note x for leased assets. Turnover from merchant plants is recognised as output is delivered after taking account of related hedging contracts.Liquidated damages (LDs), in respect of latecommissioning, are included in other operatingincome. Proprietary trading income is recognisedon the basis of completed contracts and themark-to-market value of outstanding contracts at the period end.
iv Pension costsFor defined benefit arrangements, pensioncontributions are charged to the profit and lossaccount so as to spread the cost of pensions overemployees’ working lives. The regular cost isattributed to individual years using the projectedunit credit method. Variations in pension costs,which are identified as a result of actuarialvaluations, are amortised over the averageexpected remaining working lives of employees.Differences between the amounts funded and theamounts charged to the profit and loss accountare treated as either provisions or prepayments in the balance sheet.
For defined contribution arrangements,contributions are charged to the profit and loss account as they fall due.
v Environmental liabilitiesProvision for environmental liabilities is madewhen expenditure on remedial work is probableand the Group is obliged, either legally orconstructively through its environmental policies,to undertake such work. Where the amount isexpected to be incurred over the long-term, theamount recognised is the present value of theestimated future expenditure and the unwindingof the discount is included within interest payableand similar charges.
vi Foreign exchangeThe profits or losses of overseas subsidiaryundertakings, associates and joint ventures are translated into sterling at average rates of exchange. Balance sheets of subsidiaryundertakings and net investments in associatesand joint ventures are translated at closing rates.
Exchange differences arising on the retranslation atclosing rates of overseas subsidiary undertakings’balance sheets and net investments in associatesand joint ventures, together with the adjustmentto convert the balance of retained profits toclosing rates, are taken directly to reserves.
Transactions denominated in foreign currenciesarising in the normal course of business aretranslated into sterling at the exchange rate rulingon the date payment takes place unless related ormatching forward foreign exchange contractshave been entered into, when the rate specified in the contract is used. Monetary assets andliabilities expressed in foreign currencies that arenot covered by hedging arrangements aretranslated into sterling at the rates of exchangeruling at the balance sheet date and anydifference arising on the retranslation of thoseamounts is taken to the profit and loss account.
vii InterestInterest on borrowings relating to major capitalprojects with long periods of development iscapitalised during construction and written-off as part of the total cost over the useful life of the asset. All other interest is charged to theprofit and loss account as incurred. Includedwithin the interest charge in the profit and lossaccount is the unwinding of discounts on long-term provisions.
viii Tangible fixed assetsTangible fixed assets are stated at original cost less accumulated depreciation and anyprovisions for impairment in value. Liquidateddamages, in respect of compensation for plantsnot achieving long-term performance levelsspecified in the original contracts, are recorded as a reduction in the cost of the assets. In thecase of assets constructed by the Group, relatedworks, commissioning and borrowing costs (as per FRS 15) are included in cost. Assets in thecourse of construction are included in tangiblefixed assets on the basis of expenditure incurredat the balance sheet date.
Project development costs (including appropriatedirect internal costs) are capitalised from the pointthat the Board confirms that it is virtually certainthat the project will proceed to completion.
Development expenditure is principally incurred in identifying and developing investmentopportunities and typically includes feasibilitystudies, pre-bid costs, legal, professional and otherrelated advisory costs.
Depreciation is calculated so as to write down the cost of tangible fixed assets to their residualvalue evenly over their estimated useful lives.Estimated useful lives are reviewed periodically,taking into account commercial and technologicalobsolescence as well as normal wear and tear,provision being made where the carrying valuemay not be recoverable.
The depreciation charge is based on the followingestimates of useful lives:
Years
Power stations 20-40
Fixtures, fittings, tools and equipment 4-5
Computer equipment and software 3-5
CCGT hot gas path parts 2-4
Freehold land is not depreciated.
Notes to the accountsFOR THE YEAR ENDED 31 DECEMBER 2003
67annual report 2003

Notes to the accounts continued
ix Decommissioning costsProvision is made for the estimateddecommissioning costs at the end of the usefuleconomic life of the Group‘s power stations andgenerating assets on a discounted basis. Capitaliseddecommissioning costs are depreciated over theuseful lives of the related assets. The unwinding ofthe discount is included in interest payable andsimilar charges.
x Leased assets As lessee Assets leased under finance leases arecapitalised and depreciated over the shorter ofthe lease periods and the estimated operationallives of the assets. The interest element of thefinance lease repayments is charged to the profitand loss account in proportion to the balance ofthe capital repayments outstanding. Rentalspayable under operating leases are charged to theprofit and loss account on a straight line basis.
As lessor Rentals receivable under finance leasesare allocated to accounting periods to give aconstant periodic rate of return on the net cashinvestment in the lease in each period. Theamounts due from lessees under finance leasesare recorded in the balance sheet as a debtor atthe amount of the net investment in the leaseafter making provision for bad and doubtfulrentals receivable.
xi Fixed asset investments Fixed asset investments (other than joint venturesand associates which are discussed in note ii) arestated at cost less provision for any impairment.
xii Current asset investments Current asset investments are stated at the lower of cost and market value. These are included asliquid resources within the cash flow statement.
xiii StocksPlant spares, operating stocks of fuel andconsumables are valued at the lower of cost and net realisable value. These are included ascurrent assets.
xiv Deferred taxationDeferred taxation is provided on timingdifferences, arising from the different treatmentfor accounts and taxation purposes oftransactions and events recognised in the financialstatements of the current year and previous years.Deferred taxation is calculated at the rates atwhich it is estimated that tax will arise. Deferredtax assets and liabilities are not discounted.
xv Financial instruments The Group uses a range of derivative instruments,including interest rate swaps, options, energy-based futures contracts and foreign exchangecontracts and swaps. Derivative instruments are used for hedging purposes, apart fromenergy-based futures contracts, some of whichare used for proprietary trading purposes. Interestdifferentials on derivative instruments are chargedto the profit and loss account as interest costs inthe period to which they relate. Accounting forforeign currency transactions is described in theforeign exchange policy in note vi. Changes in themarket value of futures trading contracts arereflected in the profit and loss account in theperiod in which the change occurs.
Energy-based futures contracts used forproprietary trading purposes are marked tomarket using externally derived market prices andsubsequent movements in the fair value reflectedthrough the profit and loss account. This is not in accordance with the general provisions ofSchedule 4 of the Companies Act 1985, whichrequires that these contracts be stated at thelower of cost and net realisable value or that, if revalued, any revaluation difference be taken to a revaluation reserve. However, the Directorsconsider that these requirements would fail toprovide a true and fair view of the results for theyear since the marketability of energy tradingcontracts enables decisions to be taken continuallyon whether to hold or sell them. Accordingly themeasurement of profit in any period is properlymade by reference to market values. The effect ofthe departure on the financial statements is toreduce the loss for the year by £1 million (2002:increase the profit by £2 million) and decrease thenet assets at 31 December 2003 by £4 million(2002: £nil).
xvi Debt instruments New borrowings are stated at net proceedsreceived after deduction of issue costs. The issue costs of debt instruments are charged to the profit and loss account over the life of the instrument.
68 International Power

1 GROUP SEGMENTAL ANALYSISYear ended Year ended
31 December 31 December2003 2002
£m £m
a) By class of business
Group turnover
Electricity generation 1,273 1,129
Less: turnover of joint ventures (136) (122)
Less: turnover of associates (285) (290)
852 717
Profit before interest and taxation (excluding all exceptional items)
Electricity generation 313 417
Corporate costs (28) (29)
285 388
b) By geographical area
Group turnover
North America 414 315
Europe 474 440
Middle East 33 –
Australia 224 226
Rest of the World 128 148
1,273 1,129
Less: turnover of joint ventures (136) (122)
Less: turnover of associates (285) (290)
852 717
Profit before interest and taxation (excluding all exceptional items)
North America 2 99
Europe 103 100
Middle East 23 9
Australia 101 101
Rest of the World 84 108
313 417
Corporate costs (28) (29)
285 388
An analysis of exceptional items is given in note 8.
The loss before interest and taxation after exceptional items are for: North America loss of £402 million; Europe profit of £110 million and Rest of the World profit of £139 million (2002: Europe loss of £3 million, Rest of the World profit of £150 million).
North America loss before interest and taxation includes other income in respect of the late commissioning and performance recovery of new power plantsamounting to £27 million (year ended 31 December 2002: £102 million).
Sales of electricity generated in each geographic region are made solely to customers in the same geographical area.
The comparative figures for turnover and operating costs have been restated to conform with the current basis of presentation. The segmental reporting has been changed in the current period to better represent the way in which the business is now managed.
69annual report 2003

Notes to the accounts continued
1 GROUP SEGMENTAL ANALYSIS continued31 December 31 December
2003 2002c) Net assets employed by geographical area £m £m
North America 671 1,197
Europe 549 536
Middle East 72 75
Australia 976 787
Rest of the World 315 303
Corporate and development (56) (66)
Net operating assets 2,527 2,832
Borrowings (1,435) (1,654)
Cash and short-term deposits 743 842
Deferred tax (205) (219)
Corporation tax (86) (53)
Goodwill – on acquisition of associated undertakings 17 20
Goodwill – on acquisition of subsidiary undertakings 1 1
Net assets per consolidated balance sheet 1,562 1,769
2 NET OPERATING COSTSYear ended Year ended
31 December 31 December2003 2002
Excluding exceptional items: £m £m
Cost of sales 729 558
Other operating costs 64 85
Other operating income (66) (134)
Net operating costs 727 509
Other operating income includes compensation for the late commissioning of plant, billings in respect of operations and maintenance services and profits onsale of development sites. Exceptional items would increase cost of sales by £404 million (2002: £103 million).
3 PROFIT/(LOSS) ON ORDINARY ACTIVITIES BEFORE TAXATIONYear ended Year ended
31 December 31 December2003 2002
Profit/(loss) on ordinary activities before taxation is stated £m £mafter charging/(crediting):
Depreciation of tangible fixed assets 108 111
Amortisation of intangible fixed assets – (1)
Other amortisation 1 2
Development costs net of recoveries and amounts capitalised 14 8
Operating exceptional items (note 8) 369 103
Property lease rentals payable (net of recoveries) 3 2
Foreign exchange (gains)/losses (net) (19) 7
Auditors’ remuneration – statutory audit:
Fees due to the lead auditors, KPMG (including audit of the Company £0.5 m (2002: £0.4m)) 1.0 0.7
Fees due to other auditors 0.1 0.1
1.1 0.8
Auditors’ remuneration – other fees paid to the lead auditors and their associates for services:
Accounting consultations (including services to the Company £0.3m (2002: £0.3m)) 0.3 0.4
Due diligence assistance (including services to the Company £0.1m (2002: £0.2m)) 0.1 0.2
The Audit Committee and the firm of external auditors have safeguards to avoid the possibility that the auditors’ objectivity and independence could becompromised. These safeguards include the implementation of a policy on the use of the external auditor for non-audit related services. This policy has been revised during the year to incorporate the provisions of the Sarbanes-Oxley Act 2002 and subsequent Securities and Exchange Commission (SEC) rules.
70 International Power

Where it is deemed that the work to be undertaken is of a nature that is generally considered reasonable to be completed by the auditor of the Group for sound commercial and practical reasons, the conduct of such work will be permissible provided that it has been pre-approved by the Audit Committee. Examples of pre-approved services include the completion of regulatory audits, provision of taxation and regulatory advice, reporting to the SEC and the completion of certain financial due diligence work. All these services are also subject to a pre-defined fee limit. Any work performed in excess of this limit must be approved by the Chief Financial Officer and the Audit Committee.
4 INTEREST RECEIVABLE AND SIMILAR INCOMEYear ended Year ended
31 December 31 December2003 2002
Group interest receivable and similar income £m £m
Interest receivable and similar income 23 24
Foreign exchange gains (net) 19 –
Total Group interest receivable and similar income 42 24
5 INTEREST PAYABLE AND SIMILAR CHARGES
Year ended Year ended31 December 31 December
2003 2002a) Group interest payable and similar charges £m £m
Interest on:
Bank loans and overdrafts 101 102
Other borrowings 22 17
123 119
Foreign exchange losses (net) – 7
Interest capitalised (2) (5)
Group interest payable and similar charges – ordinary 121 121
Exceptional interest (note 8) 16 –
Total Group interest payable and similar charges 137 121
b) Interest payable of joint ventures and associates
Share of interest payable of joint ventures 10 12
Share of interest payable of associates 22 23
Total interest payable of joint ventures and associates 32 35
6 DIRECTORS’ AND EMPLOYEES’ REMUNERATION
a) Directors’ remunerationDetails of Directors’ remuneration are set out on pages 46 to 59.
b) Employees’ remuneration Year ended Year ended
31 December 31 December2003 2002
£m £m
Salaries and other staff costs, including Directors’ remuneration were as follows:
Wages and salaries 68 63
Social security costs 4 3
Pension costs (note 7) 6 5
Total employees’ remuneration 78 71
Less: amounts capitalised as part of assets in the course of construction (1) (1)
Total staff costs 77 70
71annual report 2003

Notes to the accounts continued
6 DIRECTORS’ AND EMPLOYEES’ REMUNERATION continued
Employee numbers Year ended Year ended31 December 31 December
2003 2002No. No.
Average number of employees during the financial year, analysed by geographic segment was:
North America 212 207
Europe 746 769
Middle East 342 43
Australia 591 593
Rest of the World 362 367
Corporate and development 163 146
Total average number of employees 2,416 2,125
7 PENSION SCHEME FUNDINGUK: The majority of pensions for UK employees are funded through the industry-wide scheme, the Electricity Supply Pension Scheme (ESPS) which is a definedbenefit scheme with assets invested in separate trustee administered funds. The ESPS is divided into sections, and the International Power Group of ESPS wasopened to members on 1 April 2002 and employees’ past service rights were transferred into the Group later that year.
For 2002 SSAP 24 disclosures, the pension expense was taken to be equal to the total contributions paid, as assets and liabilities in respect of members’pensionable service prior to 1 April 2002 were not transferred to the Group until late 2002.
Pension costs for 2003 have been calculated using assumptions consistent with those used to assess the initial rate of contributions paid by the Group, and basedon market conditions at the start of the accounting period.
The pension cost for 2003 is £3.1 million, comprising £2.6 million regular cost and £0.5 million variation cost.
The principal assumptions used to calculate these pension costs are set out below:
Pre-retirement investment return 6.5% pa
Post-retirement investment return 5.0% pa
Salary increases 3.8% pa
Pension increases in deferment 2.5% pa
Pension increases in payment 2.5% pa
The actuarial value of assets as at 31 March 2003, the date of the first formal actuarial valuation, was £33 million. The accrued liabilities valued on the projectedunit method using assumptions set out below, were £43 million. The market value of assets was, therefore, 77% of accrued liabilities. Arrangements have beenmade to make good the past service deficit over the average future working lifetime of the membership (calculated to be approximately 12 years).
The principal assumptions used for the 31 March 2003 valuation are:
Pre-retirement investment return 6.6% pa
Post-retirement investment return 5.1% pa
Salary increases 4.1% pa
Pension increases in deferment 2.7% pa
Pension increases in payment 2.7% pa
AUSTRALIA: Employees at Hazelwood participate in a standard Australian superannuation fund called Equipsuper. This plan provides benefits primarily foremployees in the electricity, gas and water industry, and was developed from the scheme sponsored by the State Electricity Commission of Victoria.
At 31 December 2003, the actuarial value of assets was 104% of accrued liabilities. The assets were £54 million and liabilities £52 million. The pension cost for2003 was £2 million.
The principal assumptions are set out below:Valuation date 31 December
2003
Principal assumptions:
Investment return 7.5% pa
Salary increases 5.0% pa
Pensions increases n/a
In other countries employees are members of local social security schemes and in some cases defined contribution plans. The charge for 2003 in respect of defined contribution plans was £1 million.
72 International Power

73annual report 2003
FRS17In accordance with the requirements of FRS 17 (Retirement Benefits), this note discloses the main financial assumptions made in valuing the liabilities of theschemes and the fair value of assets held. However, as permitted by FRS 17, the costs, accruals and prepayments recorded in the financial statements continue to be reported under the requirements of SSAP 24 (Accounting for Pension Costs).
The valuation used for FRS 17 disclosures for the UK schemes has been based on the most recent actuarial valuations at 30 November 2001, 31 March 2002 and 31 March 2003, and updated by qualified independent actuaries to take account of the requirements of FRS 17 to assess the liabilities of the schemes at 31 December 2003.
The Group operates a number of defined benefit schemes for employees of its overseas businesses. Full actuarial valuations of these schemes have been carried out within the last three years and results have been updated to 31 December 2003 by qualified independent actuaries.
The assumptions used to calculate scheme liabilities under FRS 17 are:
31 December 2003 31 December 2002 31 December 2001UK Australia UK Australia UK Australia% % % % % %
Financial assumptions
Discount rate 5.40 7.50 5.50 7.00 5.80 7.25
Rate of increase in salaries 4.30 4.00 3.80 4.00 4.00 4.00
Inflation rate 2.80 3.00 2.30 3.50 2.50 3.00
Increase to deferred benefits during deferment 2.90 n/a 2.50 n/a 2.60 n/a
Increases to pensions payments 2.90 n/a 2.50 n/a 2.60 n/a
The amounts required to be disclosed by FRS 17 in respect of the performance statements were:
Analysis of amounts that would have been charged to operating profit in respect of defined benefit schemes Group Group2003 2002
£m £m
Current service (5) (3)
Past service cost – (1)
Total operating charge (5) (4)
Analysis of amounts that would have been credited to other finance income Group Group2003 2002
£m £m
Expected return on schemes’ assets 5 5
Interest on schemes’ liabilities (5) (4)
Net return – 1
Analysis of amounts that would have been recognised in the consolidated statement Group Group
of total recognised gains and losses 2003 2002£m £m
Actual return less expected return on schemes’ assets 5 (11)
Experience gains/(losses) arising on schemes’ liabilities (3) (1)
Changes in the assumptions underlying the present value of schemes’ liabilities (7) (5)
Currency translation adjustment 1 –
Actuarial loss recognised in the consolidated statement of total recognised gains and losses (4) (17)
History of experience gains and losses Group Group2003 2002
Difference between the actual and expected return on schemes’ assets:
Amount (£m) 5 (11)
Percentage of schemes’ assets 5% 15%
Experience gains and losses on schemes’ liabilities:
Amount (£m) (3) (1)
Percentage of schemes’ liabilities 3% 1%
Total amount recognised in the consolidated statement of total recognised gains and losses:
Amount (£m) (4) (17)
Percentage of the present value of schemes’ liabilities 4% 22%

Notes to the accounts continued
7 PENSION SCHEME FUNDING continued31 December 2003 31 December 2002 31 December 2001
UK Australia UK Australia UK Australia% % % % % %
The assets in the schemes and expected rates of return (weighted averages) were:Long-term rate of return expected
Equities 7.8 7.6 7.0 7.5 7.4 7.5
Bonds 5.1 4.8 4.5 5.5 4.9 5.5
Other 6.6 6.1 4.8 5.5 – 5.5
UK Australia Total UK Australia Total UK Australia Total£m £m £m £m £m £m £m £m £m
Assets in schemes
Equities 36 35 71 27 24 51 19 23 42
Bonds 5 14 19 4 12 16 16 12 28
Other 4 5 9 3 4 7 – 5 5
Total market value of assets 45 54 99 34 40 74 35 40 75
Present value of scheme liabilities (58) (50) (108) (43) (36) (79) (39) (25) (64)
(Deficit)/surplus in the scheme (13) 4 (9) (9) 4 (5) (4) 15 11
Related deferred tax asset/(liability) 4 (1) 3 3 (1) 2 1 (5) (4)
Net pension (liability)/asset (9) 3 (6) (6) 3 (3) (3) 10 7
Other assets principally comprise property and cash.
If the above amounts had been recognised in the financial statements, the Group‘s net assets and profit and loss reserve at 31 December would be as follows:
Group Group Group2003 2002 2001
£m £m £m
Net assets
Net assets excluding pension asset/(liability) 1,562 1,769 1,697
FRS 17 pension (liability)/asset (6) (3) 7
Net assets including FRS 17 pension (liability)/asset 1,556 1,766 1,704
Reserves
Profit and loss reserve excluding net pension (liability)/asset 113 330 260
Net pension (liability)/asset (6) (3) 7
Profit and loss reserve including FRS 17 pension (liability)/asset 107 327 267
Group Group2003 2002
£m £m
Movement in (deficit)/surplus during the year:
(Deficit)/surplus in the schemes at the beginning of the year (5) 11
Current service cost (5) (3)
Contributions 5 4
Past service cost – (1)
Other finance income – 1
Actuarial loss (4) (17)
Deficit in the schemes at the end of the year (9) (5)
74 International Power

8 EXCEPTIONAL ITEMSYear ended Year ended
31 December 31 December2003 2002
£m £m
Net operating exceptional items charged/(credited):
Deeside impairment – 45
Rugeley impairment – 58
Impairment of US plant 404 –
Reversal of HUBCO impairment (35) –
Net operating exceptional items 369 103
Exceptional income from investments:
Backlog dividend received from KAPCO – (42)
Exceptional income from investments – (42)
Total operating exceptional items and investment income 369 61
Non-operating exceptional items credited:
Profit on disposal of a 5% holding in HUBCO (17) –
Profit on disposal of a Czech fixed asset investment (7) –
Release of provision in respect of sale of Chinese operations (3) –
Non-operating exceptional items (27) –
Exceptional interest charges:
Write off of unamortised finance charges 16 –
Exceptional interest payable and similar charges 16 –
Total exceptional items before attributable taxation 358 61
Taxation on exceptional items (26) (1)
Total exceptional items after attributable taxation 332 60
The revised carrying values of the plants were determined by applying a risk-adjusted discount rate of 9.7% to the post-tax cash flows expected from the plantover their remaining useful lives.
9 TAX ON PROFIT ON ORDINARY ACTIVITIESYear ended Year ended
31 December 31 December2003 2002
£m £m
a) Analysis of charge in year
Current taxation
UK corporation tax at 30% (year ended 31 December 2002: 30%) 26 25
Foreign taxation 13 21
Share of joint ventures’ taxation 2 2
Share of associates’ taxation 16 17
Total current taxation charge for year 57 65
Deferred taxation
Origination and reversal of timing differences (30) 11
Share of joint ventures’ deferred taxation 1 –
Total deferred taxation charge for year (29) 11
Total taxation charge for the year 28 76
Included in the tax on profit are the following amounts relating to exceptional items:
Operating exceptional items (deferred tax) (27) (14)
Exceptional income from investments (current tax) – 13
Non-operating exceptional items (current tax) 2 –
Exceptional interest charges (current tax) (1) –
Taxation credit on exceptional items (26) (1)
75annual report 2003

Notes to the accounts continued
9 TAX ON PROFIT ON ORDINARY ACTIVITIES continued
b) Reconciliation of current tax charge
The tax charge for the year on ordinary activities varied from the standard rate of UK corporation tax as follows:
2003 2002
Current Deferred Total Current Deferred Totaltax tax tax tax£m £m £m £m £m £m
Corporation tax at 30% 52 – 52 77 – 77
Permanent differences 6 – 6 5 – 5
Origination or reversal of timing differences 2 (2) – (25) 25 –
Tax holidays (10) – (10) (9) – (9)
Effect of tax rate applied to overseas earnings 6 – 6 4 – 4
Tax charge for the year before exceptional items 56 (2) 54 52 25 77
Exceptional items 1 (27) (26) 13 (14) (1)
Tax charge for the year 57 (29) 28 65 11 76
10 PROFIT OF THE PARENT COMPANY
The profit of the parent company for the financial year amounted to £121 million (year ended 31 December 2002: loss of £176 million).By virtue of Section 230 of the Companies Act 1985, the Company is exempt from presenting a separate profit and loss account.
11 EARNINGS PER SHARE Year ended Year ended31 December 31 December
2003 2002 a) Earnings per share – basic pence pence
Before exceptional items 10.2 15.5
Exceptional items (29.9) (5.4)
After exceptional items (19.7) 10.1
b) Earnings per share – diluted
Before exceptional items 10.1 15.5
Exceptional items (29.9) (5.4)
After exceptional items (19.7) 10.1
c) Basis of calculation – earnings £m £m
Profit attributable to shareholders before exceptional items 113 173
Exceptional items (332) (60)
Loss/profit attributable to shareholders after exceptional items (219) 113
d) Basis of calculation – number of Ordinary Shares Million Million
Weighted average number of issued Ordinary Shares 1,114.1 1,117.6
Weighted average number of shares held by
Employee Share Ownership Plans (ESOPs) (3.2) (2.2)
1,110.9 1,115.4
Dilutive potential Ordinary Shares:
Employee share schemes 9.2 2.6
Weighted average number of Ordinary Shares takingaccount of applicable dilutive instruments 1,120.1 1,118.0
FRS 14 requires presentation of diluted earnings per share when a company could be called upon to issue shares that would decrease net profit or increase net loss per share. A net loss per share would only be increased by the exercise of out-of-the money share options. Since it seems inappropriate to assume that option holders would act irrationally, no adjustment has been made for out-of-the-money options and hence diluted EPS (after exceptional items) equalsbasic EPS (after exceptional items).
76 International Power

12 INTANGIBLE FIXED ASSETSGoodwill Negative Total
goodwillThe Group £m £m £m
Cost
At 1 January 2003 10 (10) –
Exchange rate differences 1 (1) –
At 31 December 2003 11 (11) –
Amortisation
At 1 January 2003 (2) 3 1
(Charged)/credited in the year (2) 2 –
At 31 December 2003 (4) 5 1
Net book value at 31 December 2003 7 (6) 1
Net book value at 31 December 2002 8 (7) 1
Goodwill arising on the acquisition of joint ventures and associated undertakings is set out in note 14 – fixed asset investments.
13 TANGIBLE FIXED ASSETS Freehold Plant, Assets in Totalland and machinery course ofbuildings and construction
equipmenta) The Group £m £m £m £m
Cost
At 1 January 2003 82 2,903 88 3,073
Additions 4 68 48 120
Compensation for long-term performance shortfalls – (127) – (127)
Reclassifications and transfers 2 98 (111) (11)
Disposals (1) (5) – (6)
Exchange rate differences 2 76 (2) 76
At 31 December 2003 89 3,013 23 3,125
Depreciation and diminution in value
At 1 January 2003 18 582 – 600
Provided during the year 3 105 – 108
Impairment – 404 – 404
Compensation for long-term performance shortfalls – (33) – (33)
Reclassifications and transfers – (5) – (5)
Disposals – (3) – (3)
Exchange rate differences 1 5 – 6
At 31 December 2003 22 1,055 – 1,077
Net book value at 31 December 2003 67 1,958 23 2,048
Net book value at 31 December 2002 64 2,321 88 2,473
Interest capitalised in the year was £2 million. On a cumulative basis, the net book value of interest capitalised is £85 million.
The total value of land that is not depreciated included within freehold land and buildings is £27 million (31 December 2002: £28 million).
77annual report 2003

Notes to the accounts continued
13 TANGIBLE FIXED ASSETS continuedFreehold Plant, Totalland and machinerybuildings and
equipmentb) The Company £m £m £m
Cost
At 1 January 2003 1 5 6
Additions – – –
At 31 December 2003 1 5 6
Depreciation and diminution in value
At 1 January 2003 1 3 4
Provided during the year – 1 1
At 31 December 2003 1 4 5
Net book value at 31 December 2003 – 1 1
Net book value at 31 December 2002 – 2 2
14 FIXED ASSET INVESTMENTS Joint ventures Associated undertakings____________ ___________________________
Share of Share of Goodwill Other Totalnet assets net assets investments
a) The Group £m £m £m £m £m
At 1 January 2003 102 283 20 102 507
Share of post-tax profit 19 94 (2) – 111
Additions 8 – – 2 10
Distribution and loan repayments (10) (58) – (1) (69)
Disposals – (4) – (4) (8)
Reclassifications and transfers 7 – – – 7
Amortisation – – – (1) (1)
Exchange rate differences – (17) (1) (1) (19)
At 31 December 2003 126 298 17 97 538
Included within the Group’s share of net assets of joint ventures and associated undertakings is net debt of £712 million (31 December 2002: £503 million). These obligations are generally secured by the assets of the respective joint venture or associate borrower and are not guaranteed by International Power plc or any other Group company.
31 December 31 December2003 2002
Group share of associated undertakings’ net assets £m £m
Share of fixed assets 821 602
Share of current assets 226 221
1,047 823
Share of liabilities due within one year (79) (157)
Share of liabilities due after more than one year (670) (383)
(749) (540)
Share of net assets 298 283
31 December 31 December2003 2002
Group share of joint ventures’ net assets £m £m
Share of fixed assets 302 260Share of current assets 35 40
337 300
Share of liabilities due within one year (37) (46)Share of liabilities due after more than one year (174) (152)
(211) (198)Share of net assets 126 102
78 International Power
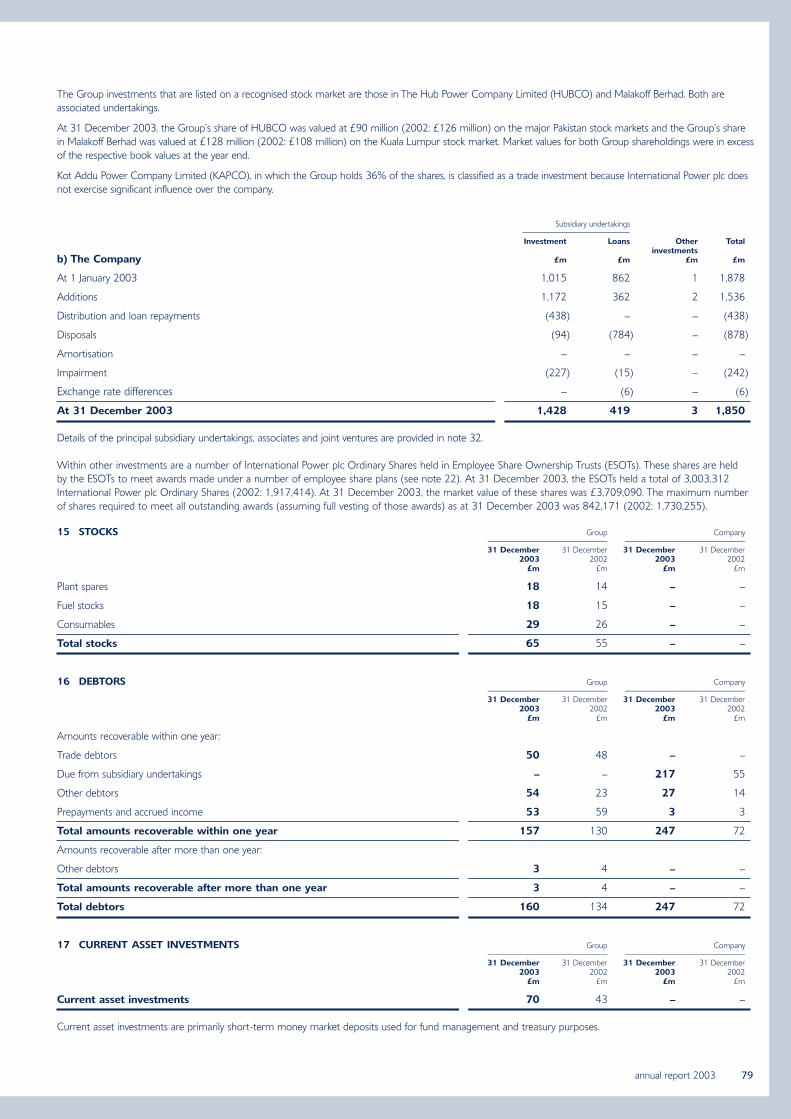
The Group investments that are listed on a recognised stock market are those in The Hub Power Company Limited (HUBCO) and Malakoff Berhad. Both areassociated undertakings.
At 31 December 2003, the Group’s share of HUBCO was valued at £90 million (2002: £126 million) on the major Pakistan stock markets and the Group’s sharein Malakoff Berhad was valued at £128 million (2002: £108 million) on the Kuala Lumpur stock market. Market values for both Group shareholdings were in excessof the respective book values at the year end.
Kot Addu Power Company Limited (KAPCO), in which the Group holds 36% of the shares, is classified as a trade investment because International Power plc doesnot exercise significant influence over the company.
Subsidiary undertakings
Investment Loans Other Totalinvestments
b) The Company £m £m £m £m
At 1 January 2003 1,015 862 1 1,878
Additions 1,172 362 2 1,536
Distribution and loan repayments (438) – – (438)
Disposals (94) (784) – (878)
Amortisation – – – –
Impairment (227) (15) – (242)
Exchange rate differences – (6) – (6)
At 31 December 2003 1,428 419 3 1,850
Details of the principal subsidiary undertakings, associates and joint ventures are provided in note 32.
Within other investments are a number of International Power plc Ordinary Shares held in Employee Share Ownership Trusts (ESOTs). These shares are held by the ESOTs to meet awards made under a number of employee share plans (see note 22). At 31 December 2003, the ESOTs held a total of 3,003,312International Power plc Ordinary Shares (2002: 1,917,414). At 31 December 2003, the market value of these shares was £3,709,090. The maximum number of shares required to meet all outstanding awards (assuming full vesting of those awards) as at 31 December 2003 was 842,171 (2002: 1,730,255).
15 STOCKS Group Company______________________________ ______________________________31 December 31 December 31 December 31 December
2003 2002 2003 2002£m £m £m £m
Plant spares 18 14 – –
Fuel stocks 18 15 – –
Consumables 29 26 – –
Total stocks 65 55 – –
16 DEBTORS Group Company______________________________ ______________________________31 December 31 December 31 December 31 December
2003 2002 2003 2002£m £m £m £m
Amounts recoverable within one year:
Trade debtors 50 48 – –
Due from subsidiary undertakings – – 217 55
Other debtors 54 23 27 14
Prepayments and accrued income 53 59 3 3
Total amounts recoverable within one year 157 130 247 72
Amounts recoverable after more than one year:
Other debtors 3 4 – –
Total amounts recoverable after more than one year 3 4 – –
Total debtors 160 134 247 72
17 CURRENT ASSET INVESTMENTS Group Company______________________________ ______________________________31 December 31 December 31 December 31 December
2003 2002 2003 2002£m £m £m £m
Current asset investments 70 43 – –
Current asset investments are primarily short-term money market deposits used for fund management and treasury purposes.
79annual report 2003

Notes to the accounts continued
18 CREDITORS: AMOUNTS FALLING DUE WITHIN ONE YEAR Group Company______________________________ _______________________________31 December 31 December 31 December 31 December
2003 2002 2003 2002£m £m £m £m
Trade creditors 71 106 1 1
Amounts due to subsidiary undertakings – – 814 562
Other creditors 58 34 14 11
Other taxation and social security – – 1 1
Corporation tax 86 53 19 12
Accruals and deferred income 100 134 41 52
Bank loans (secured) 531 810 – –
6.25% Euro Dollar Bonds 2003 – 37 – 37
2% Convertible US Dollar Bonds 2005 – 231 – –
Total bonds – 268 – 37
Total creditors: amounts falling due within one year 846 1,405 890 676
The bank loans are secured by fixed and floating charges over the assets of certain subsidiary undertakings.
Secured loans without recourseSecured bank loans without recourse are those where the obligation to repay lies solely with the subsidiary undertaking and are secured solely on the assets of the subsidiary undertaking concerned.
At 31 December 2003, we were in discussions with bank groups in relation to claimed technical defaults on the non-recourse debt for the US merchant portfolio.As these issues were not formally resolved at 31 December 2003, the debt at ANP has been reported as current non-recourse debt in our accounts.
19 CREDITORS: AMOUNTS FALLING DUE AFTER Group Company
MORE THAN ONE YEAR______________________________ _______________________________31 December 31 December 31 December 31 December
2003 2002 2003 2002£m £m £m £m
Other creditors 5 7 – –
Bank loans (secured):
between one and five years 262 138 – –
over five years 442 438 – –
Total bank loans 704 576 – –
2% Convertible US Dollar Bonds 2005 62 – – –
6.25% Convertible US Dollar Bonds 2023 138 – – –
Total bonds 200 – – –
Total creditors: amounts falling due after more than one year 909 583 – –
The bank loans are secured by fixed and floating charges over the assets of certain subsidiary undertakings.
Convertible bonds
2% Convertible US Dollar Bonds 2005On 24 November 2000, International Power (Cayman) Limited, a wholly-owned subsidiary company incorporated in the Cayman Islands, issued US$357 million2% convertible notes due 2005, convertible into Preference Shares of International Power (Cayman) Limited at the holder’s option, exchangeable for OrdinaryShares of, and unconditionally guaranteed on a senior unsecured basis by, International Power plc.
The notes are convertible into Ordinary Shares of International Power plc at a conversion price of 300p at any time between 4 January 2001 and 23 November2005. Each US$1,000 principal amount of notes will entitle the holder to convert into a US$1,000 paid up value of Preference Shares of International Power(Cayman) Limited. Investors may elect to receive their Ordinary Shares in the form of American Depositary Receipts.
On 24 November 2003, US$254 million of the notes were redeemed at the holder’s option at a redemption price of 107.1% of its principal amount, togetherwith accrued and unpaid interest. The balance of US$103 million will remain for a further two-year period at an effective interest rate of 4.6%.
The ‘unput’ convertible unsecured notes will be redeemed on 24 November 2005 at a redemption price of 112.4% of its principal amount. Accordingly theconvertible bond is now shown within long-term liabilities.
3.75% Convertible US Dollar BondsOn 22 August 2003, International Power (Jersey) Limited, a wholly-owned subsidiary company incorporated in Jersey, issued US$252.5 million 3.75% convertiblenotes due 2023, convertible into Preference Shares of International Power (Jersey) Limited at the holder’s option, immediately exchangeable for Ordinary Shares of,and unconditionally guaranteed by, International Power plc.
80 International Power

19 CREDITORS: AMOUNTS FALLING DUE AFTER MORE THAN ONE YEAR (continued)The notes are convertible into Ordinary Shares of International Power plc at a conversion price of 200p at any time between 2 October 2003 and 12 August2023. Each US$1,000 principal amount of notes will entitle the holder to convert into a US$1,000 paid up value of Preference Shares of International Power (Jersey) Limited.
The notes may be redeemed at the holder’s option at their principal amount, together with accrued interest, to the date fixed for redemption.
If the conversion option is not exercised, the convertible unsecured notes will be redeemed on 22 August 2023 at a redemption price equivalent to their principal amount.
Premium on redemption of convertible bondsProvision is made for the possible premium on redemption of the 2005 and 2023 convertible bonds. This is included within the carrying amount of the bonds. At 31 December 2003, the amount accrued was £8 million (31 December 2002: £13 million). The finance cost charged in the profit and loss account comprises the aggregate of the coupon on the convertible unsecured notes and the proportion of the premium on redemption that relates to the financial year.
20 PROVISIONS FOR LIABILITIES AND CHARGES Deferred Rationalisation Other Totaltax and restructuring
a) The Group £m £m £m £m
At 1 January 2003 219 11 25 255
Charged to profit and loss 28 1 1 30
Credited to profit and loss (58) – (4) (62)
Provisions utilised/released – (3) (2) (5)
Transfer to corporation tax (4) – – (4)
Foreign exchange 20 – 4 24
At 31 December 2003 205 9 24 238
The majority of the rationalisation and restructuring provision relates to liabilities in respect of onerous property leases and employee-related compensation. Other provisions primarily comprise amounts provided for long service and annual leave liabilities and for mine site restoration. These liabilities are not expected toarise in the short-term.
Deferred Rationalisation Totaltax and restructuring
b) The Company £m £m £m
At 1 January 2003 36 11 47
Provisions utilised/released – (3) (3)
Reclassifications and transfers (6) – (6)
At 31 December 2003 30 8 38
21 DEFERRED TAXATION
Deferred taxation accounted for in the consolidated balance sheet and the potential amounts of deferred taxation are:31 December 31 December
2003 2002£m £m
Full potential deferred tax liabilities
Tangible fixed assets accelerated capital allowances (175) (237)
Other timing differences (21) (24)
Dividends of overseas subsidiary undertakings (16) (17)
Total gross deferred tax liabilities (212) (278)
Less: deferred tax liabilities not provided – –
Total deferred tax liabilities provided (212) (278)
Full potential deferred tax assets
Provisions 3 2
Tax losses 86 45
Other timing differences 35 12
Total gross deferred tax assets 124 59
Less: deferred tax assets not recognised (117) –
Total deferred tax asset recognised 7 59
Net deferred tax liability recognised (205) (219)
Deferred tax assets would be offset against suitable taxable profits when they arise.
81annual report 2003

Notes to the accounts continued
22 SHARE CAPITAL Authorised Ordinary Issued and fully paidShares of 50p £m Ordinary Shares of 50p £m
At 1 January 2003 1,700,000,000 850 1,117,561,520 559
Issue of shares under the Sharesave Scheme – – 1,944 –
Issue of shares under Executive Share Option Scheme – – 180,853 –
Shares bought back and cancelled – – (10,652,323) (5)
At 31 December 2003 1,700,000,000 850 1,107,091,994 554
Deferred SharesThe Company has 21 Deferred Shares of 1 pence each in issue. These shares were issued to ensure the demerger was effected as efficiently as possible. The holders of Deferred Shares have no rights to receive dividends or to attend or vote at any general meeting.
Unclassified Share Further to the redemption of the Special Share in August 2000, the Company’s authorised share capital includes one unclassified share of £1.
Employee Share Plans
a) Share Options PlansThe Company operates the following employee share plans for which shares may be issued by the Company out of authorised but unissued share capital uponexercise of options: the 2002 Performance Share Plan; the UK Approved and Unapproved Executive Share Option Plans; the Global Executive Share Option Plan; the UK Approved Sharesave Plan and the Global Sharesave Plan. The UK Approved Sharesave Plan and the Global Sharesave Plan are savings related and enableemployees to invest up to a maximum of £250 per month.
Number of Ordinary Shares (millions)
Sharesave Executive Performance TotalSchemes Share Option Share
Note Schemes Plan
i) Outstanding at 1 January 2003 3.7 11.2 – 14.9
Granted 2.2 11.8 3.8 17.8
ii) Exercised/lapsed (0.2) (0.3) – (0.5)
Total options outstanding at 31 December 2003 5.7 22.7 3.8 32.2
Number of Ordinary Shares
Option Date 31 December 31 Decemberprice exercisable 2003 2002
i) Options outstanding
Sharesave Schemes 307.51p 2003 – 4,486
250.00p 2003 775 775188.00p 2004 12,159 18,856
188.00p 2006 8,976 17,952200.00p 2004 6,780 6,780
200.00p 2006 7,592 16,029
90.00p 2005 1,076,670 1,181,04090.00p 2007 2,492,950 2,492,950
110.00p 2006 291,557 –
110.00p 2008 216,667 –79.00p 2006 875,724 –
79.00p 2008 748,259 –
Executive Share Option Schemes 297.94p 1996-2003 52,935 54,085
336.21p 1997-2004 101,858 101,858
306.14p 1998-2005 290,736 290,736323.23p 1999-2006 472,639 472,639
386.09p 2000-2007 555,541 555,541
352.61p 2001-2008 761,052 766,660331.42p 2002-2007 33,206 33,206
311.75p 2003-2010 2,689,810 2,704,525
235.00p 2004-2011 1,935,593 1,949,477217.00p 2004-2011 165,778 165,778
196.00p 2005-2012 4,038,393 4,056,787
70.00p 2006-2013 11,609,290 –
Performance Share Plan 2002 84.00p 2005-2006 3,807,057 –
Total options outstanding 32,251,997 14,890,160
82 International Power

Option Number Nominal Considerationprice of options value
ii) Options exercised £ £
Executive Share Option Schemes 70.00p 180,853 90,426 126,597
Sharesave Schemes 90.00p 1,944 972 1,750
Total options exercised during the year 182,797 91,398 128,347
b) Profit Sharing Share SchemeIn addition to the above, the Company operates an Inland Revenue Approved Profit Sharing Share Scheme. No further appropriations have been made in respect of this scheme. On 26 May 2003, 454,285 shares in International Power plc, representing the balance of the shares held in trust were released to 1,885 presentand former employees of the Group. No further appropriations were made in respect of this scheme during the year.
c) Demerger Share PlanAt demerger, the Board of the Company established the Demerger Share Plan to provide an incentive to those employees (other than Executive Directors) whowere remaining in continuous full-time employment with the Company. On 3 October 2000, the Board made conditional awards of 288,359 shares to 181employees of the Company. No specific purchases of shares were made in respect of this Plan as the Company utilised the balance of shares unallocated from twoformer employee share plans which ceased operation at demerger to meet the vesting of conditional awards under this plan. During the year, a total of 15,241shares were released to individuals ceasing employment with the Company in accordance with their entitlement under the rules of the Demerger Share Plan. On 3October 2003, the Demerger Share Plan vested and a total 244,094 shares were released to employees.
d) 2002 Performance Share PlanAt the AGM in May 2003, shareholders approved the establishment of the 2002 Performance Share Plan. The Company granted to the Trustee an option toacquire 3,807,057 Ordinary Shares in the Company at an option price of 84 pence per share. This option can only be exercised to the extent required to satisfyconditional awards made on 10 March 2003 under the 2002 Performance Share Plan. These conditional awards can only vest after the end of the relevantperformance period and only to the extent to which the performance conditions have been achieved. The performance period ends on 31 December 2005. Noshares were released in respect of this share plan during 2003.
e) Managers’ share bonus arrangementsDuring 2003 a total of 1,800,000 shares in International Power were acquired in respect of the annual incentive arrangements for Executive Directors and seniormanagers for a consideration of £1.5 million. These shares have been placed in an Employee Share Ownership Trust.
f) Employee Share SchemesThe Group takes advantage of the exemption granted under UITF 17 (Employee Share Schemes) whereby no compensation expense need be recorded for SAYE employee schemes.
23 RESERVES
Share Share Capital Capital Profit Total capital premium redemption reserve and loss shareholders’
account reserve account funds – equitya) The Group £m £m £m £m £m £m
At 1 January 2003 559 289 140 422 330 1,740
Share buyback (5) – 5 – (13) (13)
Loss for the financial year – – – – (219) (219)
Other recognised gains and losses relating to the year (net) – – – – 15 15
At 31 December 2003 554 289 145 422 113 1,523
b) The Company £m £m £m £m £m £m
At 1 January 2003 559 289 140 415 137 1,540
Share buyback (5) – 5 – (13) (13)
Profit for the financial year – – – – 121 121
At 31 December 2003 554 289 145 415 245 1,648
The share premium account, capital redemption reserve and capital reserve are not distributable.
The cumulative amount of goodwill set off to reserves prior to the adoption of FRS 10 on acquisition of subsidiary undertakings is £95 million (31 December 2002:£95 million). £143 million of the Company’s profit and loss reserve is not distributable as it arose from unrealised gains on intra-group transfers.
83annual report 2003
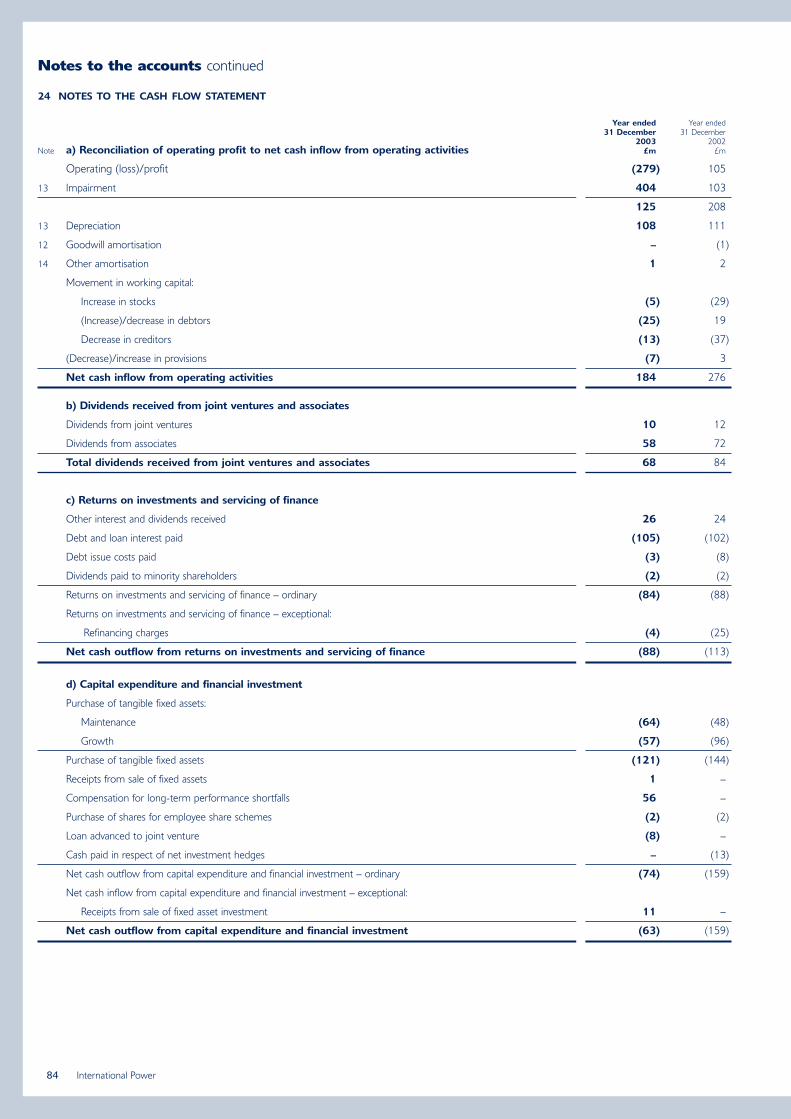
Notes to the accounts continued
24 NOTES TO THE CASH FLOW STATEMENT
Year ended Year ended31 December 31 December
2003 2002Note a) Reconciliation of operating profit to net cash inflow from operating activities £m £m
Operating (loss)/profit (279) 105
13 Impairment 404 103
125 208
13 Depreciation 108 111
12 Goodwill amortisation – (1)
14 Other amortisation 1 2
Movement in working capital:
Increase in stocks (5) (29)
(Increase)/decrease in debtors (25) 19
Decrease in creditors (13) (37)
(Decrease)/increase in provisions (7) 3
Net cash inflow from operating activities 184 276
b) Dividends received from joint ventures and associates
Dividends from joint ventures 10 12
Dividends from associates 58 72
Total dividends received from joint ventures and associates 68 84
c) Returns on investments and servicing of finance
Other interest and dividends received 26 24
Debt and loan interest paid (105) (102)
Debt issue costs paid (3) (8)
Dividends paid to minority shareholders (2) (2)
Returns on investments and servicing of finance – ordinary (84) (88)
Returns on investments and servicing of finance – exceptional:
Refinancing charges (4) (25)
Net cash outflow from returns on investments and servicing of finance (88) (113)
d) Capital expenditure and financial investment
Purchase of tangible fixed assets:
Maintenance (64) (48)
Growth (57) (96)
Purchase of tangible fixed assets (121) (144)
Receipts from sale of fixed assets 1 –
Compensation for long-term performance shortfalls 56 –
Purchase of shares for employee share schemes (2) (2)
Loan advanced to joint venture (8) –
Cash paid in respect of net investment hedges – (13)
Net cash outflow from capital expenditure and financial investment – ordinary (74) (159)
Net cash inflow from capital expenditure and financial investment – exceptional:
Receipts from sale of fixed asset investment 11 –
Net cash outflow from capital expenditure and financial investment (63) (159)
84 International Power

Year ended Year ended31 December 31 December
2003 2002£m £m
e) Acquisitions and disposals
Purchase of subsidiary undertakings – (144)
Acquisitions and disposals – ordinary – (144)
Receipts from partial disposal of investment in HUBCO 21 –
Receipts from sale of subsidaries 3 –
Acquisitions and disposals – exceptional 24 –
Net cash inflow/(outflow) from acquisitions and disposals 24 (144)
f) Financing activities
23 Share buyback (13) –
26 Bank loans (247) 210
Net cash (outflow)/inflow from financing activities (260) 210
25 ACQUISITIONS
In April 2003, the Group acquired a 20% interest in Arabian Power Company (Umm Al Nar). A US$440 million equity bridge facility was provided to ArabianPower Company in July 2003. The Group’s obligation under the facility at 31 December 2003 is a letter of credit for US$88 million.
26 NET DEBT
1 January Exchange Other Cash flow 31 December2003 differences non-cash 2003
movements£m £m £m £m £m
Cash
Cash at bank and in hand 799 10 – (136) 673
Liquid resources
Current asset investments 43 7 – 20 70
Debt financing
Loans due within one year (847) 56 63 197 (531)
Loans due after more than one year (576) (85) (81) 38 (704)
Convertible bonds (231) 23 (4) 12 (200)
Total debt financing (1,654) (6) (22) 247 (1,435)
Total net debt (812) 11 (22) 131 (692)
85annual report 2003

Notes to the accounts continued
27 FINANCIAL INSTRUMENTS
A discussion of the Group’s objectives and policies with regard to risk management and the use of financial instruments can be found in the Operating and financial review. Financial instruments comprise net debt (see note 26) together with other instruments deemed to be financial instruments including long-termdebtors, creditors and provisions for liabilities and charges.
a) Short-term debtors and creditors
Short-term debtors and creditors have been excluded from all the following disclosures other than the currency risk disclosures as relevant. The fair value of short-term debtors and creditors approximates to the carrying value because of their short maturity. In accordance with FRS 13 (Derivatives and other financialinstruments), deferred tax has been excluded from the following disclosures.
b) Interest rate risk profile of financial liabilities
The interest rate profile of the financial liabilities of the Group as at 31 December 2003 was:31 December 2003 31 December 2002
_______________________________________ _______________________________________Total Floating rate Fixed rate Total Floating rate Fixed rate
financial financial financial financialliabilities liabilities liabilities liabilities
Currency £m £m £m £m £m £m
Sterling 91 7 84 171 59 112
US dollar 767 128 639 971 194 777
Australian dollar 554 117 437 487 110 377
Czech koruna 46 9 37 51 34 17
Others 15 – 15 17 1 16
Total 1,473 261 1,212 1,697 398 1,299
All the Group’s creditors falling due within one year (other than bank and other borrowings) are excluded from the above tables either due to the exclusion ofshort-term items or because they do not meet the definition of financial liabilities. There are no material financial liabilities on which interest is not paid.
The effect of the Group interest swaps was to classify £437 million of floating rate Australian dollar borrowings as fixed rate, £438 million of floating rate US dollarborrowings as fixed rate, £84 million of floating rate sterling borrowings as fixed rate and £37 million of floating rate Czech koruna borrowings as fixed rate, in theabove table.
In addition to the above, the Group’s provisions are considered to be floating rate financial liabilities as, in establishing the provisions, the cash flows have been discounted.
The floating rate financial liabilities comprise bank borrowings bearing interest rates fixed in advance for various time periods up to 12 months by reference toLIBOR for that time period. The figures in the following tables take into account interest rate and currency swaps used to manage the interest rate and currencyprofile of financial liabilities and financial assets.
31 December 2003 31 December 2002Fixed rate financial liabilities Fixed rate financial liabilities
_____________________________ ___________________________
Weighted Weighted Weighted Weighted average average period average average period
interest rate for which interest rate for whichrate is fixed rate is fixed
Currency % Years % Years
Sterling 7.09 5 7.09 6
US dollar 6.16 2 5.08 3
Australian dollar 8.01 6 8.01 7
Czech koruna 3.98 3 13.02 –
Others 7.25 3 7.25 4
Weighted average 6.84 4 6.23 4
86 International Power

c) Interest rate risk profile of financial assets
The Group had the following financial assets as at 31 December 2003:31 December 2003 31 December 2002
_______________________________________ _______________________________________Total Floating rate Fixed rate Total Floating rate Fixed rate
financial financial financial financialassets assets assets assets
Currency £m £m £m £m £m £m
Sterling 412 412 – 158 158 –
US dollar 147 147 – 266 266 –
Euro 157 157 – 307 307 –
Australian dollar 2 2 – 101 101 –
Czech koruna 21 21 – 6 6 –
Others 7 7 – 8 8 –
Total 746 746 – 846 846 –
The cash deposits comprise deposits placed in money market funds, and a variety of investments with maturities up to three months. All investments are in publiclyquoted stocks or treasury instruments. Letters of credit totalling £132 million are supported on a cash collateral basis at 31 December 2003.
d) Currency exposures
As explained on page 17 of the Operating and financial review, the Group’s objective in managing the currency exposures arising during the normal course ofbusiness (in other words, its structural currency exposures) is to fully hedge all known contractual currency exposures, where possible. As at 31 December 2003and 31 December 2002, these exposures were not considered to be material.
Currency exposures comprise the monetary assets and monetary liabilities of the Group that are not denominated in the operating (or ‘functional’) currency of theoperating unit involved, other than certain non-sterling borrowings treated as hedges of net investments in overseas operations. It is not Group policy to hedgecurrency translation through forward contracts or currency swaps.
e) Maturity of financial liabilities
The maturity profile of the Group’s financial liabilities, other than short-term creditors and accruals, was as follows:31 December 31 December
2003 2002£m £m
In one year or less, or on demand 531 1,078
In more than one year but not more than two years 97 39
In more than two years but not more than five years 249 128
In more than five years 596 452
Total 1,473 1,697
As discussed in note 18, the Group is in discussions with bank groups in relation to claimed technical defaults on the non-recourse debt for the US merchant assetportfolio. Until these issues are resolved and documented, the debt at ANP is reported as current non-recourse debt in our accounts.
87annual report 2003

Notes to the accounts continued
27 FINANCIAL INSTRUMENTS continued
f) Borrowing facilities
The Group has substantial borrowing facilities available to it. The undrawn committed facilities available at 31 December 2003 in respect of which all conditionsprecedent have been met are detailed below.
31 December 2003 31 December 2002_________________________________________ _________________________Facility Undrawn Available Undrawn Available
£m £m £m £m £m
US$450 million Corporate revolving credit facility (October 2006)1 251 129 129 – –
US$570 million Corporate revolving credit facility (October 2003) – – – 279 279
US$1,215 million ANP Funding 1 construction and term loan (June 2006)2 679 – – 110 –
US$120 million ANP Funding 1 revolving credit facility (June 2006)2 67 50 – 66 –
US$40 million ANP Funding 1 bank support facility (June 2006)2 22 22 – 25 –
Czk 1,000 million EOP revolving credit facility (May 2007) 22 22 22 17 17
Czk 2,000 million EOP term facility (May 2007) 44 – – – –
US$99 million Al Kamil term facility (April 2017) 55 – – 3 –
£30 million Corporate letter of credit facility3 30 1 1 1 1
£14 million Subsidiary facilities in various currencies 14 7 3 21 2
Total 1,184 231 155 522 299
1. The drawn element of the US$450 million Corporate revolving credit facility relates to letters of credit issued.
2. As disclosed in note 18, the Group is in discussions with bank groups in relation to non-recourse debt for ANP Funding 1. The undrawn portion of this facility has therefore been shown as unavailable in the above table, and will become substantially available when these issues have been formally resolved and documented.
3. These facilities include a £30 million letter of credit facility which becomes committed for any letters of credit that have been drawn. At 31 December 2003, £29 million of letters of credit had been drawn from this facility.
Uncommitted facilities available at 31 December 2003 were:
31 December 2003 31 December 2002________________________________________ _______________________________________Total Drawn Undrawn Total Drawn Undrawn
Facility £m £m £m £m £m £m
Bank borrowings and overdraft facilities 25 – 25 37 – 37
Thai National Power working capital facility 1 – 1 1 – 1
Pelican Point working capital facility 4 – 4 3 – 3
Total 30 – 30 41 – 41
Bank borrowing facilities are normally reaffirmed by the banks annually although they can theoretically be withdrawn at any time.
g) Fair values of financial assets and liabilities
Set out below is a comparison by category of book values and fair values of all the Group’s financial assets and liabilities as at 31 December 2003.31 December 2003 31 December 2002
_________________________ _________________________
Book Fair Book FairPrimary financial instruments held or issued to value value value valuefinance the Group’s operations £m £m £m £m
Short-term borrowings and current portion of long-term borrowings (531) (531) (1,078) (1,078)
Long-term borrowings (942) (953) (619) (621)
Cash deposits and current asset investments 746 746 846 846
88 International Power

Year ended Year ended31 December 2003 31 December 2002
__________________________________________________________ __________________
Derivative financial instruments held to Book Fair Gain/ Gross Gross Gross Grossmanage the interest rate, currency profile value value (loss) gain (loss) gain (loss)and exposure to energy prices £m £m £m £m £m £m £m
Interest rate swaps and similar instruments – (38) (38) – (38) – (71)
Currency swaps – – – – – – –
Forward foreign currency contracts – – – – – − (1)
Energy derivatives – 37 37 100 (63) 69 (39)
The methods and assumptions used to estimate fair values of financial instruments are as follows:
i) For investments of up to three months, trade debtors, other debtors and prepayments, trade creditors, other current liabilities, long-term and short-termborrowings, the book value approximates to fair value because of their short maturity.
ii) The fair value of investments maturing after three months has been estimated using quoted market prices.
iii) The fair value of long-term borrowings and interest rate swaps has been calculated using market prices when available or the net present value of future cash flows arising.
iv) The fair value of the Group’s forward exchange contracts, foreign currency swaps and foreign currency options has been calculated using the market rates ineffect at the balance sheet dates.
v) The fair value of energy derivatives is measured using market based methodologies that provide a consistent measure across diverse energy products.Within the above fair values, only the financial assets and liabilities have been marked-to-market as defined by the requirements of the accounting standard.
h) Hedges
As explained on page 17 of the Operating and financial review, the Group’s policy is to hedge the following exposures:
i) Interest rate risk – using interest rate swaps, options and forward rate agreements.
ii) Structural and transactional currency exposures – using currency borrowings, forward foreign currency contracts, currency options and swaps.
iii) Currency exposures on future expected sales – using currency swaps, forward foreign currency contracts, currency options and swaps.
iv) Energy price fluctuations – using physical hedges through the operation of energy supply and trading activities together with financial products.
Gains and losses on instruments used for hedging are not recognised until the exposure that is being hedged is itself recognised or expires. Unrecognised gains andlosses on instruments used for hedging, and the movements therein, are as follows:
Debt Foreign Energy Total net exchange derivatives gain/(loss)
£m £m £m £m
Unrecognised gains and (losses) on hedges at 1 January 2003 (71) (1) 30 (42)
Gains and (losses) arising in previous years that were recognised in the year (1) (1) 25 23ended 31 December 2003
Gains and (losses) arising in previous years that were not recognised in the year (70) – 5 (65)ended 31 December 2003
Gains and (losses) arising in the year ended 31 December 2003 that were not 32 – 32 64recognised in the year
Unrecognised gains and (losses) on hedges at 31 December 2003 (38) – 37 (1)
Of which:
Gains and (losses) expected to be recognised in the year (3) – 30 27ended 31 December 2004
Gains and (losses) expected to be recognised in the year (35) – 7 (28)ended 31 December 2005 or later
The hedging of structural currency exposures associated with foreign currency net investments is recognised in the consolidated balance sheet.
89annual report 2003

Notes to the accounts continued
28 COMMITMENTS Group Company_______________________________ _______________________________31 December 31 December 31 December 31 December
2003 2002 2003 2002a) Lease and capital commitments £m £m £m £m
Capital commitments: contracted but not provided 75 54 – –
Property leases (annual commitment): expiring within one year 1 1 – –
expiring between one and five years – – – –
expiring after five years 5 5 5 5
b) Fuel purchase and transportation commitmentsThe Group has contracts with fuel suppliers for the supply and transportation of fuel to its power stations. The expiry of these contracts ranges from 2004 to 2021.
29 CONTINGENT LIABILITIES
a) Legal proceedings against the Company
The Company is aware of the following matters, which involve or may involve legal proceedings against the Group:
i) Claims and potential claims by or on behalf of current and former employees, including former employees of the Central Electricity Generating Board (CEGB),and contractors in respect of industrial illness and injury.
Innogy has agreed to indemnify International Power on an after-tax basis to the extent of 50% of any liability that the Company may incur whether directly or indirectly as a consequence of those proceedings to the extent such liability is not insured by Electra Insurance Limited.
ii) In 1994 separate complaints were made by the National Association of Licensed Opencast Operators (NALOO) and the South Wales Small MinersAssociation (SWSMA) to the European Commission against the Company, PowerGen plc, British Coal Corporation and HM Government. The complaintalleges violations of EU Competition law arising out of the coal purchasing arrangements entered into by the CEGB prior to 1 April 1990 and requests theCommission to find that the CEGB’s practices violated EU law. NALOO and SWSMA allege that such a finding would be grounds for a claim for damages inthe English courts by members of NALOO. An appeal against the Commission findings was brought by a faction of SWSMA, which was initially ruled out oftime, but an appeal was reinstated. Progress with this claim will be influenced by the outcome of the NALOO appeal. The European Court has ruled that theCommission is under an obligation to investigate the complaint by NALOO. The Company, PowerGen plc, British Coal Corporation and the Commission haveappealed against the ruling to the European Court of Justice which delivered a judgement on 2 October 2003 for the main part dismissing the appeal. Theruling confirmed that the Commission has the power to investigate and the matter is now with the Commission for consideration. It is not practicable toestimate legal costs or possible damages at this stage. The Commission ruled on the complaint in 1998 and did not make any findings against the Company.
Innogy has agreed to indemnify International Power on an after-tax basis to the extent of 50% of any liability that the Company may incur whether directly or indirectly as a consequence of those proceedings.
The Directors are of the opinion, having regard to legal advice received, the Group’s insurance arrangements and provisions carried in the balance sheet, that it isunlikely that the matters referred to above will, in aggregate, have a material effect on the Group’s financial position, results of operations or liquidity.
b) Taxation
The Company is aware of a number of issues which are, or may be, the subject of disputes with the tax authorities in the territories where the Group hasoperations. The principal exposures where significant amounts of tax could arise are in respect of potential exposures relating to the UK tax losses generated from the acquisition of Australian subsidiaries and related financing arrangements. Discussions are continuing with the UK Inland Revenue to reach agreement on these issues.
The Directors are of the opinion, having regard to the professional advice received, that adequate provision has been made for the settlement of any taxationliabilities that might arise.
c) Bonds and guarantees
Various growth and expansion projects are supported by bonds, letters of credit and guarantees issued by the Company totalling £424 million. £11 million of this is in respect of the loan facilities of its Elcogas investment which was provided for in the year ended 31 December 2001. In February 2004 , this guarantee and the Company’s loan obligations have been cancelled following the disposal of the investment.
Energy trading activities relating to merchant plant are supported by letters of credit and guarantees totalling £110 million.
30 RELATED PARTY TRANSACTIONS
Operations and maintenance contracts In the course of normal operations, the Group has contracted on an arm’s-length basis to provide power station operation and maintenance services to jointventures and associated undertakings. During the year the Group derived income of £37 million (year ended 31 December 2002: £16 million) from thesearrangements. Included in creditors is £nil (2002: creditor – £2 million) in relation to these contracts.
31 POST BALANCE SHEET EVENTS
In February 2004, the Group sold its investment in Elcogas, Spain. This investment had been fully provided against and the release of a guarantee will result in anexceptional gain in the first quarter of 2004.
90 International Power

32 DETAILS OF PRINCIPAL SUBSIDIARY UNDERTAKINGS, ASSOCIATES AND JOINT VENTURES
Subsidiary undertakingsCountry of
incorporation and Percentage Name and nature of business registration shareholding
Hazelwood Power Partnership (power generation) * Australia Partners’ Capital 92%
Elektrárny Opatovice AS (power generation) * Czech Republic Ordinary Shares 99%
International Power Global Developments Limited (project development – overseas) England and Wales Ordinary Shares 100%
Pelican Point Power Limited (power generation) * England and Wales ‡ Ordinary Shares 100%
Rugeley Power Limited (power generation) England and Wales Ordinary Shares 100%
Deeside Power Development Company Limited (power generation) England and Wales Ordinary Shares 100%
International Power Fuel Company Limited (fuel supplies) England and Wales Ordinary Shares 100%
National Power International Holdings BV (investment holding company) * The Netherlands ** Ordinary Shares 100%
Synergen Power Pty Limited (power generation) * Australia Ordinary Shares 100%
Thai National Power Company Limited (power generation) * Thailand Ordinary Shares 100%
Midlothian Energy Limited Partnership (power generation) * US Partners’ Capital 100%
Milford Power Limited Partnership (power generation) * US Partners’ Capital 100%
ANP Funding 1 LLC (financing company) * US Ordinary Shares 100%
International Power (Cayman) Limited (financing company) Cayman Islands ** Ordinary Shares 100%
IPR Insurance Company Limited (insurance captive) * Guernsey Ordinary Shares 100%
International Power (Jersey) Limited (financing company) Jersey ** Ordinary Shares 100%
International Power (Finance) Limited (financing company) England and Wales Ordinary Shares 100%
ANP Blackstone Energy Company, LLC (power generation) * US Ordinary Shares 100%
ANP Bellingham Energy Company, LLC (power generation) * US Ordinary Shares 100%
Hays Energy Limited Partnership (power generation) * US Partners’ Capital 100%
International Power Holdings Limited (investment holding company) England and Wales Ordinary Shares 100%
Advanced Turbine Products LLC (manufacturer of turbine parts) * US Partners’ Capital 82%
Al Kamil Power Company SAOC (power generation) * Oman Ordinary Shares 100%
Tihama Power Generation Company Limited (power generation) Saudi Arabia Ordinary Shares 60%
International Power Australia Holdings (1) Limited (investment holding company) * England and Wales Ordinary Shares 100%
All subsidiary undertakings operate in their country of incorporation, except as indicated below. All subsidiary undertakings have 31 December year ends. The Group also has a number of overseas branch offices.
Associates Country ofincorporation,
registration Accounting PercentageName and nature of business and operation period end shareholding
Malakoff Berhad (power generation) * Malaysia 31 August Ordinary Shares 18%
The Hub Power Company Limited (power generation) * Pakistan 30 June Ordinary Shares 21%
Carbopego – Abastecimento de Combustiveis, SA (fuel supplies) * Portugal 31 December Ordinary Shares 33%
Pegop-Energia Electrica, SA (power station operations) * Portugal 31 December Ordinary Shares 45%
Tejo Energia – Producao e Distribuicao de Energia Electrica, SA Portugal 31 December Ordinary Shares 45%
(power generation) *
Shuweihat CMS International Power Company PJSC UAE 31 December Ordinary Shares 20%
(power generation) *
Uni-Mar Enerji Yatirimlari AS (power generation) * Turkey 31 December Ordinary Shares 33%
Arabian Power Company PJSC (power generation) UAE 31 December Ordinary Shares 20%
Joint ventures Country ofincorporation,
registration Accounting PercentageName and nature of business and operation period end shareholding
Praz̆ská Teplárenská AS (power generation) * Czech Republic 31 December Ordinary Shares 49%
Hartwell Energy Limited Partnership (power generation) * US 31 December Partners’ Capital 50%
Oyster Creek Limited Partnership (power generation) * US 31 December Partners’ Capital 50%
South East Australia Pty Limited (gas pipeline) * Australia 31 December Ordinary Shares 33%
* Held by an intermediate subsidiary undertaking. ‡ Operates in Australia. ** Operates in the UK.91annual report 2003

Five-year financial summary
92 International Power
CONSOLIDATED PROFIT AND LOSS ACCOUNTS Year ended Year ended Year ended Year ended Nine months Year ended31 December 31 December 31 December 31 December ended 31 March
2003 2002 2001 2000 31 December 2000International 2000
PowerProforma
£m £m £m £m £m £m
Turnover: Group and share of joint ventures’ and associates’ 1,273 1,129 1,103 1,002 2,340 4,421
Less: share of joint ventures’ and associates’ turnover (421) (412) (546) (606) (483) (670)
Group turnover 852 717 557 396 1,857 3,751
Net operating costs – ordinary (727) (509) (392) (323) (1,680) (3,185)
Net operating costs – exceptional (404) (103) (2) (71) (227) (1,358)
Operating (loss)/profit (279) 105 163 2 (50) (792)
Share of operating profit of joint ventures and associates – ordinary 127 149 161 148 110 140
Share of operating profit of joint ventures and associates – exceptional 35 – – – – –
Income from investments – ordinary 33 31 – – – –
Income from investments – exceptional – 42 – – – –
Non-operating exceptional items 27 – 32 (99) (105) 1,296
Net interest payable and similar charges – ordinary (111) (132) (123) (104) (111) (192)
Net interest payable and similar charges – exceptional (16) – (29) – – –
(Loss)/profit on ordinary activities before taxation (184) 195 204 (53) (156) 452
Profit on ordinary activities before taxation and exceptional items 174 256 203 117 176 514
Exceptional items (358) (61) 1 (170) (332) (62)
Taxation (28) (76) (64) (37) (21) (17)
(Loss)/profit after taxation (212) 119 140 (90) (177) 435
Minority interests (7) (6) (2) (6) (4) (1)
(Loss)/profit for the financial year (219) 113 138 (96) (181) 434
Ordinary dividends – – – – – (175)
Demerger dividend – – – (392) (392) –
Retained (loss)/profit (219) 113 138 (488) (573) 259
Basic earnings/(loss) per share:
Excluding exceptional items 10.2p 15.5p 12.3p 6.6p 13.5p 38.0p
Attributable to exceptional items (29.9)p (5.4)p – (15.2)p (29.7)p (2.3)p
Including exceptional items (19.7)p 10.1p 12.3p (8.6)p (16.2)p 35.7p
Diluted (loss)/earnings per share including exceptional items (19.7)p 10.1p 12.0p (8.6)p (16.2)p 35.6p
The above five-year table sets out the consolidated numbers for International Power plc (formerly National Power PLC) except for the nine months ended 31 December 2000 and year ended 31 March 2000 which are those of National Power PLC.
The table below represents the historical summary of the International Power business:INTERNATIONAL POWER Year ended Year ended Year ended Year ended Nine months Year endedPre-exceptional items 31 December 31 December 31 December 31 December ended 31 March
2003 2002 2001 2000 31 December 2000Proforma 2000
£m £m £m £m £m £m
Turnover: Group and share of joint ventures and associates 1,273 1,129 1,103 1,002 762 1,021
Less: share of joint ventures’ and associates’ turnover (421) (412) (546) (682) (478) (664)
Group turnover 852 717 557 320 284 357
Net operating costs (727) (509) (392) (247) (225) (303)
Operating profit 125 208 165 73 59 54
Share of operating profit of joint ventures and associates 127 149 161 148 108 137
Income from investments 33 31 – – – –
Profit before interest and taxation 285 388 326 221 167 191

CONSOLIDATED BALANCE SHEETS As at As at As at As at As at31 December 31 December 31 December 31 December 31 March
2003 2002 2001 2000 2000£m £m £m £m £m
Fixed assets 2,587 2,981 3,152 3,028 4,320
Stocks 65 55 25 21 57
Debtors 160 134 158 132 647
Investments 70 43 47 – 1,269
Cash at bank and in hand 673 799 596 107 855
Current assets 968 1,031 826 260 2,828
Creditors: amounts falling due within one year (846) (1,405) (615) (358) (1,185)
Net current assets/(liabilities) 122 (374) 211 (98) 1,643
Total assets less current liabilities 2,709 2,607 3,363 2,930 5,963
Creditors: amounts falling due after more than one year (909) (583) (1,436) (1,101) (2,504)
Provisions for liabilities and charges (238) (255) (230) (243) (1,032)
Net assets 1,562 1,769 1,697 1,586 2,427
Net debt 692 812 897 1,071 490
Gearing 44% 46% 53% 68% 20%
Debt capitalisation 31% 31% 35% 40% 17%
Capital expenditure (including acquisitions) 130 319 467 566 1,296
93annual report 2003

Additional information for US shareholders
This information is derived from the financial statements included in the Company’s report on Form 20-F for the year ended 31 December 2003, which will be filed with the US Securities and Exchange Commission. Form 20-F should be referred to for a complete discussion of the differences between UK GAAP and US GAAP that affect the Group.
EFFECT ON PROFIT AFTER TAX (NET INCOME) OF SIGNIFICANT DIFFERENCES BETWEEN UK AND US GAAP
Year ended Year ended31 December 31 December
2003 2002Note £m £m
Net income
(Loss)/profit attributable to ordinary shareholders under UK GAAP (219) 113
Adjustments:
a) Pensions – 2
b) Impairment of plant
Impairment of US plant 404 –
Reinstatement of HUBCO impairment (35) –
Impairment of UK plant – 102
Impact on depreciation charge (7) (3)
c) Purchase accounting and goodwill
Impairment of goodwill (28) (51)
Fair value and purchase accounting 3 2
d) Development expenditure 1 1
e) Onerous property lease provision 2 –
f) Liquidated damages and associated costs (19) (71)
g) Restructuring costs (3) 3
h) Derivatives and hedging activities (35) 5
i) Deferred finance costs 12 –
j) Disposal of a 5% holding in HUBCO 1 –
k) Retranslation of foreign currency denominated subsidiary – 18
l) Deferred tax 1 (16)
m) Stock compensation schemes (2) –
Tax effect of US GAAP adjustments (93) 12
Net (loss)/income under US GAAP before cumulative effect of accounting policy change (17) 117
Cumulative effect of US GAAP accounting policy change:
c) Impairment of goodwill – (44)
Tax effect – –
Net (loss)/income under US GAAP (17) 73
(Loss)/earnings per Ordinary Share:
(Loss)/earnings per share under US GAAP before cumulative effect of accounting policy change
Basic and diluted (1.5)p 10.5p
(Loss)/earnings per share under US GAAP after cumulative effect of accounting policy change
Basic and diluted (1.5)p 6.5p
94 International Power

EFFECT ON SHAREHOLDERS’ FUNDS – EQUITY OF SIGNIFICANT DIFFERENCES BETWEEN UK AND US GAAP
As at As at31 December 31 December
2003 2002Note £m £m
Shareholders’ funds – equity
Total shareholders’ funds – equity under UK GAAP 1,523 1,740
Adjustments:
a) Pensions 10 9
b) Impairment of plant 547 199
c) Purchase accounting and goodwill (20) 9
d) Development expenditure (15) (17)
e) Onerous property lease provision (1) (3)
f) Liquidated damages and associated costs (144) (140)
g) Restructuring costs – 3
h) Derivatives and hedging activities (1) (41)
i) Deferred finance costs 12 –
m) Stock compensation schemes (3) (1)
n) Employee share trust arrangements (2) (1)
l) Deferred tax (48) (49)
Cumulative tax effect of US GAAP adjustments (78) 49
Total shareholders’ funds – equity under US GAAP 1,780 1,757
A brief discussion of the significant differences between UK and US accounting principles follows:
a) Pensions
There are differences in the methods of valuation required under UK and US GAAP for valuing assets and liabilities of defined benefit pension plans. US GAAP isgenerally more prescriptive in respect of actuarial assumptions and the allocation of costs to accounting periods.
b) Impairment of plant
Under UK GAAP, an impairment provision is recognised when the discounted cash flows are less than the carrying amount of the related assets. Under US GAAP,an impairment provision for assets is made when the undiscounted expected future cash flows fail to recover the carrying amount of the related assets.Accordingly, a US GAAP difference arises when the carrying amount of the assets is greater than the discounted future cash flows but less than the undiscountedfuture cash flows. This difference in the carrying value results in different levels of depreciation under UK and US GAAP.
Under UK GAAP, an impairment may be reversed when the recoverable amount exceeds the carrying amount. Under US GAAP, recognition of subsequentrecoveries in fair value is prohibited. Accordingly, the HUBCO impairment reversed in 2003 under UK GAAP has been reinstated for US GAAP.
c) Purchase accounting and goodwill
Under UK GAAP, goodwill arising on acquisitions after 1 April 1998, accounted for under the purchase method, is capitalised in the balance sheet and amortisedover a period not exceeding 20 years. Prior to that date such goodwill arising on acquisitions was and remains eliminated against reserves. Under US GAAP,goodwill arising on purchase business combinations is capitalised in the balance sheet. With effect from 1 January 2002 goodwill is not subject to amortisation butis evaluated for impairment annually or whenever changes in circumstances indicate that goodwill might be impaired. Goodwill impairments were recorded in 2003and 2002. A cumulative charge of £44 million was made at 1 January 2002 on adoption of the US standard FAS 142 (Goodwill and Intangible Assets).
d) Development expenditure
Under UK GAAP, the Group capitalises certain development expenditure as described in more detail in accounting policy note viii to the consolidated financialstatements. US GAAP requires such costs to be expensed as incurred.
e) Onerous property lease provision
Under UK GAAP, a provision in respect of an onerous property lease is stated on a discounted basis. Under US GAAP, this provision is measured on anundiscounted basis. Accordingly, the impact of the discounting is reversed under US GAAP.
f) Liquidated damages and associated costs
Under UK GAAP, liquidated damages relating to amounts receivable from contractors in respect of the late commissioning of new power plants are recorded asincome when they represent compensation for lost earnings. This is offset by certain costs, including interest and costs associated with the rectification of the plant,which are expensed in the period in which liquidated damages are recorded as revenue. Under US GAAP, this net amount is recorded as a reduction in the cost ofthe asset, regardless of the nature of the compensation. These differences in the asset cost result in different levels of depreciation under UK and US GAAP.
Those receipts that relate to compensation for plants not achieving long-term contractual performance levels are recorded as a reduction in the cost of the assets under both UK and US GAAP.
95annual report 2003

Additional information for US shareholders continued
g) Restructuring costs
Under UK GAAP, when a decision has been taken to restructure the business and a constructive obligation has been created to meet the qualifying expenditure, the necessary provision is made. Under US GAAP, the requirements for charging restructuring costs to income are more prescriptive and include the need for allsignificant actions arising from the restructuring plan to be determined and the completion dates to be identified by the balance sheet date. Accordingly, the chargefor restructuring costs made under UK GAAP in 2002 was reversed and charged to the profit and loss account in 2003 under US GAAP.
h) Derivatives and hedging activities
Under UK GAAP, the Group recognises only derivatives of a speculative nature at fair value on the balance sheet with related gains and losses charged or creditedto the profit and loss account. Gains or losses on other derivative instruments are deferred until the hedged transactions actually occur.
Under US GAAP, the Group recognises all qualifying derivatives (including certain derivatives embedded in other instruments) at fair value on the balance sheet.Gains and losses arising on derivatives that do not meet the US GAAP hedge accounting criteria, along with the accretion of the discounted value of debt wherebifurcation is required, are recognised in the profit and loss account. Gains and losses on the Group’s derivatives that qualify for cash flow hedge accounting areinitially recognised in reserves (to the extent that the hedge is effective) and subsequently reclassified to the profit and loss account as the hedged item impactsearnings. Any ineffective element of these hedges is immediately recognised in earnings.
i) Deferred finance costs
For UK GAAP purposes an exceptional interest charge of £12 million has been recorded in 2003 in relation to the write off of deferred finance costs in respectof the ANP bank facility. The facility is currently in technical default and negotiations with the banks are ongoing. It is not possible to reliably estimate the natureor timing of any renegotiated facility. For US GAAP purposes the deferred finance costs remain capitalised as amounts continue to be outstanding under theANP facility.
j) Disposal of a 5% holding in HUBCO
Applying the accounting differences between UK and US GAAP can result in differences in the carrying values of net assets under UK and US GAAP. As aconsequence of this, different gains and losses may result on the subsequent disposal of the asset.
k) Retranslation of foreign currency denominated subsidiary
During 2001, the Group disposed of its interest in UFG and retained approximately Euro 450 million of these funds in a Euro-denominated foreign enterprise withthe intention of reinvesting the proceeds into Euro-denominated generating assets. Under UK GAAP, this foreign enterprise retained its Euro functional currency,with exchange gains and losses being recorded in reserves. Under US GAAP, its functional currency is that of its parent and, as such, gains and losses on translationof these funds are recognised through the income statement.
l) Deferred tax
Under UK GAAP a deferred tax asset or liability is not recognised on the difference between the tax and book values of an asset or liability that existed at the dateof a business combination. Under US GAAP, deferred tax is recognised on this difference.
m) Stock compensation schemes
Under UK GAAP, no cost is recorded for the Sharesave Scheme. For other stock compensation schemes, the intrinsic value, being the difference between the bookvalue of the shares before granting the options and the option price, is charged over the period of performance to which the award relates (the vesting period).Under US GAAP, the compensation expense for both schemes is measured as the difference between the market value of the shares at the date of grant and theoption price and is spread over the same vesting period. Share options which are exercisable if certain performance criteria are achieved are accounted for asvariable awards and compensation expense is calculated at the end of each year by reference to the market price of the shares that are considered likely to vestand recognised over the vesting period.
n) Employee share trust arrangements
Under UK GAAP, Ordinary Shares in the Group held by employee share trusts are included at historical book value. Under US GAAP, such shares are classified astreasury stock and presented at their historical cost as a deduction to shareholders’ equity.
96 International Power

Shareholder profile
AS AT 31 DECEMBER 2003
CATEGORY OF HOLDINGS Number of Percentage Ordinary Percentageshareholders of total Shares of issued
shareholders share capital
Private individuals 555,074 99.21 192,535,606 17.40
Nominee companies 3,974 0.71 890,037,522 80.39
Limited and public limited companies 305 0.05 12,658,539 1.14
Other corporate bodies 141 0.03 5,745,858 0.52
Pension funds, insurance companies and banks 17 0.00 6,114,469 0.55
Total 559,511 100.00 1,107,091,994 100.00
RANGE OF HOLDINGS Number of Percentage Ordinary Percentageshareholders of total Shares of issued
shareholders share capital
1 – 199 187,150 33.45 28,350,880 2.56
200 – 499 289,440 51.73 77,249,902 6.98
500 – 999 58,464 10.45 37,563,273 3.39
1,000 – 4,999 21,678 3.87 37,568,515 3.39
5,000 – 9,999 1,663 0.30 10,338,950 0.93
10,000 – 49,999 597 0.11 11,069,960 1.00
50,000 – 99,999 118 0.02 8,414,015 0.76
100,000 – 499,999 199 0.04 46,010,662 4.16
500,000 – 999,999 63 0.01 43,742,951 3.95
1,000,000 – highest 139 0.02 806,782,886 72.88
Total 559,511 100.00 1,107,091,994 100.00
97annual report 2003

Shareholder services and information
Annual General Meeting (AGM)The 2004 Annual General Meeting (AGM) will beheld on Tuesday 11 May 2004. Further details willbe set out in the Notice of the AGM to be sent outin April 2004.
The Company’s current policy is not to pay anydividends on Ordinary Shares. There is, in any event, a current prohibition on the payment of dividends bythe Company by the terms of a Credit Facility, dated16 October 2003. The Company currently makesreturns to shareholders by making share buybacks.The Company will review its dividend policy at theend of 2004, based on cash flow performance andbusiness outlook.
Electronic proxy votingFor the AGM you may, if you wish, register theappointment of a proxy electronically by logging on to the following website: www.sharevote.co.uk.You will need your voting reference numbers (thethree 8-digit numbers shown on your Proxy Form).Alternatively, if you have already registered for ashareview portfolio with Lloyds TSB Registrars, thenlog on to your portfolio at www.shareview.co.ukand click on company meetings.
Shareviewwww.shareview.co.uk is a service offered by LloydsTSB Registrars that enables you to check yourholdings in many UK companies and helps you to organise your investments electronically. If youhave access to the internet you can register for this portfolio service which is easy to use, secureand free by logging on to www.shareview.co.uk.Once you have registered for a portfolio, you canalso use this service to change your address detailson line.
Individual Savings Accounts (ISAs)Information on the International Power corporateISA, which offers a tax-efficient way of holdingshares, can be obtained from the ISA manager, The Share Centre on 01296 414144 or fromInternational Power’s website.
Shareholder enquiriesIf you have any queries on the following:
– transfer of shares;
– change of name or address;
– lost share certificates;
– lost or out-of-date dividend cheques andpayment of dividends directly into a bank orbuilding society account;
– death of the registered holder of shares;
– receiving duplicate copies of the Annual Report;
– receiving the Annual Report in addition to the Summary Annual Report.
Please contact Lloyds TSB Registrars on 0870 600 3978 or write to them at The Causeway, Worthing, West Sussex BN99 6DA.
Additional information can be found on the Lloyds TSB website at www.lloydstsb-registrars.co.uk.
Share dealing services
Lloyds TSB Registrars have in place a low-cost sharedealing service for both the purchase and sale ofshares. Commission on both sales and purchases is0.75% per transaction, subject to a minimumdealing charge of £7.50. This is a postal service only.For information on the low-cost dealing service, orto obtain a dealing form, please contact Lloyds TSBRegistrars on 0870 600 3978.
General enquiriesPlease contact: Stephen RamsayCompany SecretaryInternational Power plcSenator House85 Queen Victoria StreetLondon EC4V 4DP. Tel: 020 7320 8706
Corporate investor & media enquiriesPlease contact: Aarti SinghalHead of CommunicationsInternational Power plcSenator House85 Queen Victoria StreetLondon EC4V 4DP.Tel: 020 7320 8681
WebsiteThe 2003 Annual Report and Summary AnnualReport are available at www.ipplc.com, which alsocarries a wide range of other information on the Group.
Corporate social responsibility Our annual corporate social responsibility report isavailable on our website.
SEC reporting Our 20-F, including US GAAP reconciliation, will be available on our website prior to 30 April 2004.
98 International Power
Announcement of Q1 results 6 May 2004
Annual General Meeting 11 May 2004
Announcement of interim results for the period ended 30 June 2004 3 August 2004
Announcement of Q3 results 5 November 2004
Financial calendar

ABI Association of British Insurers, a body which, inter alia, sets standards of corporategovernance on behalf of insurance companies.
ANP American National Power.
Availability A measure giving the proportion of electrical energy that was available during the year,after taking account of both planned and unplanned plant outages.
BACT Best available control techniques.
BITC Business in the Community, a charitable foundation.
Bond Security that obligates the issuer (International Power) to make specified payments tothe bondholder (financial institutions).
CO2 Carbon dioxide.
CSR Corporate social responsibility.
CCGT Combined cycle gas turbine – turbines, that are typically fuelled by natural gas, are usedto drive generators to produce electricity. The exhaust gases are then passed through aboiler to produce steam that in turn drives an additional turbine coupled to a generator.
Cogen The simultaneous generation of heat and electricity, typically where the need for both
arises for industrial or commercial purposes.
Debt capitalisation Net debt divided by the sum of the net debt and total equity
Demerger Agreement The demerger agreement dated 21 August 2000 between National Power, Innogy Holdings and Innogy.
EH&S Environmental, health and safety.
EPS Earnings per share, calculated by dividing the profit after interest and tax by the numberof shares in issue.
EV Enterprise value – market capitalisation plus debt capitalisation.
ERCOT The Electric Reliability Council of Texas – is the corporation that administers the powergrid for the state of Texas.
ESPS Electricity Supply Pension Scheme.
FRS Financial Reporting Standard.
Gearing Net debt divided by total equity.
Generator nameplate The maximum output of a generator under specific conditions designated by the manufacturer.capacity (installed) Installed generator nameplate capacity is commonly expressed in megawatts (MW) and is usually
indicated on a nameplate physically attached to the generator.
GT24B Proprietary gas turbine built by Alstom Power.
Heat rate A measure of the amount of heat required to produce a unit of electricity.
HUBCO The Hub Power Company.
IASB International Accounting Standards Board.
IFRS International Financial Reporting Standards.
IGCC Integrated gasification/combined cycle – a combined cycle gas turbine that is fired on agas fuel derived from the gasification of liquid or solid carbonaceous material, eg. oil residues or coal.
ISO 14001 The international standard of environment management systems.
KAPCO Kot Addu Power Company.
Merchant market A merchant market is a deregulated market.
Glossary
99annual report 2003

Glossary continued
Merchant plant Our merchant plants operate in deregulated markets selling power into the traded market without long-term power purchase agreements (PPAs).
MIGD Millions of imperial gallons per day.
MW Megawatt; one MW equals 1,000 kilowatts.
MWth One megawatt of thermal power.
NEPOOL The New England Power Pool – together with the ISO New England (Independent System Operator, New England) is responsible for managing the region's electric bulkpower generation and transmission systems.
NOx Oxides of nitrogen.
Non-recourse debt Debt secured on an asset.
OCGT Open cycle gas turbine. Turbines, typically fuelled by gas or diesel oil, are used to drivethe generators to produce electricity.
OHSAS 18011 Occupational Health and Safety Assessment Series 18011. A management system specification, developed by the British Standards Institute, for healthand safety which is compatible with ISO 9001:1994 (Quality) andISO 14001:1996 (Evironmental) management.
O&M Operations and maintenance, usually used in the context of operating and maintaining a power station.
Off-take agreement Power purchase agreement between International Power and its customer (the offtaker)whereby the customer takes the electricity generated by a power station.
PAT Profit after tax.
PBIT Profit before interest and tax.
Peak load The maximum demand during a specified high demand period. This may require use of plant (for example, pumped storage) that is generally idle.
Put To sell a security back to the issuer at a pre-determined price.
RPI Retail Price Index.
Recourse debt Debt secured by the Company.
Reliability A measure giving the proportion of planned electrical energy that was actually availableduring the year, after taking account of unplanned plant outages.
Safety walk A formally structured safety inspection of all operational areas to assess aspects of general safety, good housekeeping, lighting etc.
SCR Selective catalytic reduction – equipment to reduce the concentration of NOx in flue gases.
Spark spread The difference between the power price and fuel costs.
Tolling contract A form of long-term electricity contract where the buyer of the electricity also suppliesthe fuel and the generator provides the energy conversion services in the form of theplant and operational services required to change the energy in the fuel into electricity.
Toolbox talk Team discussions held on topics related to health and safety, environment, technical and business environment as a means of improving communication.
Trade investment A business entity over which the investor does not excercise significant influence.
UK GAAP Generally Accepted Accounting Principles in the UK.
100 International Power

www.ipplc.com
Available on the website:
• latest presentations • press releases • share price information • financial data and reports
WE ARE CONTINUALLY UPDATING INFORMATION TO KEEP YOU INFORMED OF DEVELOPMENTS WITHIN THE COMPANY, PLEASE VISIT THE INTERNATIONAL POWER WEBSITE AT :

Registered OfficeInternational Power plcSenator House85 Queen Victoria StreetLondon EC4V 4DP
Registered in England and Wales No: 2366963
This document is printed throughout using soya-based inkson environmentally-responsible paper. The paper supplychain via both mill and merchant is covered by internationalstandard ISO 14001.
Published by International Power plcwww.ipplc.com
Designed and produced by Naturalwww.naturalassociates.comPrinted in the UK by Royle Corporate Print