iphone and its supply chain
TRANSCRIPT

DISCLOSURE APPENDIX AT THE BACK OF THIS REPORT CONTAINS IMPORTANT DISCLOSURES, ANALYST CERTIFICATIONS, LEGAL ENTITY DISCLOSURE AND THE STATUS OF NON-US ANALYSTS. US Disclosure: Credit Suisse does and seeks to do business with companies covered in its research reports. As a result, investors should be aware that the Firm may have a conflict of interest that could affect the objectivity of this report. Investors should consider this report as only a single factor in making their investment decision.
23 May 2017 Global
Equity Research Technology
iPhone and its supply chain The Credit Suisse Connections Series leverages our
exceptional breadth of macro and micro research to deliver
incisive cross-sector and cross-border thematic insights for
our clients.
Credit Suisse Global Technology Research Team
Credit Suisse equity research team
Manish Nigam
852 2101 7067
Kulbinder Garcha
212 325 4795
Randy Abrams, CFA
886 2 2715 6366
Pauline Chen
886 2 2715 6323
Keon Han
82 2 3707 3740
Akinori Kanemoto
81 3 4550 7363
Sang Uk Kim
82 2 3707 3795
Sam Li
852 2101 6775
Hideyuki Maekawa
81 3 4550 9723
Mika Nishimura
81 3 4550 7369
John W. Pitzer
212 538 4610
Achal Sultania
44 20 7883 6884
Jerry Su
886 2 2715 6361
Kyna Wong
852 2101 6950
Thompson Wu
886 2 2715 6386
CONNECTIONS SERIES
Identifying winners through the chain
Figure 1: Our top OUTPERFORM-rated ideas for the theme
BBG Price TP PE (x) CS EPS growth (%)
Company Ticker Curr. Rat Local Cur. Local Cur. 2017 2018 2017 2018
ams AMS SW CHF O 63.20 72.00 45.1 14.9 (11.4) 212.4
Apple AAPL US USD O 153.99 170.00 16.8 14.3 10.7 17.6
Hon Hai 2317 TT TWD O 102.50 120.00 10.8 9.4 10.2 15.3
Largan 3008 TT TWD O 4,900.00 5,200.00 21.0 17.2 46.0 24.1
LGI 011070 KS KRW O 128,000 165,000 13.2 12.4 4,656.2 7.9
Lens Tech 300433 CH CNY O 34.24 42.40 32.7 21.8 81.8 47.6
Micron MU US USD O 28.06 40.00 7.1 5.5 6,115.9 28.1
Murata 6981 JP JPY O 15,810.00 18,200.00 17.2 15.3 20.0 14.9
SEC 005930 KS KRW O 2,255,000 2,900,000 8.7 8.0 65.1 10.2
SONY 6758 JP JPY O 3,943.00 4,300.00 17.8 16.5 523.5 10.7
Source: Bloomberg, Company data, Credit Suisse estimates, at closing price on 22 May 2017
■ A major new product update. We believe the upcoming iPhone 8 model will
revive medium-term unit growth (we forecast an 8% CAGR over 2016-19)
even in our base-case scenario, given pent-up demand (as per our installed
base model) and meaningful new specs/features in the new offering. In this
global Connections Series report, based on inputs from our 15 analysts from
around the world, we look at the implications of the iPhone 8 cycle on Apple
and its global supply chain. On Pages 5-8, we list the major parts suppliers,
their exposure to this product and their valuations.
■ A big deal for the supply chain; but not everyone gains equally. In
Asia, about 60% of our coverage universe of hardware/semis’ stocks fall
within the Apple supply chain, signifying the importance of the product for
the Asian tech space. In addition to the resumption of unit growth, the
current cycle will also lead to some meaningful bill of material increases,
particularly for the OLED model (incremental ~US$55 per unit versus the
7 Plus). Providers of OLED display, casing, imaging/3D sensing parts,
memory, select sensors and select assemblers stand to gain through both
unit growth as well as dollar content growth.
■ Stock calls. Our top pick takes into account the impact of this product cycle
on earnings, performance of the businesses not related to the iPhone 8 and
valuations (i.e. what is already priced in). That leads us globally to the
following 10 stocks: Apple, Samsung Electronics, LG Innotek, Largan, Hon
Hai, Lens Tech, Sony, Murata, Micron and ams.

23 May 2017
iPhone and its supply chain 2
Focus tables
Figure 2: Comparison of key specs—iPhone 7+ versus likely specs for iPhone 8 Pro (OLED model)
Specs iPhone 7 Plus iPhone 8 Pro (OLED model)
Keu components
Acoustics Dual-speaker solution Enhanced dual-speaker solution
Cameras "12MP + 7 MP/ 12MP + 12 MP for Dual camera" Dual camera adds Dual OIS
Casing Unibody Al7000 Stainless steel frame + Two sides 2.5D Glass
Display & touchscreen 5.5" Retina Display with in-cell touch: 1920x1080 5.8” OLED Flat screen & DITO touch sensor
Force touch Capacitive sensing structure Enhanced force touch with resistive/strain gauge structure
Semis
Application processor 64-bit A10 on 16nm with embedded M10 Co processor A11 processor on 10nm
Audio Codec Cirrus Logic 338S00105/338S00220 Similar
Fingerprint sensor USI module + Authentec IC Under glass sensor (remove sapphire)
Memory (DRAM) 3 GB LPDDR4 PoP Similar
Memory (NAND) 32 / 128/ 256GB (TLC -20-25%) Possibly only 64/256GB Skus
Modem - Baseband, RF QCOM MDM9635M + WTR 3925 / Intel XMM 7480 QCOM X16 10nm / INTC 7480 28nm / 3PAMiD & 2 Diversity module
Power amplifier + Switch Multi-band PA module for global regions Similar RF content
User Interface & Sensors Accelerometer, e-compass , Gyro , Temperature, Touch IC Similar + 3D sensing + Gesture recognition
WLAN / BT / FM / GPS BRCM: BT 4.0+FM+Wifi 11ac in a USI Module Maybe Bluetooth 5.0, 802.11ac MIMO in Murata and USI module
Others
Battery 1960 mAh Dual cell L shape battery
Charger n.a. Wireless Charging chipset (full module not in box)
PCB 10-layer Any Layer Stacked Via HDI PCB + flex PCB HDI + Flex PCB + Substrate Like PCB
Source: Company data, Credit Suisse estimates
Figure 3: Apple—iPhone unit and ASP forecasts by models (2017-19)
iPhone Segmentation Sep-17 Dec-17 Mar-18 Jun-18 Sep-18 Dec-18 Mar-19 Jun-19 Sep-19 Dec-19 CY17E CY18E CY19E
USD 4Q FY17 1Q FY18 2Q FY18 3Q FY18 4Q FY18 1Q FY19 2Q FY19 3Q FY19 4Q FY19 1Q FY20 Dec-17 Dec-18 Dec-19
iPhone units ('000) 48,838 85,222 57,099 48,534 53,406 90,790 61,737 51,859 56,483 99,974 228,986 249,828 270,054
%yoy 7% 9% 12% 10% 9% 7% 8% 7% 6% 10%
%qoq 11% 75% -33% -15% 10% 70% -32% -16% 9% 77% 6% 9% 8%
iPhone 7 13,186 4,261 3,711 2,184 2,136 2,724 1,235 1,037 847 1,500 63,200 10,755 4,619
iPhone 7 Plus 5,861 1,960 2,056 1,941 1,335 2,724 1,235 1,037 1,412 2,499 31,552 8,056 6,183
iPhone 8 12,014 23,436 17,701 16,259 6,943 6,355 3,704 2,593 2,824 2,999 35,450 47,257 12,121
iPhone 8 Plus 7,814 6,221 7,994 8,057 5,074 2,724 1,605 1,556 1,412 2,499 14,035 23,848 7,072
iPhone 8 Pro - 40,906 17,415 13,104 9,880 2,724 1,235 1,037 988 1,750 40,906 43,123 5,010
iPhone 9 - - - - 9,934 26,783 22,843 19,240 12,003 6,998 36,717 61,083
iPhone 9 Plus - - - - 3,204 7,808 6,791 5,705 2,259 2,499 11,012 17,254
iPhone 9 Pro - - - - 7,210 29,507 15,434 12,965 5,366 2,999 36,717 36,764
iPhone 10 - - - - - - - - 10,506 28,743 39,248
iPhone 10 Plus - - - - - - - - 3,954 6,598 10,552
iPhone 10 Pro - - - - - - - - 7,908 28,493 36,400
ASP ($ all in ) 646 750 702 705 711 702 669 670 683 680 676 704 676
ASP ($ H/W) 629 740 687 687 695 693 659 659 668 673 661 691 666
iPhone 7 551 536 527 517 523 524 526 526 512 512 589 523 519
iPhone 7 Plus 622 630 603 595 597 556 551 551 548 528 685 584 541
iPhone 8 742 659 667 667 619 581 575 554 543 544 687 648 555
iPhone 8 Plus 850 741 755 771 729 631 602 597 605 568 802 741 590
iPhone 8 Pro - 884 858 865 852 717 705 685 654 639 884 850 668
iPhone 9 - - - - 723 663 628 633 599 588 679 619
iPhone 9 Plus - - - - 802 769 732 732 701 637 779 714
iPhone 9 Pro - - - - 861 858 856 856 847 733 859 844
iPhone 10 - - - - - - - - 723 658 675
iPhone 10 Plus - - - - - - - - 812 772 787
iPhone 10 Pro - - - - - - - - 857 861 860
Source: Credit Suisse estimates

23 May 2017
iPhone and its supply chain 3
iPhone and its supply chain
iPhone 8: Rising demand; rising price We maintain our long-standing view of significant pent-up demand in terms of iPhone
volumes and based on our installed base model analysis (cross-checked with high-end
market share and share by region), we conclude that iPhone volumes will grow robustly
from 214 mn in 2016, to 230 mn/250 mn/270 mn in 2017/2018/2019. Our pricing trend
analysis also suggests that Apple's ability to further raise pricing is intact. We assume a
45%/40% mix of the Pro model in 2017/2018, which positively impacts ASPs. Our analysis
shows that the bill of materials (BOM) for the OLED version will be ~US$55 higher than
the 7 Plus at launch). However, we conclude the improved mix and pricing could offset the
anticipated BOM rise. Apple remains a key OUTPERFORM with a target price of US$170.
Display, casing, 3D-sensing: Likely major changes While changes from the iPhone 7 to iPhone 8 do not a add a lot of content dollars for most
suppliers, the bill of materials for the OLED model is likely to be driven higher by the usage
of a new display (OLED panels would add ~US$27 per unit—supplied by Samsung), a
complete change in casing design (steel frame and front and back 2.5D glass adding
~US$10) and the introduction of 3D sensing (front facing, mainly for facial recognition and
gesture control; adding ~US$12). Suppliers of these parts stand to gain from both unit and
content growth. Other downstream part suppliers are likely to gain via overall unit growth,
and in some cases, through market share gains. Our top ideas are: Samsung Electronics,
Largan, LG Innotek, Lens Tech, Sony and Murata.
Asian semis: The Big 2 to make more money Moving from the iPhone 7 to iPhone8, there isn’t a major content gain story for Asian
semis. So, the bulk of the changes is being driven by unit growth, share gains or mix.
TSMC's 100% share of the applications processor and Apple’s fingerprint IC and NAND
controller should lift direct sales to Apple from 17% in 2016 to an estimated 22%/24% in
2017/2018. Apple’s ramp should be a good driver in 2H for TSMC, but we believe will be
partially offset by on-going inventory adjustments from other fabless customers and
continued high-end migration by its #2 customer, Qualcomm, into Samsung’s fabs well
into 2018. Samsung's operating profit from selling memory to Apple also increases as a
result of substantially higher year-on-year ASP for DRAM, a product mix shift in favour of
3GB iPhones and overall iPhone unit growth driving total DRAM bits and unit growth (and
the potential discontinuation of the 32GB sku) driving NAND bits.
US/European semis: iPhone a smaller part of the mix We see mostly neutral implications for our US semi universe from the iPhone 8. Despite a
significant focus on new technologies in the iPhone 8, AAPL is only ~5-6% of total
revenues on average across our US semi coverage universe. Specifically, we highlight
that increased memory dollar content should be positive for Micron, Intel's share of
baseband should increase from ~20% in iPhone 7 to ~35% in the iPhone 8 and RF names
will continue to benefit from content growth. Across our EU coverage, we continue to see
ams (various sensors) as the biggest beneficiary from rising content within upcoming
iPhone generations over the next few years and it remains our top pick. ST Micro also
stands to gain from 3D-sensing, but valuations leave it as a NEUTRAL-rated stock.
Assembly: Rising tide might lift all boats We believe that the iPhone8 cycle accelerates volume growth for all three iPhone
assemblers: Hon Hai, Pegatron and Wistron. Timing of this growth varies. Hon Hai leads
the pack in 2017 with a 100% allocation of the iPhone 8 OLED model (the other two gain
share in 2018 as OLED displays are adopted in all models), but gives up share of LTPS
models (Pegatron gains share in the 4.7"; Wistron in the 5.5" model). Hon Hai remains our
top buy in the Asia Hardware sector despite a 21% YTD share price appreciation.

23 May 2017
iPhone and its supply chain 4
Table of contents
Focus tables 2
iPhone and its supply chain 3
iPhone 8: Rising demand; rising price ...................................................................... 3
Display, casing, 3D-sensing: Likely major changes ................................................. 3
Asian semis: The Big 2 to make more money .......................................................... 3
US/European semis: iPhone a smaller part of the mix ............................................. 3
Assembly: Rising tide might lift all boats .................................................................. 3
iPhone 8—supply chain and valuations 5
iPhone 8: Rising demand, rising price 9
iPhone 8: A major update in a super cycle ............................................................... 9
Unit Outlook heading to 270 mn units at least........................................................ 13
Raising price could offset BOM pressure ............................................................... 16
Scenarios analysis—US$14 EPS power in bull case ............................................ 20
Display, casing, 3D-sensing: Likely major changes 22
OLED—the new path for iPhone displays .............................................................. 22
Casing/ cover glass: A major change in all iPhone 8s ........................................... 25
Camera upgrade and 3D sensing .......................................................................... 26
Acoustic .................................................................................................................. 28
Haptics .................................................................................................................... 29
PCB ........................................................................................................................ 29
Passive Components .............................................................................................. 30
RF Front End/Wifi Module ...................................................................................... 30
Asian semis: The Big 2 to make more money 31
Foundry and backend ............................................................................................. 31
Memory: Largely an ASP-led dollar content gain ................................................... 33
How AAPL's DRAM demand impacts Samsung .................................................... 34
Fingerprint and touch sensor .................................................................................. 39
US/European semis: iPhone a smaller part of the mix 41
US Semis: iPhone 8 Implications ........................................................................... 41
EU Semis: iPhone 8 implications ........................................................................... 44
Assembly: Rising tide might lift all boats 47
Increase estimates for Hon Hai, Pegatron and Wistron ....................................... 47
Potential risks with QCOM complaint filing on 17 May ........................................... 48
Hon Hai: Top pick among iPhone assemblers (OUTPERFORM, raising TP to
NT$120 from NT$105) ............................................................................................ 48
23 May 2017
iPhone and its supply chain 5
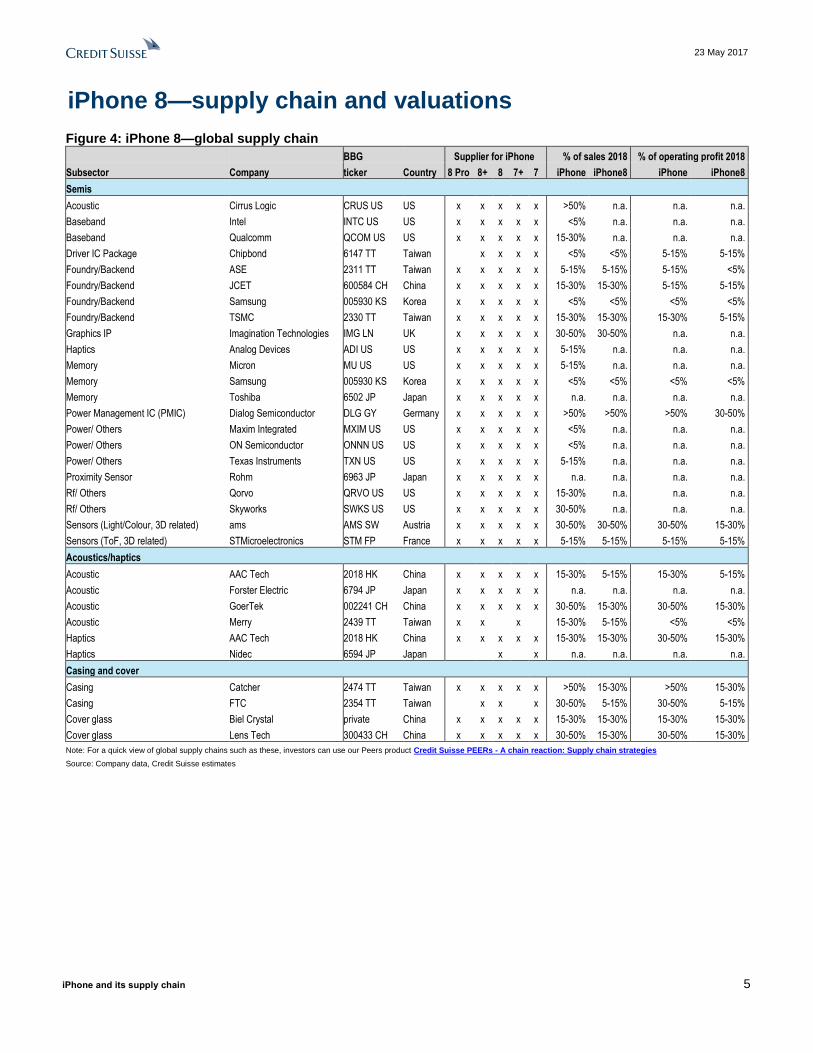
iPhone 8—supply chain and valuations
Figure 4: iPhone 8—global supply chain
BBG Supplier for iPhone % of sales 2018 % of operating profit 2018
Subsector Company ticker Country 8 Pro 8+ 8 7+ 7 iPhone iPhone8 iPhone iPhone8
Semis
Acoustic Cirrus Logic CRUS US US x x x x x >50% n.a. n.a. n.a.
Baseband Intel INTC US US x x x x x <5% n.a. n.a. n.a.
Baseband Qualcomm QCOM US US x x x x x 15-30% n.a. n.a. n.a.
Driver IC Package Chipbond 6147 TT Taiwan x x x x <5% <5% 5-15% 5-15%
Foundry/Backend ASE 2311 TT Taiwan x x x x x 5-15% 5-15% 5-15% <5%
Foundry/Backend JCET 600584 CH China x x x x x 15-30% 15-30% 5-15% 5-15%
Foundry/Backend Samsung 005930 KS Korea x x x x x <5% <5% <5% <5%
Foundry/Backend TSMC 2330 TT Taiwan x x x x x 15-30% 15-30% 15-30% 5-15%
Graphics IP Imagination Technologies IMG LN UK x x x x x 30-50% 30-50% n.a. n.a.
Haptics Analog Devices ADI US US x x x x x 5-15% n.a. n.a. n.a.
Memory Micron MU US US x x x x x 5-15% n.a. n.a. n.a.
Memory Samsung 005930 KS Korea x x x x x <5% <5% <5% <5%
Memory Toshiba 6502 JP Japan x x x x x n.a. n.a. n.a. n.a.
Power Management IC (PMIC) Dialog Semiconductor DLG GY Germany x x x x x >50% >50% >50% 30-50%
Power/ Others Maxim Integrated MXIM US US x x x x x <5% n.a. n.a. n.a.
Power/ Others ON Semiconductor ONNN US US x x x x x <5% n.a. n.a. n.a.
Power/ Others Texas Instruments TXN US US x x x x x 5-15% n.a. n.a. n.a.
Proximity Sensor Rohm 6963 JP Japan x x x x x n.a. n.a. n.a. n.a.
Rf/ Others Qorvo QRVO US US x x x x x 15-30% n.a. n.a. n.a.
Rf/ Others Skyworks SWKS US US x x x x x 30-50% n.a. n.a. n.a.
Sensors (Light/Colour, 3D related) ams AMS SW Austria x x x x x 30-50% 30-50% 30-50% 15-30%
Sensors (ToF, 3D related) STMicroelectronics STM FP France x x x x x 5-15% 5-15% 5-15% 5-15%
Acoustics/haptics
Acoustic AAC Tech 2018 HK China x x x x x 15-30% 5-15% 15-30% 5-15%
Acoustic Forster Electric 6794 JP Japan x x x x x n.a. n.a. n.a. n.a.
Acoustic GoerTek 002241 CH China x x x x x 30-50% 15-30% 30-50% 15-30%
Acoustic Merry 2439 TT Taiwan x x x 15-30% 5-15% <5% <5%
Haptics AAC Tech 2018 HK China x x x x x 15-30% 15-30% 30-50% 15-30%
Haptics Nidec 6594 JP Japan x x n.a. n.a. n.a. n.a.
Casing and cover
Casing Catcher 2474 TT Taiwan x x x x x >50% 15-30% >50% 15-30%
Casing FTC 2354 TT Taiwan x x x 30-50% 5-15% 30-50% 5-15%
Cover glass Biel Crystal private China x x x x x 15-30% 15-30% 15-30% 15-30%
Cover glass Lens Tech 300433 CH China x x x x x 30-50% 15-30% 30-50% 15-30%
Note: For a quick view of global supply chains such as these, investors can use our Peers product Credit Suisse PEERs - A chain reaction: Supply chain strategies
Source: Company data, Credit Suisse estimates

23 May 2017
iPhone and its supply chain 6
Figure 5: iPhone 8—global supply chain (cont’d)
BBG Supplier for iPhone % of sales 2018 % of operating profit 2018
Subsector Company ticker Country 8 Pro 8+ 8 7+ 7 iPhone iPhone8 iPhone iPhone8
Imaging
3D sensing Himax HIMX US Taiwan x <5% <5% 15-30% 15-30%
3D sensing Win Semi 3105 TT Taiwan x <5% <5% 5-15% 5-15%
Camera Lens Genius 3406 TT Taiwan x x x x x n.a. n.a. n.a. n.a.
Camera Lens Largan 3008 TT Taiwan x x x x x >50% 15-30% n.a. n.a.
Camera module Cowell 1415 HK China x x x x x >50% >50% >50% >50%
Camera module LGI 011070 KS Korea x x x x x 30-50% 15-30% 30-50% 30-50%
Camera module Shenzhen O-film 002456 CH CNY x x x x x 15-30% 15-30% 15-30% 15-30%
Display related
Display JDI 6740 JP Japan x x x x n.a. n.a. n.a. n.a.
Display LGD 034220 KS Korea x x x x 5-15% <5% 5-15% <5%
Display Radiant 6176 TT Taiwan x x x x 5-15% 5-15% 5-15% 5-15%
Display Samsung 005930 KS Korea x <5% <5% <5% <5%
Display Sharp 6753 JP Japan x x n.a. n.a. n.a. n.a.
Touch GIS 6456 TT Taiwan x x x x x 30-50% 15-30% >50% 30-50%
Touch Nissha Printing 7915 JP Japan x n.a. n.a. n.a. n.a.
Touch TPK 3673 TT Taiwan x x x x x 30-50% 15-30% 30-50% 30-50%
Misc./ multiple components
Battery TDK 6762 JP Japan x x x x x n.a. n.a. n.a. n.a.
Battery, RF devices Samsung SDI 006400 KS Korea x x x x x <5% <5% <5% <5%
Battery/CIS SONY 6758 JP Japan x x x x x n.a. n.a. n.a. n.a.
Quartz Crystal Daisinku 6962 JP Japan x x x x x n.a. n.a. n.a. n.a.
Quartz Crystal Nihon Dempa 6779 JP Japan x x x x x n.a. n.a. n.a. n.a.
Quartz Crystal Seiko Epson 6724 JP Japan x x x x x n.a. n.a. n.a. n.a.
Quartz Crystal TXC 3042 TT Taiwan x x x x x 5-15% <5% n.a. n.a.
Rubber ring Tongda 698 HK China x x x x x 5-15% 5-15% 5-15% 5-15%
VCM/OIS/Haptic/Mech/Backlight Alps 6770 JP Japan x x x x x n.a. n.a. n.a. n.a.
VCM/OIS/Haptic/Mech/Backlight MinebeaMitsumi 6479 JP Japan x x x x x n.a. n.a. n.a. n.a.
PCB/ connectors/ passive
Ceramic Package/MLCC/Connector Kyocera 6971 JP Japan x x x x x n.a. n.a. n.a. n.a.
Ceramic Package/MLCC/Connector NGK Spark Plug 5334 JP Japan x x x x x n.a. n.a. n.a. n.a.
Connector Hirose 6806 JP Japan x x x x x n.a. n.a. n.a. n.a.
Connector JAE 6807 JP Japan x x x x x n.a. n.a. n.a. n.a.
Connector/ cable Luxshare 002475 CH China x x x x x 30-50% 15-30% 30-50% 15-30%
HDI/FC-CSP Ibiden 4062 JP Japan x n.a. n.a. n.a. n.a.
Passive components Taiyo Yuden 6976 JP Japan x x x x x n.a. n.a. n.a. n.a.
Passive, Connector, RF devices Murata 6981 JP Japan x x x x x n.a. n.a. n.a. n.a.
PCB Kinsus 3189 TT Taiwan x x x x x 15-30% 5-15% 15-30% 5-15%
PCB NYPCB 8046 TT Taiwan x x x x x <5% <5% n.a. n.a.
PCB Unimicron 3037 TT Taiwan x x x x x 5-15% <5% n.a. n.a.
Power Inductor/MLCC Delta 2308 TT Taiwan x x x x x 5-15% <5% n.a. n.a.
EMS
Assembly Hon Hai 2317 TT Taiwan x x x 30-50% 30-50% 30-50% 30-50%
Assembly Pegatron 4938 TT Taiwan x x >50% 30-50% >50% 30-50%
Assembly Wistron 3231 TT Taiwan x x 30-50% 30-50% 30-50% 15-30%
Note: For a quick view of global supply chains such as these, investors can use our Peers product Credit Suisse PEERs - A chain reaction: Supply chain strategies
Source: Company data, Credit Suisse estimates

23 May 2017
iPhone and its supply chain 7
Figure 6: iPhone 8 global supply chain—valuation comparison
BBG Price TP P/E (x) CS EPS growth
(%)
P/B (x) Div. yield
Subsector Company Ticker Curr. Rat loc curr. loc curr. 2017 2018 2017 2018 2017 2017
Semis
Acoustic Cirrus Logic CRUS US USD NC 65.07 n.a. 14.2 13.5 n.a. n.a. 1.5 -
Baseband Intel INTC US USD N 35.77 35.00 12.6 11.9 4.8 5.5 2.3 2.8
Baseband Qualcomm QCOM US USD R 59.28 n.a. 13.2 13.9 n.a. n.a. (1.9) 3.7
Driver IC Package Chipbond 6147 TT TWD O 43.95 54.00 13.1 11.2 16.4 19.1 1.2 5.0
Foundry/Backend ASE 2311 TT TWD R 37.60 n.a. 15.1 13.4 (6.0) 14.8 1.7 3.8
Foundry/Backend JCET 600584 CH CNY U 16.43 11.80 140.8 99.9 9.1 38.9 2.4 0.1
Foundry/Backend Samsung 005930 KS KRW O 2,255,000 2,900,000 8.7 8.0 65.1 10.2 1.3 1.6
Foundry/Backend TSMC 2330 TT TWD N 205.00 202.00 15.9 14.6 6.4 10.6 3.5 3.4
Graphics IP Imagination Technologies IMG LN GBP N 101.25 100.00 14.8 (41.1) 24.8 n.a. 1.8 -
Haptics Analog Devices ADI US USD O 82.09 100.00 20.5 17.5 29.5 17.5 3.2 1.2
Memory Samsung 005930 KS KRW O 2,255,000 2,900,000 8.7 8.0 65.1 10.2 1.3 1.6
Memory Toshiba 6502 JP JPY N 230.00 223.00 5.3 5.9 n.a. (7.7) (2.3) -
Power Management IC (PMIC) Dialog Semiconductor DLG GY EUR O 42.82 54.00 17.8 14.0 33.6 18.6 2.8 -
Power/ Others ON Semiconductor ONNN US USD U 15.57 13.50 12.3 10.4 39.8 18.2 2.9 -
Power/ Others Texas Instruments TXN US USD O 80.37 95.00 20.0 18.9 13.1 5.9 7.2 2.4
Proximity Sensor Rohm 6963 JP JPY O 8,560.00 8,400.00 28.7 21.9 9.8 34.0 1.3 1.2
Rf/ Others Qorvo QRVO US USD NC 78.07 n.a. 13.4 11.6 n.a. n.a. 23.1 -
Sensors (Light/Colour, 3D related) ams AMS SW CHF O 63.20 72.00 45.1 14.9 (11.4) 212.4 4.5 0.2
Sensors (ToF, 3D related) STMicroelectronics STM FP EUR N 14.37 15.50 21.0 16.1 171.8 31.0 2.9 1.5
Acoustic Cirrus Logic CRUS US USD NC 65.07 n.a. 14.2 13.5 n.a. n.a. 1.5 -
Baseband Intel INTC US USD N 35.77 35.00 12.6 11.9 4.8 5.5 2.3 2.8
Baseband Qualcomm QCOM US USD R 59.28 n.a. 13.2 13.9 n.a. n.a. (1.9) 3.7
Acoustics/haptics
Acoustic AAC Tech 2018 HK HKD N 82.60 98.40 16.7 13.7 27.7 19.9 5.1 2.3
Acoustic Forster Electric 6794 JP JPY NC 1,737.00 n.a. 9.8 8.1 n.a. n.a. 331.9 n.a.
Acoustic GoerTek 002241 CH CNY O 17.54 21.60 24.2 20.8 28.7 14.8 4.2 0.6
Acoustic Merry 2439 TT TWD O 188.00 176.00 16.6 16.0 11.1 5.4 4.9 4.1
Haptics AAC Tech 2018 HK HKD N 82.60 98.40 16.7 13.7 27.7 19.9 5.1 2.3
Haptics Nidec 6594 JP JPY O 10,410.00 14,200.00 23.3 20.3 20.7 17.5 3.3 1.3
Casing and cover
Casing Catcher 2474 TT TWD O 317.50 350.00 11.7 10.3 1.5 16.0 1.8 3.1
Casing FTC 2354 TT TWD N 87.00 98.00 11.8 11.0 3.3 9.3 1.1 4.2
Cover glass Biel Crystal n.a. n.a. n.a. n.a. n.a. n.a. n.a. n.a. n.a. n.a. n.a.
Cover glass Lens Tech 300433 CH CNY O 34.24 42.40 32.7 21.8 81.8 47.6 4.7 0.6
Note: Closing price as at 22 May 2017 Source: Bloomberg, IBES, Thomson Reuters, Company data, Credit Suisse estimates

23 May 2017
iPhone and its supply chain 8
Figure 7: iPhone 8 global supply chain—valuation comparison table (cont’d)
BBG Price TP P/E (x) CS EPS growth (%) P/B
(x)
Div. yield
Subsector Company Ticker Curr. Rat loc. curr. loc. curr. 2017 2018 2017 2018 2017 2017
Imaging
3D sensing Himax HIMX US USD N 6.93 6.70 92.8 23.0 (74.7) 303.3 2.7 0.9
3D sensing Win Semi 3105 TT TWD N 127.50 125.00 16.1 13.0 12.0 25.7 2.7 3.5
Camera Lens Genius 3406 TT TWD NC 310.00 n.a. n.a. n.a. n.a. n.a. 83.8 n.a.
Camera Lens Largan 3008 TT TWD O 4,900.00 5,200.00 21.0 17.2 46.0 24.1 6.6 1.7
Camera module Cowell 1415 HK HKD NC 2.26 n.a. 5.0 4.1 n.a. n.a. 70.6 -
Camera module LGI 011070 KS KRW O 128,000 165,000 13.2 12.4 4,656.2 7.9 1.5 0.3
Display related
Display JDI 6740 JP JPY N 206.00 250.00 8.4 12.5 n.a. (31.4) 0.3 2.4
Display LGD 034220 KS KRW N 29,250 30,600 6.5 10.7 91.5 (38.2) 0.7 1.7
Display Radiant 6176 TT TWD U 64.20 45.00 10.0 10.7 0.6 (4.7) 1.3 6.6
Display Samsung 005930 KS KRW O 2,255,000 2,900,000 8.7 8.0 65.1 10.2 1.3 1.6
Display Sharp 6753 JP JPY U 420.00 180.00 40.8 33.4 n.a. 24.8 6.0 -
Touch GIS 6456 TT TWD NC 219.00 n.a. 16.2 13.9 n.a. n.a. 44.1 n.a.
Touch Nissha Printing 7915 JP JPY O 2,971.00 3,700.00 18.2 8.6 n.a. 118.3 1.9 1.5
Touch TPK 3673 TT TWD N 102.50 95.00 11.3 12.7 n.a. (9.2) 1.1 4.4
Misc./ multiple components
Battery TDK 6762 JP JPY N 6,870.00 8,500.00 11.7 11.0 6.7 9.3 1.1 1.7
Battery, RF devices Samsung SDI 006400 KS KRW N 156,500 115,000 24.1 19.9 108.2 23.0 1.0 0.6
Battery/CIS SONY 6758 JP JPY O 3,943.00 4,300.00 17.8 16.5 523.5 10.7 1.7 2.0
Quartz Crystal Daisinku 6962 JP JPY NC 1,547.00 n.a. 16.1 13.2 n.a. n.a. 11.4 n.a.
Quartz Crystal Nihon Dempa 6779 JP JPY NC 889.00 n.a. 20.1 17.5 n.a. n.a. 42.3 n.a.
Quartz Crystal Seiko Epson 6724 JP JPY NC 2,320.00 n.a. 14.1 12.5 n.a. n.a. 20.5 n.a.
Quartz Crystal TXC 3042 TT TWD N 43.05 45.00 11.9 10.9 14.0 9.4 1.2 6.7
Rubber ring Tongda 698 HK HKD N 2.63 2.50 12.9 10.6 28.4 21.0 3.0 2.3
VCM/OIS/Haptic/Mech/Backlight Alps 6770 JP JPY O 3,220.00 3,400.00 13.3 11.5 36.8 19.2 2.1 1.1
VCM/OIS/Haptic/Mech/Backlight MinebeaMitsumi 6479 JP JPY NC 1,743.00 n.a. 17.0 16.0 n.a. n.a. (4.2) n.a.
PCB/ connectors/ passive
Ceramic Package/MLCC/Connector Kyocera 6971 JP JPY N 6,493.00 6,400.00 22.5 21.1 13.7 9.4 1.0 1.5
Ceramic Package/MLCC/Connector NGK Spark Plug 5334 JP JPY O 2,308.00 3,000.00 11.9 9.5 17.1 27.7 1.2 2.5
Connector Hirose 6806 JP JPY N 14,660.00 13,900.00 24.2 22.5 3.2 10.4 1.7 1.6
Connector JAE 6807 JP JPY N 1,483.00 1,600.00 10.7 9.2 28.6 20.0 1.1 2.0
Connector/ cable Luxshare 002475 CH CNY O 29.14 32.60 33.0 25.5 n.a. 27.7 4.8 0.4
HDI/FC-CSP Ibiden 4062 JP JPY U 1,964.00 1,340.00 36.3 31.3 n.a. 18.9 1.0 1.8
Passive components Taiyo Yuden 6976 JP JPY N 1,544.00 1,000.00 23.6 20.0 45.1 20.3 1.2 1.3
Passive, Connector, RF devices Murata 6981 JP JPY O 15,810.00 18,200.00 17.2 15.3 20.0 14.9 2.2 1.5
PCB Kinsus 3189 TT TWD N 79.30 76.00 17.0 14.4 (0.8) 20.0 1.2 4.4
PCB NYPCB 8046 TT TWD N 25.15 26.00 (80.8) 21.0 69.2 n.a. 0.5 -
PCB Unimicron 3037 TT TWD N 17.45 14.00 62.0 23.7 n.a. 160.4 0.6 1.5
Power Inductor/MLCC Delta 2308 TT TWD O 167.00 190.00 20.7 18.7 18.7 12.6 3.3 3.4
EMS
Assembly Hon Hai 2317 TT TWD O 102.50 120.00 10.8 9.4 10.2 15.3 1.5 4.4
Assembly Pegatron 4938 TT TWD N 92.80 85.00 10.8 9.3 14.1 16.8 1.6 5.4
Assembly Wistron 3231 TT TWD O 27.30 34.00 11.3 8.6 100.9 32.5 1.0 4.4
Note: Closing price as at 22 May 2017 Source: Bloomberg, IBES, Thomson Reuters, Company data, Credit Suisse estimates

23 May 2017
iPhone and its supply chain 9
iPhone 8: Rising demand, rising price In this section, we present our outlook for the iPhone business heading into the iPhone 8
Super-cycle, based on all the available evidence (please see full report for more details).
We maintain our long-standing view that there is significant pent-up demand in terms of
volume and raise our unit estimates slightly to 229 mn/250 mn/270 mn in CY17/18/19.
Additionally, our analysis of pricing trends suggests that Apple's ability to further raise
pricing remains intact. Given this and a better view on the mix, we raise our ASPs to
US$676/US$704/US$676 in CY17/18/19. Our analysis does conclude that the improved
mix as well as pricing could offset the anticipated BOM increase and we arrive at three
main conclusions:
Units heading to 270 mn. Our bias has been to look at the impact of the Apple
product cycle over two years and not just one, as we anticipate the OLED
penetration of Apple's complete portfolio will take place over two years. We rely
on our installed base model to forecast unit shipments, which we then cross-
check with high-end market share and share by region. We conclude that iPhone
volumes will see robust growth from 214 mn in 2016, to 230 mn/250 mn/270 mn
in 2017/2018/2019 or a CAGR of 8%.
ASPs to rise, multiple reasons why a price increase may be implemented.
Given a significant feature upgrade, relative lack of elasticity observed so far, an
affluent user base as well as the price increases on Samsung's Galaxy 8 devices,
we assume the starting prices for the three new models at
US$670/US$770/US$900, which are referred to here as iPhone 8/8 Plus and
8 Pro for the sake of naming convention. Given that we assume a 45%/40% mix
of the Pro model in 2017/2018, this positively impacts ASPs, which we now see at
US$676/US$704 for CY17/18.
BOM higher, but mix and pricing key. We acknowledge that the BOM for the
OLED version will be US$55 higher than the comparable iPhone 7 Plus at launch,
per our teardown analysis performed in conjunction with our Asian Team. We also
assume that the iPhone 8 and iPhone 8 Plus see higher BOM by around US$10-
15. However given the price increase discussed above as well our mix
assumptions, we see the iPhone GM rising to 39% in 2018 versus 38% in 2016.
Figure 8: iPhone mini P&L—LT revenue of US$183 bn and GP of US$69 bn
CY14 CY15 CY16 CY17 CY18 CY19
iPhone revenue (US$ mn) 120,675 155,494 139,443 154,849 175,928 182,625
as % total revenue 60.4% 66.2% 63.9% 64.7% 65.8% 65.3%
iPhone unit ('000) 192,662 231,529 215,395 228,986 249,828 270,054
ASP (US$) 626 672 647 676 704 676
Gross profit (US$ mn) 50,109 64,281 53,484 57,123 68,319 69,039
as % total GP 63.9% 68.2% 63.7% 62.8% 63.9% 61.5%
Gross margin % 41.5% 41.3% 38.4% 36.9% 38.8% 37.8%
Source: Company data, Credit Suisse estimates
iPhone 8: A major update in a super cycle
Before discussing the unit, ASP or margin outlook, we need to arrive at the importance of
the actual feature set, as this impacts all of these assumptions. Please see the following
figure for details of the expected features. Our base case is as follows:
■ Launch of three Models. Unlike previous years, we believe that Apple will launch
three devices: the iPhone (4.7 inch), iPhone 8 (5.5 inch) Plus and the iPhone Pro (5.8
inch) device.
■ The OLED model featuring Iris recognition or in-display fingerprint. We now think
the OLED model is likely to adopt Iris recognition or in-display finger footprint
Kulbinder Garcha

23 May 2017
iPhone and its supply chain 10
recognition. The home button will be removed as a result. As development of in-display
finger footprint recognition for the Galaxy S8 has missed the deadline, it remains to be
seen whether the development will be completed over the next couple of months for
the iPhone 8 launch. We expect the 4.7- and 5.5-inch LCD models to feature a
fingerprint scanner in the home button, as they do today.
■ Better cameras featuring dual OIS; possibly more advanced laser auto focus. We
think the 5.8-inch OLED model will have dual main cameras and OIS/OIS. We also
think the laser auto-focus may be adopted. We expect the 4.7-inch LCD model to have
a single camera with OIS and the 5.5-inch model to feature dual main cameras and a
combination OIS/VCM, on par with the iPhone 7.
■ Faster application processor based on 10nm FinFET. We forecast adoption of A11
10nm FinFET/InFO WLP, which will improve processing performance.
■ More storage and memory. For NAND, we think all three models will feature two
memory specs: 64Gb and 256Gb, with some regions likely to adopt 512Gb. We also
expect all models to feature 3Gb of DRAM.
■ L-shaped battery to improve capacity. In the OLED model, in addition to reduction in
substrate area due to SLP, we think the li-ion polymer battery will be larger due to an L-
shaped design, which will help the battery capacity.
We note that the above is a major relative upgrade to the iPhone portfolio, which impacts
our assumptions for future rates of replacement and upgrades.
BOM pressures are evident
A glance at Figure shows that across all of the improved hardware-related features, there
will be an associated rise in the BOM. The increase should be most pronounced in the
iPhone 8 Pro (OLED version), where it could be some US$55 higher than the 7 Plus
device. We also assume that the BOM will be about US$10-15 higher for the iPhone 8 and
Plus device compared with last year's models.
■ iPhone 8 Pro BOM higher by US$55. Across all of the improved hardware-related
features, there will be a rise in the BOM as well, specifically in the OLED version, which
we estimate as much as US$55 (compared to iPhone 7 Plus).
■ OLED and 3D Sensing major drivers of the BOM increase. We note that for the Pro
version, the larger screen adds US$27 to BOM (compared to iPhone 7 Plus) while 3D
Sensing and Gesture recognition adds a further US$12. Phone casing adds another
US$10. These three hardware components are responsible for the bulk of the BOM
increase.
■ Base models to increase as well. We assume that base models see an increase in
BOM of US$10-15 based on all the other major features such as new materials for the
body.

23 M
ay 2
017
iPh
on
e a
nd
its s
up
ply
ch
ain
1
1
Figure 4: iPhone 9 sees a major update in features to drive unit growth and better mix
Source: Company data, Credit Suisse estimates
iPhone6 iPhone6Plus iPhone6s iPhone6s Plus iPhone SE iPhone7 iPhone7 Plus iPhone8 4.7" iPhone8 5.5" iPhone 2017 5.85"
Announce 9/10/2014 9/10/2014 9/9/2015 9/9/2015 3/22/2016 9/7/2016 9/7/2016 2017 2017 2017
Release 9/19/2014 9/19/2014 9/25/2015 9/25/2015 3/31/2016 9/16/2016 9/16/2016 15-20% 10-15% 70%
Height (mm) 138.1 158.1 138.3 158.2 123.8 138.3 158.2 - -
Width (mm) 67 77.8 67.1 77.9 58.6 67.1 77.9 - -
Thickness (mm) 6.9 7.1 7.1 7.3 7.6 7.1 7.3 - -
Weight (g) 129 172 143 192 113 138 188 - -
Display size (inch) 4.7" in-cell 5.5" in-cell 4.7" in-cell 5.5" in-cell 4" 4.7" in-cell 5.5" in-cell 4.7" in-cell 5.5" in-cell5.85" OLED with
G/F2
Display resolution (px) 1334x750px 1920x1080px 1334x750px 1920x1080px 1,136 x 640px 1334x750px 1920x1080px 1334x750px 1920x1080pxWQHD
(2560x 1440px)
Display (ppi) 326ppi 401ppi 326ppi 401ppi 326ppi 326ppi 401ppi 326ppi 401ppi --
8M 8M&OIS 12MP 12MP & OIS 12MP 12MP OIS
12MP OIS (Wide
Angel)
12MP VCM
(Telephoto)
12MP OIS
12MP OIS (Wide
Angel)
12MP VCM
(Telephoto)
12MP OIS (Wide
Angel)
12MP OIS
(Telephoto)
Laser AF
F2.2, 1/3", 1.5μm F2.2, 1/3", 1.5μm F2.2, NA, 1.22μm F2.2, NA, 1.22μmF2.2, 1/3", 1.22 µ
mF1.8
Wide-Angle F1.8
Telephoto F2.8F1.8
Wide-Angle F1.8
Telephoto F2.8NA
Camera (front) 1.2M 1.2M 5MP 5MP 1.2M 7MP 7MP 7MP 7MP7MP
Iris recognition
Wifi
Dual band
802.11a/b/g/n/ac
Wi‑Fi
Dual band
802.11a/b/g/n/ac
Wi‑Fi
Dual band
802.11a/b/g/n/ac
Wi‑Fi
(MIMO)
Dual band
802.11a/b/g/n/ac
Wi‑Fi
(MIMO)
Wi-Fi 802.11
a/b/g/n/ac,
hotspot
Dual band
802.11a/b/g/n/ac
Wi‑Fi
(MIMO)
Dual band
802.11a/b/g/n/ac
Wi‑Fi
(MIMO)
Dual band
802.11a/b/g/n/ac
Wi‑Fi
(MIMO)
Dual band
802.11a/b/g/n/ac
Wi‑Fi
(MIMO)
Dual band
802.11a/b/g/n/ac
Wi‑Fi
(MIMO)
Bluetooth Bluetooth 4.0 Bluetooth 4.0 Bluetooth 4.2 Bluetooth 4.2 Bluetooth 4.2 Bluetooth 4.2 Bluetooth 4.2 Bluetooth 4.2 Bluetooth 4.2 Bluetooth 4.2
CPU clock A8 /20nm & M8 A8 /20nm & M8 A9 A9 A9
CPU Core 64 bit 64 bit 64bit 64bit 64bit 64bit 64bit 64bit 64bit 64bit
CPU Die size 89 sqmm 89 sqmm 96 sqmm 96 sqmm 96 sqmm NA NA NA NA NA
GPU Core
Power VR
GX6450
(Quadl Core)
Power VR
GX6450
(Quad Core)
PowerVR 7XT
GT7600
(Hexa Core)
PowerVR 7XT
GT7600
(Hexa Core)
PowerVR
GT7600
(six-core
graphics)
NA NA NA NA NA
NAND16GB/64GB/128
GB
16GB/64GB/128
GB
16GB/64GB/128
GB
16GB/64GB/128
GB16GB/64GBGB
DRAM 1GB 1GB 2GB 2GB 2GB 2GB 3GB 3GB 3GB 3GB
Battery capacity 1810mAh 2915mAh 1715mAh 2915mAh 1642 mAh - - - - -
Casing
Aluminum
(space
grey/gold/silver)
Aluminum
(space
grey/gold/silver)
Aluminum
(rose gold/space
grey/gold/silver)
Aluminum
(rose gold/space
grey/gold/silver)
Aluminum
(rose gold/space
grey/gold/silver)
Aluminum
(jet
black/black/rose
gold/gold/silver)
Aluminum
(jet
black/black/rose
gold/gold/silver)
Glass + Metal Glass + Metal Glass + Metal
Connector Lightning/8 pins Lightning/8 pins Lightning/8 pins Lightning/8 pins Lightning/8 pins
Camera (main)
Lightning and Jack Adaptor
32GB/128GB/256GB 64GB/256GB
USB Type-C
A11 w/FO-WLP
Quad Core A10
(Added 2 lower power consumption
cores)
iPhone 8/ 8 Plus
• LCD display
• Dual-camera on 8 Plus
• Storage/Memory (64/256GB,
3G DRAM)
• Touch ID/Home button
• A11 10nm FinFET
iPhone 8 Pro– Expecting a
complete form factor
overhaul.
• 5.85” OLED display (other two
are 4.7” and 5.5” w/ LCD)
• WQHD display resolution
• Display to take up edge to
edge
• 2.5D cover glass
• In display finger print, no home
button
• Glass body and metal case
• Dual camera with OIS/OIS and
auto laser focus
• A11 10nm FinFET AP
• 3G DRAM for all 3 models
• NAND 64G/256G only
• L-shaped battery
• USB Type-C
• Wireless charging

23 M
ay 2
017
iPh
on
e a
nd
its s
up
ply
ch
ain
1
2
Figure 10: BOM pressures are evident, but offsets remain …
Source: Company data, Credit Suisse estimates
iPhone 8 Pro
Component Specs Supplier Added cost 256GB New
Display & Touchscreen 5.8" OLED Display Flat Screen Samsung $27.00 $80.00 iPhone 8 Pro BOM higher by
$55
Force touch Enhanced Force Touch Broadcom IC $4.00 $14.00
Application Processor A11 processor on TSMC 10nm (potentially smaller die) Apple fabbed at TSMC $0.00 $26.90
Co-processor Cost down ($0.20) $1.80
Modem - Baseband, RF QCOM X16 10nm / INTC 7480 28nm Qualcomm and Intel $2.00 $18.00
WLAN / BT / FM / GPS Similar chip - Cost down Broadcom ($0.70) $6.30
NFC IC Similar chip - Cost down AMS ($0.25) $2.25
Memory (DRAM) Similar chip - DRAM price up Samsung $0.00 $24.00
Memory (NAND) Possible only 64/256GB Skus Toshiba, Hynix, Micron $44.80
Power amplifier + Switch Similar RF content Skyworks, Broadcom, Qorvo $8.00 Touchcreen 3D Sensing
major drivers
User Interface & Sensors 3D sensing + Gesture recognition
Bosch, Invensense, AKM, STM, Broadcom, TI +
3D sense: AMS, Himax, Lumentum/Finisar,
Viavi, Win Semi, LG Innotek
$12.00 $27.00
Fingerprint sensor Under glass sensor (remove sapphire) Apple fabbed at TSMC ($2.00) $6.00
Analog Similar contentDialog PMIC, Qualcomm PMD9635 PMIC,
Passives, TI, MXIM, ISIL$9.50
Audio Codec Cost down Cirrus Logic ($0.30) $2.70
Cameras Dual camera adds Dual OIS, but also cost down Sony, Largan ($2.00) $33.00
Battery $2.50 ASP for Pro version to rise to
offset BOM
PCB HDI + Flex PCB + Substrate Like PCB $0.00 $4.75
Charger Wireless Charging chipset $2.00 $5.00
Acoustics Dual speaker acoustics upgrade AAC, Goertek, Merry $3.80 $10.00
Haptics Similar content AAC $9.00
CasingStainless Steel frame $40-45 + 2.5D Front Glass $5 + 2.5D
back glass $10Foxconn Tech, Catcher, Jabil $10.00 $45.00
Box Contents $8.80
Total BOM cost $55.35 $389.30
Manufacturing Margin (8%) $31.14
IP Licensing (4% of BOM and Manufacturing) $16.82
ASP $1,000.00
Apple GM% 41%
Across all of the improved
hardware related features there
will be a rise in the BOM as well,
specifically in the OLED version ,
which we estimate as much as
$55 (compare to iPhone 7 Plus)
We note that for the Pro
version, the larger screen adds
$27 to BOM (compare to
iPhone 7 Plus) while 3D sensing
+ Gesture recognition adds
another $12. Phone casing adds
another $10. These three
hardware components are
responsible fo the bulk of the
BOM increase
We expect Apple to raise prices
on iPhone 8 versions of the
model, with price on the highest
skew to cross $1000. We
estimate the ASP on the highest
end skew of iPhone 8 Pro at
$1000, with GM of >40%.

23 May 2017
iPhone and its supply chain 13
Unit Outlook heading to 270 mn units at least
To assess the unit outlook for Apple iPhone business, we looked at it in three ways: (1) the
installed base model (which is our preference); (2) market share by price points; (3) and
market share by region. Based on all of these, we believe that Apple could see robust unit
growth towards 270 mn in the long term.
Installed base model, robust growth in the base help
As shown in Figure , Apple's installed base has seen robust growth over the past few
years from 440 mn at the end of 2014 to 600 mn/690 mn in 2015/2016 (+36%/+15% YoY)
despite relatively muted 6S and 7 cycles. We see the 8 Super-cycle could unleash the
pent-up demand for the 10th anniversary iPhones, driving unit shipments to
229mn/250mn/270mn in 2017/2018/2019 with the iPhone installed base expanding to
775mn/890mn/970mn. There two key assumptions here:
Figure 5: iPhone installed base growth and normalisation of replacement, we see units toward 270 mn LT
iPhone global installed base analysis (mn) 2014 2015 2016E 2017E 2018E 2019E 2020E
iPhone subs 440.0 600.0 690.0 775.0 890.0 970.0 1,025.0
Gross add 140.0 180.0 120.0 125.0 155.0 130.0 110.0
Churn 33.9 20.0 30.0 40.0 40.0 50.0 55.0
as % of subs 10.2% 4.5% 5.0% 5.8% 5.2% 5.6% 5.7%
Sub net adds 106.1 160.0 90.0 85.0 115.0 80.0 55.0
Replacement units demanded 125.2 185.3 232.3 263.3 300.0 345.1 376.1
Adjusted replacement rate 37.5% 42.1% 38.7% 38.2% 38.7% 38.8% 38.8%
Adjusted replacement cycle (in months) 32.0 28.5 31.0 31.5 31.0 31.0 31.0
Total iPhone units demanded 265.2 365.3 352.3 388.3 455.0 475.1 486.1
Second hand phones recycled into the base 75.0 135.0 135.0 159.0 205.0 205.0 216.0
iPhone unit sell-through 190.2 230.3 217.3 229.3 250.0 270.1 270.1
iPhone units Sell-in 191.0 233.0 214.3 229.3 250.0 270.1 270.1
yoy % 26.0% 22.0% -8.0% 7.0% 9.0% 8.0% 0.0%
Source: Company data, Credit Suisse estimates
Replacement or upgrade rate. We note that the rate of Apple replacement or upgrades
has tended to fluctuate with the significance of the new features. This has been anywhere
between 28.5 months and 32 months (see Figure ). Additionally, any long-term
assumption needs to take into account changes in the regional mix as well. The iPhone
replacement cycle was 31.5 months in 2016, by our estimate. As Apple has one of the
fastest upgrade rates versus other brands, we assume a slight acceleration going forward
to 31 months.
Android switchers or gross adds. We note that a more competitive offering could also
mean that gross additions from other Android users should grow. We note that in 2015 this
reached 180 mn. However, going forward, we assume 155 mn in 2018, before declining to
130 mn/110 mn in 2019/2020.
Market share price point—growing the high end again
While 1.4 bn smartphones were sold in 2016 and we expect 1.6 bn in 2017, we note that
Apple has continued its premium segmentation and is really only operating in the above-
US$350 ASP segment. We point out that in the premium segment with an ASP above
US$700, iPhone commands a 74% market share and so by itself can be a driver of the
market. In the market with an ASP between US$500 and US$700, Apple takes ~50%
market share.

23 May 2017
iPhone and its supply chain 14
Figure 6: iPhones dominate the higher end market with ASP above US$500
iPhone share by price band 2013 2014 2015 2016 2017E 2018E 2019E
Global market 1,018,738 1,301,690 1,437,250 1,433,893 1,552,061 1,694,088 1,799,905
Apple units 153,448 192,650 231,530 215,403 228,986 249,828 270,054
% of market 15% 15% 16% 15% 15% 15% 15%
<US$200 442,369 668,226 770,022 737,663 819,816 874,914 926,647
Apple units 24 0 48 763 170 314 68
% of <US$200 market 0% 0% 0% 0% 0% 0% 0%
US$200-300 137,722 159,540 172,857 211,224 207,648 238,102 246,890
Apple units 55 1,898 1,250 5,849 4,776 2,381 5,678
% of US$200-300 market 0% 1% 1% 3% 2% 1% 2%
US$300-400 78,876 97,698 100,879 139,008 144,342 157,550 167,391
Apple Units 7,290 9,898 3,687 11,919 8,661 9,453 10,043
% of US$300-400 market 9% 10% 4% 9% 6% 6% 6%
US$400-500 67,218 63,710 59,961 59,111 62,082 67,764 71,996
Apple units 11,775 12,094 7,218 16,293 11,796 10,842 9,432
% of US$400-500 market 18% 19% 12% 28% 19% 16% 13%
US$500-700 187,641 189,282 153,988 141,733 155,206 169,409 215,989
Apple units 73,617 79,631 85,923 72,670 80,707 83,349 112,314
% of US$500-700 market 39% 42% 56% 51% 52% 49% 52%
US$700+ 104,913 123,235 179,542 145,154 162,966 186,350 170,991
% of Global market 10% 9% 12% 10% 11% 11% 10%
Apple units 60,686 89,130 133,405 107,910 122,877 143,489 132,518
% of US$700+ market 58% 72% 74% 74% 75% 77% 78%
Source: Company data, Credit Suisse estimates
US$500+ ASP segment has grown to unprecedented levels … Based on our
expectations for the iPhone8 as well as Samsung Galaxy 8's sales so far, we now believe
that the premium segment will grow and rise to 204 mn/227 mn/245 mn for Apple in
2017/2018/2019. Specifically, we note that the premium tier at the very high end with ASP
above US$700 is set to expand to 163mn/186mn/171mn in 2017/2018/2019. We believe
that such growth comes at the expense of alternative computer devices, mainly the tablet
market.
Apple gaining … Samsung losing. In the above-US$500 smartphone market, Apple has
enjoyed a market share above 60% over the past 2-3 years. We expect it to maintain the
same dominant position in the premier tier, but grow share in the US$700+ market with the
success of the iPhone 8. We expect this share gain for Apple to come at the expense of
Samsung, and that Samsung's market share will decline to 25% in the US$500+ market in
two years from 37% in 2013.

23 May 2017
iPhone and its supply chain 15
Figure 7: High-end market to grow driven by iPhone … Figure 8: … iPhone dominates with a 64% market share
Source: Company data, Credit Suisse estimates Source: Company data, Credit Suisse estimates
Market share by region—NA drives growth and an inflection in China
As shown in Figure , Apple's market share has kept constant at 15-16% globally, but has
seen fluctuations regionally, based on its product cycles. We note that in the past year
there have been very different geographic trends—with North America (NA) stronger and
China weaker. We believe that based on the quality of its offering of the iPhone 8 cycle,
Apple could further increase its strength in NA as well as in China.
Figure 9: Apple maintain 15% global market share—stronger in North America and weaker in China
iPhone market share by region 2013 2014 2015 2016 2017 2018 2019
APAC (ex. Japan) 8.6% 9.2% 12.5% 9.5% 9.5% 9.7% 10.3%
Western Europe 19.6% 21.2% 23.6% 26.3% 25.0% 25.0% 25.0%
Japan 41.0% 50.0% 47.3% 51.4% 51.0% 50.0% 50.0%
North America 39.3% 38.4% 39.3% 38.1% 39.2% 39.3% 39.3%
CEMA 7.7% 7.7% 7.4% 7.6% 7.6% 7.6% 7.6%
Latin America 5.5% 5.2% 4.7% 5.1% 5.0% 5.0% 5.0%
Total as % of global market share 15.1% 14.8% 16.1% 15.0% 14.8% 14.7% 15.0%
Source: Company data, Credit Suisse estimates
Market share woes in China a concern, but we believe more a function of product
cycles. As shown in Figure , Apple's market share in China has come under severe
pressure, declining from 12.5% at its peak to 9.5% now. We note, however, that this has
been much more a function of its product cycle and believe that its replacement rates tend
to vary year to year.
0
50
100
150
200
250
300
350
400
2013 2014 2015 2016 2017E 2018E 2019E
ASP
$5
00
+ u
nit
s (m
n)
Apple Samsung Huawei Other
0%
10%
20%
30%
40%
50%
60%
70%
80%
90%
100%
2013 2014 2015 2016 2017E 2018E 2019E
Apple Samsung Huawei Other

23 May 2017
iPhone and its supply chain 16
Figure 10: Apple's share in China fluctuates more with the product cycle
Source: Company data, Credit Suisse estimates
Our conviction at this point comes from the fact that iOS users are quite similar globally.
Indeed, as we note in Figure iOS users tend to have high levels of services attached.
Even in Emerging Markets, this is ~90%, as well as high levels of income (according to our
survey). They are also as invested in terms of app downloads as shown in Figure . In other
words, the market share volatility shown in Figure is a function of varying replacement
rates, rather than losing users in China to rivals. We believe that the iPhone upgrade rates
could accelerate with the upcoming product cycle, driving unit growth and market share
gains in China.
Figure 11: Apple's EM invested in the ecosystem... Figure 18: ...and download and use more apps
Source: Company data, Credit Suisse estimates Source: Company data, Credit Suisse estimates
Raising price could offset BOM pressure
With the introduction of OLED, wireless charging and an all-glass display, Apple could see
a rise in its BOM. However, we believe that Apple can raise prices to offset some BOM
pressures. We have slightly adjusted our view on pricing and we now assume
US$670/US$770/US$900 for the three devices at launch.
0%
10%
20%
30%
40%
50%
60%
70%
80%
90%
100%
Brazil China India Indonesia Russia South
Africa
Turkey Mexico
iOS Services Attach
0
5
10
15
20
25
30
35
40
45
China India South
Korea
Brazil US Japan UK
Nu
mb
er
of
Ap
ps

23 May 2017
iPhone and its supply chain 17
Figure 19: Highest-end ASP has been rising … Figure 12: … while high-end mix has been solid
Source: Company data, Credit Suisse estimates Source: Company data, Credit Suisse estimates
Successfully increasing price for some time now. Apple has increased prices historically. It
has raised prices on the highest end offerings twice in the past three years, first with the 6
Plus, where the highest offering ASP increased from US$849 to US$949 and then again
with the 7 Plus, which was increased to US$969. We note that despite increasing the price
of its phones (e.g. the 6 Plus was US$100 more than any phone it had ever introduced),
Apple has seen strong demand. In fact, we see that demand for the 7 Plus is significantly
outweighing supply, even with the extra US$20 price tag. As such, we believe that even if
Apple raises the price on its OLED iPhone, it will still continue to see a positive mix shift to
the high end.
Figure 13: Apple has room to raise prices given Samsung Galaxy's pricing points
Source: Company data, Credit Suisse estimates
Samsung's S8 pricing bodes well for an iPhone price increase. Historically, the iPhone has
always commanded higher prices than Samsung's competing models, even when
Samsung's model featured better specs. For example, the basic version of the iPhone 6S
featured 16GB storage with a US$650 price tag, US$50 higher than the competing
$700
$750
$800
$850
$900
$950
$1,000
iPhone 432GB
iPhone 4s64GB
iPhone 564GB
iPhone 5s64GB
iPhone 6Plus 128GB
iPhone 6sPlus 128GB
iPhone 7Plus 128GB
$600
$650$640
$650
$600
$650
$750
$600
$650
$700
$750
$600
$650
$700
$770
$720
$670
$825
$770
$900
$500
$550
$600
$650
$700
$750
$800
$850
$900
Gala
xy
S3
-16
G
iPh
on
e 5
-16
G
Gala
xy
S4
-16
G
iPh
on
e 5
S-1
6G
Gala
xy
S5
-16
G
iPh
on
e 6
-16
G
iPh
on
e 6
Plu
s-1
6G
Gala
xy
S6
-32
G
iPh
on
e 6
S-1
6G
Gala
xy
S6
Ed
ge
-32G
iPh
on
e 6
S P
lus-1
6G
Gala
xy
S7
-32
G
iPh
on
e 7
-32
G
Gala
xy
S7
Ed
ge
-32G
iPh
on
e 7
Plu
s-3
2G
Gala
xy
S8
-64
G
iPh
on
e 8
-3
2G
Gala
xy
S8
Plu
s-6
4G
iPh
on
e 8
Plu
s -
32G
iPh
on
e -
Pro
-6
4G
2012 2013 2014 2015 2016 2017

23 May 2017
iPhone and its supply chain 18
Samsung Galaxy S7 model that had 32Gb storage. In March 2017, Samsung released the
Galaxy S8 at US$720 for the 64GB model and the Galaxy S8 Plus at US$825 for the
64GB model. Given Apple's ability to historically secure at least a 10% premium (which
does not appear to have impacted demand), we believe that our assumption of the starting
prices of the 8/8Plus/8 Pro could prove conservative at US$670/US$770/US$900.
Samsung Galaxy S8 series sales strong despite higher pricing and brand damage. After
Samsung's launch of the Galaxy S8/S8 Plus, sales have been strong, with 5mn reportedly
sold so far, despite higher price tags and some brand damage caused by the Note 7 last
year. We believe this indicates that consumers are ready to pay up for premier tier
smartphones as long as there are sufficient new innovations. This, in turn, bodes well for
the upcoming iPhone 8 Cycle.
What about elasticity? Clearly, in any discussion around price, it is hard to argue against
an impact in terms of elasticity of demand. While this is also the case for the iPhone
business, we believe that the combination of improvements in functionality, a high
retention rate of the eco-system and an affluent user base means that the impact on
demand could actually be negligible.
Income levels of Apple users higher than non-Apple users
We also note that Apple users have higher levels of income, versus non-Apple users,
indicating greater ability on Apple's part to raise prices. We see that iPhone users in the
US and Emerging Markets earn 55%/25% more than non-Apple users. In fact, the average
annual income of iPhone users is higher than the average annual income of Android users
in every country we surveyed earlier this year.
Figure 14: Apple US users earn 55% more … Figure 15: In EM, Apple users earn 25% more …
Source: Company data, Credit Suisse estimates Source: Company data, Credit Suisse estimates
Better mix could have material benefit
An improving mix towards the higher-end offering will also help offset GM pressure from a
potential BOM increase. We note here that with the introduction of an OLED screen,
wireless charging, and an all-glass enclosure, Apple could very likely experience a shift in
its mix towards the highest end phones. Indeed, the initial build data suggest that
somewhere around 50% of the overall volumes could be for the iPhone 8 Pro. We believe
this can have a material impact on the EPS power for several reasons.
ASP accretive, materially GP/Unit accretive. Even allowing for the higher BOM, discussed
before, we note that the OLED version will likely have an ASP that is 26% accretive to the
iPhone business, the GM at 42% about 400bp accretive, and GP per unit that would be
~40% higher. Given this, a mix shift towards such a product line would likely have a
material impact on the outcome to estimates.
$0
$5,000
$10,000
$15,000
$20,000
$25,000
$30,000
China India Indonesia Russia South
Africa
Turkey Mexico
iOS User Android User

23 May 2017
iPhone and its supply chain 19
Figure 16: Pro model is accretive to iPhone (Hardware only) GM
Source: Company data, Credit Suisse estimates
A long-term shift to highest end tier. While Apple already operates in the high end of the
smartphone market, what has been surprising is that there has been a continued shift
towards Apple's highest end tier of the portfolio. Indeed, we see the Plus/Pro range rising
to above 40% of volume recently, as shown in Figure .
Figure 17: Mix has been shifting to higher end models ...
Source: Company data, Credit Suisse estimates
OLED mix shift is important. We assume 45% of the new portfolio mix will be OLED in
2H17. While there are many moving parts to this analysis, the initial build plans for 2H17
for the iPhone 8 are expected to be 100–110 mn units (25–30 mn units in the September
quarter and 75–80 mn units in the December quarter), which is up around 0-10% versus
the iPhone 7 builds of roughly 100 mn units. We would note that given the accretion
discussed before that the model is very sensitive to such an assumption, both GM and
EPS, as we show in Figure .
$452
$659
$752
$871
$135
$219
$297
$364
29.9%33.2%
39.5% 41.7%
Average: $693
Average: $259
Average: 37.5%
Old iPhone 8 Plus Pro Old iPhone 8 iPhone 8
Plus
Pro Old iPhone 8 iPhone 8
Plus
Pro
ASP GP($) per unit GM (%)
0%
10%
20%
30%
40%
50%
60%
70%
80%
90%
100%
CY13 CY14 CY15 CY16 CY17E
Base Plus/Pro

23 May 2017
iPhone and its supply chain 20
Figure 18: iPhone output by form factor
Source: Company data, Credit Suisse estimates—based upon build estimates
ASP rising to US$676/US$704, revenues heading up to US$155 bn/US$176 bn in
CY17/18. As shown, we assume that the ASP for the iPhone business moderately grows
from US$647 in 2016 to US$676/US$704 in CY17/18. This is based on the mix of the
iPhone 8 Pro becoming 40-45% of volume going forward. Combined with our projected
unit growth, we now see iPhone revenues growing to US$155 bn/US$176 bn from
US$139 bn in 2016 or growth of 11%/14%.
Services is GM accretive and an increasing GP mix. We see material growth in Apple's
Services segment, which should help offset the GM impact long term. Management
expects services to double over the next four years, in line with our forecasts in our note
AAPL: Services Update – The Annuity Continues. As such, we see a material potential for
Apple's Services, with growth being driven by the App Store, an inflection in Apple Music
revenues and iCloud. We believe Services can grow from 20% of GP in FY16 to one third
of GP long term, and with Services being ~70% GM business, should help Apple’s GM
long term.
We note that services growth can absorb 250-300bp of iPhone GM pressure, as it
contributes incremental GP to overall corporate.
Figure 27: Apple Services could offset 250-300bp GP pressure from iPhones
(US$ mn, unless otherwise stated)
2016 2017 2018 2019
Services revenue 25,464 31,083 37,652 45,183
Services GP 17,500 21,741 26,394 31,673
Services GM 68.7% 69.9% 70.1% 70.1%
as % of corp. GM 21% 24% 25% 28%
Incremental GP 3,022 4,241 4,653 5,279
Average incremental GP 4,299 4,299 4,299 4,299
iPhone revenues 139,443 154,849 175,928 182,625
Margin pressure offset 308bp 278bp 244bp 235bp
Source: Company data, Credit Suisse estimates
Scenarios analysis—US$14 EPS power in bull case
The issue for Apple investors is that while the feature upgrade is arguably well understood
and therefore the potential impact on units, what is less clear is how consumers will
respond to a price increase and the resulting mix. This can have, per our analysis, a major
impact on the fundamental EPS power that Apple sees as result of the upcoming product
cycle. We believe that the key sensitivity concerns the price of the iPhone 8 Pro, the mix
mn untis, as a % of total CY2014 CY2015 CY2016CY2017
as of 2017/5
4" incl. SE 51.6% 10.5% 18.2% 8.9%4.7"/5.5" old models 0.0% 55.2% 37.8% 44.4% 4.7" 0.0% 69.5% 70.4% 54.9% 5.5" 0.0% 30.5% 29.6% 45.1%4.7"/5.5"/5.8" new models 48.4% 34.3% 44.0% 46.7% 4.7" 72.8% 70.0% 58.0% 26.2% 5.5" 27.2% 30.0% 42.0% 15.7% 5.8" OLED 0.0% 0.0% 0.0% 58.1%Total 100.0% 100.0% 100.0% 100.0% 4" 51.6% 10.5% 18.2% 8.9% 4.7" 35.3% 62.4% 52.1% 36.6% 5.5" 13.2% 27.1% 29.7% 27.4% 5.8" OLED 0.0% 0.0% 0.0% 27.1%

23 May 2017
iPhone and its supply chain 21
and the replacement rate. Below are three scenarios we analyse in Error! Reference
source not found.:
Base case: In our base case, we assume 45%/40%/35% of the Pro mix in
2017/2018/2019 with blended ASPs at US$676/US$704/US$676, which results in EPS of
US$9.50/US$11.95/US$13.16 in 2017/2018/2019.
Bull case: In the bull case, we assume the same mix and ASP, but raise units to
271 mn/293 mn, driven by 29 months of replacement cycle seen in the iPhone 6 Cycle.
This results in EPS of US$9.50/US$12.76/US$14.05 in 2017/2018/2019.
Bear case: In the bear case, we assume a 25% Pro mix over the new phones for future
years and assume that the BOM is US$10-15 higher than the base case for the new
phones, resulting in a lower GM of about 36%. In this case, we see EPS of
US$9.11/US$10.90/US$12.33.
Figure 19: Apple iPhone Scenario analysis—a range of outcomes but EPS power of US$14 in the bull case
Source: Company data, Credit Suisse estimates

23 May 2017
iPhone and its supply chain 22
Display, casing, 3D-sensing: Likely major changes
OLED—the new path for iPhone displays
One major change in the upcoming iPhone 8 release will be the usage of OLED display for
the first time. AAPL has begun using OLED screens on its watches, which is now
spreading to iPhones. We do not rule out OLED display adoption in the iPad in the near
future. Among the three iPhone 8 models, in our base case, we believe only the Pro
version will be launched using flexible OLED displays, which should enable a thinner and
more energy efficient device—the merits for which OLED is known. Adopting flexible
OLED also indicates some intention to bend the display around the edges to enable
design changes. Other two models will continue to use LTPS TFT-LCD displays. The
OLED display size should be 5.8 inches with about 5.15 inches of usable area and with
minimum amount of bezel area should enable a very compact form factor. Current intent is
to remove the physical "Home Button" and replace it with a "Virtual Button" on the OLED
screen. The uncertainty revolves around embedding the Touch ID and ambient light
sensor into the OLED screen. If the technology is not successful given the tight product
launch timeline, the Touch ID could be placed on the back of the device.
Figure 29: Samsung's OLED capacity growth trend into 2020E (mobile only,
based on glass output area)
Source: Company data, Credit Suisse estimates
We also believe that 100% of AAPL's initial OLED requirement in 2017 will be supplied by
Samsung. Samsung remains the most critical component supplier for AAPL that includes
memory semiconductor solutions such as the LP DDR4 DRAM and NAND flash, and now
OLED. Samsung is the only supplier in the world with a proven track record in OLED
display. Also, Samsung's IP related to OLED and extensive control of its supply chain can
guarantee the high volume required by AAPL. We believe that the Samsung A3 6G OLED
fab will be the facility that will manufacture for AAPL. Terms of long-term supply contracts
have already been agreed, with AAPL active in qualifying not only Samsung, but many of
its raw material suppliers.
Sufficient OLED capacity safeguard in place
According to our AAPL analyst, Kulbinder Garcha, AAPL is likely to ship about 41 mn
iPhone 8 Pro devices during 4Q17. An additional 43 mn iPhone 8 Pro units are expected
to be shipped in 2018. If the following version iPhone 9 Series in 2018 all adopt OLED
displays, then AAPL will likely require 128 mn OLED displays in 2018 (iPhone 8 Pro and
0
1,000
2,000
3,000
4,000
5,000
6,000
7,000
8,000
9,000
10,000
2010 2011 2012 2013 2014 2015 2016 2017E 2018E 2019E 2020E
(K m²)
Samsung Display LG Display AUO BOE
GoVisionox EverDisplay JDI
Keon Han Jerry Su

23 May 2017
iPhone and its supply chain 23
all iPhone 9 Series. As Samsung will likely remain the sole supplier, sufficient capacity
must be prepared to ensure a guaranteed supply incorporating potentially low product-
yield scenarios. According to our analysis, more than enough safe guards are in place by
Samsung to ensure ample supply of OLED panels to AAPL, to compensate for low
production yields or better-than-expected iPhone volume sales.
As a base case, if AAPL is scheduled to ship 41 mn OLED iPhones by 4Q17, this implies
Samsung would need ~60 mn OLED panels dedicated to AAPL, with inventory preparation
beginning at least several months ahead. We believe that three 6G OLED lines are
already production-ready in the AAPL-dedicated A3 fab and the capacity will grow to four
lines in 3Q17 and six by 4Q17. The A3 fab is expected to be full, running nine lines by
2Q18. According to our estimates, the capacity ramp-up schedule will enable a total
production of 64 mn 5.8-inch OLED panels in 2017 under a 43% average yield
assumption. By 2018, Samsung will be able to produce over 240 mn OLED panels for
AAPL with a 74% yield assumption under the current capacity expansion plan. This
suggests that even if all of AAPL's 230 mn iPhones were to adopt OLED, Samsung would
have sufficient capacity to cover the entire demand. Therefore, we believe there is
sufficient capacity prepared to hedge against various operating conditions.
Figure 30: Quarterly 5.8-inch OLED panel production for AAPL with yield rates
Source: Company data, Credit Suisse estimates
The only other potential supplier could be LG Display during the early phase. However,
LGD's first 15K of 6G flexible OLED capacity will not be ready until 2H17 and is dedicated to
its automobile and Chinese smartphone makers. Negotiation to supply AAPL is ongoing, so
from a timing perspective, LGD could supply AAPL by 2H18 with additional 15K of 6G
capacity announced. LGD is currently reviewing its 2017/2018 OLED strategy to potentially
increase capacity further provided large customers commit long-term to capacity.
Samsung's OLED sales to AAPL should prove to be lucrative
Attaining AAPL as a new OLED panel customer should prove to be a very lucrative move
for Samsung. First, all OLED panels destined for AAPL are flexible OLED which
commands a substantial price premium over Rigid OLED. For example, the 5.8-inch OLED
display module to AAPL should average about US$80 per device compared to about a
US$25 ASP for the current Rigid (glass-based) OLED. Currently, Samsung produces
flexible OLED primarily for its own use in its flagship smartphone devices. All incremental
panel volume ordered from AAPL will be higher priced flexible OLED that will improve the
overall mix and increase the blended ASP. Even with a lower yield rate assumption and
0%
10%
20%
30%
40%
50%
60%
70%
80%
0
10
20
30
40
50
60
70
1Q17 2Q17E 3Q17E 4Q17E 1Q18E 2Q18E 3Q18E 4Q18E 1Q19E 2Q19E 3Q19E 4Q19E
Panel outputs(5.8",mn) Yield rates (RHS)
mn units

23 May 2017
iPhone and its supply chain 24
rising fixed cost associated with start-up of a new fab, the ASP is high enough not to dilute
Samsung's current profit margin structure of around ~20% OPM.
Second, capacity roll-out, ASP and volume agreements were likely set at low-yield rates of
~50%. The normalised yield rate at the current flexible OLED line is substantially higher at
75%. As a more mature technology, rigid OLED yields are higher at 80%. We surmise that
since additional lines in the A3 fab set up for AAPL are essentially the same line Samsung
is currently using on its own products, little risk exists on the production side, except for
some change in OLED materials used at the request of AAPL. Therefore, higher yields
can provide substantial upside to OPM assumptions on higher productivity in addition to
freeing up capacity to supply other external customers, where supply remains in shortage.
According to our analysis Samsung should be able to more than double its OLED revenue
from W15.4 tn in 2016 to W34.9 tn in 2018, mostly driven by the new, incremental OLED
business from AAPL. We expect that by 2018, the OLED revenue contribution derived
from AAPL will surpass Samsung’s own internal OLED sales to its smartphone division,
given the richer mix and higher ASP. Maintaining a stable OPM rate assumption of ~20%,
we calculate the OP contribution from AAPL business to be W1.1 tn in 2017 and could
potentially rise to about W3.5 tn in 2018. This would account for 25% of Samsung's OLED
OP in 2017, rising to 56% by 2018.
Figure 201: Total square metre OLED capacity consumed by AAPL (glass input
based)
Source: Company data, Credit Suisse estimates
0%
10%
20%
30%
40%
50%
60%
0
200
400
600
800
1,000
1,200
1,400
1,600
1,800
1Q16 2Q16 3Q16 4Q16 1Q17 2Q17E 3Q17E 4Q17E 1Q18E 2Q18E 3Q18E 4Q18E
AAPL Samsung/Others % of AAPL to total Samsung OLED capacity (RHS)
'000 m2

23 May 2017
iPhone and its supply chain 25
Figure 32: AAPL’s annualised OLED profit to Samsung
Source: Company data, Credit Suisse estimates
Possible negative impact on backlight and traditional TFT supply chain
The adoption of OLED panels for iPhone display will negatively impact the backlight
supply chain. Radiant currently is the main backlight supplier for the 5.5-inch iPhone with
~60% allocation. iPhone accounted for ~20% of its 2016 revenue and we believe this will
decline to ~9% by 2018 and could eventually drop to a minimum when all new iPhones
adopt OLED display.
Chipbond could also see negative impact in 2017 as it is the sole backend supplier for the
driver IC used on TFT iPhone (~12% of sales in 2016). Nevertheless, we think the iPhone
shifting to OLED could hurt its 2017 sales by 6%, but it should be offset by the TDDI ramp
and more RF bumping revenue. We think that Chipbond will be able to regain some share
in 2H18, after JDI, LGD, or Sharp start to supply OLED panels for iPhone.
Casing/ cover glass: A major change in all iPhone 8s
We expect the casing design for all three models will be changed from current aluminium
full unibody case, to "glass cover + metal frame" design. We expect the OLED model will
use stainless steel, to provide a thinner and stronger frame, while the LTPS models will
use an aluminium alloy frame. We believe that the casing design change is not only to
provide a fresh look for the iPhone, but also to facilitate the adoption of wireless charging.
We believe the stainless steel frame will be ASP comparable to the aluminium full unibody
casing, but the aluminium frame will be ASP dilutive (by 20%). We also believe the design
change (by combining the cover glass to metal frame) will require sub-assembly work to
be done by the metal casing makers, i.e. Catcher and Hon Hai.
1. Total # of 5.8" OLED panels (mn units) 2016 2017E 2018E 2019E 2020E
Panel inputs (5.8", mn) 41 133 347 367 367
Yield rates (annual avg) 0% 43% 74% 75% 75%
Utilization rates (% , annual avg) 0% 83% 95% 95% 95%
Market shares (%) 100% 100% 100% 100% 100%
Panel outputs(5.8",mn) 0 64 243 261 261
ASP(US$, avg) $0 $79 $69 $59 $50
ASP YoY (%) n/a n/a -12% -15% -15%
USD/KRW 1150 1150 1150 1150 1150
Revenue (Wbn) 0 5,755 19,346 17,728 15,057
OPM(%) 18% 20% 18% 18% 17%
OP(Wbn) 0 1,165 3,531 3,102 2,560
2. Earnings impact to Samsung
% of sales impact on the division/total (Wbn) 2016 2017E 2018E 2019E 2020E
SEC's OLED sales(Wbn) 15,360 23,246 34,902 42,927 49,016
SEC's total sales(Wbn) 201,867 238,508 272,705 289,887 303,801
Sales from OLED supply to AAPL(Wbn) 0 5,755 19,346 17,728 15,057
% to SEC's OLED sales 0% 25% 55% 41% 31%
% to SEC's total sales 0% 2% 7% 6% 5%
% of sales impact on the division/total (Wbn) 2016 2017E 2018E 2019E 2020E
SEC's OLED OP(Wbn) 2,784 4,721 6,333 7,493 8,333
SEC's total OP(Wbn) 29,241 50,653 57,046 60,921 61,792
OP from OLED supply to AAPL(Wbn) 0 1,165 3,531 3,102 2,560
% to SEC's OLED OP 0% 25% 56% 41% 31%
% to SEC's total OP 0% 2% 6% 5% 4%
Pauline Chen Sam Li

23 May 2017
iPhone and its supply chain 26
Figure 33: New iPhone casing spec expectations
4.7" iPhone 5.5" iPhone OLED iPhone
Back cover 2.5D glass 2.5D glass 2.5D glass
Metal frame Al alloy Al alloy Stainless steel
Source: Company data, Credit Suisse estimates
Rather than a one-time upgrade to two-side glass (both 2.5D) at Apple for cosmetic and
wireless charging considerations, we see more reasons for a sustainable cycle for the
industry, such as more adoption of wireless charging in mid-term and 5G in the long run
(for back casing), or to cover curved AMOLED screens (for cover lens). In addition to
simple volume growth, we also see a clear ASP improvement path for glass ASPs. From
2D, to 2.5D cover, to 2.5D back, to 3D, the ASP could rise from US$3 to US$10-15. Lens
Tech by now is settled on capacity expansion to double 2.5D capacity and a 40mn annual
capacity for 3D.
Stock implications
We believe that the design change will lead to a strong product cycle for glass cover
makers, including Lens Tech, Biel Crystal and Hon Hai (new supplier). We believe
stainless steel frame could offer higher profit dollar content per device, which should
favour the Foxconn group. However, given the business model change, we believe most
of the casing value might be captured under the parent company, instead of Foxconn
Tech. On the other hand, we believe Catcher's unit market share gains in LTPS iPhones
and the addition of sub-assembly business should be sufficient to cover the ASP-dilution
of metal casing design change.
Camera upgrade and 3D sensing
We expect a major upgrade in camera design for new iPhones, including: (1) higher dual
camera adoption rates (from one model in 2016 to two models in 2017); (2) higher OIS
adoption rates; and (3) adding 3D sensing on top of the front camera.
Figure 34: New iPhone camera spec expectations
4.7" iPhone 5.5" iPhone OLED iPhone
Main camera Single camera (12MP) Dual camera (12+12) Dual camera (12+12)
3D sensing N N Y
Source: Company data, Credit Suisse estimates
We expect the main camera (rear camera) for both the OLED model and the 5.5-inch
model to be upgraded to dual camera and dual OIS. This should push dual camera
adoption rate in iPhone up from 10-15% in 2016 to 35-40% in 2017E, and the OIS
adoption rate in iPhone from 45% in 2016 to 75% in 2017E.
Pauline Chen Jerry Su
Sanguk Kim Kyna Wong
Mika Nishimura

23 May 2017
iPhone and its supply chain 27
Figure 35: iPhones with dual-cam shipment outlook Figure 36: iPhones with 3D sensing shipment outlook
Note: We include iPhone 7 Plus, 8 Plus, 8 Pro, iPhone 9, iPhone 9 Plus and iPhone Pro. Source: Company data, Credit Suisse estimates
Note: We include 8 Pro, iPhone 9 Plus and iPhone Pro Source: Company data, Credit Suisse estimates
We believe that only the OLED model will have 3D sensing on the front (likely for facial
recognition and gesture control) and the 3D imaging feature for the back camera will be
included in the 2H18 flagship iPhone. We believe the 3D sensing components could see
much higher volume shipments in 2H17, given longer lead time and potential lower yield
initially.
Figure 37: Key component suppliers for iPhone 3D sensing Key components Suppliers
Laser diode II-VI, Lumentum (Win Semi foundry), Finisar
DOE TSMC+Xintec, Himax
WLO AMS/Hepatagon
Filter Viavi
CIS Sony/STM, Tong Hsing providing wafer reconstruction
Module/packaging LG Innotek, Sharp
Equipment Chroma (VCSEL testing), ASMP (active alignment)
Source: Company data, Credit Suisse estimates
Stock implications
We believe that the rising adoption rate of dual camera and OIS should benefit industry
leaders, including Sony (the key CIS supplier), Largan (the key lens supplier for 6p dual
camera), LGI (the key module supplier), and Alps (the key OIS supplier). We estimate the
dollar content for dual camera will at least remain flat YoY in 2017E from US$30 in 2016
with a moderate spec upgrade (additional OIS) and ASP pressure from increased
competition from Sharp taken into consideration. For 3D sensing, the dollar content is
likely to be US$10-15 based on our latest channel check.
We believe that LG Innotek should remain as the major dual-camera/3D sensing module
supplier to upcoming new iPhones. Against this backdrop of the dual cameral and 3D
sensing adoption rate mentioned above, we forecast dual-cam sales to iPhones would
contribute 21%/51% of total sales/OP in 2017 while 3D sensing would generate 5%/8%
total sales/OP in 2017 at LG Innotek.
0%
10%
20%
30%
40%
50%
60%
70%
80%
90%
0.0
10.0
20.0
30.0
40.0
50.0
60.0
70.0
80.0
3Q16 4Q16 1Q17 2Q17E 3Q17E 4Q17E 1Q18E 2Q18E 3Q18E 4Q18E
iPhones with Dual-Cam % of dual-cam at iPhones(RHS)
mn units
0%
10%
20%
30%
40%
50%
60%
0.0
5.0
10.0
15.0
20.0
25.0
30.0
35.0
40.0
45.0
4Q17E 1Q18E 2Q18E 3Q18E 4Q18E
iPhones with 3D sensing % of 3D sensing at iPhones(RHS)
mn units

23 May 2017
iPhone and its supply chain 28
Figure 38: LGI—exposures to iPhone dual-cams Figure 39: LGI—exposures to iPhone 3D sensing
Source: Company data, Credit Suisse estimates Source: Company data, Credit Suisse estimates
On the lens side, we expect Largan to maintain its dominant position in the dual camera
model, but share the LTPS models and front camera orders with Kantatsu and Genius. We
believe the continued lens spec upgrade should lead to higher ASP and decent margins.
We expect the main camera (rear camera) for both OLED iPhone and 5.5" iPhone 8 will be
upgraded to dual camera and dual OIS. This should push dual camera adoption rate in
iPhone up from 10-15% in 2016 to 35-40% in 2017E. We estimate Largan to have ~90%
market share in dual camera lens, 60% in single camera lens and 50% in front camera
lens. Based on CS updated iPhone estimates, the total iPhone 8 revenue contribution is
estimated at ~20% for Largan in 2017E. Our EPS sensitivity analysis suggests that every
5 mn unit change in iPhone 8 volume will lead to a 0.3% change in 2017 EPS, and every
5% market share loss (in main camera) will lead to 0.7% change in 2017 EPS.
We remain positive on the lens upcycle, driven by the ongoing spec upgrade, including 7p
lens, 3D sensing and dual camera, which should further increase the entry barrier. We
believe the near-term softness due to smartphone inventory adjustments and OLED
iPhone pushout should provide a good entry point on the stock.
Figure 40: Largan 2017 EPS sensitivity
Source: Company data, Credit Suisse estimates
For the 3D sensing supply chain, in addition to LG Innotek, we expect Chroma and ASM
Pacific to benefit the most given their dominant position in the supply chain. We estimate
~15% of Chroma’s parent-sales is related to VCSEL testing equipment, and 7-10% for
ASMP on active alignment tools. We expect the revenue contribution for Win Semi
(VCSEL foundry), Himax (DOE), ChipMOS (DOE backend) and Tong Hsing (IR CIS wafer
reconstruction) to be less than 5% in 2017.
Acoustic
We expect 2017 to be another meaningful upgrade year (after 2016) for acoustic, which
would benefit supplier names like AAC, GoerTek and Luxshare (and Merry). We now
estimate ASPs of the dynamic components (speaker + receiver) in the OLED model to
roughly double vs iPhone7, driven by better dual-speaker performance, better waterproof
Mn units 2016 2017E
iPhone shipments (w/ Dual-cam) 28.3 86.5
Dual camera ASP (US$) $30 $29
FX assumption (USD/KRW) 1150 1150
Market shares (% ) 100% 90%
Sales generation from iPhones dual-cam(Wbn) 975 2,292
Total Sales (Wbn) 3,439 10,705
iPhone dual-cam sales to Total(%) 28% 21%
OPM(% ) assumption 10% 8%
OP generation from iPhones dual-cam (Wbn) 97 183
Total OP (Wbn) 105 360
iPhone dual-cam OP to Total 93% 51%
Mn units 2016 2017E
iPhone shipments (w/ 3D sensing) 40.9
3D sensing ASP (US$) $15
FX assumption (USD/KRW) 1150
Market shares (% ) 70%
Sales generation from iPhones 3D sensing(Wbn) 494
Total Sales (Wbn) 10,705
iPhone 3D sensing sales to Total(%) 5%
OPM(% ) assumption 4%
OP generation from iPhones 3D sensing (Wbn) 20
Total OP (Wbn) 241
iPhone 3D sensing OP to Total 8%
iPhone 8 volume change vs. base case (mn)
-5 -1 0 1 5
5% 0.4% 0.7% 0.7% 0.8% 1.0%
10% -0.3% -0.1% 0.0% 0.1% 0.3%
15% -0.9% -0.8% -0.7% -0.7% -0.5%
20% -1.6% -1.5% -1.4% -1.4% -1.2%
25% -2.3% -2.2% -2.1% -2.1% -2.0%Com
petito
r
back
cam
era
mkt
share
Sam Li Akinori Kanemoto

23 May 2017
iPhone and its supply chain 29
and new sound quality loop control design. For LCD models, we only expect flat ASPs with
slight acoustic performance improvements.
Among Japanese companies, we believe that TDK started supplying MEMS microphones
for earbuds used with the iPhone 7, but its MEMS microphones could also be used in the
handset itself from the iPhone 8.
Stock implications
We expect Merry to increase its acoustic market share in iPhone from 5% in 2016 to high-
single digit in 2017E, by adding the upgraded receiver project to OLED iPhone. We note
our estimates are slightly below consensus, as we believe the integration with Luxshare
will take time to see the benefits.
Therefore, we expect the share rebalance progress in iPhone to be slow, and do not see
any losers in the mid-term. We believe that AAC, GoerTek and Luxshare could all benefit
from the acoustic upgrades. For AAC, we now expect iPhone8 OLED model dynamic
components ASP to double vs iPhone7. However, these positives are mostly offset by
potential OLED model shipment delays, and therefore we see limited upside for our 2H17
revenue estimates. Therefore, we recently downgraded the stock for full valuations (see
our note here).
Haptics
With the high ASP base in iPhone7 (US$9.5-10 vs. US$7.5 in iPhone6s), we now estimate
only flat ASPs YoY for haptics in iPhone8 (all three models), with limited feature upgrades.
For haptic for the OLED model, we estimate haptic may adopt different material and
structures from 4.7” and 5.5” model. Suppliers will still be AAC, Alps and Nidec.
Stock implications
Among Japanese companies, we estimate Nidec will secure a major share of supplies
for OLED models, in addition to supplying 4.7-inch LCD models. We forecast Alps
Electric will capture a share of around 20% for OLED models after entering the market
with the iPhone 8.
For AAC, we still expect AAC to hold its leading share allocation in haptics, but we do not
expect any further ASP rise from the high 2H16 base (but iPhone unit growth could
support the segment's performance). On a competitive landscape basis, we see the
dynamic slightly moves in favour of AAC, as Alps intends to run the business with an eye
on margins in FY3/18 and then look at further expansion next year if things go smoothly.
PCB
We expect new iPhone to use substrate-like PCB (SLP) to reduce the area size of the
mainboard but still offer a complicated circuit design. We believe the OLED iPhone will be
using two small SLP, vs one SLP for LTPS models. We believe there will potentially be
seven suppliers, including AT&S, TTM, Kinsus, Unimicron, Compeq, ZDT and Ibiden. We
believe that suppliers are asking for higher ASPs to compensate for the initially lower yield
rates. Comments from the supply chain seem to suggest volume production may start
from June or July.
Stock implications
We estimate SLP to account for 10% of Kinsus' revenue in 2017, assuming 15% market
share off 90.4 mn units vs previously 12.4% market share off 110 mn units. Our sensitivity
analysis suggests that every 1% market share increase will lead to 2% increase on EPS,
and every 1 mn units gains in new iPhones will lead to 3% increase on EPS. For
Unimicron, we believe SLP is a profitable business, but it might be difficult to offset the
losses from Intel substrates business.
Sam Li Akinori Kanemoto
Pauline Chen

23 May 2017
iPhone and its supply chain 30
Passive Components
We anticipate a major upgrade for MLCCs—the first since 2013 models. More MLCCs will be
needed due to the shift to 10nm application processors, and the adoption of next-generation
MLCC models should also lift the average unit price. We estimate the number of MLCCs per
device will increase from around 800 in the iPhone 7 to over 1,000 in the iPhone 8. There is
also likely to be a shift to more compact large-capacity devices, with 10μF MLCC dropping
from size 1005 to size 0603, and 47μF declining from size 1608 to size 1005. In the iPhone 7,
Apple switched from single core to dual core architecture, spurring a large increase in the
number of power inductors per device. However, there is unlikely to be similar growth with the
iPhone 8, as it will also use a dual core application processor.
RF Front End/Wifi Module
The iPhone 7 incorporated a major change in RF front-end design, so we think the iPhone
8 will see only minor changes. US companies (Broadcom, Skyworks Solutions, Qorvo and
Qualcomm) will probably dominate supplies of PAMiD and diversity modules. With the
iPhone 7, Murata Mfg. saw a sharp drop in its share of diversity module supplies, and we
expect the company to only win business for diplexers in RF front-end devices this year.
The iPhone 8 is unlikely to support LTE-U / unlicensed LTE and band 42 spectrum. The
next major change in RF front-end design will probably depend on the timing of support for
carrier aggregation in transmission mode.
In Wifi modules, average value per device may appear to rise from US$4 to around US$6
due to higher prices for Wifi chips. We expect Murata Mfg. to secure a share of around
60% in Wifi modules.
Akinori Kanemoto
Akinori Kanemoto

23 May 2017
iPhone and its supply chain 31
Asian semis: The Big 2 to make more money
Foundry and backend
iPhone foundry opportunity still led by TSMC
The logic silicon in the iPhone is primarily from global chipset companies, with minimal
Taiwan and China fabless suppliers designed into the iPhone. The bulk of the silicon is
manufactured by Asian foundries, with TSMC being the leader for wafer fab production of
the chips, and Amkor and ASE as main suppliers of packaging and testing. For the system
in package (SiP) modules, ASE and JCET/Stats are the largest suppliers of board-level
SiP modules, while Amkor does some package RF and modem communication modules.
TSMC is leading the foundry production with a 100% share of the main processor and high
content in a number of other logic chips within the iPhone. We expect TSMC to have
100% allocation of Apple’s a11 chipset using its 10nm fab process for the wafer and
integrating the logic chip and mobile DRAM on its InFO package similar to the a10 design
in 2016. Key change is the company will transition from the now more mature 16nm node
with a10 to the most advanced a11 node, implying ~10% higher wafer ASP of US$8,500-
$9,000 at the start but 200-300 bp headwind on GM ramping in the early stage of the node.
The processor design has not always been at TSMC, flipping back and forth through the
years. The initial Apple processors were at PortalPlayer for the iPod but shifted with the
iPod Nano in a bundle deal with NAND flash and stayed at Samsung through the APL
series in the initial iPhones and the A4-A8 for iPhone 4 through iPhone 5S and early iPad
generations. The processor finally moved to TSMC’s 20nm with the A8 chipset for iPhone
6, dual sourced between TSMC and Samsung for iPhone 6S on 16/14nm and now back at
TSMC for the 16nm iPhone 7 and 10nm iPhone 8. With TSMC gaining that share back, its
revenue directly from this processor plus now Apple’s fingerprint IC and NAND controller
has lifted direct sales to Apple from 0% in 2013 to 17% in 2016, and we estimate will reach
22% in 2017 and 24% in 2018.
Figure 41: Apple has been shifting toward TSMC Figure 42: Apple may be 20-25% of TSMC sales in 2018
Source: Company data, Credit Suisse estimates Source: Company data, Credit Suisse estimates
TSMC also leads in other primary silicon in the iPhone
In addition to TSMC’s manufacturing of the processor, fingerprint sensor and NAND controller
directly to Apple, we believe it retains a high share of other components, though with a slight
slippage in the iPhone 8. We believe that the company retains a share of co-processor analog
(Dialog, Qualcomm, Intersil), Wifi (Broadcom), CMOS sensor logic interface (Sony), Audio
Codec (Cirrus Logic), force touch sensor, wireless charging chip (Broadcom), and sensors
(Bosch, STM, AKM, Invensense, Alps).
The main slippage will be the modem chipset, which is split between an Intel chip still
designed on TSMC 28nm for iPhone 8, but moving to internal Intel 14nm for iPhone 9 and
0%
5%
10%
15%
20%
25%
30%
35%
$0
$500
$1,000
$1,500
$2,000
$2,500
$3,000
1Q
14
2Q
14
3Q
14
4Q
14
1Q
15
2Q
15
3Q
15
4Q
15
1Q
16
2Q
16
3Q
16
4Q
16
1Q
17
2Q
17
3Q
17
4Q
17
1Q
18
2Q
18
3Q
18
4Q
18
US$mn
Samsung Apple share TSMC Apple share
Apple Processor % of TSMC
Apple % of TSMC
0%
5%
10%
15%
20%
25%
30%
$0
$1,000
$2,000
$3,000
$4,000
$5,000
$6,000
$7,000
$8,000
$9,000
20
14
20
15
20
16
20
17
20
18
US$mn
Samsung Apple share TSMC Apple share
Apple direct sales % of TSMC
Apple % of TSMC
Randy Abrams

23 May 2017
iPhone and its supply chain 32
a Qualcomm chipset that is shifting from TSMC 20nm in iPhone 7 to Samsung 14nm in
iPhone 8. The loss of modem over two cycles would be a US$1-$1.2 bn headwind for
TSMC (250 mn units x $4-5 manufacturing content), though we expect TSMC to recover
share at Qualcomm either in 2H18 or 2019 when the modem migrates to 7nm.
Factoring in the high content but 50% modem share loss, TSM would still have ~70% of
the logic silicon manufacturing in iPhone or US$32 per iPhone 8, amounting to US$8 bn
sales or 26% of its sales on 250 mn annual iPhone shipments. We compare to China
smartphones where TSMC has about US$6 manufacturing (50% of silicon) on 900 mn
units or about US$5.4 bn sales.
Figure 43: TSMC has ~US$8 bn manufacturing from iPhone 8 (26% of sales) vs US$5.4 bn in China smartphones
Source: Company data, Credit Suisse estimates
Back-end packaging led by Taiwan OSAT ,Amkor and Stats
The back-end packaging and test companies still have high exposure to the iPhone even with
the high profile main a11 processor being packaged by TSMC’s InFO process. The shift of
that business to TSMC was less of an impact that most investors perception as the business
was split among three back-end suppliers (a Taiwan OSAT, Stats and Amkor), TSMC already
performed the bumping and Apple consigned its own substrate so the flip chip assembly and
test was only 2% of ASE and 3-4% of Stats and Amkor sales at the peak.
The main opportunity now is in packaging and the testing of other peripheral chips, which
is largely split between these three suppliers, the test of NAND flash by Powertech and
SiP modules split by a Taiwan OSAT, JCET/Stats and Murata. The contribution for the
Taiwan OSAT and Amkor is close to 20% of sales in 2017.
Stock implication
We recently downgraded TSMC from Outperform to a NEUTRAL with target price of
NT$202, down from our previous NT$206 target price due to the risk to 2H17 sales and
margins, owing to very high fabless inventory, slower China smartphones and some
headwinds to margins ramping up 10nm and from a stronger TWD and valuations at the
top end of its post crisis range. Key points, to our view:
High exposure to Apple but factored in. We expect TSMC to retain a 100% share of
Apple’s main processor through 2017-18 and 70% overall logic content, giving it a 25-30%
exposure to iPhone. Content is staying high, though it will have a 3-4% offsetting
headwind as Qualcomm shifts the modem to Samsung this year and Intel shifts the

23 May 2017
iPhone and its supply chain 33
modem to its own fab next year. We are positive on TSMC’s leverage to iPhone but
believe high 2H17 expectations factor in this ramp.
2H rebound expectations look high. We see risk to the magnitude of 2H recovery and
trim 3Q17 from +20% to +17% QoQ, below street +22% QoQ and also lower our GMs
from a 52% peak in 1Q17 to 49% by 4Q17. In our separate report, we flag fabless
inventory at 16-year highs at 92 days, which could drag on non-Apple momentum in 3Q17,
particularly as China smartphone rebuilds may be short-lived approaching the iPhone 8
launch. TSMC’s share is still coming down at #2 customer QCOM as it shifts S600/modem
to Samsung and may drop slightly in 2018 with limited 7nm.
Margins also have some headwinds. GMs likely saw a peak in 1H17 at 51-52% and should
come down to 49-50% in 2H17. The company acknowledged 200-300bp from 10nm ramp
and also faces the reversal of WIP inventory build in 1H17 of high-priced early 10nm wafers
hitting the P&L in 2H17. The rising TWD also continues to pressure Taiwan suppliers, with
TSMC seeing a 6% sales impact to pricing wafers in USD and 24 bp GM impact YTD.
Estimates recently lowered, some downside protection. We recently reduced 2017/18
from NT$13.40/NT$14.70 to NT$12.90/NT$14.00, below street of NT$13.58/NT$14.95
(near zero earnings growth in 2017). Our target is NT$202, based on 15x average 2017/18
EPS, top end of its post crisis range of 11-15x. Upside risk would be further re-rating with
global semis, a strong iPhone refresh or optimism on LT drivers (HPC, Auto, IoT), though
we believe the stock and estimates already reflect high iPhone expectations and new
areas may only offset maturing smartphones to sustain but not lift multiples further.
Memory: Largely an ASP-led dollar content gain
iPhone DRAM density is rising driven by both volume and mix
The launching of iPhone 8 Series products by 4Q17 will likely further pressure already-
tight DRAM industry supply conditions. AAPL will likely drive DRAM demand from two
fronts. First, iPhone unit shipments in 2017 are expected to rise 6.3% YoY to 229 mn total
units from 215 mn in 2016. Second, the higher mix toward 3GB devices should be notable
with the launch with iPhone 8 Pro, with estimated shipments of 41 mn units in 4Q17. While
we maintain the base case that iPhone 8 will have a 2GB DRAM load and the iPhone 8
Plus and Pro will be configured with 3GB of DRAM, the large pick-up in iPhone 8 Pro
should drive up the richer mix of higher density DRAM products.
We note that in 2016, iPhones containing 1 GB and 2 GB DRAM were the main models at
59% and 28% of total iPhone volumes. iPhones containing 3 GB only accounted for 13%
of total iPhone shipment volume in 2016. This mix should change significantly in 2017 as
iPhone 6S volume, which contains 1 GB of DRAM, continues to diminish along with a
decline in volume for iPhone 7 Series products. Supported by the large volume of both
iPhone 8 Plus and the iPhone Pro (3 GB of DRAM load), we estimate over 92% of all
iPhone volume will have 2 GB or higher DRAM load and 38% will have 3 GB in 2017. This
mix change effectively takes up the average of 1.5 GB of DRAM content per iPhone in
2016 to an average of 2.3 GB in 2017, or 54% YoY density increase. This rate of density
expansion is substantially higher than the overall smartphone industry's density growth of
32% YoY. However, we do anticipate the density growth to slow to the sub-20% YoY level
in both 2018 (+19.8% YoY) and 2019 (+16.9% YoY), mainly from a high base effect.
Still, with the change in mix, AAPL's proportion of total global DRAM demand is rising from
4% in 2016 to about 5% in 2017. Within the mobile DRAM sub-segment, AAPL's total
demand will likely increase from 8% in 2016 to 10% in 2017. AAPL alone could cause
further DRAM shortage by 4Q17, as its total DRAM requirement rises from average
quarterly take up of 8% global mobile DRAM production to 16% of all mobile DRAM
products in order to accommodate 85 mn iPhone devices by 4Q17.
Keon Han Hideyuki Maekawa

23 May 2017
iPhone and its supply chain 34
Figure 44: iPhone mix by DRAM Density
Source: Company Data, Credit Suisse estimates
Figure 45: iPhone seasonality for DRAM
Source: Company data, DRAMeXchange, Credit Suisse estimates
How AAPL's DRAM demand impacts Samsung
With an already limited number of DRAM suppliers globally, Samsung has been
dominating the supply of Mobile DRAM with a 61% market share globally in 2016 and
1Q17. We base our forecast of AAPL's DRAM demand impact to Samsung based on a
60% market share (M/S) assumption, although the M/S should be higher since Samsung
is the only reliable supplier of Mobile DRAM on the 18 nm node and Samsung likely has
more M/S for higher density 3GB DRAM products. Based on the latest LPDDR4 contract
pricing, we estimate that Samsung charges AAPL about US$6.3 per every 1GB of Mobile
DRAM. On an annualised basis (2017E), we believe that AAPL accounts for about 7% of
Samsung's total DRAM bits shipped (all iPhones, but excluding iPads and PCs) and
represents about 8% of Samsung's total DRAM operating profits and 3% of total company
OP. Therefore, despite improvement in mix, we only see a marginal improvement in
Samsung's DRAM earnings purely based on iPhone 8 Series launch. We believe the more
positive and leveraged impact would derive from the rising overall industry DRAM ASP,
59%
8%2% 2%
28%
55%
34%
16%
13%
38%
45%
44%
19%
37%
0%
10%
20%
30%
40%
50%
60%
70%
80%
90%
100%
2016 2017E 2018E 2019E
iPhones (1GB) iPhones (2GB) iPhones (3GB) iPhones (4GB)
0%
1%
2%
3%
4%
5%
6%
7%
8%
9%
0
50
100
150
200
250
300
350
1Q16 2Q16 3Q16 4Q16 1Q17 2Q17E 3Q17E 4Q17E 1Q18E 2Q18E 3Q18E 4Q18E 1Q19E 2Q19E 3Q19E 4Q19E
iPhone mobile DRAM bit demand % of total DRAM demand(RHS)
GBmn

23 May 2017
iPhone and its supply chain 35
should the lumpy 4Q17 DRAM demand leads to further DRAM price hike in an industry
that is already experiencing supply shortage.
Figure 46: iPhone 8 series (only) impact to DRAM industry/Samsung
Source: Company data, DRAMeXchange, Credit Suisse estimates
Assumption (iPhone 8 series only) 4Q17E 2017E 2018E
Total iPhone 8 series production (iPhone 8/8 Plus/8 Pro) 71mn 90mn 114mn
Expected of mobile DRAM density breakdown among iPhones 8 series
Low(2GB) 33% 39% 41%
High(3GB) 67% 61% 59%
Expected iPhone 8 series unit breakdown by DRAM density
Low(2GB) 23mn 35mn 47mn
High(3GB) 47mn 55mn 67mn
Total mobile DRAM requirement on iPhone 8 series 188mn GB 236mn GB 295mn GB
Estimated iPhone 8 series DRAM demand (%) to total DRAM demand 6% 2% 2%
Samsung's mobile DRAM m/s at iPhones 60% 60% 60%
Samsung's mobile DRAM bit demand from iPhone 8 series 113mn GB 141mn GB 177mn GB
Samsung's' estimated total DRAM production 1,325mn GB 5,156mn GB 6,291mn GB
Estimated iPhone 8 series DRAM demand (%) to total Samsung DRAM 9% 3% 3%
Earnings impact from iPhone 8 series only to Samsung 4Q17E 2017E 2018E
Volume
Samsung's mobile DRAM bit demand from iPhone 8 series 113mn GB 141mn GB 177mn GB
Price
ASP (1GB equiv.; US$) calculated from LPDDR4x 24Gb $6.3 $6.3 $6.3
Total incremental sales creation from iPhone 8 series $712mn $891mn $1,117mn
OPM(% ) assumption 60% 59% 60%
Total incremental OP creation from Apple $430mn $524mn $676mn
USD/KRW assumption 1,150 1,150 1,150
Total DRAM OP estimates at Samsung (KRW bn) 5,304 18,920 21,094
Total OP estimates at Samsung (KRW bn) 14,175 50,653 57,046
% to Total DRAM OP at Samsung 9% 3% 4%
% to Total OP at Samsung 3% 1% 1%

23 May 2017
iPhone and its supply chain 36
Figure 217: iPhones impact to DRAM industry/Samsung
Source: Company data, DRAMeXchange, Credit Suisse estimates
AAPL's NAND storage configuration scenario analysis
As the iPhone 8 series NAND storage configuration offerings have yet to be released, the
direct impact to the NAND industry is less certain as a result. iPhone 7 Series offered
three different NAND storage configurations: 32GB, 128GB and 256GB. If the iPhone 8's
NAND storage offerings are similar to previous offerings, this would imply only a marginal
increase in total NAND demand despite a new iPhone cycle. For 2016, we calculate AAPL
consumed about 14 bn GB of total NAND based on the shipments of various iPhones,
including the iPhone 7 Series and older models. This translated to about 11% of total
global NAND bit demand and equated to about 61GB of average storage per device.
Despite the 256GB devices being offered for the first time it was only offered through
iPhone 7 devices, which was launched late in the year. Therefore, 256GB devices only
accounted for 5% of total unit sales, having little impact to the total year NAND
consumption in 2016. If the iPhone 8 NAND storage remains the same at
32GB/128GB/256GB offerings, then we only see a marginal YoY increase of 28% NAND
consumption by AAPL. Mainly, 16GB products would continue to diminish, likely replaced
by 32GB products. 64GB products also decline, some being substituted by 32GB while
others would move toward 128GB. Although 256GB iPhones could double to 9% of total
units, aggregate demand increase would not be too strong, in our view.
The scenario for two configurations of 64GB and 256GB NAND storage offerings is also
plausible. First, TLC 3D NAND is broadly available from other NAND suppliers compared
to near exclusive supply of 3D NAND by Samsung for iPhone 7. Second, most NAND
suppliers believe these two configurations are the most likely.
Assumption (total iPhones) 4Q17E 2017E 2018E
Total iPhones production 85mn 229mn 250mn
Expected of mobile DRAM density breakdown among iPhones
Low(2GB) 40% 30% 25%
High(3GB) 60% 70% 75%
Expected iPhones unit breakdown by DRAM density
Low(2GB) 34mn 69mn 62mn
High(3GB) 51mn 160mn 187mn
Total mobile DRAM requirement by all iPhones 222mn GB 618mn GB 687mn GB
Estimated iPhones DRAM demand (%) to total DRAM demand 7% 5% 5%
Samsung's mobile DRAM m/s in iPhones 60% 60% 60%
Samsung's mobile DRAM bit demand from iPhones 133mn GB 371mn GB 412mn GB
Samsungs' estimated total DRAM production 1,325mn GB 5,156mn GB 6,291mn GB
Estimated iPhones DRAM demand (%) to total Samsung DRAM 10% 7% 7%
Earnings impact from all iPhones to Samsung 4Q17E 2017E 2018E
Volume
Samsung's mobile DRAM bit demand from iPhones 133mn GB 371mn GB 412mn GB
Price
ASP (1GB equiv.; US$) calculated from LPDDR4x 48Gb $6.3 $6.3 $6.3
Total incremental sales creation from iPhones $838mn $2,337mn $2,597mn
OPM(% ) assumption 60% 59% 60%
Total incremental OP creation from iPhones $506mn $1,374mn $1,571mn
USD/KRW assumption 1,150 1,150 1,150
Total DRAM OP estimates at Samsung (KRW bn) 5,304 18,920 21,094
Total OP estimates at Samsung (KRW bn) 14,175 50,653 57,046
% to Total DRAM OP at Samsung 11% 8% 9%
% to Total OP at Samsung 4% 3% 3%

23 May 2017
iPhone and its supply chain 37
Figure 48: AAPL's quarterly iPhone NAND demand and % to total NAND demand
Source: Company data, DRAMeXchange, Credit Suisse estimates
How AAPL's NAND demand impacts Samsung
Samsung did not ship any NAND to AAPL's iPhone 5 and iPhone 6. It was not until the
release of iPhone 7 that Samsung was re-engaged as a supplier, mainly due to the 3D
NAND requirement for the 256GB products. Initially, Samsung had a 100% M/S in all 3D
NAND supply during the initial production phase of 256GB density iPhone 7 and we
believe that Samsung ultimately maintained over 85% M/S in that product category.
Upon being re-engaged as a NAND supplier to iPhones, we estimate that Samsung
generated over US$170 mn in OP during 4Q16 and is currently generating over US$400
mn in incremental OP from this new business annually. Any incremental profits in 2018
should not be too dramatic as 3D NAND shipments to AAPL are now a continuing
business (vs. new in 4Q16) and storage density configuration changes would only have
minimal impact to the overall Samsung's earnings.
As a scenario analysis, we calculate that the iPhone 8 series NAND requirements would
generate about US$283 mn in OP for 2017 and US$363 mn OP in 2018 under the base
case offerings of 32GB/128GB/256GB offerings. Our sensitivity analysis shows that if only
64GB and 256GB products were offered, 256GB products could represent 15% of total
iPhone 8 volume (30% in 2018). On an assumption of Samsung's M/S being 70% for
256GB devices and 30% for 64GB products, the OP contribution would increase to
US$430 mn in 2017 and US$849 mn in 2018. Despite Samsung likely supplying a large
portion of the 3D NAND supply, this would only represent about a 1% increase in the total
company's earnings in 2017E.
0%
2%
4%
6%
8%
10%
12%
14%
16%
18%
20%
0
1,000
2,000
3,000
4,000
5,000
6,000
7,000
8,000
9,000
10,000
1Q16 2Q16 3Q16 4Q16 1Q17 2Q17E 3Q17E 4Q17E 1Q18E 2Q18E 3Q18E 4Q18E 1Q19E 2Q19E 3Q19E 4Q19E
iPhone NAND bit demand % of total NAND demand(RHS)
GBmn

23 May 2017
iPhone and its supply chain 38
Figure 49: iPhone 8 series only impact to NAND industry/Samsung
(32GB/128GB/256GB)
Source: Company data, Credit Suisse estimates
Assumption (32GB/128GB/256GB) 4Q17E 2017E 2018E
Total iPhone 8 series production (iPhone 8/8 Plus/8 Pro) 71mn 90mn 114mn
Expected of NAND density breakdown among iPhones 8 series
Low(32GB) 67% 61% 61%
Mid(128GB) 26% 29% 30%
High(256GB) 7% 10% 10%
Expected iPhone 8 series unit breakdown by NAND density
Low(32GB) 47mn 55mn 70mn
Mid(128GB) 18mn 26mn 34mn
High(256GB) 5mn 9mn 11mn
Total NAND requirement on iPhone 8 series 5,162mn GB 7,368mn GB 9,386mn GB
Estimated iPhone 8 series NAND demand (%) to total NAND demand 9% 4% 4%
Samsung's NAND m/s at iPhones
Low(32GB) 0% 0% 0%
Mid(128GB) 30% 30% 30%
High(256GB) 70% 70% 70%
Samsung's NAND bit demand from iPhone 8 series 1,620mn GB 2,576mn GB 3,284mn GB
Samsungs' estimated total NAND production 19,706mn GB 62,620mn GB 90,798mn GB
Estimated iPhone 8 series NAND demand (%) to total Samsung NAND 8% 4% 4%
Earnings impact from iPhone 8 Series only to Samsung 4Q17E 2017E 2018E
Volume
Samsung's mobile NAND bit demand from iPhone 8 series 1,620mn GB 2,576mn GB 3,284mn GB
Price
ASP (1GB equiv.; US$) calculated from MLC 64Gb $0.23 $0.23 $0.23
Total incremental sales creation from iPhone 8 series $373mn $593mn $755mn
OPM(%) assumption 49% 48% 48%
Total incremental OP creation from iPhone 8 series $184mn $283mn $363mn
USD/KRW assumption 1,150 1,150 1,150
Total OP generation from iPhone 8 series (KRW bn) 211 326 418
Total NAND OP estimates at Samsung (KRW bn) 3,485 11,763 13,078
Total OP estimates at Samsung (KRW bn) 14,175 50,653 57,046
% to Total NAND OP at Samsung 6% 3% 3%
% to Total OP at Samsung 1% 1% 1%

23 May 2017
iPhone and its supply chain 39
Figure 50: iPhone 8 series only impact to NAND industry/Samsung
(64GB/256GB)
Source: Company data, Credit Suisse estimates
Fingerprint and touch sensor
In OLED models, the fingerprint sensor is likely to be embedded in the display, with the touch sensor laminated on top of the OLED cells. We also expect another physical membrane to be bonded to the bottom of the display for the touch system, but at the moment, there seems to be an issue with air bubbles being trapped between layers during the lamination process. The shift from capacitive sensing to under-glass sensing on OLED models will impact the Taiwan OSAT as it provides the SiP module for the fingerprint module (US$7-8 content). We estimate its addressable market will compress to half in 2017, though it could gain some market share to mitigate the loss. In 2018, its TAM could further decline with a higher adoption of the OLED panel for iPhone.
We expect the OLED iPhone to adopt a new force-touch structure, which could offer better
sensitivity than the current structure. We believe the new force-touch will switch from
capacitive to resistive/strain gauge sensing, which will adopt different material and
requires more process on lamination (more layers such as adding graphene for heat
dissipation), bonding and dispensing, and requires higher accuracy. We estimate
TPK/GIS’s ASP for the new structure could be ~40% higher than the current one, while
GM should be slightly better initially. The new force touch structure is also likely to adopt
Avago’s solution, replacing ADI’s.
Stock implications
In existing LTPS display models, cross-Nicol polarisers are used, but OLED displays will
see a shift to circular polarisers and Sumitomo Chemical is likely to be the main supplier.
Nitto Denko is also developing circular polarisers, which could eat into Sumitomo
Chemical’s share from 2018 models.
Assumption (64GB/256GB) 4Q17E 2017E 2018E
Total iPhone 8 series production (iPhone 8/8 Plus/8 Pro) 71mn 90mn 114mn
Expected of NAND density breakdown among iPhones 8 series
Low(64GB) 85% 85% 70%
High(256GB) 15% 15% 30%
Expected iPhone 8 series unit breakdown by NAND density
Low(64GB) 60mn 77mn 80mn
High(256GB) 11mn 14mn 34mn
Total NAND requirement on iPhone 8 series 6,548mn GB 8,388mn GB 13,890mn GB
Estimated iPhone 8 series NAND demand (%) to total NAND demand 12% 5% 6%
Samsung's NAND m/s at iPhones 8 series
Low(64GB) 30% 30% 30%
High(256GB) 70% 70% 70%
Samsung's NAND bit demand from iPhone 8 series 3,048mn GB 3,905mn GB 7,676mn GB
Samsung's' estimated total NAND production 19,706mn GB 62,620mn GB 90,798mn GB
Estimated iPhone 8 series NAND demand (%) to total Samsung NAND 15% 6% 8%
Earnings impact from iPhone 8 series only to Samsung 4Q17E 2017E 2018E
Volume
Samsung's mobile NAND bit demand from iPhone 8 series 3,048mn GB 3,905mn GB 7,676mn GB
Price
ASP (1GB equiv.; US$) calculated from MLC 64Gb $0.23 $0.23 $0.23
Total incremental sales creation from iPhone 8 series $701mn $898mn $1,766mn
OPM(%) assumption 49% 48% 48%
Total incremental OP creation from iPhone 8 series $346mn $430mn $849mn
USD/KRW assumption 1,150 1,150 1,150
Total NAND OP estimates at Samsung (KRW bn) 3,485 11,763 13,078
Total OP estimates at Samsung (KRW bn) 14,175 50,653 57,046
% to Total NAND OP at Samsung 11% 4% 7%
% to Total OP at Samsung 3% 1% 2%
Akinori Kanemoto Jerry Su
Randy Abrams

23 May 2017
iPhone and its supply chain 40
Previous LCD display models essentially used in-cell touch sensors and FPC force
sensors, but with OLED iPhone models, we expect Apple to switch to DITO touch sensors
and film-based force sensors. We forecast unit prices per device of US$3-3.5 for touch
sensors and around US$2 for force sensors, for a total of US$5-5.5. Nissha Printing is
likely to be the sole supplier for 2017 OLED models. We expect Nitto Denko to start work
on ITO-deposited base films and alloy-deposited films for force sensors.
We estimate iPhone force touch accounts for 33% of TPK’s revenue in 2018 and 50% of
its OP. Chipbond provides the bumping service for ADI’s force touch chip, but we believe
the impact from Avago replacing ADI should be limited to Chipbond, given force touch only
accounts for ~1% of Chipbond’s revenue.
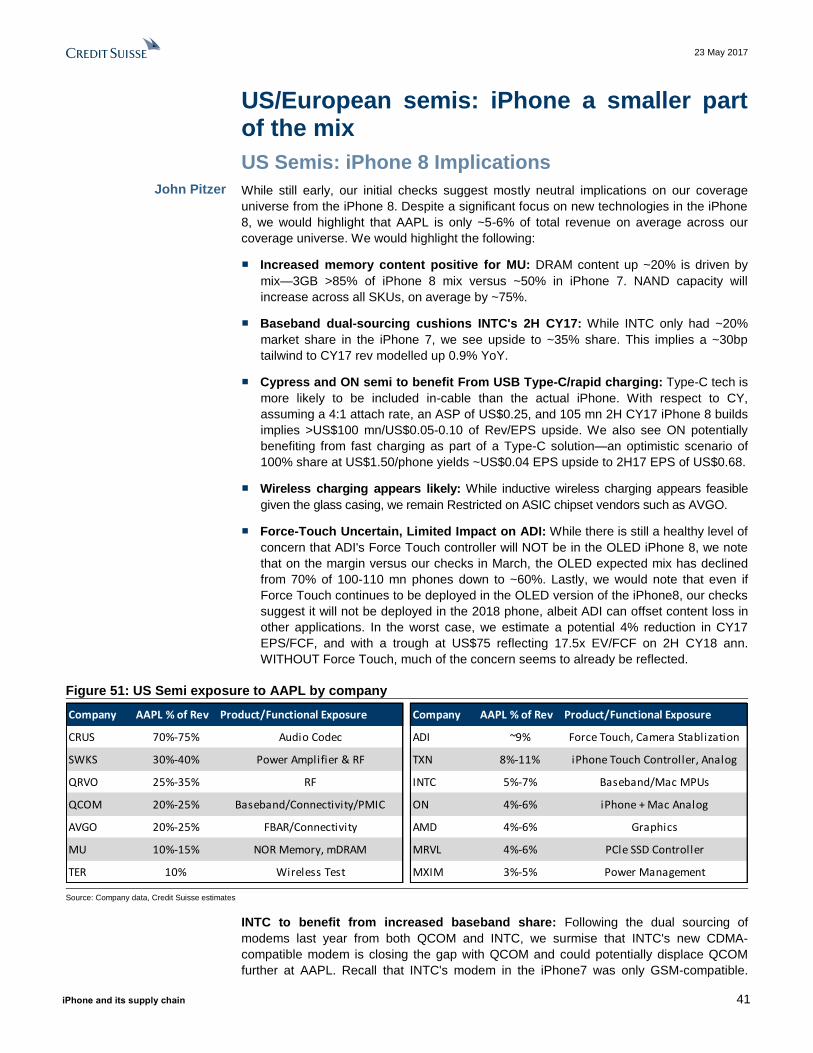
23 May 2017
iPhone and its supply chain 41
US/European semis: iPhone a smaller part of the mix
US Semis: iPhone 8 Implications
While still early, our initial checks suggest mostly neutral implications on our coverage
universe from the iPhone 8. Despite a significant focus on new technologies in the iPhone
8, we would highlight that AAPL is only ~5-6% of total revenue on average across our
coverage universe. We would highlight the following:
■ Increased memory content positive for MU: DRAM content up ~20% is driven by
mix—3GB >85% of iPhone 8 mix versus ~50% in iPhone 7. NAND capacity will
increase across all SKUs, on average by ~75%.
■ Baseband dual-sourcing cushions INTC's 2H CY17: While INTC only had ~20%
market share in the iPhone 7, we see upside to ~35% share. This implies a ~30bp
tailwind to CY17 rev modelled up 0.9% YoY.
■ Cypress and ON semi to benefit From USB Type-C/rapid charging: Type-C tech is
more likely to be included in-cable than the actual iPhone. With respect to CY,
assuming a 4:1 attach rate, an ASP of US$0.25, and 105 mn 2H CY17 iPhone 8 builds
implies >US$100 mn/US$0.05-0.10 of Rev/EPS upside. We also see ON potentially
benefiting from fast charging as part of a Type-C solution—an optimistic scenario of
100% share at US$1.50/phone yields ~US$0.04 EPS upside to 2H17 EPS of US$0.68.
■ Wireless charging appears likely: While inductive wireless charging appears feasible
given the glass casing, we remain Restricted on ASIC chipset vendors such as AVGO.
■ Force-Touch Uncertain, Limited Impact on ADI: While there is still a healthy level of
concern that ADI's Force Touch controller will NOT be in the OLED iPhone 8, we note
that on the margin versus our checks in March, the OLED expected mix has declined
from 70% of 100-110 mn phones down to ~60%. Lastly, we would note that even if
Force Touch continues to be deployed in the OLED version of the iPhone8, our checks
suggest it will not be deployed in the 2018 phone, albeit ADI can offset content loss in
other applications. In the worst case, we estimate a potential 4% reduction in CY17
EPS/FCF, and with a trough at US$75 reflecting 17.5x EV/FCF on 2H CY18 ann.
WITHOUT Force Touch, much of the concern seems to already be reflected.
Figure 51: US Semi exposure to AAPL by company
Source: Company data, Credit Suisse estimates
INTC to benefit from increased baseband share: Following the dual sourcing of
modems last year from both QCOM and INTC, we surmise that INTC's new CDMA-
compatible modem is closing the gap with QCOM and could potentially displace QCOM
further at AAPL. Recall that INTC's modem in the iPhone7 was only GSM-compatible.
Company AAPL % of Rev Product/Functional Exposure Company AAPL % of Rev Product/Functional Exposure
CRUS 70%-75% Audio Codec ADI ~9% Force Touch, Camera Stablization
SWKS 30%-40% Power Amplifier & RF TXN 8%-11% iPhone Touch Controller, Analog
QRVO 25%-35% RF INTC 5%-7% Baseband/Mac MPUs
QCOM 20%-25% Baseband/Connectivity/PMIC ON 4%-6% iPhone + Mac Analog
AVGO 20%-25% FBAR/Connectivity AMD 4%-6% Graphics
MU 10%-15% NOR Memory, mDRAM MRVL 4%-6% PCle SSD Controller
TER 10% Wireless Test MXIM 3%-5% Power Management
John Pitzer

23 May 2017
iPhone and its supply chain 42
Specifically, both QCOM and INTC modems are being marketed as the first Gigabit LTE
modems, i.e. they are the first to exceed 1 Gbp download speeds, and both support 5x
carrier aggregation and 4x4 MIMO configurations. It also is still unclear if the iPhone 8 will
be a Gigabit LTE phone. While INTC likely had ~20% market share in the iPhone 7—
implying ~US$190 mn of revenue assuming 95 mn units at a US$10 ASP, we believe that
INTC may have closer to ~30-40% market share in the iPhone 8—implying closer to
~US$400mn of C2H Rev. While this would still represent <1% of CY17 Rev, it provides a
~30bp tailwind to CY17 Rev modelled up 0.9% YoY.
Figure 52: AAPL provides cushion to C2H growth Figure 53: AAPL rev improves 2H HoH growth
Source: Company data, Credit Suisse estimates Source: Company data, Credit Suisse estimates
CY to Benefit from USB Type-C: While we are not as confident as some around the
inclusion of Type-C in the iPhone 8, we see Type-C technology being incorporated into
power adapters as a far more likely scenario than Type-C actually incorporated in to the
phone. We believe the cable is more in-line with AAPL's core strategy, given AAPL's
historically slow-moving tech adoption and a switch to Lightning connectors in 2012
(replacing the 30-pin dock) that drove an entire ecosystem of accessories, cables, and
chargers to support Lightning technology. We would also note that the Lightning socket is
smaller than a Type-C socket. While it is possible AAPL integrates Type-C in the phone,
as Samsung did with the GS8, we suspect that Samsung did so using internal technology
(Samsung LSI) whereas AAPL would need to get Type-C from a vendor such as CY. We
still see the cable and accessory market as attractive for CY. Assuming a 4:1 attach rate,
an ASP of US$0.25, and 105 mn 2H CY17 iPhone 8 builds implies >US$100 mn of
revenue, and 5-10 cents of EPS.
Figure 54: Global Type-C TAM estimates Figure 55: Global handset opportunity
Source: Company data, Credit Suisse estimates Source: Company data, Credit Suisse estimates
MU to benefit from increased DRAM/NAND: We believe there is the possibility for the
iPhone 8 to have two DRAM SKUs, while the standard iPhone 8 DRAM remains at 2GB,
4.8%
5.5%
6.4%
4%
5%
6%
7%
8%
Street + Low AAPLContr.
Street w/ Mid AAPLContr.
Street + High AAPLContr.
C2
H1
7 R
ev
H/H
(%
)
INTC C2H17 Rev Scenario Analysis AAPL C2H17 Modem Contribtion Sensitivity Analysis
Units (m) Mkt Share (%)
High 110.0 High 50.0%
Mid-point 105.0 Mid-point 35.0%
Low 100.0 Low 20.0%
Implied Units (m) ASP ($)
High 55.0 High $11.5
Mid-point 36.8 Mid-point $10.0
Low 20.0 Low $8.5
Implied Rev ($m) Incremental Growth (H/H)
High $632.5 High 6.4%
Mid-point $367.5 Mid-point 5.5%
Low $170.0 Low 4.8%
$35
$175
$500
$700
$800 $880
$0
$100
$200
$300
$400
$500
$600
$700
$800
$900
CY16 CY17 CY18 CY19 CY20 CY21
USB
Typ
e-C
TA
M (
$m
)
CAGR = ~90%10% 15% 20% 25% 30% 35% 40%
$1.50 $375 $563 $750 $938 $1,125 $1,313 $1,500
$1.40 $350 $525 $700 $875 $1,050 $1,225 $1,400
$1.30 $325 $488 $650 $813 $975 $1,138 $1,300
$1.20 $300 $450 $600 $750 $900 $1,050 $1,200
$1.10 $275 $413 $550 $688 $825 $963 $1,100
$1.00 $250 $375 $500 $625 $750 $875 $1,000
$0.90 $225 $338 $450 $563 $675 $788 $900
$0.80 $200 $300 $400 $500 $600 $700 $800
Rev ($mm) Handset Attach Rate
AS
Ps
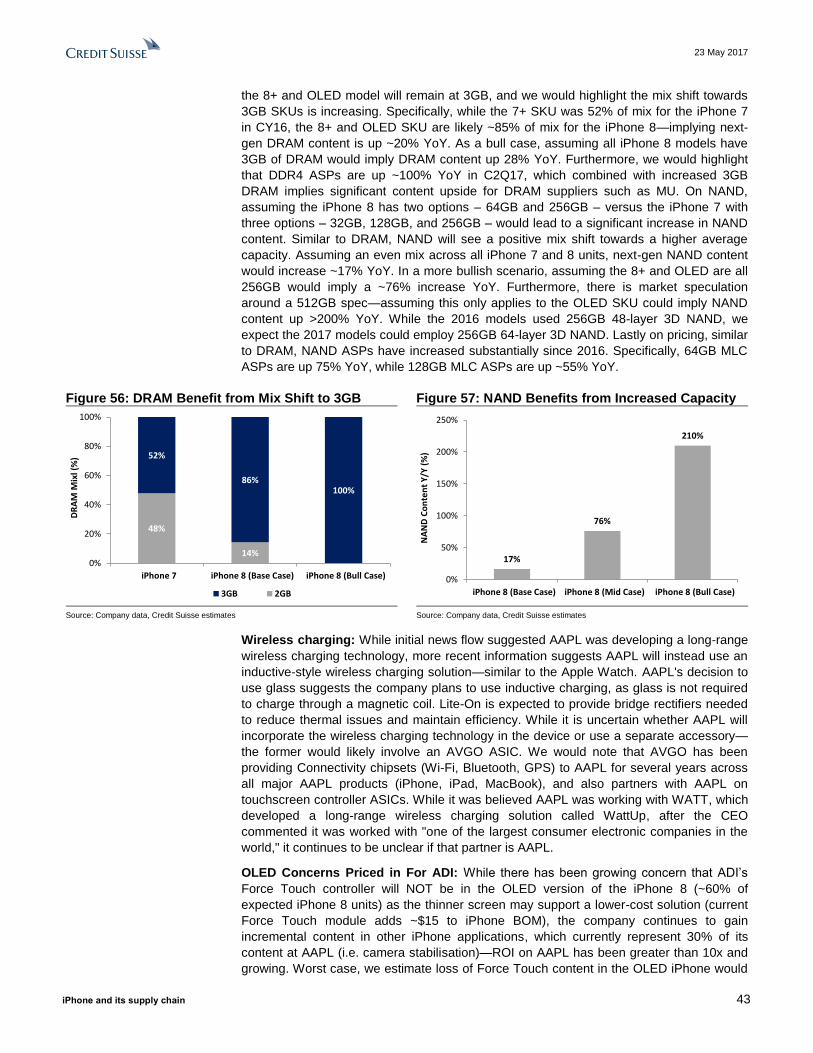
23 May 2017
iPhone and its supply chain 43
the 8+ and OLED model will remain at 3GB, and we would highlight the mix shift towards
3GB SKUs is increasing. Specifically, while the 7+ SKU was 52% of mix for the iPhone 7
in CY16, the 8+ and OLED SKU are likely ~85% of mix for the iPhone 8—implying next-
gen DRAM content is up ~20% YoY. As a bull case, assuming all iPhone 8 models have
3GB of DRAM would imply DRAM content up 28% YoY. Furthermore, we would highlight
that DDR4 ASPs are up ~100% YoY in C2Q17, which combined with increased 3GB
DRAM implies significant content upside for DRAM suppliers such as MU. On NAND,
assuming the iPhone 8 has two options – 64GB and 256GB – versus the iPhone 7 with
three options – 32GB, 128GB, and 256GB – would lead to a significant increase in NAND
content. Similar to DRAM, NAND will see a positive mix shift towards a higher average
capacity. Assuming an even mix across all iPhone 7 and 8 units, next-gen NAND content
would increase ~17% YoY. In a more bullish scenario, assuming the 8+ and OLED are all
256GB would imply a ~76% increase YoY. Furthermore, there is market speculation
around a 512GB spec—assuming this only applies to the OLED SKU could imply NAND
content up >200% YoY. While the 2016 models used 256GB 48-layer 3D NAND, we
expect the 2017 models could employ 256GB 64-layer 3D NAND. Lastly on pricing, similar
to DRAM, NAND ASPs have increased substantially since 2016. Specifically, 64GB MLC
ASPs are up 75% YoY, while 128GB MLC ASPs are up ~55% YoY.
Figure 56: DRAM Benefit from Mix Shift to 3GB Figure 57: NAND Benefits from Increased Capacity
Source: Company data, Credit Suisse estimates Source: Company data, Credit Suisse estimates
Wireless charging: While initial news flow suggested AAPL was developing a long-range
wireless charging technology, more recent information suggests AAPL will instead use an
inductive-style wireless charging solution—similar to the Apple Watch. AAPL's decision to
use glass suggests the company plans to use inductive charging, as glass is not required
to charge through a magnetic coil. Lite-On is expected to provide bridge rectifiers needed
to reduce thermal issues and maintain efficiency. While it is uncertain whether AAPL will
incorporate the wireless charging technology in the device or use a separate accessory—
the former would likely involve an AVGO ASIC. We would note that AVGO has been
providing Connectivity chipsets (Wi-Fi, Bluetooth, GPS) to AAPL for several years across
all major AAPL products (iPhone, iPad, MacBook), and also partners with AAPL on
touchscreen controller ASICs. While it was believed AAPL was working with WATT, which
developed a long-range wireless charging solution called WattUp, after the CEO
commented it was worked with "one of the largest consumer electronic companies in the
world," it continues to be unclear if that partner is AAPL.
OLED Concerns Priced in For ADI: While there has been growing concern that ADI’s
Force Touch controller will NOT be in the OLED version of the iPhone 8 (~60% of
expected iPhone 8 units) as the thinner screen may support a lower-cost solution (current
Force Touch module adds ~$15 to iPhone BOM), the company continues to gain
incremental content in other iPhone applications, which currently represent 30% of its
content at AAPL (i.e. camera stabilisation)—ROI on AAPL has been greater than 10x and
growing. Worst case, we estimate loss of Force Touch content in the OLED iPhone would
48%
14%
52%
86%100%
0%
20%
40%
60%
80%
100%
iPhone 7 iPhone 8 (Base Case) iPhone 8 (Bull Case)
DR
AM
Mix
l (%
)
3GB 2GB
17%
76%
210%
0%
50%
100%
150%
200%
250%
iPhone 8 (Base Case) iPhone 8 (Mid Case) iPhone 8 (Bull Case)
NA
ND
Co
nte
nt
Y/Y
(%
)

23 May 2017
iPhone and its supply chain 44
result in a potential 4% reduction in CY17 EPS/FCF, and would note that most of the
concern seems to already be reflected—17.5x EV/FCF (in-line with peers) on 2H CY18
ann. Excluding Force Touch yields a trough of $75. Furthermore, we would note that
conservatism around LLTC synergies could offset potential disruption at AAPL—
specifically an incremental $50 mn in annualised cost synergies would drive 100 bp of
OpM expansion / ~$0.15 in EPS. Longer term, LLTC drives ongoing AAPL exposure to
~9% of Rev, and even with Force Touch, AAPL will NOT exceed 15% of Rev in any given
quarter vs the prior peak of 26% of Rev in 4Q CY15.
Figure 58: LLTC Reduces ADI's AAPL Exposure and
QoQ Volatility
Figure 59: Force Touch Represents <10% of ADI
Rev
Source: Company data, Credit Suisse estimates Source: Company data, Credit Suisse estimates
EU Semis: iPhone 8 implications
As our Apple analyst (Kulbinder Garcha) now expects iPhone units of 229 mn/250 mn for
CY17/CY18 (+6%/+9% yoy), which is 2%/1% higher than previous estimates. Within that,
we now expect iPhone8 (all models combined) build plans of ~100 mn units and sell-in
units of 90 mn in CY17 (this 90 mn compares to our previous estimate of 75-80 mn range).
Within 90 mn units, we expect 41 mn units for the OLED model, which we believe is also
likely to support new 3D imaging/sensor technology on the front panel.
Figure 60: Potential content for EU semi suppliers in next gen iPhones
Source: Company data, Credit Suisse estimates
0%
5%
10%
15%
20%
25%
30%
F4Q15 (Peak Q) FY17 Stand-Alone ADI FY18
AA
PL
Re
v (%
of
Tota
l Re
v)
ADI AAPL Exposure
Down 29%
0%
5%
10%
15%
20%
25%
30%
0%
5%
10%
15%
20%
25%
30%
Ap
r-1
5
Jul-
15
Oct
-15
Jan
-16
Ap
r-1
6
Jul-
16
Oct
-16
Jan
-17
Ap
r-1
7
Jul-
17
Oct
-17
Jan
-18
Ap
r-1
8
Jul-
18
Oct
-18
Jan
-19 AA
PL
as %
of
Tota
l AD
I EP
S
% o
f To
tal A
DI
Re
v
ADI AAPL Content as % of Total Rev/EPS
Force Touch Other % of EPS
Chip technology iPhone model Content (US$)
STMicroelectronics
Time of Flight (ToF) sensor iPhone 7/7Plus and above ~$1.00
CMOS imaging for front-end 3D sensor iPhone 8/9 (only OLED model) ~$4.00
Austria Microsystems (ams)
Ambient Light Sensor (ALS) iPhone 7/7 Plus or lower ~$0.40
True Colour Sensor (TCS) all iPhone 8 models and above ~$1.00
Wafer Level Optics (WLO) for front-end 3D iPhone 8/9 (only OLED model) ~$2.50
Diffractive Optical Elements (DOE) + Packaging for front-end 3D iPhone 8/9 (only OLED model) ~$1.50 (share split with other supplier)
Imaging module for back-end 3D iPhone 9 and above (only OLED model) ~$6.50 combined (incl. imaging sensor)
Dialog Semiconductor
Power Management IC (PMIC) iPhone 7/7 Plus or lower ~$3.50 (in latest model)
Power Management IC (PMIC) All iPhone 8 models and above ~$4.00 (incl. 2nd PMIC chip)
Imagination Technologies
IP for Graphics Processing Unit (GPU) iPhone 7/7 Plus or lower ~$0.30 royalty
IP for Graphics Processing Unit (GPU) All iPhone 8 models ~$0.30 royalty
IP for Graphics Processing Unit (GPU) All iPhone 9 models and above No royalty
Achal Sultania

23 May 2017
iPhone and its supply chain 45
STMicroelectronic NV: 3D imaging—some this year, more next year
Maintain estimates and NEUTRAL rating; scope for incremental opportunity if 3D
gets incorporated across all iPhone models next year. Following our recent estimates
upgrade (post STM's Analyst Day on 11th May), we keep our estimates unchanged.
However, we equally note that our estimates assume inclusion of 3D imaging sensor only
for iPhone8 OLED version this year and iPhone9 OLED version next year. If adoption
were to happen across all versions next year, we see scope for potential upside for STM.
We continue to forecast sales growth of 14%/9% for STM in 2017/18 with EPS of
$0.77/$1.00, which drives our TP of €15.5.
ToF and 3D imaging related to iPhone to add~$350 mn/$500 mn of sales in 2017/18.
Based on our checks, we believe STM is providing a custom-designed CMOS sensor
solution in the upcoming iPhone8 model. This is likely to be around $4 content for STM,
but will be used only in the iPhone8 OLED (or Pro) version. Of the 90 mn sell-in iPhone8
units for 2H17 (though build plans may be ~100 mn), we expect 41 mn units using OLED
screen adding ~$165 mn of sales this year. In addition, STM's existing time of flight (ToF)
sensor (~$1 ASP) already used in all iPhone7 versions and likely to be used in all iPhone8
versions, will contribute ~$185 mn in sales in 2017 (up from ~$70 mn in 2016).
Furthermore, with more smartphone vendors in China and Korea also using ToF sensors,
we believe overall revenues in STM's Other segment will grow from $291 mn in 2016 to
$650 mn/$800 mn in 2017/18 (this assumes rapid declines in legacy imaging products).
8% potential EBIT upside if STM's 3D is adopted across all iPhone9 next year. In a
scenario, if 3D solution is used across all iPhone9 versions next year, it could potentially
add $170 mn of sales in 2018 (2% potential upside to our sales estimate). Assuming 50%
incremental margin, it can add $85 mn of EBIT, which is 8% upside to our EBIT estimate
of $1.1 bn for 2018.
TP of €15.5. Our TP of €15.50 is based on 2018 P/E of 16x plus current net cash/share of
$0.6 (or €0.5). This would imply EV/sales of 1.7x on our 2018 estimates, which looks rich
but can be justified, given rising EBIT margins (2.5% in 2015 to 7.4% in Q117 and we
expect 13% in 2018).
Ams AG: Potential for significant content increase ahead
Maintain estimates; reiterate OUTPERFORM rating. Across our EU coverage, we
continue to see ams as the biggest beneficiary from increasing content within upcoming
iPhone generations over the next few years. While we maintain our estimates given
visibility around content increase only for this year's iPhone launch but not into next year's
launch at this stage, we see potential for further revenue upside (also confirmed by the
company's recent comments around upward pressure to its guidance of €1.2 bn sales by
2019). We reiterate OUTPERFORM rating with TP of SFr72.
Long-standing relationship to continue getting deeper. So far, ams has been the sole
supplier for ambient light sensors across all iPhone/iPad generations. In the upcoming
iPhone8, we believe ams could be supplying 3 solutions: (1) true colour sensor (~$1 ASP)
for all new models instead of ambient light sensor (~$0.40 ASP); (2) wafer level optics
(WLO) for front-end 3D solution to be used in the iPhone8 OLED model only (~$2.50
solution); and (3) diffractive optical elements (DOE) and packaging also for front-end 3D
solution (again only for iPhone8 OLED model) worth ~$1.50 (though share here may be
split with Asian suppliers, maybe Xintec). Although we assume that these new 3D-related
offerings continue to be used in high-end OLED models even in 2018, there is a possibility
of seeing adoption across all new models. In addition, we also see an opportunity for ams
to be supplying 3D related module (back-end) for iPhone9 next year, which potentially
could be a solution worth ~$6.50 for ams (again only used for OLED model).
Significant potential upside in blue sky scenario. In our current estimates, we assume
iPhone-related revenues for ams to rise from ~€80 mn in 2016 to ~€250 mn/€620 mn in

23 May 2017
iPhone and its supply chain 46
2017/18, if we were to see 3D related solutions getting adopted in both OLED and non-
OLED models, total revenues from iPhone could reach around €1.0 bn longer term. This
could provide potential upside of 30%/45% to our longer-term revenue/EBIT estimates.
TP of SFr72. Our TP of SFr72 is based on average of (1) 2019 P/E of 15x, and (2) DCF
using long-term growth rate of 1.5% and EBIT margin of 30%. Our blue sky scenario
suggests fair value of SFr90.
Dialog Semiconductor: Content growth and better iPhone mix ahead
Adjusting estimates and TP up slightly; reiterate Outperform. Given our view on slightly
higher iPhone units along with better mix of iPhone8 vs older generation models, we slightly
raise our revenue and EPS estimates for Dialog by 1% and 2%, respectively, for both 2017/18,
as we now forecast EPS of $2.80/$3.32. With content set to rise in iPhone8, ongoing traction
in fast charging and Bluetooth Smart, and potential new customer for power management
from 4Q17, we believe Dialog will see 14%/11% growth in sales in 2017/18 with scope for
further upside depending on customer traction. We raise our TP to €54 (vs €53 previously)
and reiterate OUTPERFORM rating. Please see full report.
Slightly higher iPhone units, better iPhone8 mix ahead. Our Apple analyst (Kulbinder
Garcha) now expects iPhone units of 229 mn/250 mn for CY17/CY18 (+6%/+9% YoY),
which is 2%/1% higher than previous estimates. Within that, we now expect iPhone8 (all
models combined) build plans of ~100 mn units and sell-in units of 90 mn in CY17 (39% of
total iPhone volumes in the year of launch vs 32% for iPhone7, 29% for iPhone6S and 34%
for iPhone6 models in their years of launch). This 90 mn compares to our previous
estimates of 75-80 mn range for CY17. We continue to believe that Dialog will supply two
chips (both power management related) in the upcoming iPhone8 with aggregate content
of $4.00 vs one chip in iPhone7 at an ASP of $3.50. With Dialog's content likely to remain
same across all iPhone8 versions, the mix shift within that should not impact either way.
Significant ramp in 2H17. Given lacklustre 2Q sales guidance ahead of upcoming
iPhone8 launch along with content gain, we believe DLG is set for a significant ramp-up in
2H17 similar to what we saw in 2H13 and 2H14. For Mobile (~75% of group sales) in
2H17, we model sales growth of 21% YoY and 75% HoH similar to what we saw in 2H14
(27% YoY; 77% HoH) and 2H13 (25% YoY; 76% HoH) and well above levels in 2H16 (-7%
YoY; 53% HoH). This would imply Mobile sales of $1.06 bn (+14% YoY) for full-year 2017.
TP adjusted up to €54. Our TP of €54 continues to be based on 2018 P/E of 15x
(average FY2 P/E for Dialog shares has been 15x since 2010) plus $9.0 of current net
cash/share (adjusted for $80.5 mn liabilities marked for buybacks).

23 May 2017
iPhone and its supply chain 47
Assembly: Rising tide might lift all boats We believe the iPhone OLED super-cycle accelerates volume growth for all three iPhone
assemblers—Hon Hai, Pegatron and Wistron. The timing of this growth varies, with Hon
Hai leading the pack and enjoying 100% allocations of the premier OLED model launching
year-end. In order to ramp up for OLED volumes, Hon Hai will need to give up share in the
two LTPS models. Pegatron increases market share in the 4.7" model; Wistron in the 5.5"
model. We expect OLED displays adopted in all models in 2018 at which point
Pegatron/Wistron should start to benefit from their respective OLED cycles. Overall, Credit
Suisse adjust iPhone shipment forecasts overnight to 229/250 mn (+6.5%/+9%) in
CY17/18 (Full report). Specific adjustments were made to reflect the timing of OLED
shipments into Oct-17 and the overall iPhone mix. Herein, CS forecasts 41/127.5 mn
OLED iPhones in CY17/18.
Figure 61: Hon Hai stands to benefit from the OLED cycle first this year
Source: Company data, Credit Suisse estimates
Figure 62: OLED iPhone super-cycle boosts volume growth for all assemblers
Source: Company data, Credit Suisse estimates
Increase estimates for Hon Hai, Pegatron and Wistron
CS revised iPhone forecasts to adjust for the timing of OLED iPhone shipments (i.e., Oct-17)
and iPhone mix. We expect Apple ships 41 mn OLED iPhones in Dec-17 and 127.5 mn in
CY18. Although the overall forecasted iPhone units changes overnight are not significant (-
2%/+0.5% in CY17/18E), the breakdown of OLED units and ASP resulted in changes to each
iPhone assembler’s forecasts. We revised CY17/18 estimates for Hon Hai, Wistron and
Pegatron by +1%-8%. We lift target prices for Hon Hai to NT$120 (from NT$105); Wistron to
NT$34 (from NT$32) and kept Pegatron at NT$85, rolling to NTM EPS.
CY16 CY17E CY18E CY19E CY16 CY17E CY18E CY19E
Total shipments 215,395 228,986 249,828 270,054 -7.0% 6.3% 9.1% 8.1%
Hon Hai 155,768 157,473 170,183 180,658 -5.0% 1.1% 8.1% 6.2%
Pegatron 52,000 54,000 54,976 59,440 -15.4% 3.8% 1.8% 8.1%
Wistron 7,627 17,513 24,669 29,956 26.9% 129.6% 40.9% 21.4%
% allocation
Hon Hai 72% 69% 68% 67%
Pegatron 24% 24% 22% 22%
Wistron 4% 8% 10% 11%
Annual shipment (000's) YoY % change
+6.5%
+9%+8%
+1%+8% +6%
+4% +2% +8%
+130% +41% +21.5%
0
50,000
100,000
150,000
200,000
250,000
300,000
CY17E CY18E CY19E
Total shipments Hon Hai Pegatron Wistron
Thompson Wu

23 May 2017
iPhone and its supply chain 48
Figure 63: Revised CY17/18 forecasts reflect 41/127.5 mn OLED iPhones on 229/250 mn total iPhones
Source: Company data, Credit Suisse estimates
Potential risks with QCOM complaint filing on 17 May
Qualcomm (covered by Kulbinder Garcha) filed a complaint against Hon Hai (including FIH
Mobile), Pegatron, Wistron and Compal—Apple's top four contract manufacturers based in
Taiwan. Importantly, QCOM did NOT file an injunction (or lawsuit), which in our view
suggests no immediate impact to the contract manufacturers' businesses. The press
release writes the manufacturers are following Apple's instruction NOT to pay, and goes
on to further state that the contract manufacturers are continuing to pay in non-Apple
products. Ultimately, we believe Apple/QCOM will settle and assemblers will continue to
pay royalties. Importantly, we expect Apple recoups all costs to the assemblers.
Hon Hai: Top pick among iPhone assemblers
(OUTPERFORM, raising TP to NT$120 from NT$105)
Hon Hai remains our top buy in the Asia Hardware sector despite 21% YTD share price
appreciation. We focus on continued upgrades with OLED iPhones driven by: (1)
increasing volumes on better demand; (2) OLED ASP, which drives sales growth; and (3)
gross margins with the supply of the new casing design. We raise TP to NT$120 (from
NT$105), which offers 18% upside and 4.5% cash dividend, after an in-depth analysis of
iPhone and OLED model. Other key aspects of our investment thesis based on Street
upgrades on Sharp and increasing capital returns. Please click here for our full report.
Hon Hai's earnings sensitivity to OLED iPhone volumes, ASP and GM
The three major variables to our earnings forecasts are OLED iPhone units with concerns
in CY17, given delays (i.e., we assume Dec-17 quarter shipment); OLED iPhone ASP (i.e.,
US$550/US$545 in CY17/18) and gross margins (i.e., 7.4% including royalty costs). We
expect delays in CY17 push orders/shipments into CY18. Our sensitivity analysis
concludes roughly 0.5%-1% EPS accretion for 1 mn additional units in CY17/18; +1.5%-
4.0% EPS for 50 bp increase in gross margins; +2.5%-6.0% for every US$50 increase in
manufacturers' ASP.
1Q17A 2Q17E 3Q17E 4Q17E 1Q18E 2Q18E 3Q18E 4Q18E CY15 CY16 CY17E CY18E
Mar-17 Jun-17 Sep-17 Dec-17 Mar-18 Jun-18 Sep-18 Dec-18
Total shipments 50,763 44,164 48,838 85,222 57,099 48,534 53,406 90,790 231,529 215,395 228,986 249,828
YoY % change -0.8% 9.3% 7.3% 8.9% 12.5% 9.9% 9.4% 6.5% 20.2% -7.0% 6.3% 9.1%
QoQ % change -35.2% -13.0% 10.6% 74.5% -33.0% -15.0% 10.0% 70.0%
Units by model
OLED iPhone 0 0 0 40,906 17,415 13,104 30,228 66,822 0 0 40,906 127,569
4.7" LTPS iPhone 27,920 24,334 26,177 28,634 21,983 18,928 9,613 9,987 142,119 118,499 107,065 60,511
5.5" LTPS iPhone 15,483 13,470 15,628 9,119 10,620 10,483 6,943 6,355 67,121 55,078 53,699 34,402
Older iPhones 7,361 6,360 7,033 6,562 7,080 6,018 6,622 7,626 22,289 41,818 27,315 27,347
US$ ASP model
Overall ASP $637 $572 $629 $740 $687 $687 $695 $693 $655 $629 $661 $691
OLED iPhone $0 $0 $0 $884 $858 $865 $852 $858 $0 $0 $884 $858
4.7" LTPS iPhone $618 $590 $551 $659 $667 $667 $619 $663 $651 $638 $606 $659
5.5" LTPS iPhone $737 $670 $622 $741 $755 $771 $729 $769 $776 $753 $687 $757
Older iPhones $395 $395 $395 $370 $378 $367 $345 $343 $522 $295 $389 $358

23 May 2017
iPhone and its supply chain 49
Figure 64: 2017E EPS to OLED units/OLED GM Figure 65: 2018E EPS to OLED units/OLED GM
Source: Company data, Credit Suisse estimates Source: Company data, Credit Suisse estimates
Figure 67: 2017E EPS to OLED units/OLED ASP Figure 66: 2018E EPS to OLED units/OLED ASP
Source: Company data, Credit Suisse estimates Source: Company data, Credit Suisse estimates
Wistron: iPhone profits emerge in 4Q17 (OUTPERFORM, raising TP to NT$34 from NT$32)
Wistron became an iPhone assembler in 2014 and struggled with yields due to limited
orders and its own manufacturing capabilities. iPhone 7 Plus ramp-up was a key milestone
with better yields. We believe Wistron will have the orders to be profitable on iPhone 8 with
capacity expanding to 20-25 mn. Importantly, we expect Wistron's profitability to improve
significantly through efficiency assuming no major changes in the 5.5" model and as its
volumes increase to 17.5/24.5 mn (+130%/+41%) in CY17/18. Our sensitivity analysis
suggests 4% 2017 EPS accretion for every 1 mn units' increase, and 26% for 100 bp
increase in OpM. Separately, we believe Wistron's server/storage business sales
increased 14% (>30% in Cloud data-center) in 2017 as it won new Facebook rack orders.
We raise our 2017/18E EPS by 1%/3%, primarily adjusting for iPhone shipments and ASP.
We raise TP to NT$34 moving to 13x NTM EPS.
Figure 68: Raise 2017/18E EPS by 1%/3% Figure 69: 2017E EPS sensitivity to iPhones
Source: Company data, Credit Suisse estimates Source: Company data, Credit Suisse estimates
Pegatron: OLED cycle next year's driver (NEUTRAL, maintaining TP at NT$85)
We believe Pegatron remains firmly positioned as Apple's second major iPhone
manufacturer. We forecast 54/55 mn (+4%/+2%) in CY17/18 and primarily the 4.7" LTPS
model. We expect volumes to accelerate next year as OLED becomes available in the 4.7"
model and start to benefit from the super-cycle. Pegatron’s capex plans this year set
capacity to support our projected growth. Microsoft's expanding Surface portfolio is the
other customer to watch for in terms of product catalysts in 2H. The computing business is
under pressure with key customers being Acer and Asus. We raise our 2017/18E EPS by
1%/2%, primarily adjusting for iPhone shipments and ASP. TP is unchanged at NT$85
moving to 10x NTM EPS.
2017E OLED iPhone shipments
$2.74 38,906 39,906 40,906 41,906 42,906
2017E 6.4% -4.6% -4.0% -3.4% -2.8% -2.1%
OLED 6.9% -3.0% -2.3% -1.7% -1.0% -0.4%
iPhone 7.4% -1.4% -0.7% 0.0% 0.7% 1.4%
GM % 7.9% 0.2% 0.9% 1.7% 2.4% 3.2%
8.4% 1.8% 2.6% 3.4% 4.2% 4.9%
2018E OLED iPhone shipments
$2.74 110,693 111,693 112,693 113,693 114,693
2018E 6.4% -9.1% -8.5% -8.0% -7.5% -6.9%
OLED 6.9% -5.1% -4.6% -4.0% -3.4% -2.9%
iPhone 7.4% -1.2% -0.6% 0.0% 0.6% 1.2%
GM % 7.9% 2.7% 3.4% 4.0% 4.6% 5.3%
8.4% 6.6% 7.3% 8.0% 8.7% 9.3%
2017E OLED iPhone shipments
3 38,906 39,906 40,906 41,906 42,906
2017E $450 -6.4% -5.8% -5.2% -4.6% -4.1%
OLED $500 -3.9% -3.2% -2.6% -2.0% -1.3%
iPhone $550 -1.4% -0.7% 0.0% 0.7% 1.4%
ASP $600 1.1% 1.8% 2.6% 3.4% 4.1%
$650 3.6% 4.4% 5.2% 6.0% 6.9%
2018E OLED iPhone shipments
$3 110,693 111,693 112,693 113,693 114,693
2018E $445 -13.4% -13.0% -12.5% -12.0% -11.5%
OLED $495 -7.3% -6.8% -6.2% -5.7% -5.1%
iPhone $545 -1.2% -0.6% 0.0% 0.6% 1.2%
ASP $595 4.9% 5.6% 6.2% 6.9% 7.5%
$645 11.0% 11.7% 12.5% 13.2% 13.9%
NT$ mn 1Q17A 2Q17E CS Est. Consens. 3Q17E 4Q17E 2016 2017E 2018E
Sales 168,408 168,466 174,887 168,840 235,230 233,810 659,908 805,914 913,787
Gross profit 6,364 7,308 7,139 7,792 10,967 11,083 31,645 35,722 40,973
Operating profit 491 1,075 634 1,439 3,557 3,952 6,012 9,075 12,646
Pre-tax profit 777 939 479 1,408 3,392 3,758 4,757 8,866 11,795
Net profit 545 624 316 893 2,268 2,513 2,961 5,950 7,883
GAAP EPS $0.22 $0.25 $0.13 $0.34 $0.90 $1.00 $1.20 $2.41 $3.19
Sales YoY % 25.0% 14.9% 19.3% 15.1% 39.6% 11.3% 5.9% 22.1% 13.4%
Sales QoQ % -19.8% 0.0% 3.8% 0.3% 39.6% -0.6%
GM % 3.8% 4.3% 4.1% 4.6% 4.7% 4.7% 4.8% 4.4% 4.5%
Opex/sales 3.5% 3.7% 3.7% 3.8% 3.2% 3.1% 3.9% 3.3% 3.1%
OPM % 0.3% 0.6% 0.4% 0.9% 1.5% 1.7% 0.9% 1.1% 1.4%
2017E iPhone shipments
$2.7 15,513 16,513 17,513 18,513 19,513
2017E -0.3% -31% -28% -26% -23% -20%
iPhone 0.2% -19% -16% -13% -9% -6%
OpM % 0.7% -8% -4% 0% 4% 8%
1.7% 15% 20% 26% 31% 37%
2.7% 37% 44% 51% 58% 65%

23 May 2017
iPhone and its supply chain 50
Figure 70: Raise 2017/18 EPS by 1%/2% Figure 71: 2018E EPS sensitivity to iPhones
Source: Company data, Credit Suisse estimates Source: Company data, Credit Suisse estimates
NT$ mn 1Q17A 2Q17E CS Est. Consen. 3Q17E 4Q17E 2016 2017E 2018E
Sales 238,999 233,472 246,872 224,570 347,436 383,757 1,157,710 1,203,663 1,332,324
Gross profit 11,961 11,562 12,841 11,700 18,807 20,724 63,067 63,054 71,253
Operating profit 5,577 6,067 5,864 4,888 9,855 12,675 32,414 34,173 39,050
Pre-tax profit 5,108 6,069 5,869 5,103 9,801 12,542 29,080 33,520 39,105
Net profit 3,882 3,664 3,261 3,167 6,381 8,148 19,340 22,075 25,774
GAAP EPS $1.51 $1.42 $1.26 $1.20 $2.48 $3.16 $7.50 $8.56 $9.99
YoY sales chg % -6.8% 3.9% 9.9% 0.0% 9.9% 6.5% -4.6% 4.0% 10.7%
QoQ sales chg % -33.7% -2.3% 3.3% -6.0% 48.8% 10.5%
GM % 5.0% 5.0% 5.2% 5.2% 5.4% 5.4% 5.4% 5.2% 5.3%
Opex/sales % 2.7% 2.4% 2.8% 3.0% 2.6% 2.1% 2.6% 2.4% 2.4%
OPM % 2.3% 2.6% 2.4% 2.2% 2.8% 3.3% 2.8% 2.8% 2.9%
2018E iPhone shipments
$2.74 49,976 52,476 54,976 59,976 64,976
2018E 1.1% -32% -28% -24% -17% -10%
iPhone 1.6% -21% -16% -12% -4% 4%
OpM % 2.1% -9% -5% 0% 9% 19%
3.1% 13% 19% 24% 36% 48%
4.1% 35% 42% 49% 63% 77%

23 May 2017
iPhone and its supply chain 51
Companies Mentioned (Price as of 22-May-2017) AAC Technologies Holdings Inc (2018.HK, HK$82.6) Advanced Semicon. Engr. (2311.TW, NT$37.6) Alps Electric (6770.T, ¥3,220) Analog Devices Inc. (ADI.OQ, $82.09) Apple Inc (AAPL.OQ, $153.99, OUTPERFORM, TP $170.0) Biel Crystal (Unlisted) Broadcom Ltd (AVGO.OQ, $238.38) Catcher Technology (2474.TW, NT$317.5) Chipbond (6147.TWO, NT$43.95) Cirrus Logic (CRUS.OQ, $65.07) Cowell (1415.HK, HK$2.26) Daishinku (6962.T, ¥1,547) Delta Electronics (2308.TW, NT$167.0) Dialog Semiconductor (DLGS.DE, €42.82) F-GIS (6456.TW, NT$219.0) Foster Electric (6794.T, ¥1,737) Foxconn Technology Corp (2354.TW, NT$87.0) GSEO (3406.TW, NT$310.0) GoerTek Inc. (002241.SZ, Rmb17.54) Himax Technologies, Inc. (HIMX.OQ, $6.93) Hirose Electric (6806.T, ¥14,660) Hon Hai Precision (2317.TW, NT$102.5, OUTPERFORM, TP NT$105.0) IBIDEN (4062.T, ¥1,964) Imagination Technologies (IMG.L, 101.25p) Intel Corp. (INTC.OQ, $35.77) Japan Aviation Electronics Industry (6807.T, ¥1,483) Japan Display (6740.T, ¥206) Jiangsu Changjiang Electronics Technology Co., Ltd (600584.SS, Rmb16.43) Kinsus Interconnect Tech (3189.TW, NT$79.3) Kyocera (6971.T, ¥6,493) LG Display Co Ltd. (034220.KS, W29,250) LG Innotek (011070.KS, W128,000) Largan Precision (3008.TW, NT$4900.0, OUTPERFORM, TP NT$5200.0) Lens Technology Co., Ltd (300433.SZ, Rmb34.24, OUTPERFORM[V], TP Rmb42.4) Luxshare Precision Industry Co., Ltd (002475.SZ, Rmb29.14) Maxim Integrated Products (MXIM.OQ, $46.69) Merry Electronics Co. Ltd (2439.TW, NT$188.0) Micron Technology Inc. (MU.OQ, $28.06, OUTPERFORM[V], TP $40.0) Murata Manufacturing (6981.T, ¥15,810, OUTPERFORM[V], TP ¥18,200) NGK Spark Plug (5334.T, ¥2,308) Nan Ya Printed Circuit Board (8046.TW, NT$25.15) Nihon Dempa (6779.T, ¥889) Nissha Printing (7915.T, ¥2,971) Nitto Denko (6988.T, ¥8,980) ON Semiconductor Corp. (ON.OQ, $15.57) Pegatron (4938.TW, NT$92.8) QUALCOMM Inc. (QCOM.OQ, $59.28) Qorvo (QRVO.OQ, $78.07) ROHM (6963.T, ¥8,560) Radiant Opto-Electronics (6176.TW, NT$64.2) STMicroelectronics NV (STM.PA, €14.36) Samsung Electronics (005930.KS, W2,255,000, OUTPERFORM, TP W2,900,000) Samsung SDI (006400.KS, W156,500) Seiko Epson (6724.T, ¥2,320) Sharp (6753.T, ¥420) Shenzhen O-film Tech Co., Ltd (002456.SZ, Rmb38.35) Skyworks Solutns (SWKS.OQ, $104.96) Sony (6758.T, ¥3,943, OUTPERFORM, TP ¥4,300) Sumitomo Chemical (4005.T, ¥614) TDK (6762.T, ¥6,870) TPK Holdings (3673.TW, NT$102.5) TXC Corp. (3042.TW, NT$43.05) Taiwan Semiconductor Manufacturing (2330.TW, NT$205.0) Taiyo Yuden (6976.T, ¥1,544) Texas Instruments Inc. (TXN.OQ, $80.37) Tongda Group Holdings Ltd (0698.HK, HK$2.63) Toshiba (6502.T, ¥230) Unimicron Technology Corp (3037.TW, NT$17.45) Win Semiconductors Corp (3105.TWO, NT$127.5) Wistron (3231.TW, NT$27.3) ams AG (AMS.S, SFr63.2, OUTPERFORM[V], TP SFr72.0)
Disclosure Appendix
Analyst Certification Randy Abrams, CFA, Pauline Chen, Kulbinder Garcha, Keon Han, Akinori Kanemoto, Sang Uk Kim, Sam Li, Hideyuki Maekawa, Mika Nishimura, John W. Pitzer, Achal Sultania, Jerry Su, Kyna Wong and Thompson Wu each certify, with respect to the companies or securities that the individual analyzes, that (1) the views expressed in this report accurately reflect his or her personal views about all of the subject companies and securities and (2) no part of his or her compensation was, is or will be directly or indirectly related to the specific recommendations or views expressed in this report.

23 May 2017
iPhone and its supply chain 52
3-Year Price and Rating History for Apple Inc (AAPL.OQ)
AAPL.OQ Closing Price Target Price
Date (US$) (US$) Rating
03-Jun-14 91.08 85.71 N
24-Jun-14 90.28 96.00
14-Oct-14 98.75 110.00
13-Jan-15 110.22 130.00 O
05-Feb-15 119.94 140.00
26-Mar-15 124.24 145.00
28-Oct-15 119.27 140.00
04-Apr-16 111.12 150.00
10-Mar-17 139.14 160.00
18-Apr-17 141.20 170.00
* Asterisk signifies initiation or assumption of coverage.
N EU T RA L
O U T PERFO RM
3-Year Price and Rating History for Hon Hai Precision (2317.TW)
2317.TW Closing Price Target Price
Date (NT$) (NT$) Rating
17-Jul-14 82.33 109.09 O
14-Nov-14 83.81 108.22
31-Mar-15 79.31 106.49
18-May-15 83.81 115.45
04-Sep-15 75.45 R
17-Nov-15 77.27 98.18 O
27-Jan-16 68.45 93.64
31-Mar-16 77.09 90.91
28-Apr-16 71.45 87.27
08-Aug-16 81.82 90.91
14-Aug-16 78.36 100.00
03-Apr-17 91.00 105.00
* Asterisk signifies initiation or assumption of coverage.
O U T PERFO RM
REST RICT ED
3-Year Price and Rating History for LG Display Co Ltd. (034220.KS)
034220.KS Closing Price Target Price
Date (W) (W) Rating
23-Jul-14 32,700 26,000 N
15-Oct-14 32,250 26,000 U
04-Dec-14 34,500 27,000
28-Jan-15 36,050 29,000
18-Jun-15 26,450 27,000 N
23-Jul-15 22,950 26,000
31-Aug-15 23,050 25,800
22-Oct-15 23,550 25,600
06-Jan-16 23,100 25,300
27-Jan-16 22,800 24,000
17-May-16 24,400 23,700
27-Jul-16 30,450 25,800
24-Jan-17 31,750 27,000
26-Apr-17 31,400 30,600
* Asterisk signifies initiation or assumption of coverage.
N EU T RA L
U N D ERPERFO RM

23 May 2017
iPhone and its supply chain 53
3-Year Price and Rating History for LG Innotek (011070.KS)
011070.KS Closing Price Target Price
Date (W) (W) Rating
27-Jun-14 143,000 NR
04-Nov-16 77,300 105,000 O *
06-Jan-17 90,800 110,000
24-Jan-17 91,700 120,000
22-Feb-17 120,000 135,000
14-Apr-17 132,500 165,000
* Asterisk signifies initiation or assumption of coverage.
N O T RA T ED
O U T PERFO RM
3-Year Price and Rating History for Largan Precision (3008.TW)
3008.TW Closing Price Target Price
Date (NT$) (NT$) Rating
04-Jun-14 1980.00 2310.00 O
07-Jul-14 2425.00 2800.00
07-Apr-15 2755.00 2940.00
16-Apr-15 2785.00 3280.00
10-Jun-15 3270.00 3750.00
08-Jul-15 3280.00 3760.00
16-Jul-15 3520.00 4000.00
13-Oct-15 2630.00 3600.00
10-Nov-15 2590.00 2800.00 N
14-Jan-16 1855.00 2130.00
14-Apr-16 2375.00 2650.00
01-Jun-16 2830.00 3200.00 O
05-Jul-16 2950.00 3400.00
14-Jul-16 3120.00 3700.00
05-Aug-16 3635.00 4100.00
12-Jan-17 4240.00 4800.00
13-Apr-17 4410.00 5200.00
* Asterisk signifies initiation or assumption of coverage.
O U T PERFO RM
N EU T RA L
3-Year Price and Rating History for Lens Technology Co., Ltd (300433.SZ)
300433.SZ Closing Price Target Price
Date (Rmb) (Rmb) Rating
10-Sep-15 52.15 49.17 N *
26-Oct-15 66.37 49.25
18-Jan-16 53.73 51.33
01-Feb-16 54.33 56.33
18-Apr-16 58.25 55.58
25-Apr-16 61.11 57.42
28-Apr-16 60.67 21.30
19-Jul-16 25.76 24.00
07-Nov-16 27.48 33.20 O
01-Feb-17 25.68 32.10
10-Apr-17 32.56 40.60
03-May-17 36.08 42.40
* Asterisk signifies initiation or assumption of coverage.
N EU T RA L
O U T PERFO RM

23 May 2017
iPhone and its supply chain 54
3-Year Price and Rating History for Micron Technology Inc. (MU.OQ)
MU.OQ Closing Price Target Price
Date (US$) (US$) Rating
10-Jun-14 29.51 50.00 O
26-Jun-15 19.66 34.00
02-Oct-15 15.91 25.00
23-Dec-15 14.30 20.00
15-Dec-16 20.29 25.00
21-Dec-16 20.58 30.00
21-Mar-17 25.52 35.00
23-Mar-17 26.47 40.00
* Asterisk signifies initiation or assumption of coverage.
O U T PERFO RM
3-Year Price and Rating History for Murata Manufacturing (6981.T)
6981.T Closing Price Target Price
Date (¥) (¥) Rating
01-Sep-14 10,125 12,000 O
17-Oct-14 11,220 13,000
12-Dec-14 12,955 17,000
14-Apr-15 17,215 20,500
17-Jun-15 19,925 22,000
12-Jan-16 14,755 23,500
22-Feb-16 13,435 20,900
24-Jun-16 11,180 16,500
23-Sep-16 13,200 16,000
20-Jan-17 15,095 19,500
13-Apr-17 14,370 18,200
* Asterisk signifies initiation or assumption of coverage.
O U T PERFO RM
3-Year Price and Rating History for Samsung Electronics (005930.KS)
005930.KS Closing Price Target Price
Date (W) (W) Rating
07-Jul-14 1,292,000 1,740,000 O
08-Jul-14 1,295,000 1,720,000
28-Aug-14 1,242,000 1,700,000
07-Oct-14 1,162,000 1,680,000
03-Sep-15 1,122,000 1,630,000
29-Oct-15 1,325,000 1,785,000
11-Jan-16 1,152,000 1,690,000
28-Jan-16 1,145,000 1,550,000
01-Jun-16 1,333,000 1,702,000
28-Jul-16 1,507,000 1,790,000
15-Dec-16 1,759,000 2,400,000
24-Jan-17 1,908,000 2,650,000
09-Mar-17 2,010,000 2,900,000
* Asterisk signifies initiation or assumption of coverage.
O U T PERFO RM

23 May 2017
iPhone and its supply chain 55
3-Year Price and Rating History for Samsung SDI (006400.KS)
006400.KS Closing Price Target Price
Date (W) (W) Rating
20-Mar-15 142,500 142,000 N
28-Apr-15 126,000 132,000
30-Jul-15 94,600 105,000
31-Aug-15 84,500 88,000
02-Nov-15 111,000 91,000
26-Jan-17 116,000 99,000
27-Apr-17 136,000 115,000
* Asterisk signifies initiation or assumption of coverage.
N EU T RA L
3-Year Price and Rating History for Sony (6758.T)
6758.T Closing Price Target Price
Date (¥) (¥) Rating
22-May-14 1,645 2,600 O
02-Feb-15 2,698 3,300
27-Feb-15 3,414 NR
03-Sep-15 3,026 4,200 O *
12-Jan-16 2,675 3,500
03-Mar-16 2,520 3,300
31-May-16 3,100 3,800
15-Dec-16 3,373 3,900
10-Mar-17 3,661 4,300
* Asterisk signifies initiation or assumption of coverage.
O U T PERFO RM
N O T RA T ED
3-Year Price and Rating History for ams AG (AMS.S)
AMS.S Closing Price Target Price
Date (SFr) (SFr) Rating
16-Jan-17 31.50 44.00 O *
09-Feb-17 44.30 50.00
09-May-17 64.25 72.00
* Asterisk signifies initiation or assumption of coverage.
O U T PERFO RM
The analyst(s) responsible for preparing this research report received Compensation that is based upon various factors including Credit Suisse's total revenues, a portion of which are generated by Credit Suisse's investment banking activities
As of December 10, 2012 Analysts’ stock rating are defined as follows: Outperform (O) : The stock’s total return is expected to outperform the relevant benchmark* over the next 12 months. Neutral (N) : The stock’s total return is expected to be in line with the relevant benchmark* over the next 12 months. Underperform (U) : The stock’s total return is expected to underperform the relevant benchmark* over the next 12 months. *Relevant benchmark by region: As of 10th December 2012, Japanese ratings are based on a stock’s total return relative to the analyst's coverage universe which consists of all companies covered by the analyst within the relevant sector, with Outperforms representing the most attractiv e, Neutrals the less attractive, and Underperforms the least attractive investment opportunities. As of 2nd October 2012, U.S. and Canadian as well as European ratings are based on a stock’s total return relative to the analyst's coverage universe which consists of all companies covered by the analyst within the relevant sector, with Outperforms representing the most attractive, Neutrals the less attractive, and Underperforms the least attractive investment opportunities. For Latin Ame rican and non-Japan Asia stocks, ratings are based on a stock’s total return relative to the average total return of the relevant country or regional benchmark; prior to 2nd October 2012 U.S. and Canadian ratings were based on (1) a stock’s absolute total return potential to its current share price and (2) the relative attractiv eness of a stock’s total return potential within an analyst’s coverage universe. For Australian and New Zealand stocks, the expected total return (ETR) calculation includes 1 2-month rolling dividend yield. An Outperform rating is assigned where an ETR is greater than or equal to 7.5%; Underperform where an ETR less than or equal to 5%. A Neutral may be assigned where the ETR is between -5% and 15%. The overlapping rating range allows analysts to assign a rating that puts ETR in the context of associated risks. Prior to 18

23 May 2017
iPhone and its supply chain 56
May 2015, ETR ranges for Outperform and Underperform ratings did not overlap with Neutral thresholds between 15% and 7.5%, which wa s in operation from 7 July 2011. Restricted (R) : In certain circumstances, Credit Suisse policy and/or applicable law and regulations preclude certain types of communications, including an investment recommendation, during the course of Credit Suisse's engagement in an investment banking transaction and in certain other circumstances. Not Rated (NR) : Credit Suisse Equity Research does not have an investment rating or view on the stock or any other securities related to the company at this time. Not Covered (NC) : Credit Suisse Equity Research does not provide ongoing coverage of the company or offer an investment rating or investment view on the equity security of the company or related products.
Volatility Indicator [V] : A stock is defined as volatile if the stock price has moved up or down by 20% or more in a month in at least 8 of the past 24 months or the analyst expects significant volatility going forward.
Analysts’ sector weightings are distinct from analysts’ stock ratings and are based on the analyst’s expectations for the fundamentals and/or valuation of the sector* relative to the group’s historic fundamentals and/or valuation: Overweight : The analyst’s expectation for the sector’s fundamentals and/or valuation is favorable over the next 12 months. Market Weight : The analyst’s expectation for the sector’s fundamentals and/or valuation is neutral over the next 12 months. Underweight : The analyst’s expectation for the sector’s fundamentals and/or valuation is cautious over the next 12 months. *An analyst’s coverage sector consists of all companies covered by the analyst within the relevant sector. An analyst may cover multiple sectors.
Credit Suisse's distribution of stock ratings (and banking clients) is:
Global Ratings Distribution
Rating Versus universe (%) Of which banking clients (%) Outperform/Buy* 44% (64% banking clients) Neutral/Hold* 39% (61% banking clients) Underperform/Sell* 14% (55% banking clients) Restricted 2% *For purposes of the NYSE and FINRA ratings distribution disclosure requirements, our stock ratings of Outperform, Neutral, a nd Underperform most closely correspond to Buy, Hold, and Sell, respectively; however, the meanings are not the same, as our stock ratings are determined on a relative basis. (Please refer to definitions above.) An investor's decision to buy or sell a security should be based on investment objectives, current holdin gs, and other individual factors.
Important Global Disclosures Credit Suisse’s research reports are made available to clients through our proprietary research portal on CS PLUS. Credit Suisse research products may also be made available through third-party vendors or alternate electronic means as a convenience. Certain research products are only made available through CS PLUS. The services provided by Credit Suisse’s analysts to clients may depend on a specific client’s preferences regarding the frequency and manner of receiving communications, the client’s risk profile and investment, the size and scope of the overall client relationship with the Firm, as well as legal and regulatory constraints. To access all of Credit Suisse’s research that you are entitled to receive in the most timely manner, please contact your sales representative or go to https://plus.credit-suisse.com . Credit Suisse’s policy is to update research reports as it deems appropriate, based on developments with the subject company, the sector or the market that may have a material impact on the research views or opinions stated herein. Credit Suisse's policy is only to publish investment research that is impartial, independent, clear, fair and not misleading. For more detail please refer to Credit Suisse's Policies for Managing Conflicts of Interest in connection with Investment Research: https://www.credit-suisse.com/sites/disclaimers-ib/en/managing-conflicts.html . Credit Suisse does not provide any tax advice. Any statement herein regarding any US federal tax is not intended or written to be used, and cannot be used, by any taxpayer for the purposes of avoiding any penalties. This material is intended for your use only and not for general distribution. This material is not intended to promote or procure a particular outcome in the UK General Election (the "Election"). Credit Suisse does not promote or endorse any party in the Election. This material does not constitute, and should not be interpreted as, a recommendation by Credit Suisse as to the merits of a particular outcome of the Election.
Target Price and Rating Valuation Methodology and Risks: (12 months) for Apple Inc (AAPL.OQ)
Method: We derive our target price of $170 for AAPL based on our LT Services DCF given our view around Apple's high retention rate, complete eco-system and a growing installed base. As such, we maintain our Outperform rating for AAPL.
Risk: Risks to our TP of $170 and Outperform rating for AAPL are i) slowing smartphone market in unit terms. ii) competitive pressures from other handset manufacturers who are relying on Android operating system, iii) failure to launch innovative products and iv) failure to maintain key media distribution for iTunes and v) regulatory risk. We beleive all or any of these potential events may impact our TP and/or rating.
Target Price and Rating Valuation Methodology and Risks: (12 months) for Hon Hai Precision (2317.TW)
Method: Our OUTPERFORM rating and NT$105 TP for Hon Hai Precison is because: we expect operating margin improvement and cash flow generation to exceed market expectations. We believe enterprise and hyper-scale data-center business boosts margins; Apple EMS diversification improves working capital and cash flow. We believe Hon Hai is one of the Taiwan ODM/EMS with a growth story beyond Apple. We also increased cash returns, which the market is ignoring. Our TP is based on 11x 2017E EPS.

23 May 2017
iPhone and its supply chain 57
Risk: Risks to our OUTPERFORM rating and NT$105 TP for Hon Hai Precision include: (1) the impact from rising China labour costs coming in larger than expected; (2) the potential of key clients cutting orders due to labour events, or the potential and orders are stronger than expected due to PC product cycles and devices, including tablets and smartphones; and (3) change in Hon Hai's relationship with Apple, its largest customer in revenue contribution terms.
Target Price and Rating Valuation Methodology and Risks: (12 months) for Largan Precision (3008.TW)
Method: Our target price of NT$5,200 for Largan Precision is based on weighted average of case scenario, which puts the stock at 18x FY18 EPS. We think the worst might be behind us, and would position the stock for rising adoption rate of dual camera. Our OUTPERFORM rating on Largan is based on the rationale that the rising penetration rate of dual camera will become a new growth driver for the company, as it increases the total addressable market in smartphone, and helps Largan to secure its dominant market share in handset lens.
Risk: Risks that could impede achievement of our NT$5,200 target price for Largan Precision include: (1) weaker-than-expected demand for iPhone 7, (2) slower-than-expected adoption of dual camera, (3) Sunny Optical ramping up faster than expected, (4) if mid-to-low end customers does not acquire both camera for their dual camera from Largan, and (5) unexpected NTD appreciation (against USD). Risks to our OUTPERFORM rating may include: (1) weaker/better tech demand, (2) greater volatility in FX, and (3) change in the competitive landscape.
Target Price and Rating Valuation Methodology and Risks: (12 months) for Lens Technology Co., Ltd (300433.SZ)
Method: Our Rmb42.4 target price for Lens Technology Co., Ltd is based on historical average P/E (price-to-earnings) of 27x. Our OUTPERFORM rating is based on the up-cycle for glass industry and Lens' leading position.
Risk: Risks to our OUTPERFORM rating and Rmb42.4 target price for Lens Technology Co., Ltd include: Client concentration risks on Apple and Samsung, slower than expected upgrade progress, product design changes, pricing pressure, and FX risk.
Target Price and Rating Valuation Methodology and Risks: (12 months) for Micron Technology Inc. (MU.OQ)
Method: We are using P/E ratio for our target price. Our target price of $40 would represent ~8x NTM EPS. We rate the shares as Outperform as we believe that MU is near trough valuations and see fundamentals improving from here – specifically (1) we expect pricing to start
stabilizing and drive margin improvement for MU, (2) structurally, Memory is a different industry now – higher concentration than ever (HHI
3,300 now versus only 1,900 in 2007), more diversified demand, and slowing supply – we argue margins are more resilient now than in
the past, and expect a re-rating as investors realize normalized earnings of >$2 per year, and (3) we continue to argue that its strategic value continues to be under-appreciated, particularly given China's interest is memory.
Risk: Major risks for MU's achievement of our $40 target price and our Outperform rating are: (1) pricing pressure in the DRAM and NAND markets; (2) execution issues in NAND flash during 3D transition; and (3) execution issues in converting to 20nm DRAM. Major risks for our outperform rating are (i) DRAM market could continue to weaken, (ii) the Company could continue to have execution issues in DRAM, and (iii) New entrants from China could enter the market.
Target Price and Rating Valuation Methodology and Risks: (12 months) for Murata Manufacturing (6981.T)
Method: We base our ¥18,200 target price for Murata Manufacturing on a zero-growth ROC model and our FY3/18 estimates (EV/IC=ROC/WACC). We assume RP of 6.65%, RFR of 0.1%, ROC of 13.1%, and beta of 1.0. We take a positive view of Murata's high growth potential, particularly in high margin MLCCs and RF devices, as well as its prospects in Automotive MLCCs. We rate the stock OUTPERFORM based on Murata's 12-month estimated total returns and that for our coverage universe.
Risk: Downside risks to our ¥18,200 target price and OUTPERFORM rating for Murata Manufacturing include inventory adjustment in North American and high-end Chinese smartphones, a drop in the value per handset for leading smartphones, and increased losses at the battery business (not yet included in our earnings forecasts).
Target Price and Rating Valuation Methodology and Risks: (12 months) for Samsung Electronics (005930.KS)
Method: Our 12-month target price of W2,900,000 for Samsung Electronics is based on a split-up value into Opco/Holdco. We attribute a target P/E of 10x to Opco’s 2017 earnings while applying a discount of 30% to Holdco’s NAV. The dividend yield should rise for the next few
years, driving P/E multiple expansion as Samsung’ s yield approaches the global tech average of about 2.5%. We assign an
OUTPERFORM rating given our confidence on higher earnings and dividends led by faster 3D NAND/OLED penetration, strong DRAM profitability, smartphone recovery post the GN7 crisis and a more proactive shareholder return policy and value creation from the demerger.
Risk: Risks that may impede the achievement of our 12-month target price of W2,900,000 and our OUTPERFORM rating for Samsung Electronics include: (1) the demerger process not starting in 2017, (2) heavy earnings dependence on the strength of its smartphone

23 May 2017
iPhone and its supply chain 58
products and its margin sustainability given intensifying competition, (3) an earlier China entrance into 3D NAND, and (4) mis-execution in W10 tn in OLED investment for a once core additional customer.
Target Price and Rating Valuation Methodology and Risks: (12 months) for Sony (6758.T)
Method: We derive our ¥4,300 target price for Sony using an SOTP-based FY3/18E P/E. Our target multiples for each business are peer averages (G&NS:21x, IP&S:21x, HE&S:12x, Device: 18x, Picture/Music:20x, Others:10x) as of Dec. 2016 . We apply our consolidated FY3/18 EPS forecast of of ¥221.0(on diluted basis) and a P/E of about 19x. We increase the multiple slightly due to higher profit contribution by the game & network services segment. Our OUTPERFORM rating is based on a comparison of the company's 12-month potential total return versus our coverage universe.
Risk: Risks to our ¥4,300 target price and OUTPERFORM rating for Sony are (1) depreciation in the euro and emerging market currencies versus the dollar, (2) increased competition in CIS and/or a sudden drop in sales at major CIS customers.
Target Price and Rating Valuation Methodology and Risks: (12 months) for ams AG (AMS.S)
Method: Our 12-month target price for ams of SFr72 is based on two equally-weighted valuation methodologies, a P/E target multiple approach (15x our adj. EPS forecast for 2019E) and a three-stage DCF (WACC: 8.5%, LT growth 1.5%, LT EBIT margin 30.0%). Our TP implies significant upside to the current share price. Thus, we rate the stock Outperfrom.
Risk: Key risks to our Outperform rating and SFr72 target price include (1) the company failing to win new content going into the next iPhone, (2) delays in large projects, (3) lack of innovation, (4) a marked downturn in the semiconductor industry and (5) FX risks.
Please refer to the firm's disclosure website at https://rave.credit-suisse.com/disclosures/view/selectArchive for the definitions of abbreviations typically used in the target price method and risk sections.
See the Companies Mentioned section for full company names The subject company (005930.KS, 2317.TW, AAPL.OQ, MU.OQ, 6758.T, 2330.TW, STM.PA, 6753.T, QCOM.OQ, 6762.T, HIMX.OQ, ON.OQ, 6807.T, 3037.TW, 2311.TW, 006400.KS, ADI.OQ, 4938.TW, 3105.TWO, 3231.TW, 3673.TW, INTC.OQ, 6502.T, 011070.KS, 6740.T, 034220.KS, AVGO.OQ, MXIM.OQ) currently is, or was during the 12-month period preceding the date of distribution of this report, a client of Credit Suisse. Credit Suisse provided investment banking services to the subject company (005930.KS, 2317.TW, AAPL.OQ, MU.OQ, QCOM.OQ, 2311.TW, 006400.KS, ADI.OQ, INTC.OQ, 011070.KS, 034220.KS, AVGO.OQ) within the past 12 months. Credit Suisse provided non-investment banking services to the subject company (005930.KS, AAPL.OQ, 6758.T, QCOM.OQ, 006400.KS, ADI.OQ, 3673.TW, INTC.OQ, 034220.KS, AVGO.OQ) within the past 12 months Credit Suisse has managed or co-managed a public offering of securities for the subject company (ADI.OQ, AVGO.OQ) within the past 12 months. Credit Suisse has received investment banking related compensation from the subject company (005930.KS, 2317.TW, AAPL.OQ, MU.OQ, QCOM.OQ, 2311.TW, 006400.KS, ADI.OQ, INTC.OQ, 011070.KS, 034220.KS, AVGO.OQ) within the past 12 months Credit Suisse expects to receive or intends to seek investment banking related compensation from the subject company (005930.KS, 2317.TW, AAPL.OQ, 3008.TW, MU.OQ, 6981.T, 6758.T, 2330.TW, STM.PA, 2308.TW, 6753.T, QCOM.OQ, 6762.T, HIMX.OQ, 2474.TW, ON.OQ, 6807.T, 3037.TW, 2311.TW, 006400.KS, ADI.OQ, 4938.TW, 6963.T, TXN.OQ, 2018.HK, 3105.TWO, 3231.TW, 3673.TW, INTC.OQ, 6502.T, 6971.T, 011070.KS, 6740.T, 8046.TW, 034220.KS, AVGO.OQ, MXIM.OQ) within the next 3 months. Credit Suisse has received compensation for products and services other than investment banking services from the subject company (005930.KS, AAPL.OQ, 6758.T, QCOM.OQ, 006400.KS, ADI.OQ, 3673.TW, INTC.OQ, 034220.KS, AVGO.OQ) within the past 12 months As of the date of this report, Credit Suisse makes a market in the following subject companies (AAPL.OQ, 2018.HK). A member of the Credit Suisse Group is party to an agreement with, or may have provided services set out in sections A and B of Annex I of Directive 2014/65/EU of the European Parliament and Council ("MiFID Services") to, the subject issuer (005930.KS, 2317.TW, 3008.TW, 300433.SZ, 6981.T, 2439.TW, 2330.TW, STM.PA, 2308.TW, 600584.SS, 3189.TW, QCOM.OQ, 3042.TW, 6762.T, HIMX.OQ, 2474.TW, 5334.T, ON.OQ, 6807.T, 3037.TW, 2311.TW, 006400.KS, 002241.SZ, ADI.OQ, 4938.TW, 6176.TW, TXN.OQ, 3105.TWO, 3231.TW, 6806.T, 7915.T, 3673.TW, 6770.T, 6976.T, 6147.TWO, INTC.OQ, 0698.HK, 2354.TW, 6971.T, 011070.KS, 6740.T, 8046.TW, 034220.KS, 4062.T, 002456.SZ, AVGO.OQ, MXIM.OQ) within the past 12 months. As of the end of the preceding month, Credit Suisse beneficially own 1% or more of a class of common equity securities of (2317.TW, 3008.TW, 2439.TW, 2330.TW, STM.PA, 2308.TW, 6762.T, 2474.TW, 2311.TW, 4938.TW, 6176.TW, 3231.TW, DLGS.DE, 3673.TW, 6147.TWO, 2354.TW). As of the end of the preceding month, Credit Suisse beneficially own between 1-3% of a class of common equity securities of (AMS.S). Credit Suisse beneficially holds >0.5% long position of the total issued share capital of the subject company (005930.KS, 6762.T, 006400.KS, 011070.KS, 034220.KS). Credit Suisse has a material conflict of interest with the subject company (QCOM.OQ) . Credit Suisse is Financial Advisor to NXP Semiconductors (NXPI.OQ) on their sale to Qualcomm Incorporated (QCOM.OQ). Credit Suisse has a material conflict of interest with the subject company (2311.TW) . Credit Suisse is acting as a financial advisor to Advanced Semiconductor Engineering, Inc. in relation to the proposed merger with Siliconware Precision Industries Co. Ltd. Credit Suisse has a material conflict of interest with the subject company (AVGO.OQ) . Credit Suisse is Financial Advisor to Broadcom Limited (AVGO.OQ) on their acquisition of Brocade Communications Systems, Inc. (BRCD.OQ).

23 May 2017
iPhone and its supply chain 59
For other important disclosures concerning companies featured in this report, including price charts, please visit the website at https://rave.credit-suisse.com/disclosures or call +1 (877) 291-2683. For date and time of production, dissemination and history of recommendation for the subject company(ies) featured in this report, disseminated within the past 12 months, please refer to the link: https://rave.credit-suisse.com/disclosures/view/report?i=302132&v=7569srsjskb4hhp2vcsey5aou .
Important Regional Disclosures Singapore recipients should contact Credit Suisse AG, Singapore Branch for any matters arising from this research report. The analyst(s) involved in the preparation of this report may participate in events hosted by the subject company, including site visits. Credit Suisse does not accept or permit analysts to accept payment or reimbursement for travel expenses associated with these events. Restrictions on certain Canadian securities are indicated by the following abbreviations: NVS--Non-Voting shares; RVS--Restricted Voting Shares; SVS--Subordinate Voting Shares. Individuals receiving this report from a Canadian investment dealer that is not affiliated with Credit Suisse should be advised that this report may not contain regulatory disclosures the non-affiliated Canadian investment dealer would be required to make if this were its own report. For Credit Suisse Securities (Canada), Inc.'s policies and procedures regarding the dissemination of equity research, please visit https://www.credit-suisse.com/sites/disclaimers-ib/en/canada-research-policy.html. The following disclosed European company/ies have estimates that comply with IFRS: (6806.T). Credit Suisse has acted as lead manager or syndicate member in a public offering of securities for the subject company (AAPL.OQ, MU.OQ, 2311.TW, ADI.OQ, IMG.L, AVGO.OQ) within the past 3 years. Principal is not guaranteed in the case of equities because equity prices are variable. Commission is the commission rate or the amount agreed with a customer when setting up an account or at any time after that. Taiwanese Disclosures: This research report is for reference only. Recipients should carefully consider their own investment risk and note they may be subject to the applicable rules and regulations in Taiwan, including the requirements under the Taiwan Stock Exchange Operational Regulations Governing Securities Firms Recommending Trades in Securities to Customers ("Taiwan Recommendation Rules") on conflicts of interest. Investment results are the responsibility of the individual investor. Reports written by Taiwan based analysts on non-Taiwan listed companies are not considered recommendations to buy or sell securities under Taiwan Recommendation Rules. Reports may not be reproduced without the permission of Credit Suisse. This research report is authored by: Credit Suisse Securities (Japan) Limited ........................................................................ Akinori Kanemoto ; Hideyuki Maekawa ; Mika Nishimura Credit Suisse (Hong Kong) Limited ................................................................................................................ Sam Li ; Manish Nigam ; Kyna Wong Credit Suisse Securities (USA) LLC ................................................................................................................... Kulbinder Garcha ; John W. Pitzer Credit Suisse Securities (Europe) Limited, Seoul Branch .............................................................................................. Keon Han ; Sang Uk Kim Credit Suisse International .................................................................................................................................................................. Achal Sultania Credit Suisse AG, Taipei Securities Branch ........................................................ Randy Abrams, CFA ; Pauline Chen ; Jerry Su ; Thompson Wu To the extent this is a report authored in whole or in part by a non-U.S. analyst and is made available in the U.S., the following are important disclosures regarding any non-U.S. analyst contributors: The non-U.S. research analysts listed below (if any) are not registered/qualified as research analysts with FINRA. The non-U.S. research analysts listed below may not be associated persons of CSSU and therefore may not be subject to the FINRA 2241 and NYSE Rule 472 restrictions on communications with a subject company, public appearances and trading securities held by a research analyst account. Credit Suisse Securities (Japan) Limited ........................................................................ Akinori Kanemoto ; Hideyuki Maekawa ; Mika Nishimura Credit Suisse (Hong Kong) Limited ................................................................................................................ Sam Li ; Manish Nigam ; Kyna Wong Credit Suisse Securities (Europe) Limited, Seoul Branch .............................................................................................. Keon Han ; Sang Uk Kim Credit Suisse International .................................................................................................................................................................. Achal Sultania Credit Suisse AG, Taipei Securities Branch ........................................................ Randy Abrams, CFA ; Pauline Chen ; Jerry Su ; Thompson Wu
Important disclosures regarding companies or other issuers that are the subject of this report are available on Credit Suisse’s disclosure website at https://rave.credit-suisse.com/disclosures or by calling +1 (877) 291-2683.

23 May 2017
iPhone and its supply chain 60
This report is produced by subsidiaries and affiliates of Credit Suisse operating under its Global Markets Division. For more information on our structure, please use the following link: https://www.credit-suisse.com/who-we-are This report may contain material that is not directed to, or intended for distribution to or use by, any person or entity who is a citizen or resident of or located in any locality, state, country or other jurisdiction where such distribution, publication, availability or use would be contrary to law or regulation or which would subject Credit Suisse or its affiliates ("CS") to any registration or licensing requirement within such jurisdiction. All material presented in this report, unless specifically indicated otherwise, is under copyright to CS. None of the material, nor its content, nor any copy of it, may be altered in any way, transmitted to, copied or distributed to any other party, without the prior express written permission of CS. All trademarks, service marks and logos used in this report are trademarks or service marks or registered trademarks or service marks of CS or its affiliates.The information, tools and material presented in this report are provided to you for information purposes only and are not to be used or considered as an offer or the solicitation of an offer to sell or to buy or subscribe for securities or other financial instruments. CS may not have taken any steps to ensure that the securities referred to in this report are suitable for any particular investor. CS will not treat recipients of this report as its customers by virtue of their receiving this report. The investments and services contained or referred to in this report may not be suitable for you and it is recommended that you consult an independent investment advisor if you are in doubt about such investments or investment services. Nothing in this report constitutes investment, legal, accounting or tax advice, or a representation that any investment or strategy is suitable or appropriate to your individual circumstances, or otherwise constitutes a personal recommendation to you. CS does not advise on the tax consequences of investments and you are advised to contact an independent tax adviser. Please note in particular that the bases and levels of taxation may change. Information and opinions presented in this report have been obtained or derived from sources believed by CS to be reliable, but CS makes no representation as to their accuracy or completeness. CS accepts no liability for loss arising from the use of the material presented in this report, except that this exclusion of liability does not apply to the extent that such liability arises under specific statutes or regulations applicable to CS. This report is not to be relied upon in substitution for the exercise of independent judgment. CS may have issued, and may in the future issue, other communications that are inconsistent with, and reach different conclusions from, the information presented in this report. Those communications reflect the different assumptions, views and analytical methods of the analysts who prepared them and CS is under no obligation to ensure that such other communications are brought to the attention of any recipient of this report. Some investments referred to in this report will be offered solely by a single entity and in the case of some investments solely by CS, or an associate of CS or CS may be the only market maker in such investments. Past performance should not be taken as an indication or guarantee of future performance, and no representation or warranty, express or implied, is made regarding future performance. Information, opinions and estimates contained in this report reflect a judgment at its original date of publication by CS and are subject to change without notice. The price, value of and income from any of the securities or financial instruments mentioned in this report can fall as well as rise. The value of securities and financial instruments is subject to exchange rate fluctuation that may have a positive or adverse effect on the price or income of such securities or financial instruments. Investors in securities such as ADR's, the values of which are influenced by currency volatility, effectively assume this risk. Structured securities are complex instruments, typically involve a high degree of risk and are intended for sale only to sophisticated investors who are capable of understanding and assuming the risks involved. The market value of any structured security may be affected by changes in economic, financial and political factors (including, but not limited to, spot and forward interest and exchange rates), time to maturity, market conditions and volatility, and the credit quality of any issuer or reference issuer. Any investor interested in purchasing a structured product should conduct their own investigation and analysis of the product and consult with their own professional advisers as to the risks involved in making such a purchase. Some investments discussed in this report may have a high level of volatility. High volatility investments may experience sudden and large falls in their value causing losses when that investment is realised. Those losses may equal your original investment. Indeed, in the case of some investments the potential losses may exceed the amount of initial investment and, in such circumstances, you may be required to pay more money to support those losses. Income yields from investments may fluctuate and, in consequence, initial capital paid to make the investment may be used as part of that income yield. Some investments may not be readily realisable and it may be difficult to sell or realise those investments, similarly it may prove difficult for you to obtain reliable information about the value, or risks, to which such an investment is exposed. This report may provide the addresses of, or contain hyperlinks to, websites. Except to the extent to which the report refers to website material of CS, CS has not reviewed any such site and takes no responsibility for the content contained therein. Such address or hyperlink (including addresses or hyperlinks to CS's own website material) is provided solely for your convenience and information and the content of any such website does not in any way form part of this document. Accessing such website or following such link through this report or CS's website shall be at your own risk.
This report is issued and distributed in European Union (except Switzerland): by Credit Suisse Securities (Europe) Limited, One Cabot Square, London E14 4QJ, England, which is authorised by the Prudential Regulation Authority and regulated by the Financial Conduct Authority and the Prudential Regulation Authority. Germany: Credit Suisse Securities (Europe) Limited Niederlassung Frankfurt am Main regulated by the Bundesanstalt fuer Finanzdienstleistungsaufsicht ("BaFin"). United States and Canada: Credit Suisse Securities (USA) LLC; Switzerland: Credit Suisse AG; Brazil: Banco de Investimentos Credit Suisse (Brasil) S.A or its affiliates; Mexico: Banco Credit Suisse (México), S.A. (transactions related to the securities mentioned in this report will only be effected in compliance with applicable regulation); Japan: by Credit Suisse Securities (Japan) Limited, Financial Instruments Firm, Director-General of Kanto Local Finance Bureau ( Kinsho) No. 66, a member of Japan Securities Dealers Association, The Financial Futures Association of Japan, Japan Investment Advisers Association, Type II Financial Instruments Firms Association; Hong Kong: Credit Suisse (Hong Kong) Limited; Australia: Credit Suisse Equities (Australia) Limited; Thailand: Credit Suisse Securities (Thailand) Limited, regulated by the Office of the Securities and Exchange Commission, Thailand, having registered address at 990 Abdulrahim Place, 27th Floor, Unit 2701, Rama IV Road, Silom, Bangrak, Bangkok10500, Thailand, Tel. +66 2614 6000; Malaysia: Credit Suisse Securities (Malaysia) Sdn Bhd; Singapore: Credit Suisse AG, Singapore Branch; India: Credit Suisse Securities (India) Private Limited (CIN no.U67120MH1996PTC104392) regulated by the Securities and Exchange Board of India as Research Analyst (registration no. INH 000001030) and as Stock Broker (registration no. INB230970637; INF230970637; INB010970631; INF010970631), having registered address at 9th Floor, Ceejay House, Dr.A.B. Road, Worli, Mumbai - 18, India, T- +91-22 6777 3777; South Korea: Credit Suisse Securities (Europe) Limited,
Seoul Branch; Taiwan: Credit Suisse AG Taipei Securities Branch; Indonesia: PT Credit Suisse Securities Indonesia; Philippines:Credit Suisse Securities (Philippines ) Inc., and elsewhere in the world by the relevant authorised affiliate of the above. Additional Regional Disclaimers Hong Kong: Credit Suisse (Hong Kong) Limited ("CSHK") is licensed and regulated by the Securities and Futures Commission of Hong Kong under the laws of Hong Kong, which differ from Australian laws. CSHKL does not hold an Australian financial services licence (AFSL) and is exempt from the requirement to hold an AFSL under the Corporations Act 2001 (the Act) under Class Order 03/1103 published by the ASIC in respect of financial services provided to Australian wholesale clients (within the meaning of section 761G of the Act). Research on Taiwanese securities produced by Credit Suisse AG, Taipei Securities Branch has been prepared by a registered Senior Business Person. Australia (to the extent services are offered in Australia): Credit Suisse Securities (Europe) Limited (“CSSEL”) and Credit Suisse International (“CSI”) are authorised by the Prudential Regulation Authority and regulated by the Financial Conduct Authority (“FCA”) and the Prudential Regulation Authority under UK laws, which differ from Australian Laws. CSSEL and CSI do not hold an Australian Financial Services Licence (“AFSL”) and are exempt from the requirement to hold an AFSL under the Corporations Act (Cth) 2001 (“Corporations Act”) under Class Order 03/1099 published by the Australian Securities and Investments Commission (“ASIC”), in respect of the financial services provided to Australian wholesale clients (within the meaning of section 761G of the Corporations Act). This material is not for distribution to retail clients and is directed exclusively at Credit Suisse's professional clients and eligible counterparties as defined by the FCA, and wholesale clients as defined under section 761G of the Corporations Act. Credit Suisse (Hong Kong) Limited (“CSHK”) is licensed and regulated by the Securities and Futures Commission of Hong Kong under the laws of Hong Kong, which differ from Australian laws. CSHKL does not hold an AFSL and is exempt from the requirement to hold an AFSL under the Corporations Act under Class Order 03/1103 published by the ASIC in respect of financial services provided to Australian wholesale clients (within the meaning of section 761G of the Corporations Act). Credit Suisse Securities (USA) LLC (CSSU) and Credit Suisse Asset Management LLC (CSAM LLC) are licensed and regulated by the Securities Exchange Commission of the United States under the laws of the United States, which differ from Australian laws. CSSU and CSAM LLC do not hold an AFSL and is exempt from the requirement to hold an AFSL under the Corporations Act under Class Order 03/1100 published by the ASIC in respect of financial services provided to Australian wholesale clients (within the meaning of section 761G of the Corporations Act). Malaysia: Research provided to residents of Malaysia is authorised by the Head of Research for Credit Suisse Securities (Malaysia) Sdn Bhd, to whom they should direct any queries on +603 2723 2020. Singapore: This report has been prepared and issued for distribution in Singapore to institutional investors, accredited investors and expert investors (each as defined under the Financial Advisers Regulations) only, and is also distributed by Credit Suisse AG, Singapore Branch to overseas investors (as defined under the Financial Advisers Regulations). Credit Suisse AG, Singapore Branch may distribute reports produced by its foreign entities or affiliates pursuant to an arrangement under Regulation 32C of the Financial Advisers Regulations. Singapore recipients should contact Credit Suisse AG, Singapore Branch at +65-6212-2000 for matters arising from, or in connection with, this report. By virtue of your status as an institutional investor, accredited investor, expert investor or overseas investor, Credit Suisse AG, Singapore Branch is exempted from complying with certain compliance requirements under the Financial Advisers Act, Chapter 110 of Singapore (the “FAA”), the Financial Advisers Regulations and the relevant Notices and Guidelines issued thereunder, in respect of any financial advisory service which Credit Suisse AG, Singapore Branch may provide to you. UAE: This information is being distributed by Credit Suisse AG (DIFC Branch), duly licensed and regulated by the Dubai Financial Services Authority (“DFSA”). Related financial services or products are only made available to Professional Clients or Market Counterparties, as defined by the DFSA, and are not intended for any other persons. Credit Suisse AG (DIFC Branch) is located on Level 9 East, The Gate Building, DIFC, Dubai, United Arab Emirates. EU: This report has been produced by subsidiaries and affiliates of Credit Suisse operating under its Global Markets Division In jurisdictions where CS is not already registered or licensed to trade in securities, transactions will only be effected in accordance with applicable securities legislation, which will vary from jurisdiction to jurisdiction and may require that the trade be made in accordance with applicable exemptions from registration or licensing requirements. Non-US customers wishing to effect a transaction should contact a CS entity in their local jurisdiction unless governing law permits otherwise. US customers wishing to effect a transaction should do so only by contacting a representative at Credit Suisse Securities (USA) LLC in the US. Please note that this research was originally prepared and issued by CS for distribution to their market professional and institutional investor customers. Recipients who are not market professional or institutional investor customers of CS should seek the advice of their independent financial advisor prior to taking any investment decision based on this report or for any necessary explanation of its contents. This research may relate to investments or services of a person outside of the UK or to other matters which are not authorised by the Prudential Regulation Authority and regulated by the Financial Conduct Authority and the Prudential Regulation Authority or in respect of which the protections of the Prudential Regulation Authority and Financial Conduct Authority for private customers and/or the UK compensation scheme may not be available, and further details as to where this may be the case are available upon request in respect of this report. CS may provide various services to US municipal entities or obligated persons ("municipalities"), including suggesting individual transactions or trades and entering into such transactions. Any services CS provides to municipalities are not viewed as "advice" within the meaning of Section 975 of the Dodd-Frank Wall Street Reform and Consumer Protection Act. CS is providing any such services and related information solely on an arm's length basis and not as an advisor or fiduciary to the municipality. In connection with the provision of the any such services, there is no agreement, direct or indirect, between any municipality (including the officials,management, employees or agents thereof) and CS for CS to provide advice to the municipality. Municipalities should consult with their financial, accounting and legal advisors regarding any such services provided by CS. In addition, CS is not acting for direct or indirect compensation to solicit the municipality on behalf of an unaffiliated broker, dealer, municipal securities dealer, municipal advisor, or investment adviser for the purpose of obtaining or retaining an engagement by the municipality for or in connection with Municipal Financial Products, the issuance of municipal securities, or of an investment adviser to provide investment advisory services to or on behalf of the municipality. If this report is being distributed by a financial institution other than Credit Suisse AG, or its affiliates, that financial institution is solely responsible for distribution. Clients of that institution should contact that institution to effect a transaction in the securities mentioned in this report or require further information. This report does not constitute investment advice by Credit Suisse to the clients of the distributing financial institution, and neither Credit Suisse AG, its affiliates, and their respective officers, directors and employees accept any liability whatsoever for any direct or consequential loss arising from their use of this report or its content. Principal is not guaranteed. Commission is the commission rate or the amount agreed with a customer when setting up an account or at any time after that. Copyright © 2017 CREDIT SUISSE AG and/or its affiliates. All rights reserved.
Investment principal on bonds can be eroded depending on sale price or market price. In addition, there are bonds on which investment principal can be eroded due to changes in redemption amounts. Care is required when investing in such instruments. When you purchase non-listed Japanese fixed income securities (Japanese government bonds, Japanese municipal bonds, Japanese government guaranteed bonds, Japanese corporate bonds) from CS as a seller, you will be requested to pay the purchase price only.