ipe survey managers of emerging & frontier market equities · ipe survey . managers of emerging...
TRANSCRIPT
INVESTMENT&PENSIONS EUROPE NOVEMBER 2016 2016 NOVEMBER INVESTMENT&PENSIONS EUROPE
| Investing In Emerging Market Equities Investing In Emerging Market Equities |
IPE Survey Managers of Emerging & Frontier Market Equities
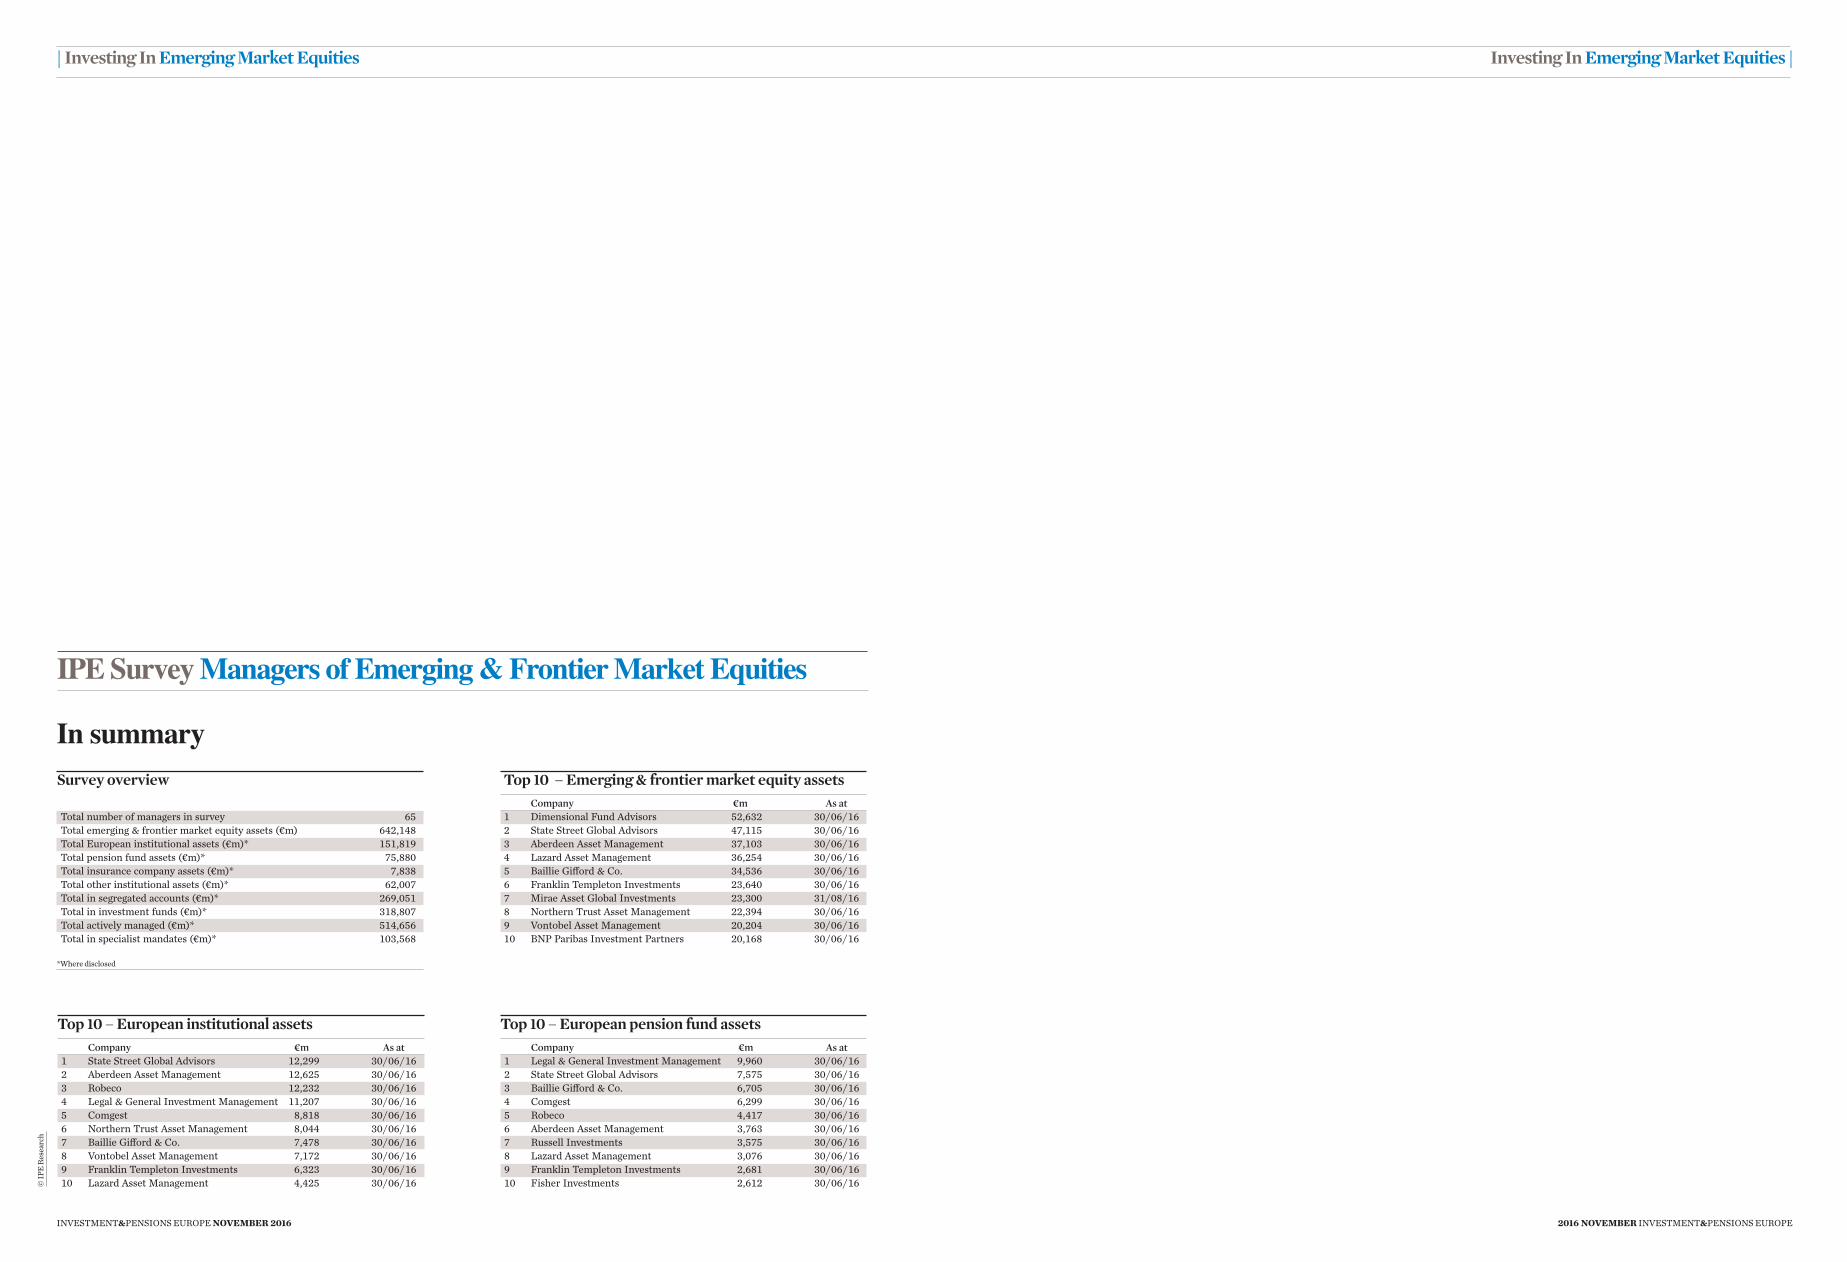
In summarySurvey overview
Total number of managers in survey 65Total emerging & frontier market equity assets (€m) 642,148Total European institutional assets (€m)* 151,819Total pension fund assets (€m)* 75,880Total insurance company assets (€m)* 7,838Total other institutional assets (€m)* 62,007Total in segregated accounts (€m)* 269,051Total in investment funds (€m)* 318,807Total actively managed (€m)* 514,656Total in specialist mandates (€m)* 103,568
*Where disclosed
Top 10 – European pension fund assets Company €m As at1 Legal & General Investment Management 9,960 30/06/162 State Street Global Advisors 7,575 30/06/163 Baillie Gifford & Co. 6,705 30/06/164 Comgest 6,299 30/06/165 Robeco 4,417 30/06/166 Aberdeen Asset Management 3,763 30/06/167 Russell Investments 3,575 30/06/168 Lazard Asset Management 3,076 30/06/169 Franklin Templeton Investments 2,681 30/06/1610 Fisher Investments 2,612 30/06/16
Top 10 – European institutional assets Company €m As at1 State Street Global Advisors 12,299 30/06/162 Aberdeen Asset Management 12,625 30/06/163 Robeco 12,232 30/06/164 Legal & General Investment Management 11,207 30/06/165 Comgest 8,818 30/06/166 Northern Trust Asset Management 8,044 30/06/167 Baillie Gifford & Co. 7,478 30/06/168 Vontobel Asset Management 7,172 30/06/169 Franklin Templeton Investments 6,323 30/06/1610 Lazard Asset Management 4,425 30/06/16
Top 10 – Emerging & frontier market equity assets Company €m As at1 Dimensional Fund Advisors 52,632 30/06/162 State Street Global Advisors 47,115 30/06/163 Aberdeen Asset Management 37,103 30/06/164 Lazard Asset Management 36,254 30/06/165 Baillie Gifford & Co. 34,536 30/06/166 Franklin Templeton Investments 23,640 30/06/167 Mirae Asset Global Investments 23,300 31/08/168 Northern Trust Asset Management 22,394 30/06/169 Vontobel Asset Management 20,204 30/06/1610 BNP Paribas Investment Partners 20,168 30/06/16
© IP
E Re
sear
ch
INVESTMENT&PENSIONS EUROPE NOVEMBER 2016 2016 NOVEMBER INVESTMENT&PENSIONS EUROPE
| Investing In Emerging Market Equities Investing In Emerging Market Equities |
IPE Survey Managers of Emerging & Frontier Market EquitiesCompany name
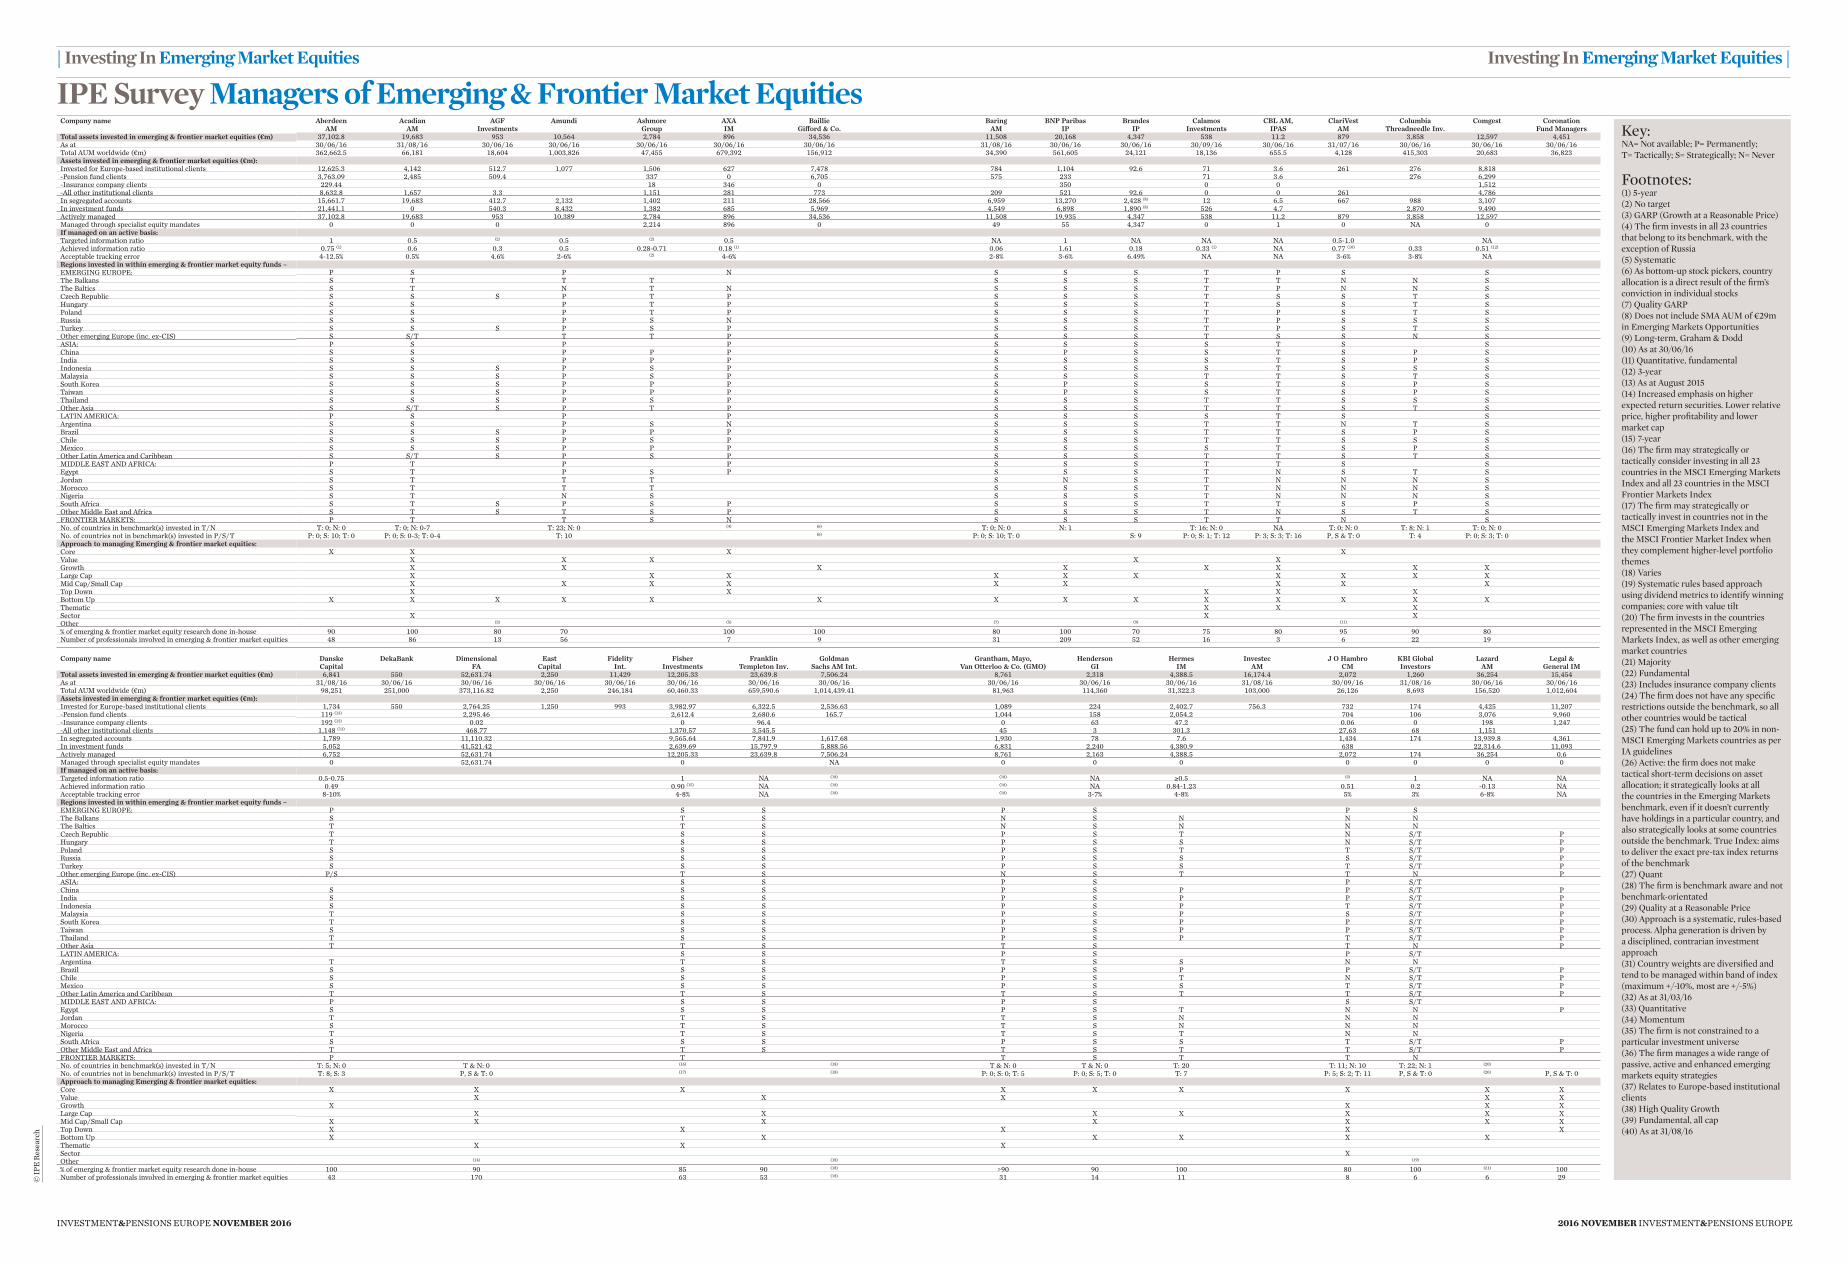
Total assets invested in emerging & frontier market equities (€m)As atTotal AUM worldwide (€m)Assets invested in emerging & frontier market equities (€m):Invested for Europe-based institutional clients-Pension fund clients-Insurance company clients-All other institutional clientsIn segregated accountsIn investment fundsActively managedManaged through specialist equity mandatesIf managed on an active basis:Targeted information ratioAchieved information ratioAcceptable tracking errorRegions invested in within emerging & frontier market equity funds –EMERGING EUROPE:The BalkansThe BalticsCzech RepublicHungaryPolandRussiaTurkeyOther emerging Europe (inc. ex-CIS)ASIA:ChinaIndiaIndonesiaMalaysiaSouth KoreaTaiwanThailandOther AsiaLATIN AMERICA:ArgentinaBrazilChileMexicoOther Latin America and CaribbeanMIDDLE EAST AND AFRICA:EgyptJordanMoroccoNigeriaSouth AfricaOther Middle East and AfricaFRONTIER MARKETS:No. of countries in benchmark(s) invested in T/NNo. of countries not in benchmark(s) invested in P/S/TApproach to managing Emerging & frontier market equities:CoreValueGrowthLarge CapMid Cap/Small CapTop DownBottom UpThematicSectorOther% of emerging & frontier market equity research done in-houseNumber of professionals involved in emerging & frontier market equities
Company name
Total assets invested in emerging & frontier market equities (€m)As atTotal AUM worldwide (€m)Assets invested in emerging & frontier market equities (€m):Invested for Europe-based institutional clients-Pension fund clients-Insurance company clients-All other institutional clientsIn segregated accountsIn investment fundsActively managedManaged through specialist equity mandatesIf managed on an active basis:Targeted information ratioAchieved information ratioAcceptable tracking errorRegions invested in within emerging & frontier market equity funds –EMERGING EUROPE:The BalkansThe BalticsCzech RepublicHungaryPolandRussiaTurkeyOther emerging Europe (inc. ex-CIS)ASIA:ChinaIndiaIndonesiaMalaysiaSouth KoreaTaiwanThailandOther AsiaLATIN AMERICA:ArgentinaBrazilChileMexicoOther Latin America and CaribbeanMIDDLE EAST AND AFRICA:EgyptJordanMoroccoNigeriaSouth AfricaOther Middle East and AfricaFRONTIER MARKETS:No. of countries in benchmark(s) invested in T/NNo. of countries not in benchmark(s) invested in P/S/TApproach to managing Emerging & frontier market equities:CoreValueGrowthLarge CapMid Cap/Small CapTop DownBottom UpThematicSectorOther% of emerging & frontier market equity research done in-houseNumber of professionals involved in emerging & frontier market equities©
IPE
Rese
arch
Key:NA= Not available; P= Permanently; T= Tactically; S= Strategically; N= Never
Footnotes:(1) 5-year(2) No target(3) GARP (Growth at a Reasonable Price)(4) The firm invests in all 23 countries that belong to its benchmark, with the exception of Russia(5) Systematic(6) As bottom-up stock pickers, country allocation is a direct result of the firm’s conviction in individual stocks(7) Quality GARP(8) Does not include SMA AUM of €29m in Emerging Markets Opportunities(9) Long-term, Graham & Dodd(10) As at 30/06/16(11) Quantitative, fundamental(12) 3-year(13) As at August 2015(14) Increased emphasis on higher expected return securities. Lower relative price, higher profitability and lower market cap(15) 7-year(16) The firm may strategically or tactically consider investing in all 23 countries in the MSCI Emerging Markets Index and all 23 countries in the MSCI Frontier Markets Index(17) The firm may strategically or tactically invest in countries not in the MSCI Emerging Markets Index and the MSCI Frontier Market Index when they complement higher-level portfolio themes(18) Varies(19) Systematic rules based approach using dividend metrics to identify winning companies; core with value tilt(20) The firm invests in the countries represented in the MSCI Emerging Markets Index, as well as other emerging market countries(21) Majority(22) Fundamental(23) Includes insurance company clients(24) The firm does not have any specific restrictions outside the benchmark, so all other countries would be tactical(25) The fund can hold up to 20% in non-MSCI Emerging Markets countries as per IA guidelines(26) Active: the firm does not make tactical short-term decisions on asset allocation; it strategically looks at all the countries in the Emerging Markets benchmark, even if it doesn’t currently have holdings in a particular country, and also strategically looks at some countries outside the benchmark. True Index: aims to deliver the exact pre-tax index returns of the benchmark(27) Quant(28) The firm is benchmark aware and not benchmark-orientated(29) Quality at a Reasonable Price(30) Approach is a systematic, rules-based process. Alpha generation is driven by a disciplined, contrarian investment approach(31) Country weights are diversified and tend to be managed within band of index (maximum +/-10%, most are +/-5%)(32) As at 31/03/16(33) Quantitative(34) Momentum(35) The firm is not constrained to a particular investment universe(36) The firm manages a wide range of passive, active and enhanced emerging markets equity strategies(37) Relates to Europe-based institutional clients(38) High Quality Growth(39) Fundamental, all cap(40) As at 31/08/16
Aberdeen Acadian AGF Amundi Ashmore AXA Baillie Baring BNP Paribas Brandes Calamos CBL AM, ClariVest Columbia Comgest Coronation AM AM Investments Group IM Gifford & Co. AM IP IP Investments IPAS AM Threadneedle Inv. Fund Managers 37,102.8 19,683 953 10,564 2,784 896 34,536 11,508 20,168 4,347 538 11.2 879 3,858 12,597 4,451 30/06/16 31/08/16 30/06/16 30/06/16 30/06/16 30/06/16 30/06/16 31/08/16 30/06/16 30/06/16 30/09/16 30/06/16 31/07/16 30/06/16 30/06/16 30/06/16 362,662.5 66,181 18,604 1,003,826 47,455 679,392 156,912 34,390 561,605 24,121 18,136 655.5 4,128 415,303 20,683 36,823 12,625.3 4,142 512.7 1,077 1,506 627 7,478 784 1,104 92.6 71 3.6 261 276 8,818 3,763.09 2,485 509.4 337 0 6,705 575 233 71 3.6 276 6,299 229.44 18 346 0 350 0 0 1,512 8,632.8 1,657 3.3 1,151 281 773 209 521 92.6 0 0 261 4,786 15,661.7 19,683 412.7 2,132 1,402 211 28,566 6,959 13,270 2,428 (8) 12 6.5 667 988 3,107 21,441.1 0 540.3 8,432 1,382 685 5,969 4,549 6,898 1,890 (8) 526 4.7 2,870 9,490 37,102.8 19,683 953 10,389 2,784 896 34,536 11,508 19,935 4,347 538 11.2 879 3,858 12,597 0 0 0 2,214 896 0 49 55 4,347 0 1 0 NA 0 1 0.5 (2) 0.5 (2) 0.5 NA 1 NA NA NA 0.5-1.0 NA 0.75 (1) 0.6 0.3 0.5 0.28-0.71 0.18 (1) 0.06 1.61 0.18 0.33 (1) NA 0.77 (10) 0.33 0.51 (12) 4-12.5% 0.5% 4.6% 2-6% (2) 4-6% 2-8% 3-6% 6.49% NA NA 3-6% 3-8% NA P S P N S S S T P S S S T T T S S S T T N N S S T N T N S S S T P N N S S S S P T P S S S T S S T S S S P T P S S S T S S T S S S P T P S S S T P S T S S S P S N S S S T P S S S S S S P S P S S S T P S T S S S/T T T P S S S T S S N S P S P P S S S S T S S S S P P P S P S S T S P S S S P P P S S S S T S P S S S S P S P S S S S T S S S S S S P S P S S S T T S T S S S S P P P S P S S T S P S S S S P P P S P S S T S P S S S S P S P S S S T T S S S S S/T S P T P S S S T T S T S P S P P S S S S T S S S S P S N S S S T T N T S S S S P P P S S S T T S P S S S S P S P S S S T T S S S S S S P P P S S S S T S P S S S/T S P S P S S S T T S T S P T P P S S S T T S S S T P S P S S S T N S T S S T T T S N S T N N N S S T T T S S S T N N N S S T N S S S S T N N N S S T S P S P S S S T T S P S S T S T S P S S S T N S T S P T T S N S S S T T N S T: 0; N: 0 T: 0; N: 0-7 T: 23; N: 0 (4) (6) T: 0; N: 0 N: 1 T: 16; N: 0 NA T: 0; N: 0 T: 8; N: 1 T: 0; N: 0 P: 0; S: 10; T: 0 P: 0; S: 0-3; T: 0-4 T: 10 (6) P: 0; S: 10; T: 0 S: 9 P: 0; S: 1; T: 12 P: 3; S: 3; T: 16 P, S & T: 0 T: 4 P: 0; S: 3; T: 0 X X X X X X X X X X X X X X X X X X X X X X X X X X X X X X X X X X X X X X X X X X X X X X X X X X X X X X X X X X X X X (3) (5) (7) (9) (11) 90 100 80 70 100 100 80 100 70 75 80 95 90 80 48 86 13 56 7 9 31 209 52 16 3 6 22 19
Danske DekaBank Dimensional East Fidelity Fisher Franklin Goldman Grantham, Mayo, Henderson Hermes Investec J O Hambro KBI Global Lazard Legal & Capital FA Capital Int. Investments Templeton Inv. Sachs AM Int. Van Otterloo & Co. (GMO) GI IM AM CM Investors AM General IM 6,841 550 52,631.74 2,250 11,429 12,205.33 23,639.8 7,506.24 8,761 2,318 4,388.5 16,174.4 2,072 1,260 36,254 15,454 31/08/16 30/06/16 30/06/16 30/06/16 30/06/16 30/06/16 30/06/16 30/06/16 30/06/16 30/06/16 30/06/16 31/08/16 30/09/16 31/08/16 30/06/16 30/06/16 98,251 251,000 373,116.82 2,250 246,184 60,460.33 659,590.6 1,014,439.41 81,963 114,360 31,322.3 103,000 26,126 8,693 156,520 1,012,604 1,734 550 2,764.25 1,250 993 3,982.97 6,322.5 2,536.63 1,089 224 2,402.7 756.3 732 174 4,425 11,207 119 (13) 2,295.46 2,612.4 2,680.6 165.7 1,044 158 2,054.2 704 106 3,076 9,960 192 (13) 0.02 0 96.4 0 63 47.2 0.06 0 198 1,247 1,148 (13) 468.77 1,370.57 3,545.5 45 3 301.3 27.63 68 1,151 1,789 11,110.32 9,565.64 7,841.9 1,617.68 1,930 78 7.6 1,434 174 13,939.8 4,361 5,052 41,521.42 2,639.69 15,797.9 5,888.56 6,831 2,240 4,380.9 638 22,314.6 11,093 6,752 52,631.74 12,205.33 23,639.8 7,506.24 8,761 2,163 4,388.5 2,072 174 36,254 0.6 0 52,631.74 0 NA 0 0 0 0 0 0 0 0.5-0.75 1 NA (18) (18) NA ≥0.5 (2) 1 NA NA 0.49 0.90 (15) NA (18) (18) NA 0.84-1.23 0.51 0.2 -0.13 NA 8-10% 4-8% NA (18) (18) 3-7% 4-8% 5% 3% 6-8% NA P S S P S P S S T S N S N N N T T S N S N N N T S S P S T N S/T P T S S P S S N S/T P S S S P S T T S/T P S S S P S S S S/T P S S S P S S T S/T P P/S T S N S T T N P S S P S P S/T S S S P S P P S/T P S S S P S P P S/T P S S S P S P T S/T P T S S P S P S S/T P T S S P S P P S/T P S S S P S P P S/T P T S S P S P T S/T P T T S T S T N P S S P S P S/T T T S T S S N N S S S P S P P S/T P S S S P S T N S/T P S S S P S S T S/T P T T S T S T T S/T P P S S P S S S/T S S S P S T N N P T T S T S N N N S T S T S N N N T T S T S T N N S S S P S S T S/T P T T S T S T T S/T P P T T S T T N T: 5; N: 0 T & N: 0 (16) (18) T & N: 0 T & N: 0 T: 20 T: 11; N: 10 T: 22; N: 1 (20) T: 8; S: 3 P, S & T: 0 (17) (18) P: 0; S: 0; T: 5 P: 0; S: 5; T: 0 T: 7 P: 5; S: 2; T: 11 P, S & T: 0 (20) P, S & T: 0 X X X X X X X X X X X X X X X X X X X X X X X X X X X X X X X X X X X X X X X X X X X X X X X (14) (18) (19) 100 90 85 90 (18) >90 90 100 80 100 (21) 100 43 170 63 53 (18) 31 14 11 8 6 6 29
INVESTMENT&PENSIONS EUROPE NOVEMBER 2016 2016 NOVEMBER INVESTMENT&PENSIONS EUROPE
| Investing In Emerging Market Equities Investing In Emerging Market Equities |
IPE Survey Managers of Emerging & Frontier Market EquitiesCompany name
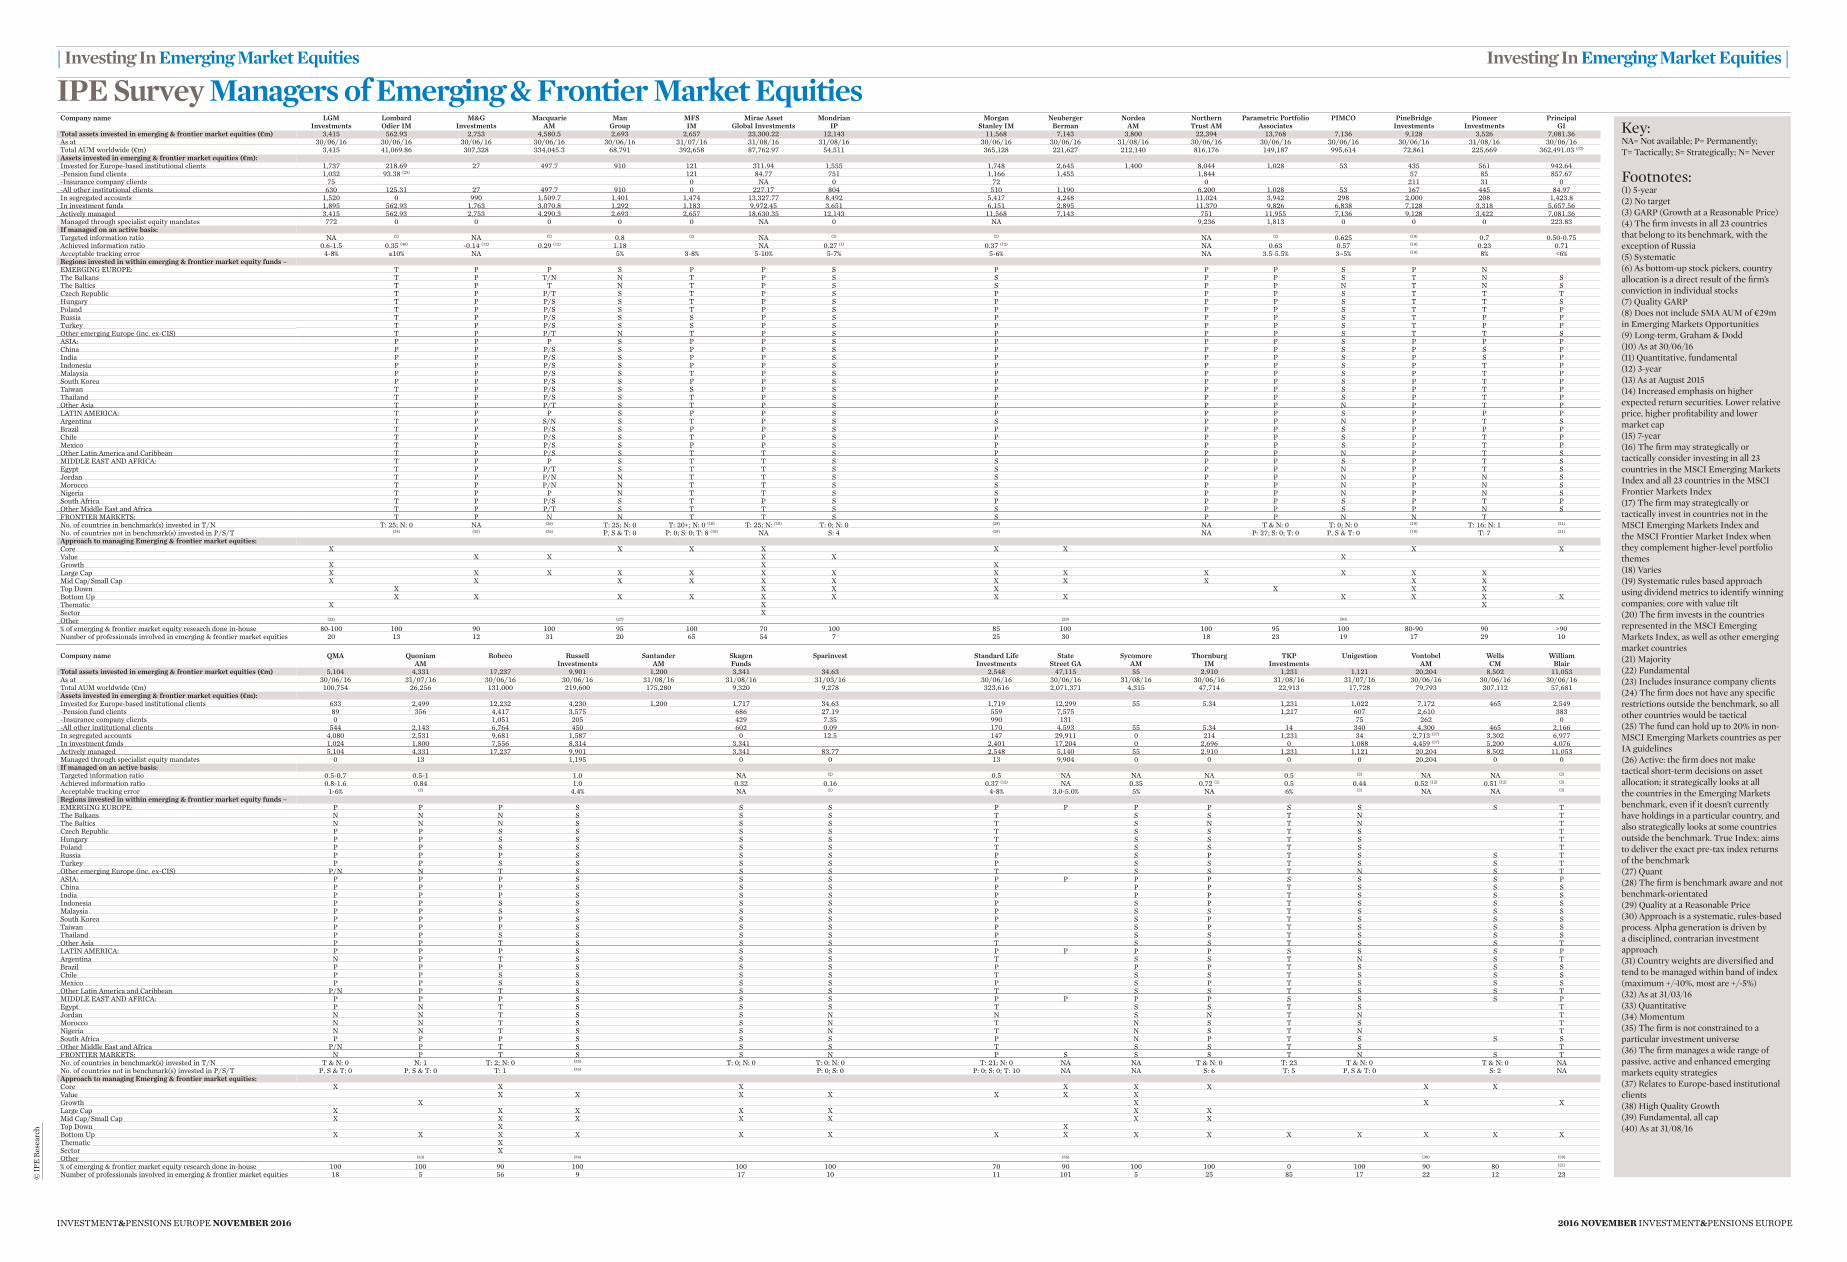
Total assets invested in emerging & frontier market equities (€m)As atTotal AUM worldwide (€m)Assets invested in emerging & frontier market equities (€m):Invested for Europe-based institutional clients-Pension fund clients-Insurance company clients-All other institutional clientsIn segregated accountsIn investment fundsActively managedManaged through specialist equity mandatesIf managed on an active basis:Targeted information ratioAchieved information ratioAcceptable tracking errorRegions invested in within emerging & frontier market equity funds –EMERGING EUROPE:The BalkansThe BalticsCzech RepublicHungaryPolandRussiaTurkeyOther emerging Europe (inc. ex-CIS)ASIA:ChinaIndiaIndonesiaMalaysiaSouth KoreaTaiwanThailandOther AsiaLATIN AMERICA:ArgentinaBrazilChileMexicoOther Latin America and CaribbeanMIDDLE EAST AND AFRICA:EgyptJordanMoroccoNigeriaSouth AfricaOther Middle East and AfricaFRONTIER MARKETS:No. of countries in benchmark(s) invested in T/NNo. of countries not in benchmark(s) invested in P/S/TApproach to managing Emerging & frontier market equities:CoreValueGrowthLarge CapMid Cap/Small CapTop DownBottom UpThematicSectorOther% of emerging & frontier market equity research done in-houseNumber of professionals involved in emerging & frontier market equities
Company name
Total assets invested in emerging & frontier market equities (€m)As atTotal AUM worldwide (€m)Assets invested in emerging & frontier market equities (€m):Invested for Europe-based institutional clients-Pension fund clients-Insurance company clients-All other institutional clientsIn segregated accountsIn investment fundsActively managedManaged through specialist equity mandatesIf managed on an active basis:Targeted information ratioAchieved information ratioAcceptable tracking errorRegions invested in within emerging & frontier market equity funds –EMERGING EUROPE:The BalkansThe BalticsCzech RepublicHungaryPolandRussiaTurkeyOther emerging Europe (inc. ex-CIS)ASIA:ChinaIndiaIndonesiaMalaysiaSouth KoreaTaiwanThailandOther AsiaLATIN AMERICA:ArgentinaBrazilChileMexicoOther Latin America and CaribbeanMIDDLE EAST AND AFRICA:EgyptJordanMoroccoNigeriaSouth AfricaOther Middle East and AfricaFRONTIER MARKETS:No. of countries in benchmark(s) invested in T/NNo. of countries not in benchmark(s) invested in P/S/TApproach to managing Emerging & frontier market equities:CoreValueGrowthLarge CapMid Cap/Small CapTop DownBottom UpThematicSectorOther% of emerging & frontier market equity research done in-houseNumber of professionals involved in emerging & frontier market equities©
IPE
Rese
arch
Key:NA= Not available; P= Permanently; T= Tactically; S= Strategically; N= Never
Footnotes:(1) 5-year(2) No target(3) GARP (Growth at a Reasonable Price)(4) The firm invests in all 23 countries that belong to its benchmark, with the exception of Russia(5) Systematic(6) As bottom-up stock pickers, country allocation is a direct result of the firm’s conviction in individual stocks(7) Quality GARP(8) Does not include SMA AUM of €29m in Emerging Markets Opportunities(9) Long-term, Graham & Dodd(10) As at 30/06/16(11) Quantitative, fundamental(12) 3-year(13) As at August 2015(14) Increased emphasis on higher expected return securities. Lower relative price, higher profitability and lower market cap(15) 7-year(16) The firm may strategically or tactically consider investing in all 23 countries in the MSCI Emerging Markets Index and all 23 countries in the MSCI Frontier Markets Index(17) The firm may strategically or tactically invest in countries not in the MSCI Emerging Markets Index and the MSCI Frontier Market Index when they complement higher-level portfolio themes(18) Varies(19) Systematic rules based approach using dividend metrics to identify winning companies; core with value tilt(20) The firm invests in the countries represented in the MSCI Emerging Markets Index, as well as other emerging market countries(21) Majority(22) Fundamental(23) Includes insurance company clients(24) The firm does not have any specific restrictions outside the benchmark, so all other countries would be tactical(25) The fund can hold up to 20% in non-MSCI Emerging Markets countries as per IA guidelines(26) Active: the firm does not make tactical short-term decisions on asset allocation; it strategically looks at all the countries in the Emerging Markets benchmark, even if it doesn’t currently have holdings in a particular country, and also strategically looks at some countries outside the benchmark. True Index: aims to deliver the exact pre-tax index returns of the benchmark(27) Quant(28) The firm is benchmark aware and not benchmark-orientated(29) Quality at a Reasonable Price(30) Approach is a systematic, rules-based process. Alpha generation is driven by a disciplined, contrarian investment approach(31) Country weights are diversified and tend to be managed within band of index (maximum +/-10%, most are +/-5%)(32) As at 31/03/16(33) Quantitative(34) Momentum(35) The firm is not constrained to a particular investment universe(36) The firm manages a wide range of passive, active and enhanced emerging markets equity strategies(37) Relates to Europe-based institutional clients(38) High Quality Growth(39) Fundamental, all cap(40) As at 31/08/16
LGM Lombard M&G Macquarie Man MFS Mirae Asset Mondrian Morgan Neuberger Nordea Northern Parametric Portfolio PIMCO PineBridge Pioneer Principal Investments Odier IM Investments AM Group IM Global Investments IP Stanley IM Berman AM Trust AM Associates Investments Investments GI 3,415 562.93 2,753 4,580.5 2,693 2,657 23,300.22 12,143 11,568 7,143 3,800 22,394 13,768 7,136 9,128 3,526 7,081.36 30/06/16 30/06/16 30/06/16 30/06/16 30/06/16 31/07/16 31/08/16 31/08/16 30/06/16 30/06/16 31/08/16 30/06/16 30/06/16 30/06/16 30/06/16 31/08/16 30/06/16 3,415 41,069.86 307,328 334,045.3 68,791 392,658 87,762.97 54,511 365,128 221,627 212,140 816,176 149,187 995,614 72,861 225,669 362,491.03 (32)
1,737 218.69 27 497.7 910 121 311.94 1,555 1,748 2,645 1,400 8,044 1,028 53 435 561 942.64 1,032 93.38 (23) 121 84.77 751 1,166 1,455 1,844 57 85 857.67 75 0 NA 0 72 0 211 31 0 630 125.31 27 497.7 910 0 227.17 804 510 1,190 6,200 1,028 53 167 445 84.97 1,520 0 990 1,509.7 1,401 1,474 13,327.77 8,492 5,417 4,248 11,024 3,942 298 2,000 208 1,423.8 1,895 562.93 1,763 3,070.8 1,292 1,183 9,972.45 3,651 6,151 2,895 11,370 9,826 6,838 7,128 3,318 5,657.56 3,415 562.93 2,753 4,290.3 2,693 2,657 18,630.35 12,143 11,568 7,143 751 11,955 7,136 9,128 3,422 7,081.36 772 0 0 0 0 0 NA 0 NA 9,236 1,813 0 0 0 223.83 NA (2) NA (2) 0.8 (2) NA (2) (2) NA (2) 0.625 (18) 0.7 0.50-0.75 0.6-1.5 0.35 (40) -0.14 (12) 0.29 (12) 1.18 NA 0.27 (1) 0.37 (12) NA 0.63 0.57 (18) 0.23 0.71 4-8% ≤10% NA 5% 3-8% 5-10% 5-7% 5-6% NA 3.5-5.5% 3–5% (18) 8% <6% T P P S P P S P P P S P N T P T/N N T P S S P P S T N S T P T N T P S S P P N T N S T P P/T S T P S P P P S T T T T P P/S S T P S P P P S T T S T P P/S S T P S P P P S T T P T P P/S S S P S P P P S T P P T P P/S S S P S P P P S T P P T P P/T N T P S P P P S T T S P P P S P P S P P P S P P P P P P/S S P P S P P P S P S P P P P/S S P P S P P P S P S P P P P/S S P P S P P P S P T P P P P/S S T P S P P P S P T P P P P/S S P P S P P P S P T P T P P/S S S P S P P P S P T P T P P/S S T P S P P P S P T P T P P/T S T P S P P P N P T P T P P S P P S P P P S P P P T P S/N S T P S S P P N P T S T P P/S S P P S P P P S P P P T P P/S S T P S P P P S P T P T P P/S S P P S P P P S P T P T P P/S S T T S P P P N P T S T P P S T T S S P P S P T S T P P/T S T T S S P P N P T S T P P/N N T T S S P P N P N S T P P/N N T T S S P P N P N S T P P N T T S S P P N P N S T P P/S S T P S P P P S P T P T P P/T S T T S S P P S P N S T P N N T T S S P P N N T T: 25; N: 0 NA (26) T: 25; N: 0 T: 20+; N: 0 (10) T: 25; N: (18) T: 0; N: 0 (28) NA T & N: 0 T: 0; N: 0 (18) T: 16; N: 1 (31)
(24) (25) (26) P, S & T: 0 P: 0; S: 0; T: 8 (10) NA S: 4 (28) NA P: 27; S: 0; T: 0 P, S & T: 0 (18) T: 7 (31)
X X X X X X X X X X X X X X X X X X X X X X X X X X X X X X X X X X X X X X X X X X X X X X X X X X X X X X X X X X X X X X X (22) (27) (29) (30) 80-100 100 90 100 95 100 70 100 85 100 100 95 100 80-90 90 >90 20 13 12 31 20 65 54 7 25 30 18 23 19 17 29 10
QMA Quoniam Robeco Russell Santander Skagen Sparinvest Standard Life State Sycomore Thornburg TKP Unigestion Vontobel Wells William AM Investments AM Funds Investments Street GA AM IM Investments AM CM Blair 5,104 4,331 17,237 9,901 1,200 3,341 34.63 2,548 47,115 55 2,910 1,231 1,121 20,204 8,502 11,053 30/06/16 31/07/16 30/06/16 30/06/16 31/08/16 31/08/16 31/03/16 30/06/16 30/06/16 31/08/16 30/06/16 31/08/16 31/07/16 30/06/16 30/06/16 30/06/16 100,754 26,256 131,000 219,600 175,280 9,320 9,278 323,616 2,071,371 4,315 47,714 22,913 17,728 79,793 307,112 57,681 633 2,499 12,232 4,230 1,200 1,717 34.63 1,719 12,299 55 5.34 1,231 1,022 7,172 465 2,549 89 356 4,417 3,575 686 27.19 559 7,575 1,217 607 2,610 383 0 1,051 205 429 7.35 990 131 75 262 0 544 2,143 6,764 450 602 0.09 170 4,593 55 5.34 14 340 4,300 465 2,166 4,080 2,531 9,681 1,587 0 12.5 147 29,911 0 214 1,231 34 2,713 (37) 3,302 6,977 1,024 1,800 7,556 8,314 3,341 2,401 17,204 0 2,696 0 1,088 4,459 (37) 5,200 4,076 5,104 4,331 17,237 9,901 3,341 83.77 2,548 5,140 55 2,910 1,231 1,121 20,204 8,502 11,053 0 13 1,195 0 0 13 9,904 0 0 0 0 20,204 0 0 0.5-0.7 0.5-1 1.0 NA (2) 0.5 NA NA NA 0.5 (2) NA NA (2)
0.8-1.6 0.84 1.0 0.32 0.16 0.37 (12) NA 0.35 0.72 (1) 0.5 0.44 0.52 (12) 0.51 (12) (2)
1-6% (2) 4.4% NA (2) 4-8% 3.0-5.0% 5% NA 6% (2) NA NA (2)
P P P S S S P P P P S S S T N N N S S S T S S T N T N N N S S S T S N T N T P P S S S S T S S T S T P P S S S S T S S T S T P P S S S S T S S T S T P P P S S S P S P T S S T P P S S S S P S S T S S T P/N N T S S S T S S T N S T P P P S S S P P P P S S S P P P P S S S P P P T S S S P P P S S S P P P T S S S P P S S S S P S P T S S S P P S S S S P S S T S S S P P P S S S P S P T S S S P P P S S S P S P T S S S P P S S S S P S S T S S S P P T S S S T S S T S S T P P P S S S P P P P S S S P N P T S S S T S S T N S T P P P S S S P P P T S S S P P S S S S T S S T S S S P P S S S S P S P T S S S P/N P T S S S T S S T S S T P P P S S S P P P P S S S P P N T S S S T S S T S T N N T S S N N S N T N T N N T S S N T N S T S T N N T S S N T N S T N T P P P S S S P N P T S S S P/N P T S S S T S S T S T N P T S S N P S S S T N S T T & N: 0 N: 1 T: 2; N: 0 (35) T: 0; N: 0 T: 0; N: 0 T: 21; N: 0 NA NA T & N: 0 T: 23 T & N: 0 T & N: 0 NA P, S & T: 0 P, S & T: 0 T: 1 (35) P: 0; S: 0 P: 0; S: 0; T: 10 NA NA S: 6 T: 5 P, S & T: 0 S: 2 NA X X X X X X X X X X X X X X X X X X X X X X X X X X X X X X X X X X X X X X X X X X X X X X X X X X X X (33) (34) (36) (38) (39)
100 100 90 100 100 100 70 90 100 100 0 100 90 80 (21)
18 5 56 9 17 10 11 101 5 25 85 17 22 12 23